Article

Architectural Cultural Heritage Conservation: Fire Risk Assessment of Ancient Vernacular Residences Based on FAHP and EWM

1
School of Management, Guangzhou University, Guangzhou 511370, China
2
Department of Civil, Environmental and Architectural Engineering, University of Padua, 35122 Padua, Italy
3
School of Civil Engineering, Guangzhou University, Guangzhou 511370, China
*
Author to whom correspondence should be addressed.
Appl. Sci. 2023, 13(22), 12368; https://doi.org/10.3390/app132212368
Submission received: 4 October 2023 / Revised: 7 November 2023 / Accepted: 9 November 2023 / Published: 15 November 2023
(This article belongs to the Section Civil Engineering)

Abstract

:
The architectural relics of ancient vernacular residences and villages with brick–timber structures are at great risk of fire; if one occurs, they cannot be recovered. To protect this cultural heritage, this study takes a southern Guangdong He Xinwu building complex as a case study. It focuses on four indicator systems: human factors, facility factors, environmental factors, and social management factors, and 20 sub-indicators to establish an assessment system for fire risk in vernacular residences. Combining triangular fuzzy hierarchical analysis and the entropy weight method to determine weight values reduces evaluation subjectivity, allowing for both qualitative and quantitative measurements to derive the safety level and determine key fire risk factors. The results showed that human misconduct and social management of fire had the greatest impact on fire risk (29% and 25.8%, respectively). The most important secondary indicators were the ability to fight fires early on, the fire resistance level of building materials, fire rescue capability, fire load, and electricity use by villagers. Moreover, comparing differences in protection between ancient houses and high-rise buildings provided targeted policy recommendations that offer a new perspective for protecting architectural heritage from fires.

1. Introduction

The traditional culture of ancient vernacular residences and towns is an important material cultural heritage, forming a vital part of human historical and cultural resources [1,2]. As an ancient civilization that has existed for over 5000 years, China boasts an array of architectural and historical relics and sites [3]. However, these vernacular residences are at great risk of fire due to the advanced age of construction, flammable materials used in their construction, the distance from city centers, and the lack of modern firefighting technology [4]. Fire is one of the most common and destructive disasters in the world [5]; Therefore, risk analysis, assessment, and conservation plans for ancient Chinese buildings are essential for cultural preservation.
Once a fire occurs in a heritage building, the damage to its cultural heritage value is irreversible. In 2020, China suffered 1958 casualties and CNY 4.009 billion in property losses due to fire, with rural areas accounting for 49.3% of such fires and 84.7% of fatalities, which exceeded the total number of deaths in other places [6]. According to statistics from 2009 to 2019 [7], there were 392 fires in ancient cultural buildings and thousands of fires in traditional settlements of different sizes throughout China. Studies indicate that residential fires typically account for approximately 75% of fire deaths and injuries in the United States [8]. Along the ancient routes of southern Guangdong province are numerous vernacular residences and towns characterized by their unique local culture. These buildings are typically constructed using wood structures, bricks, or other combustible materials, classified as Class A based on their source [9]. Additionally, their age, unfavorable traffic conditions near the premises, including narrow roads that make evacuation difficult, and the lack of local inhabitants’ firefighting knowledge all contribute to putting heritage buildings at high risk of fires. With China’s “Rural Revitalization Strategic Plan 2018–2022” and the development of cultural tourism in southern Guangdong combining forces, it is imperative that we conduct fire risk assessment on these ancient residential buildings immediately in order to protect their cultural heritage integrity.
Most fire risk assessments currently focus on high-rise buildings, underground structures, schools, and shopping centers due to their high population density, combustible materials, potential for rapid spread of fire, difficulty in evacuation, and the difficulty of quickly extinguishing fires with current technology [10]. Few studies have considered fire risks in traditional ancient vernacular residences and villages. Yuan et al. [11] provided practical information for the development of a fire prevention system approach and performance-based design for heritage villages by investigating brick walls, wooden columns, and fire management to measure the relative fire risk in the Dangjia village in China. Zhang et al. [12] proposed a CFD-based framework to assess the fire risk of wood-frame villages in western Hunan by investigating various factors [7]. However, accurately understanding the severity of fires in any given area or at any given time requires more than just a single indicator assessment, as these vary significantly based on variables such as human factors and environmental conditions [13,14]. Currently, there are limited unified assessment systems that consider single-factor layers such as building characteristics, fire hazard sources, firefighting facilities, or firefighting management without considering relevant human or environmental factors holistically [15]. Studies have shown that 11% of fires are caused by human error, highlighting the need to include human factors in the assessment of fire risk [16].
The purpose of this research is to select the Hexinwu Building Complex, a representative ancient vernacular residence with a large number of unique local cultural characteristics preserved along the ancient road in southern Guangdong province, as a research object and develop a targeted assessment model to analyze fire risk. To do this, two methods are employed: Triangular Fuzzy Hierarchical Analysis (FAHP) and the Entropy Weight Method (EWM). Through these, necessary measures for fire risk management can be identified in order to improve the fire safety level of heritage buildings and reduce the level of fire risk and associated damage.
The rest of this study is structured as follows: Section 2 provides a review of the literature relating to the analysis and evaluation of building fires; Section 3 outlines the FAHP and EWM in brief; Section 4 examines case studies and discussion related thereto; and Section 5 identifies conclusions, limitations of the proposed model, and potential avenues for further research.

2. Review

Fire has played a significant role in the growth and evolution of human civilization and society. Unfortunately, it also has caused incalculable damage. Research into fire risk management and assessment methods has drawn extensive attention from scholars around the world. Consequently, this section reviews the literature related to fire assessment management and fire risk assessment methods.

2.1. Fire Assessment Management

Fire is closely related to human life and habitation; therefore, countries have enacted laws and regulations to manage fires. In the United States, the Federal Fire Prevention and Control Act was passed in 1974 to strengthen fire management and require building operators or managers to conduct and document fire risk assessments for the premises and processes under their responsibility [17]. Moreover, the National Research Council of Canada (NRC) has developed a computerized fire risk cost assessment model for evaluating the expected risk to occupants’ lives and the expected cost of fire prevention and damage to buildings [18]. The Chinese government’s fire code is highly detailed in specifying the fire rating of various types of buildings, building loads, and first aid programs in case of a fire [19]. Furthermore, with increased government investment in the field of firefighting, improved fire regulations, and greater public safety awareness, China has seen a decrease in mega-fire accidents in the past 20 years [20].
Crippa et al. [21] demonstrated the advantages of employing a fire risk assessment methodology. Su et al. [22] evaluated the fire risk of a six-story light-frame apartment building, examining the influence of various wall barriers on fire growth. Li et al. [23] created a hybrid judgment system by taking into consideration asymmetrical proximity to solve the complication of single index and obscure boundary for evaluating electrical fire risk in buildings. Applying BIM, Wang et al. [24] quantified the degree of fire risk during structure operation and maintenance and assessed the value accurately to improve fire risk prevention and control effectively. Based on a literature summary, Salazar et al. [13] proposed 22 indicators of fire imperfection associated with heritage elements that could lead to escalating or subduing implicit fire losses, which can be utilized to analyze specifically constructed cultural heritage elements for fire danger. Li et al. [25] suggested passive and active fire prevention factors to reduce the uncertainty of the influence of fire in high-rise buildings under construction by developing a high-rise building fire risk assessment model. Durak et al. [26] highlighted the pivotal significance of integrating passive and active strategies for preserving built heritage sites. It is worth noting that fires do not only occur in historic buildings but also in other structures, such as steel and concrete structures. Kodur et al. [27] considered the high-temperature properties of specified steels to assess the fire risk of steel structures and used the results as an important aspect to guide the fire safety design of steel structures. Bastami and Aslani [28] investigated the behavior of concrete structures subjected to extreme thermo–mechanical loads by developing constitutive models and relationships for preloaded normal and high-strength concrete subjected to reheat to provide a reference for the fire safety of concrete structures.

2.2. Fire Risk Assessment Methods

Conducting fire risk assessment is a crucial part of building risk management, leading to the protection of life, environment, and property. When selecting an assessment method, precision should be the main concern. Both qualitative and quantitative methods are available. The AHP (Analytic Hierarchy Process) technique is commonly used in combination with both. Saaty [29] proposed the systemic analysis and hierarchical approach for this purpose. In terms of finding solutions, Ren [30] created a model for evaluating fire risk in logistics warehouses whereby warehouse buildings, goods, management, and the environment were incorporated as standard layers analyzed by AHP. On the other hand, Lee et al. [31] assimilated AHP along with big data examination to gauge the intensity of building fires in 17 villages located in the Taishan District, Taiwan. Similarly, Zou et al. [32] applied a structural entropy weighing procedure along with a quantitative safety checklist to propose a quantitative evaluation method to measure mall fire risk, thereby decreasing subjective assessment dramatically. Liu et al. [33] developed a substantial commercial fire analysis system based on an entropy value strategy concerning characteristics related to fires and maintenance of firefighting equipment in large commercial buildings in the local region, while Guan et al. [34] developed the ZigBee framework, which integrated fire characteristics as well as fire safety management parameters to create assessment criteria for heritage buildings concerning structural fire risk, respectively.
Tancogne–Dejean and Laclémence [35] applied the qualitative research method to examine individual attitudes and behaviors when assessing the susceptibility related to potential fire risks. Akashah et al. [36], for their part, used an agent-based model during the automatic event tree analysis process, consequently quantifying fire risk more accurately compared to traditional models. With a focus on the quake response resistance of particular non-fire resistant steel frames, especially non-fireproof steel frames for different heights, Risco et al. [37] applied nonlinear thermoplastic dynamics numerically to simulate and evaluate exceptionally relevant post-quake associated effects, respectively. On the contrary, Gulum et al. [38] researched and accomplished assignment weight determination prospects related to a wide array of common problem criteria, while practical data project implementation involved interval value neuromorphic hierarchical analysis procedures targeting residential use throughout Istanbul, Turkey considering logical implementation results subsequently tested through sensitivity analysis aimed to verify further robustness or effectiveness regarding various proposed methods. Ding et al. [39] established intelligent back propagation neural network-based likelihood analyses associated with rising outbreaks. Consequently, Wang et al.’s [40] application incorporated the theoretical consideration of the integration of smart bodies in the evacuation of underground constructions; therefore, the emergency decision-making process also attempts to find opportune solutions. In contrast to traditional policies, which were evaluated using a hierarchical and imprecise approach relying on subjective reasoning algorithms and discrete scenario-based assessments, Mi et al. [41] put forth a novel methodology that emphasizes the importance of accessible information collection, observations, and document reviews. This approach is based on classical incident trees and employs an inductive measure, as demonstrated by Roshan [42], to evaluate the utility and effectiveness of proposed policies. Case studies were also utilized to provide practical examples and empirical evidence to support the proposed methodology. The use of fuzzy mathematics established hieratical implementations in addition to serving quantum evaluation purposes hypothesized by Sun and Xiao [43]. Overall, the potential of fuzzy mathematics in quantitative assessment represents a promising avenue for future research and development in the field.
Building fire risk assessments currently employ a variety of methods such as the AHP, EWM, event tree, comprehensive evaluation method, fuzzy TOPSIS, and FAHP. Numerical simulation evaluations and machine learning techniques based on BP neural networks are being employed, as well. These methods rely on the ability to obtain a substantial amount of real-world building information. Traditional architectural heritage houses may have a long history but often lack complete data for assessment purposes; furthermore, many evaluation indicators and parameters associated with fire hazards can be highly uncertain or vague. The key to resolving this predicament lies in objectively determining indicator weights.
In summary, (1) most of the fire risk assessments in the field of architecture focus on above-ground structures such as urban high-rise residential buildings, residential houses, commercial complexes, and underground constructions. There is limited research on fire risk assessment specifically for ancient village buildings. (2) Existing fire assessment methods have limitations in the field of ancient village architecture. Most commonly used assessment methods are highly subjective and lack objectivity and scientificity. This leads to the reliability of the assessment results being questioned and makes it difficult to provide effective guidance to decision-makers. (3) Due to the unique historical and cultural value of ancient village buildings, there are many uncertainties and insufficient comprehensive considerations in the assessment of fires. In this study, FAHP proposed by Saaty [29], he is chosen as a reliable method for handling imprecise and uncertain data, aiming to reduce subjectivity. Additionally, seven experts were invited to score each indicator, the EWM was introduced to calculate the indicator weights, the two methods were compared to get the weights of each indicator, and the weights were calculated comprehensively to reduce the errors and improve the objectivity of the results. Therefore, this study aims to analyze the factors influencing fire incidents in ancient village buildings, establish an evaluation index system for fire risk assessment in ancient village buildings, employ FAHP and EWM in combination for assessment, and explore the key factors influencing fire incidents in ancient villages.

3. Methodology

3.1. Fuzzy Hierarchy Analysis

In Multiple Criteria Decision-Making (MCDM), FAHP can reconcile the fuzziness and uncertainty of a problem well and, therefore, is a practical and popular method with a wide range of application [44]. Specifically, the incorporation of fuzzy mathematics into quantum evaluation allows for a more nuanced and flexible approach to measurement and analysis. By leveraging hierarchical structures, researchers can more effectively capture the complex relationships and interactions between quantum variables, leading to more accurate and comprehensive evaluations. Van Laarhoven and Pedrycz [45] extended Saaty’s [46] AHP method directly with the use of a triangular fuzzy number (TFN), which compared fuzzy ratios described by triangular membership functions. Numerous scholars have since exploited this method in their studies [47,48,49,50]. However, Chang [51,52] proposed a pairwise comparison scale using the TFN to conduct pairwise comparisons with integrated range values, which can make the transformation of fuzzy and uncertain problems clearer and measurable. Moreover, Chang’s method of FAHP stands out for its simple steps and calculations compared to others. Therefore, this study employs Chang’s approach to compute the weights of obtained indicators and perform pairwise comparisons. The outline for FAHP is described in the following.
Let   X = { x 1 , x 2 , x 3 , , x n } be an object set, and U = { u 1 , u 2 , u 3 , , u m } is a goal set. According to Chang’s extent analysis, each object is taken, and extent analysis for each goal, gi is performed, respectively. Therefore, m extent analysis values for each object can be obtained with the following equations:
M g i 1 , M g i 2 , , M g i m , i = 1,2 , , n
where all the M g i j (j = 1, 2, …, m) are TFNs whose parameters are l, m, and u. They are the lowest possible value, the highest possible value, and the largest possible value, respectively. The triplet (l, m, u) can represent a TFN. A triplet array can represent a fuzzy set. The value of the fuzzy synthesis range of the ith object is defined as follows:
S i = j = 1 m   M g i j i = 1 n   j = 1 m   M g i j 1
and:
j = 1 m M i j = j = 1 m l i j , j = 1 m m i j , j = 1 m u i j , i = 1 , 2 , , n
i = 1 n j = 1 m M i j = i = 1 n j = 1 m l i j , i = 1 n j = 1 m m i j , i = 1 n j = 1 m u i j
i = 1 N j = 1 m M i j 1 = 1 i = 1 n j = 1 m u i j , 1 i = 1 n j = 1 m m i j , 1 i = 1 n j = 1 m l i j
a.
Fuzzy Arithmetic: Each triangular fuzzy value is evaluated by experts based on Table 1. The evaluation results of multiple experts can be averaged as a triangular fuzzy number by applying operations of triangular fuzzy numbers. The algorithm of two TFNs A l 1 , m 1 , u 1 and B l 2 , m 2 , u 2 is as follows.
A 1 B 2 = l 1 + l 2 , m 1 + m 2 , u 1 + u 2    
A 1 B 2 l 1 l 2 , m 1 m 2 , u 1 u 2 , for l i > 0 , m i > 0 , u i > 0 , i = 1,2
A 1 / B 2 = l 1 u 2 , m 1 m 2 , u 1 l 2 , for l i > 0 , m i > 0 , u i > 0 , i = 1 , 2
A 1 1 1 u 1 , 1 m 1 , 1 l 1 , for l 1 > 0 , m 1 > 0 , u 1 > 0
b.
Compare the values of fuzzy synthesis range Si
It is first necessary to calculate the degree of probability that S j = l j , m j , u j S i = l i , m i , u i . As follows:
M S j S i = height S i S j = 1 if   m j m i 0 if   l i u j l i u j m j u j m i l i o t h e r w i s e
when m j < l i < u j < m i , d is the value of the transverse coordinate of the highest intersection point between S j and S i . Meanwhile, we need the value of N S j S i   and   N S i S j to compare S i   and   S j .
c.
The degree of probability that a convex fuzzy number is greater than k convex fuzzy numbers S i   ( i = 1 ,   2 , . . . , k ) can be defined as:
N S S 1 , S 2 , , S k = N S S 1 and S S 2   and and S S k = min   N S S i , i = 1,2 , 3 , , k
Assume that:
d A i = m i n N S i S k
The weight values are as follows:
W = d A 1 , d A 2 , , d A n T
where A i (i = 1, 2, …, n) are n elements. By normalization, the normalized weight vector is:
W = d A 1 , d A 2 , , d A n T
In this study, we applied the triangular fuzzy transformation scale of Table 1 as the evaluation model.
We define a problem with k indicator factors, where the relative importance of factor i to j is denoted by the triangular fuzzy number as a ~ i j = l i j , m i j , u i j . For example, if j is thought to be Weakly more important, it could be represented as a ~ j i = 1 , 3 / 2 , 2 . Then, the comparison matrix A ~ can be constructed as:
A ~ = 1 a ~ 12 a ~ 1 n a ~ 21 1 a ~ 2 n a ~ n 1 a ~ n 2 1 = 1 a ~ 12 a ~ 1 n 1 / a ~ 12 1 a ~ 2 n 1 / a ~ 1 n 1 / a ~ 2 n 1
d.
Consistency index (CI) and consistency ratio (CR)
Since the trait roots continuously depend on a ~ i j , the larger y m a x is compared to n , the more serious the degree of non-consistency of the data in matrix A ~ is, and the standardized eigenvectors corresponding to y m a x do not truly reflect the weights of individual factors. Therefore, it is necessary to do a CI test on the judgment matrix provided by the decision-maker to decide whether to accept it or not. For the decisions to reach a good level of quality, the consistency of the assessment must be analyzed. As C R 0.1 , it can proceed to the next step; otherwise, the judgment matrix should be appropriately corrected [53].
The triangular fuzzy number a ~ i j = l i j , m i j , u i j can be defuzzied into a clear value in the following way:
a i j α x = x l i j α + ( 1 x ) u i j α ,         0 x 1 , 0 α 1
l i j α = m i j l i j × α + l i j
u i j α = u i j u i j m i j × α
where l i j α and u i j α denotes the left-end and the right-end value of α -cut for a i j . The larger values of the decision-maker’s preference ( α ) and risk tolerance ( x ) refer to a more stable decision environment and a more pessimistic decision-maker, respectively, and vice versa.
Therefore, after transforming all the elements in the comparison matrix, the comparison matrix B α x is obtained as follows:
B α x = a i j x = 1 a 12 α x a 1 n α x a 21 α x 1 a 2 n α x a n 1 α x a n 2 α x 1  
Finally, the following equation is applied to calculate CI and CR.
C I = y m a x n n 1
C R = C I R I ( n )
where y m a x denotes the maximum eigenvalue of the matrix and n is the dimension of the matrix. Random index (RI) is the key value for judging CR and if the matrix is reasonable. The values of some of the RI values are shown in Table 2. The value of RI is obtained by constructing 500 sample matrices using a randomized method: randomly drawing numbers from 1 to 9 and their reciprocals to construct a positive inverse matrix and defining the average value of the largest trait y m a x [54] and defining:
R I = y m a x n n 1

3.2. Entropy Weight Method

Information entropy theory has been utilized to calculate objective weights for indicators. Calculating each indicator with the information entropy model involves determining the utility value of the indicator information; the higher the utility value, the more significant its evaluation will be. With this model, it is possible to maximize screening significant factors based on precise evaluation results without compromise. The EWM comprises the following steps:
  • Build the matrix
The individual metrics were first de-quantified. Suppose that m indicators are given: X 1 , X 2 , , X m . Among them X i = X 1 , X 2 , , X n . Then, assume that the values normalized to the data of each indicator are: Y 1 , Y 2 , , Y m .
According to the evaluation objects and indicators of traditional residences, set the j th indicator of the   i the object as X i j . Structure the original data matrix X = [ X i j ] n m , we know from the selection of the practical case in Section 4 that n = 3, m = 20.
Use the range transformation method to standardize the positive indicators and the negative indicators separately, as in the following Equations (23)–(25):
Y i j = x i j m i n x i m a x x i m i n x i
Y i j = m i n x i x i j m a x x i m i n x i
0 i j 1
  • Calculate the entropy value e j
e j = 1 ln   m i = 1 m P i j ln   P i j
where P i j = Y i j i = 1 12   Y i j , If P i j = 0 , then define P i j = 10 6 . Because P i j = 0 , the logarithmic function in Equation (4) is not mathematically tenable. The value of 10−6 is small enough to have no significant impact on the result. In information theory, entropy is used to measure the amount of uncertainty in a given set of data. Generally, more information leads to less uncertainty and, thus, a decreased entropy, while less information results in an increased level of uncertainty and an increased entropy.
  • Calculate weights ( w j ) by calculating information redundancy   D j
  D j = 1 e j
Then Calculate weights ( w j )
w j =   D j j = 1 n D j
where w j refers to the weight of the j th index. w j fight, the impact fight to the evaluation target. The larger the value of w j , the more important the corresponding index and the greater the impact on the value and vice versa.

3.3. The Combination of Indicator Weights

As stated in the introduction, (1) buildings in ancient villages usually have a long history, while there is a lack of complete historical data. The FAHP and EWM allow for assessment in cases of incomplete or inaccurate data, as they deal with ambiguity and uncertainty and rely on expert judgment. This is very useful in filling in the gaps where data are missing. (2) The risk of building fires in ancient vernacular residences is affected by a variety of factors, including natural wear and tear, historical events, and maintenance and upkeep. These factors may be difficult to measure accurately. FAHP allows the impact of these multiple factors to be assessed in a comprehensive manner rather than relying solely on specific data. (3) The EWM can reduce the subjective judgment of different factors in assessing ancient vernacular residences, especially in the absence of large-scale research data. The EWM can help determine the relative importance of factors in order to assign weights more objectively in a comprehensive assessment. (4) The maintenance and upkeep of historic buildings are usually different from modern buildings. FAHP and EWM can take these differences into account and better accommodate the special characteristics of historic buildings. Therefore, by combining these two methods, a comprehensive analysis of fire risk can be achieved in ancient village buildings. The FAHP considers the inherent uncertainties and vagueness associated with various risk factors, while the EWM enables the quantification of the importance and weights of these factors. FAHP accommodates subjective judgments and linguistic variables, allowing for the inclusion of qualitative assessments. On the other hand, EWM deals with quantitative data and measures the degree of disorder among indicators. These can well handle the complexity of fire assessment due to the unique architectural and cultural characteristics of ancient village buildings.
In conclusion, the combination of FAHP and EWM is essential for assessing the fire risk of ancient village buildings because it allows a comprehensive analysis, deals with complexity, and improves objectivity. Therefore, a linear weighting scheme is applied to identify comprehensive weights of evaluation indexes ( w i , w j ), Combining the two methods, λ 1 and λ 2 represent the weight of the two methods, FAHP and EWM, respectively, in calculating the combined weights. This procedure is accomplished through the following calculation:
W = λ 1 w i + λ 2 w j
λ 1 + λ 2 = 1
There is no research to indicate which of the two evaluation methods is more important; in this study, we set λ 1 = λ 2 = 0.5 .

4. Materials and Modeling

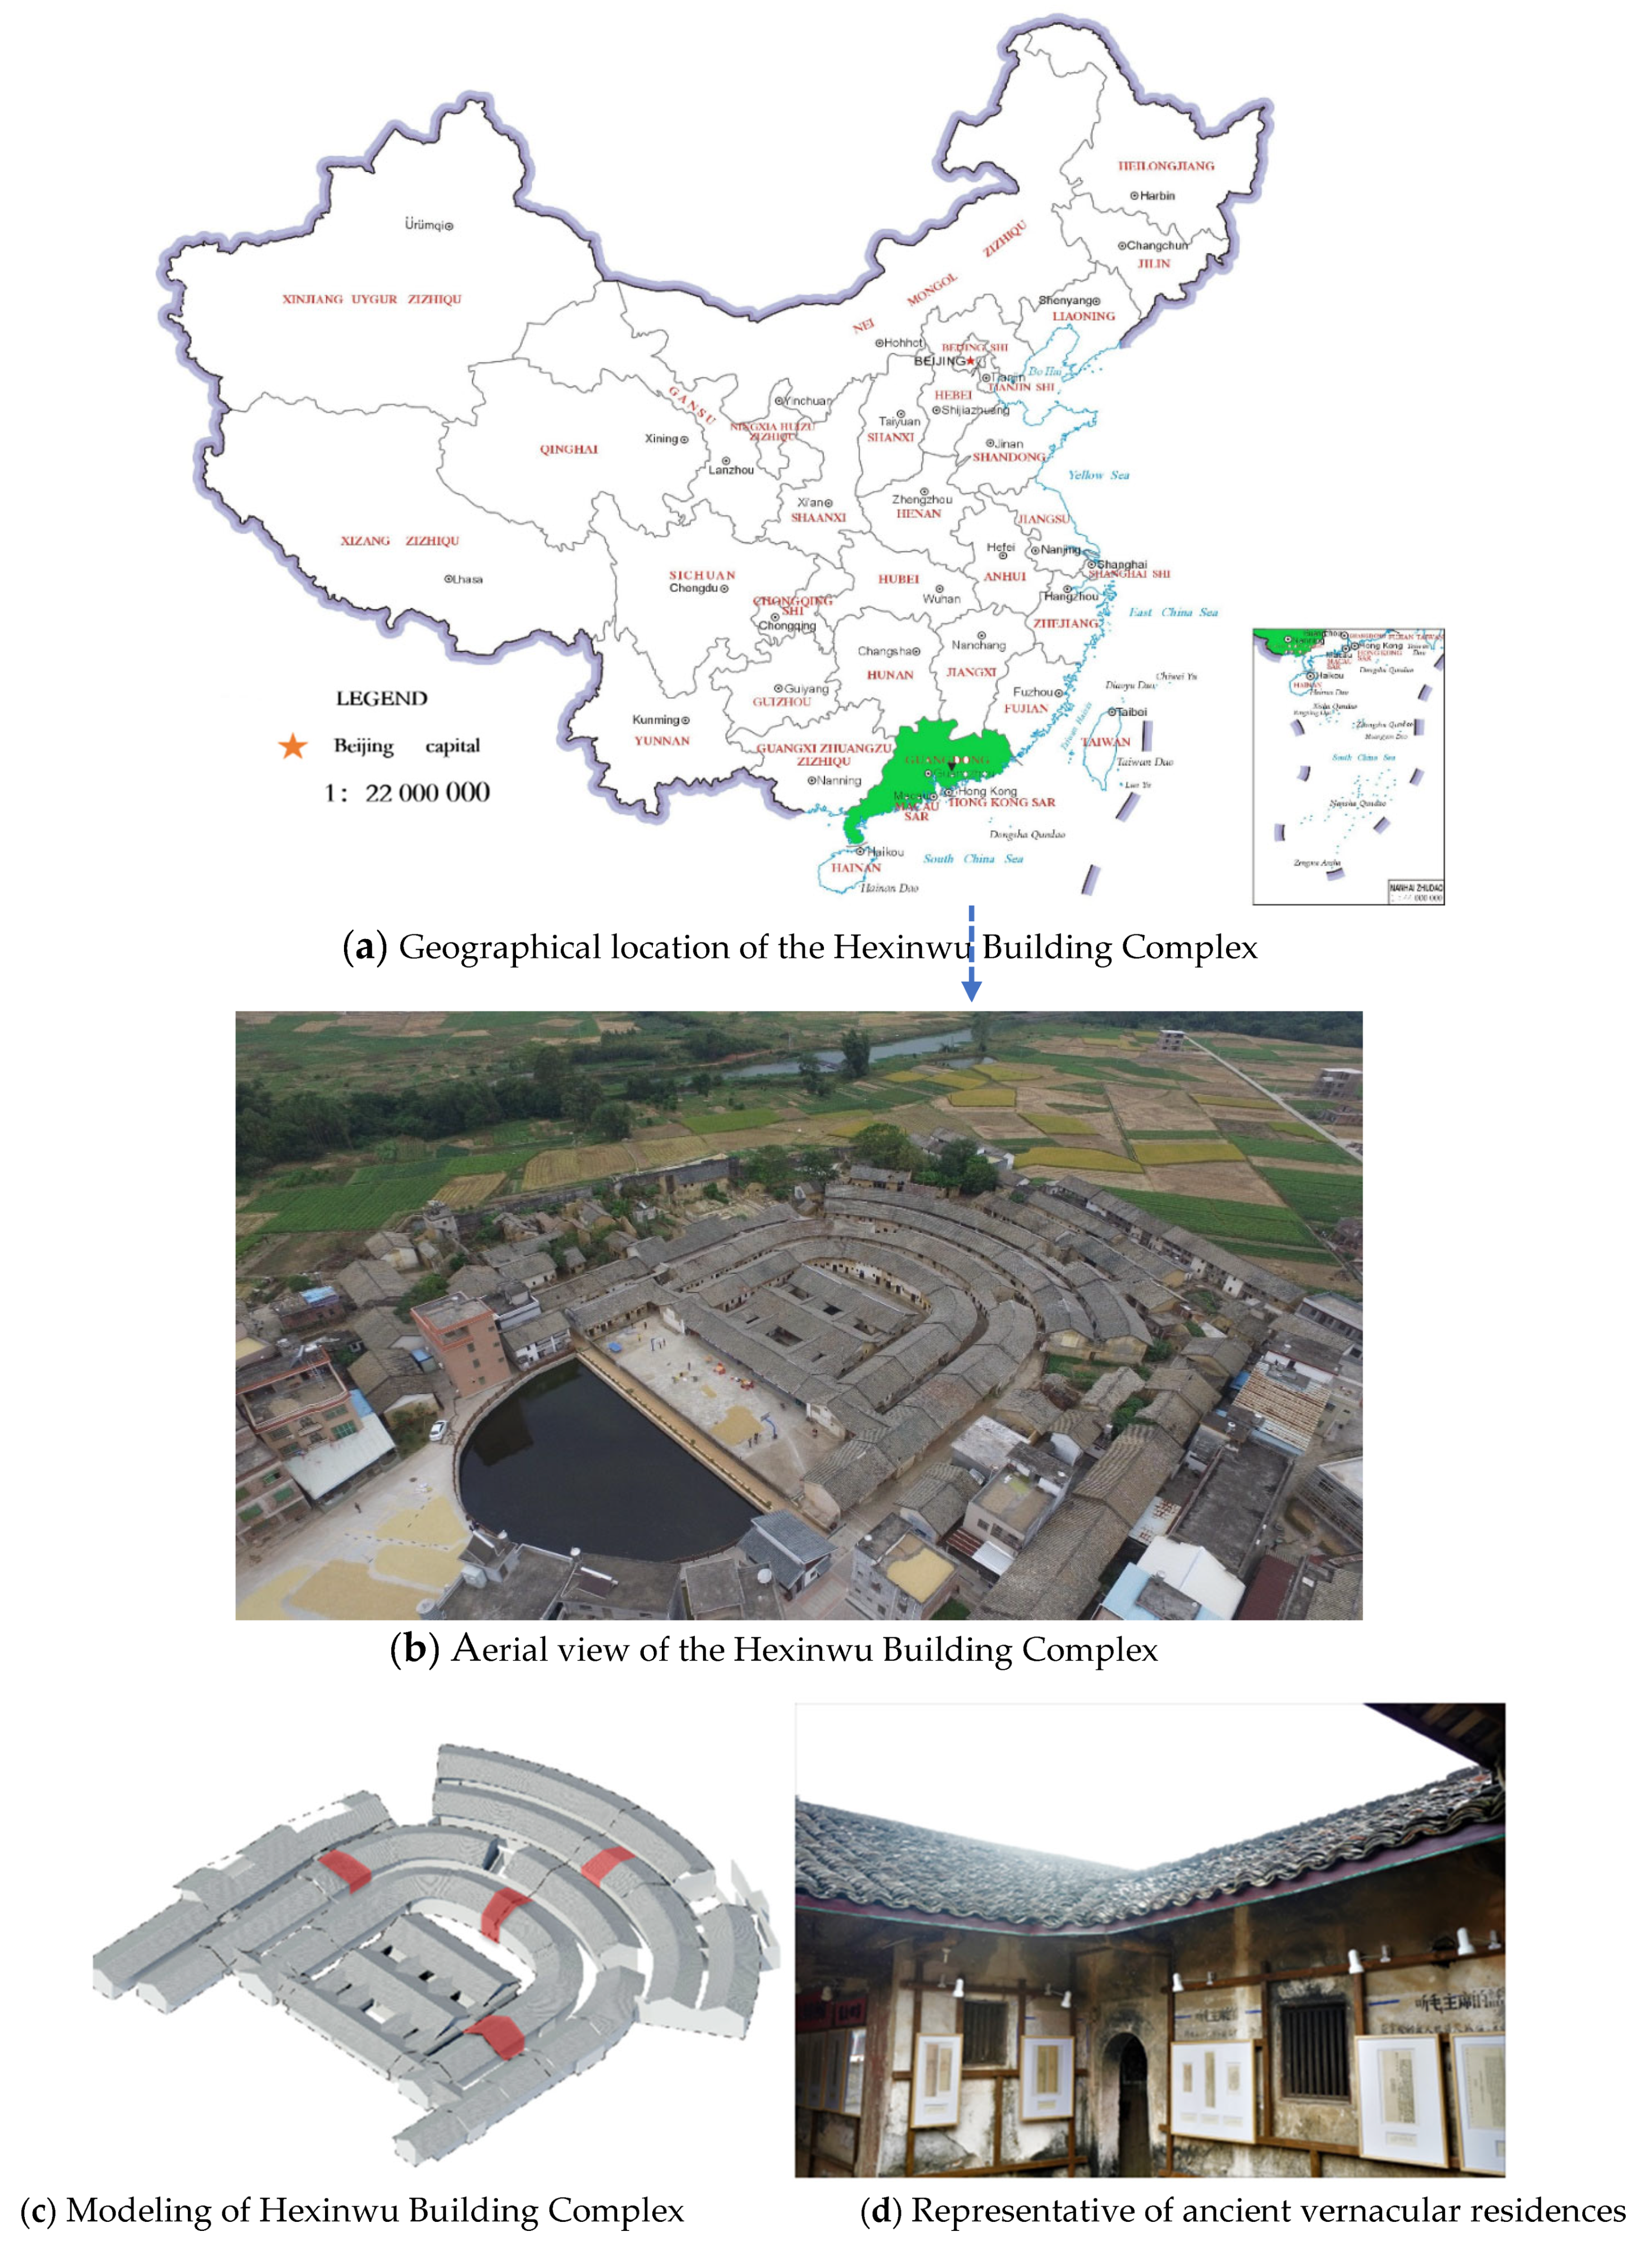
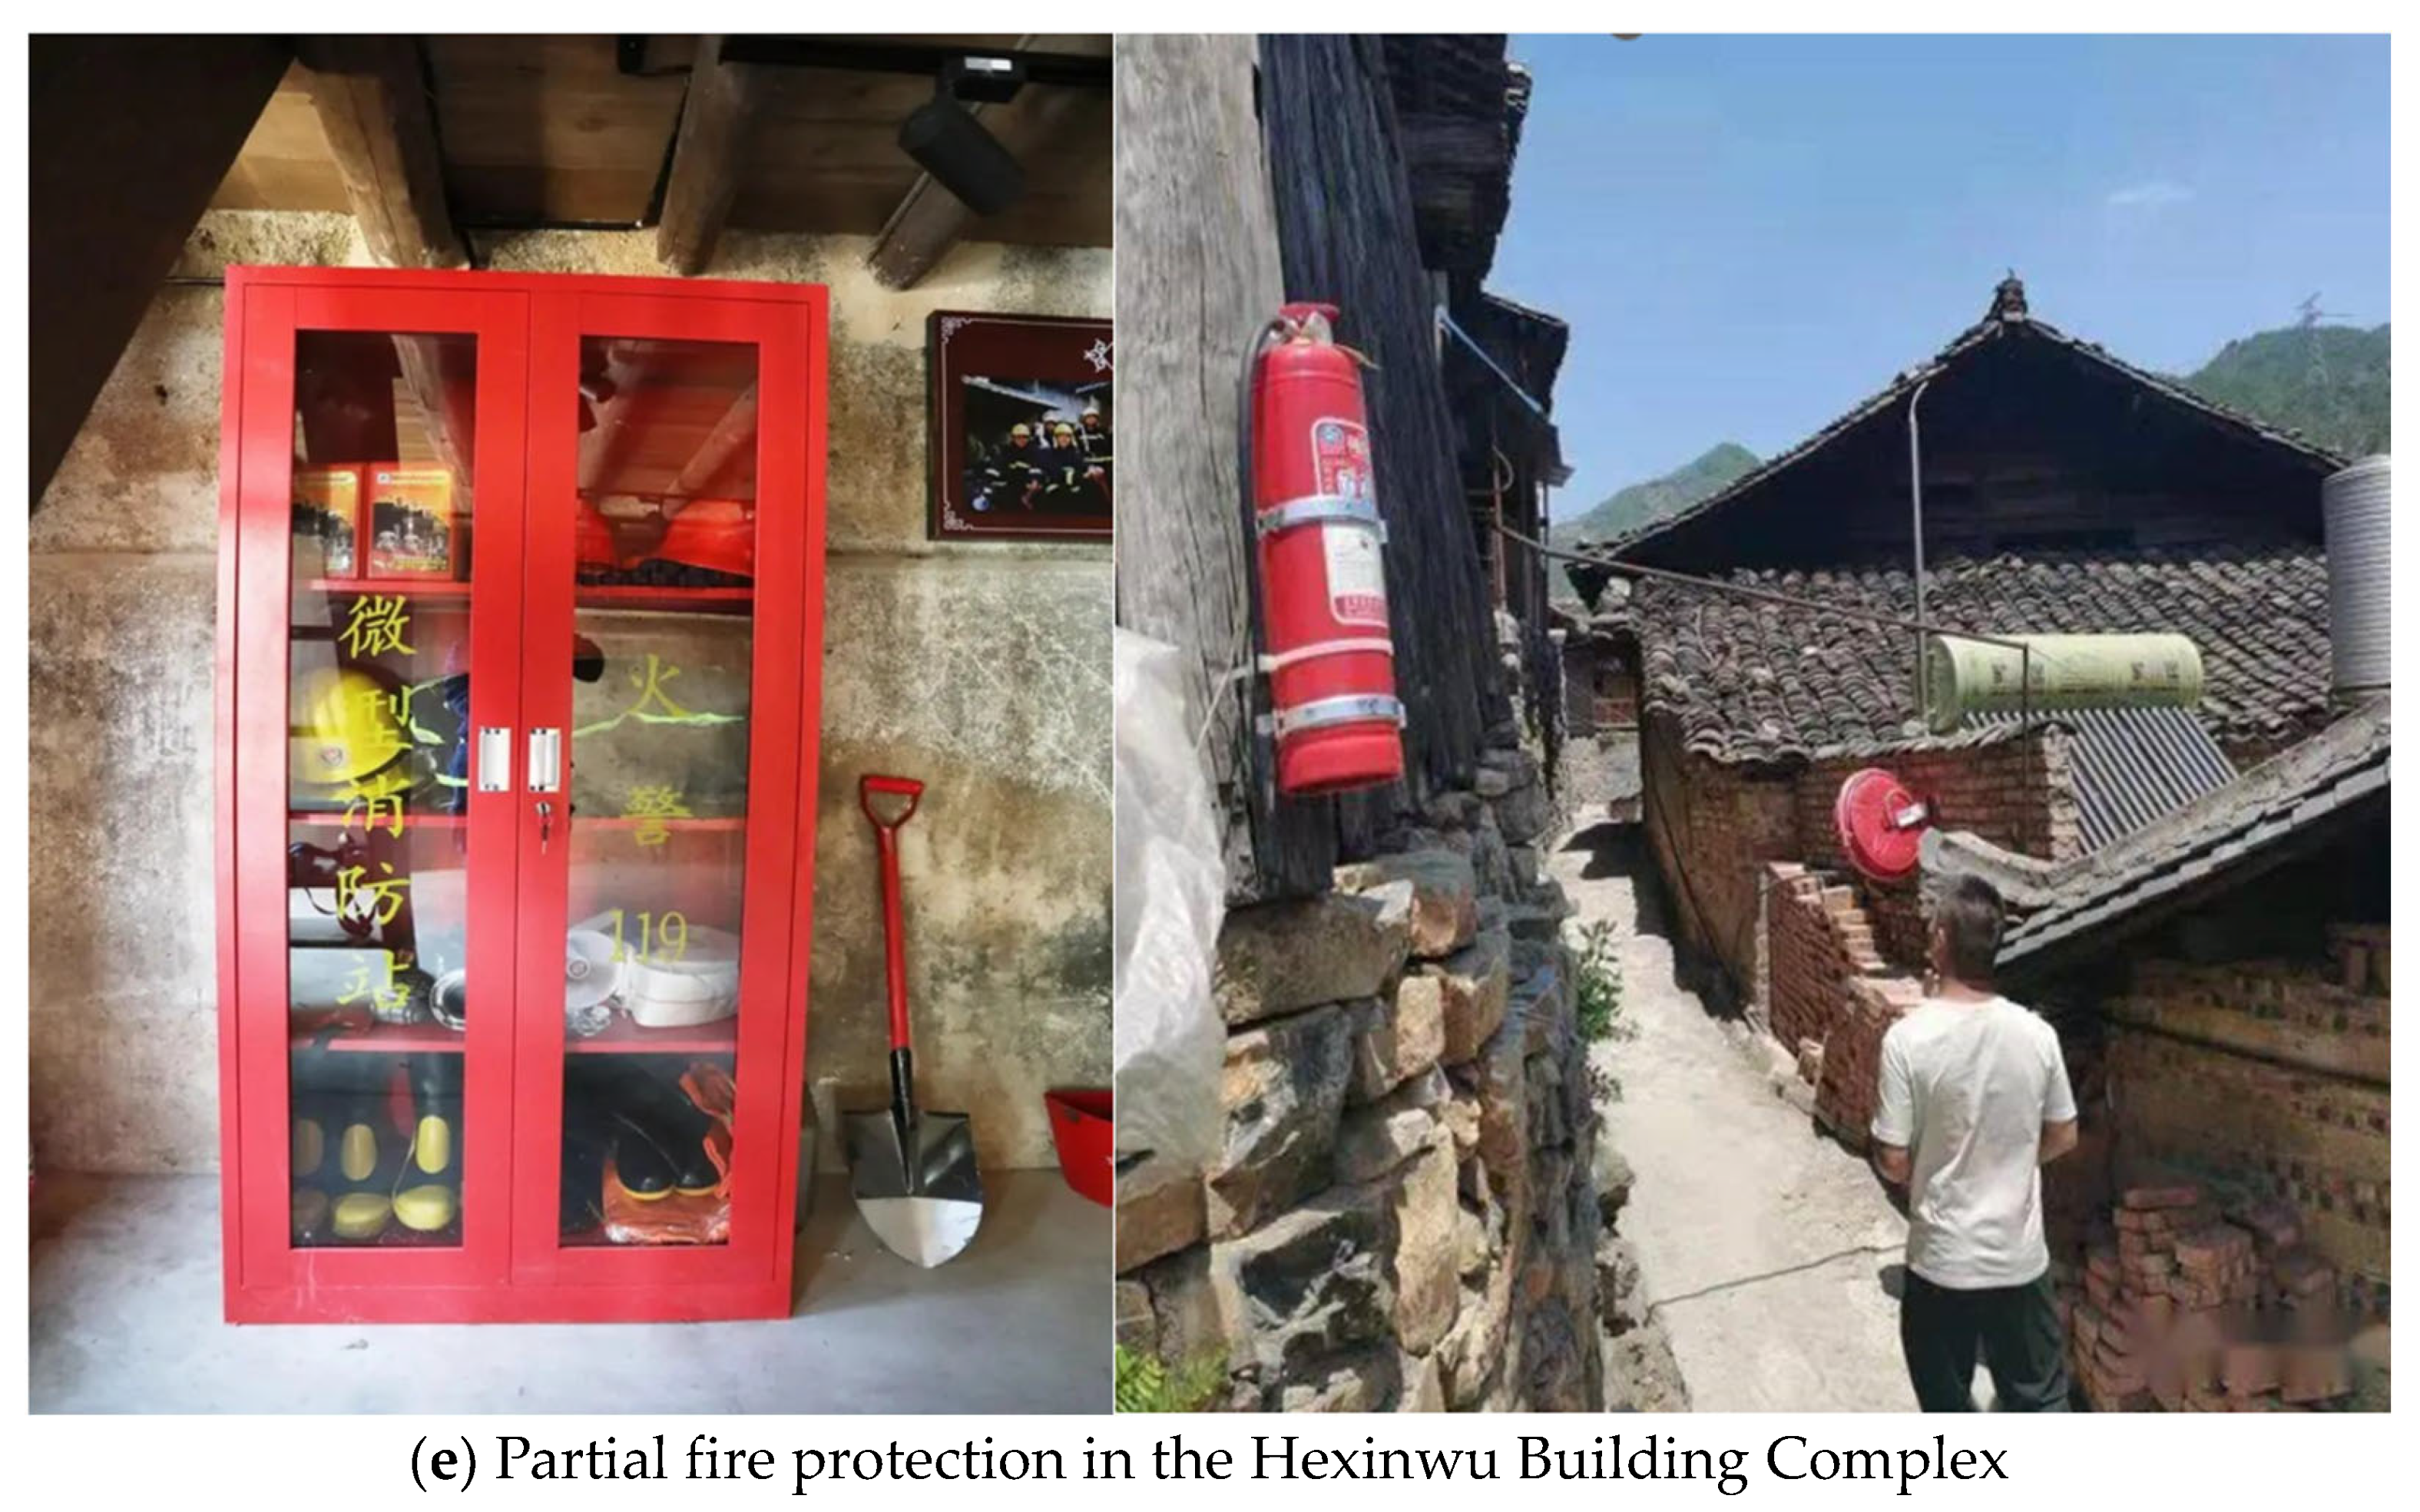
4.1. Hexinwu Building Complex

The Hexinwu Building Complex is a landmark complex with a history of more than 350 years located along the ancient southern Guangdong Road, east of Lianping County, Heyuan City, Guangdong Province, China (see Figure 1a). Built as a battle site during the People’s Liberation War, Hexinwu is home to various intangible cultural heritages such as red culture, contract culture, and Hakka culture. It also serves as a heritage revitalization practice base in Guangdong Province. The complex boasts a symmetric courtyard house structure featuring an axial main hall in its center. In 1724, the He Xin House was built in five circles with five gates and nine wailing dragons, divided into four pavilions: east, west, north, and south. The existing Hexinwu building complex has only four circles, as shown in Figure 1b,c. The highest point of this structure is the wailing apex, followed by the upper hall, middle hall, and lower hall, which successively descend in formation, separated by patio and screen divisions. Horizontal houses that flank the main halls are arranged perpendicularly in overlapping patterns toward both sides, forming the core unit across (see Figure 1d). Given its important role in studying traditional Chinese architectural art and transmitting ancient cultural customs among people, the Hexinwu Building Complex offers high cultural value.
Through field visits and expert interviews, we learned that the brick and wood structures of the Hexinwu buildings have undergone long-term weathering and natural wear and tear, and their architectural structures are broken or aging. Electric wires in ancient villages are generally older, and the problem of aging wires is more common. Fire prevention facilities and measures in ancient villages are relatively simple, mainly fire extinguishers (7), fire hydrants (1), and fire drains, which are currently distributed throughout the villages (see Figure 1e). The roads within the village are narrow, making it difficult for firefighting vehicles to enter. Also, because it is far from the city, the emergency rescue time is long. During the conversation with the villagers, it was found that the villagers’ awareness of firefighting is weak, and there are some problems with unregulated living electricity, which indicates that there is a greater risk of fire. It is necessary to conduct fire risk assessment for Hexinwu ancient village buildings, which is important and significant for the protection and inheritance of traditional architectural art and ancestral cultural customs in southern Guangdong.

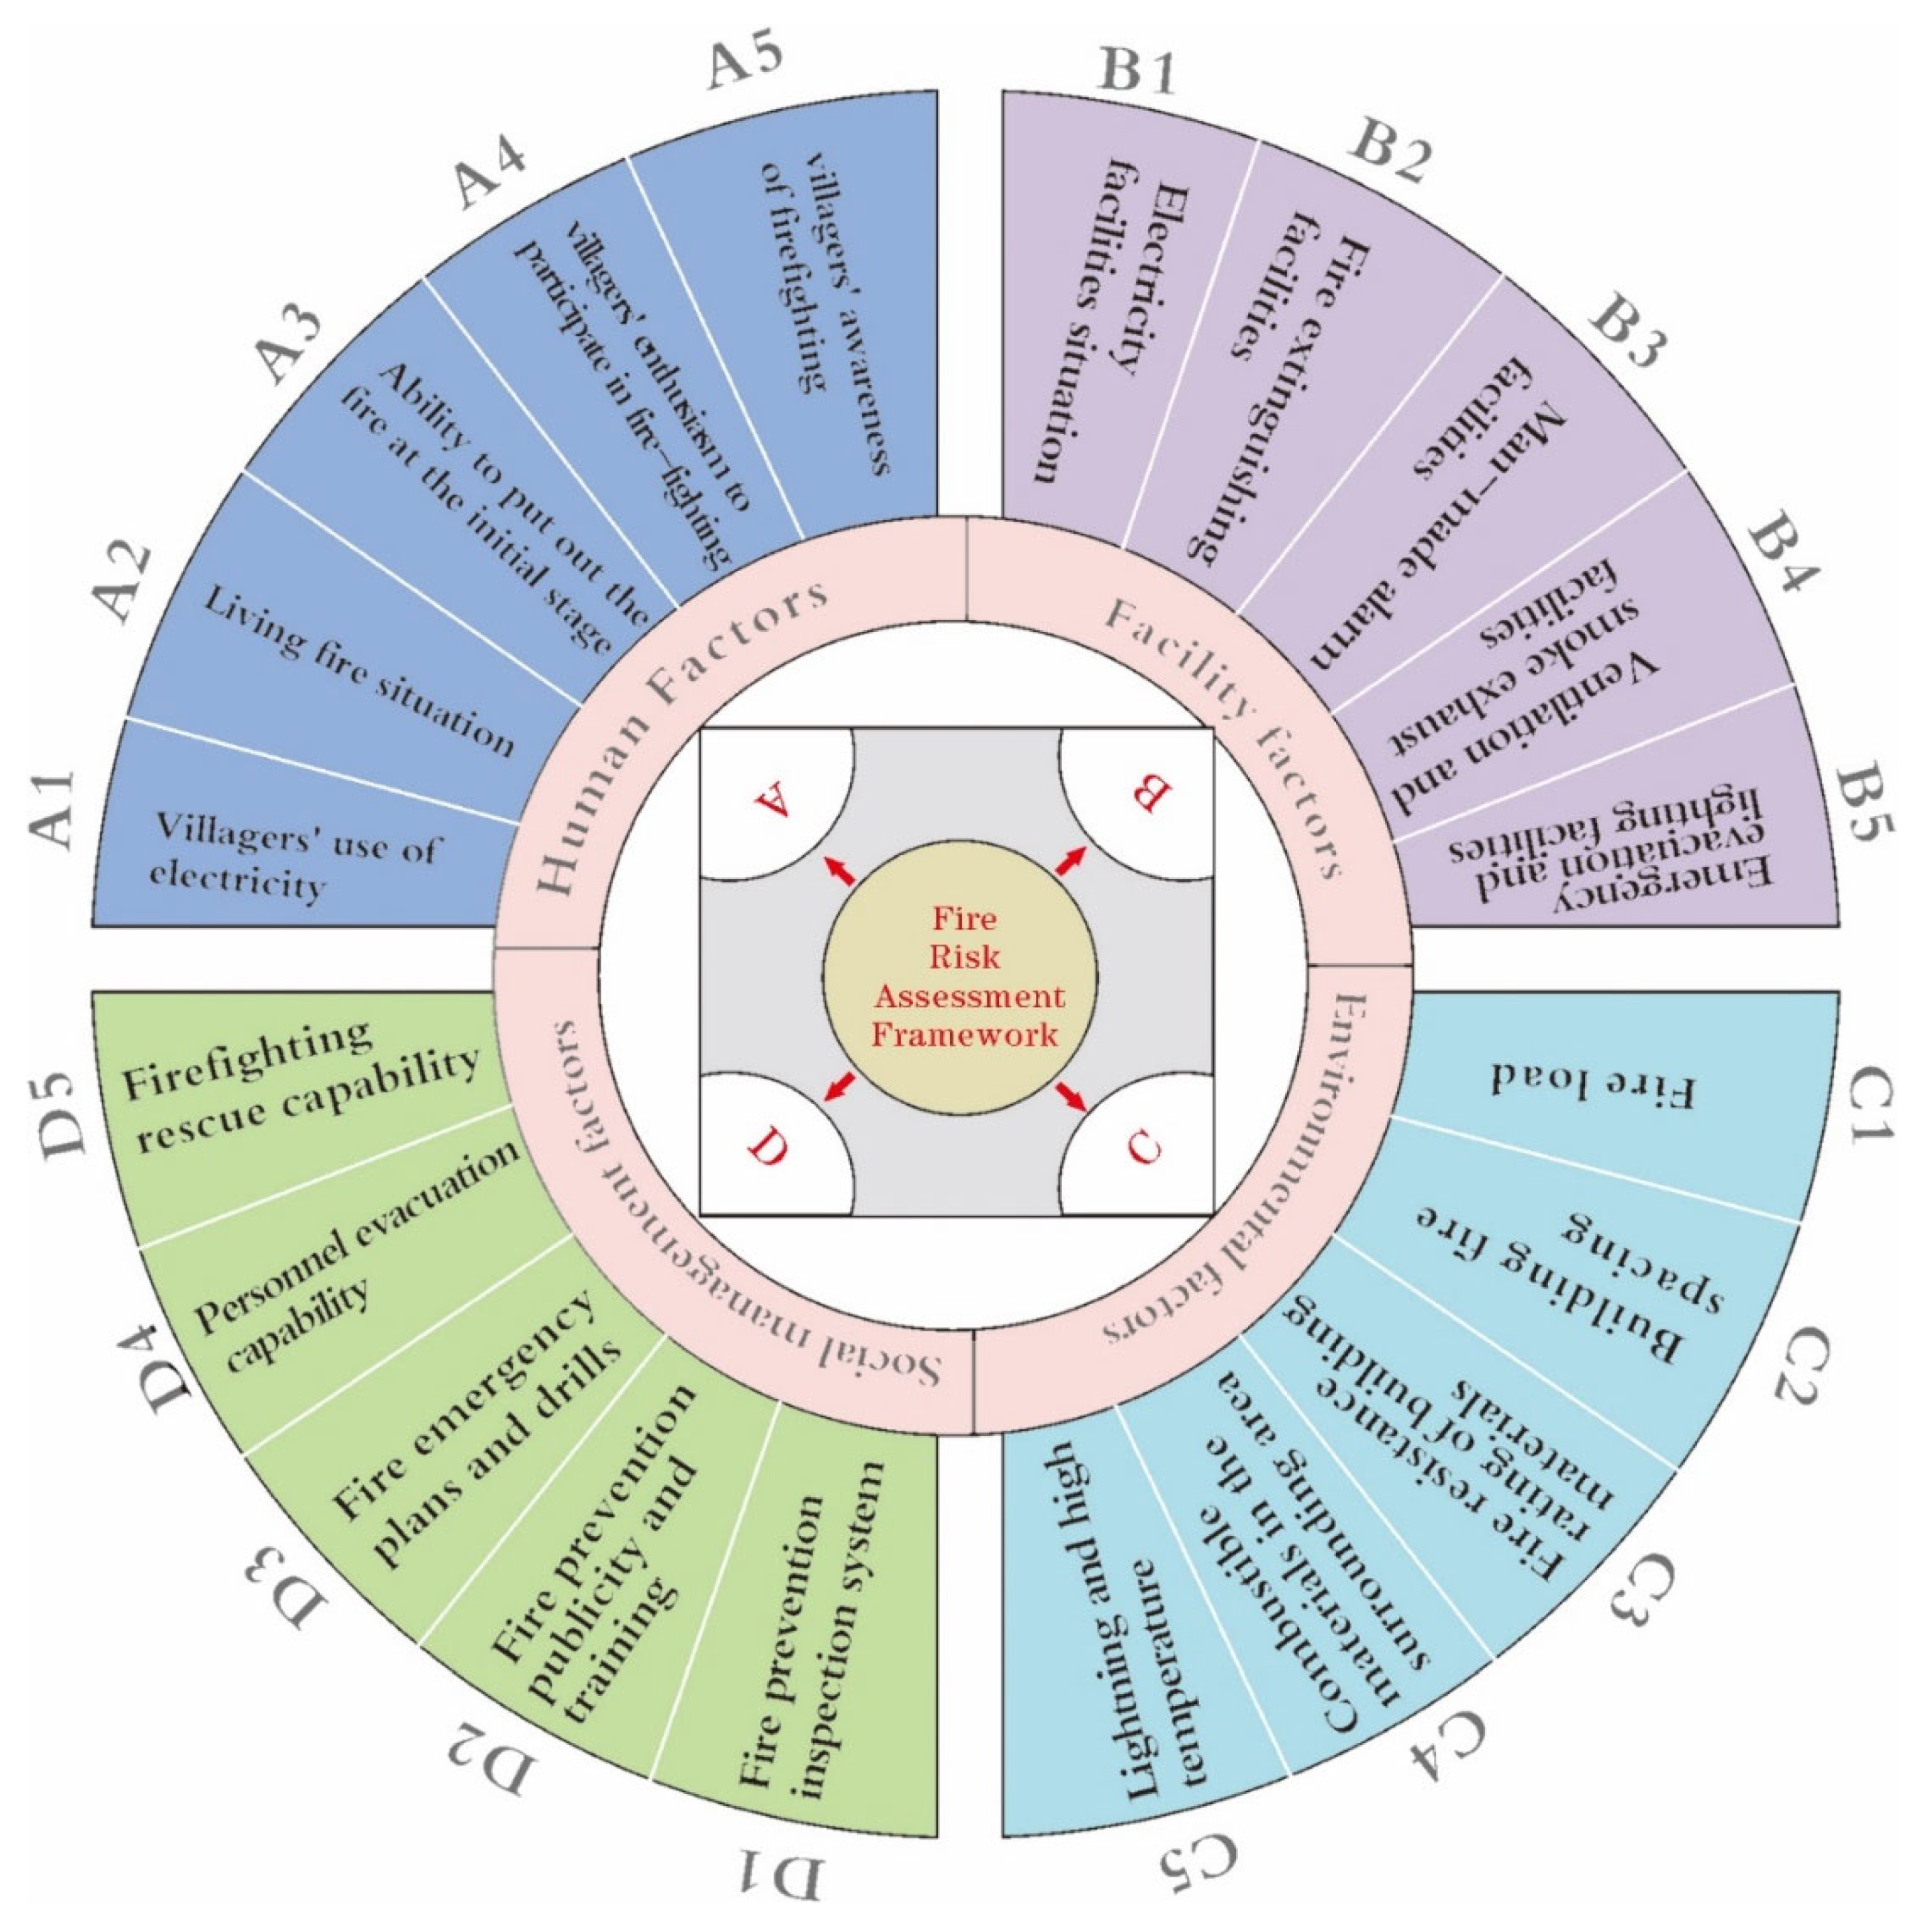
4.2. Evaluation System Model

The most important aspect of risk assessment is the implementation of an indicator system. Using data from prior research, the fire risk assessment system for the Hexinwu Building Complex was constructed by combining human factors, facility factors, environmental factors, and social management factors, which created a full system of twenty sub-indicators [55,56,57]. See Figure 2 for more information. Subramaniam [58] showed a statistically significant positive correlation between human factors and the occurrence of fire. Ouache et al. [15] reconciled any discrepancies by applying evidence-based reasoning and machine-learning methods to illustrate that human error was responsible for 20.68% of urban fire events. In this research, in view of the possible incompleteness, diversity, and complexity of historical fire data from ancient village buildings, which vary according to geographical and cultural differences, the fire risk assessment model focuses on the principles of operability and data reliability in addition to the principles of comprehensiveness and methodological scientificity. The framework of fire risk assessment was established, as shown in Figure 2.
Relevance to Fire Risk: The selected sub-indicators under each primary indicator are directly related to the factors that contribute to fire risk in ancient village buildings. These factors encompass a wide range of elements, including electricity use standardization, incendiary sources, fire prevention knowledge, citizen involvement in firefighting, and awareness of fire prevention measures. Taking into account these specific aspects, the assessment can effectively capture the significant factors influencing fire risk in the context of ancient village buildings.
Comprehensive Coverage: The chosen primary indicators (human factors, facility factors, built environment, and social management) collectively cover various dimensions of fire risk assessment. They encompass human behavior, facility conditions, environmental factors, and social management practices, ensuring a comprehensive evaluation of the multiple factors that contribute to fire risk. This comprehensive approach enhances the accuracy and validity of the assessment results.
Practical Significance: The selected sub-indicators reflect practical considerations and management practices that can help mitigate fire risk and reduce post-disaster losses. They encompass aspects such as standardized electricity use, availability and accessibility of firefighting tools, alarm systems for evacuation, ventilation and smoke exhaust facilities, emergency plans, personnel evacuation capability, and expertise during rescue operations. By including these factors, the assessment provides actionable insights for effective fire risk management and mitigation strategies.

4.3. Establishing Judging Criteria

This study adopts a qualitative and quantitative approach to assess the fire risk of ancient residential buildings. To overcome the degree of ambiguity associated with the result of this assessment, we use a hierarchical system to divide the intervals. In accordance with general classification methods found in existing literature, we divide the fire risk into five levels, as can be seen in Table 3. The score for each level ranges from 0 to 9, where the higher the score, the greater the fire risk.

5. Results and Discussion

5.1. Data Collection

We divided the interviewers into three groups: representatives (three) of the Hexinwu village committee and front-line firefighting staff, two teachers and scholars from universities engaged in firefighting management research, and two decision-makers from government firefighting management. These three groups of personnel gave triangular fuzzy evaluation values (20 indicators and 4 system indicators) based on Table A1 in Appendix A. To obtain Table A18 in Appendix A, seven experts then judged each of the 20 sub-indicator factors based on Table 3, with the highest and lowest scores removed.

5.2. Calculation Results

The comparison matrix of indicator factors can be obtained from Equations (6) and (9), and Table 4.
The comparison matrix V of the indicator factors can be obtained by decoding Equations (16) through (18).
V = 1.000 1.536 1.826 1.155 0.696 1.000 1.006 0.603 0.880 1.281 1.000 0.999 0.936 1.244 1.281 1.000  
Using MATLAB R2021a and Equations (20) and (21) to calculate results:
y m a x = 5.25         C I = 0.0834         C R = 0.0937 ,   C R < 0.1
Hence, it is acceptable.
The same method detailed in Table 4 was used to calculate the comparison matrix for each sub-indicator factor. Subsequently, the defuzzification of the triangular fuzzy number tables of each subindex was carried out, and the respective CR values were obtained (Table A2, Table A3, Table A4, Table A5, Table A6, Table A7, Table A8, Table A9, Table A10, Table A11, Table A12, Table A13, Table A14, Table A15, Table A16 and Table A17 in Appendix A). The consistency values obtained by the results are less than 10%, all of which are satisfactory.
C R A = 0.0831 ,   C R B = 0.0948 , C R C = 0.0621 , C R D = 0.0971
We utilized FAHP to determine the weights of 4 indicator factors and 20 sub-indicator factors. For example, using Equations (2)–(5), we calculated the TFN values of the four indicators from Table 4 as follows:
S1S2S3S4
TFN(0.107, 0.327, 0.813)(0.088, 0.179, 0.478)(0.086, 0.224, 0.669)(0.113, 0.270, 0.574)
Using Equations (10) and (11) to compare the value of N ( S i S j ) .
N (S1 ≥ Sj)ValueN (S2 ≥ Sj)ValueN (S3 ≥ Sj)ValueN (S4 ≥ Sj)Value
N (S1 ≥ S2)1N (S2 ≥ S1)0.715N (S3 ≥ S1)0.844N (S4 ≥ S1)0.891
N (S1 ≥ S3)1N (S2 ≥ S3)0.897N (S3 ≥ S2)1N (S4 ≥ S2)1
N (S1 ≥ S4)1N (S2 ≥ S4)0.802N (S3 ≥ S4)0.924N (S4 ≥ S3)1
The relative weights of the four indicators can be obtained from Equations (12)–(14), as shown in Figure 3.
The remaining 20 sub-index factors were calculated to obtain the relative weight of each sub-index to the index factors. The EWM was then used to find the weight of each index, and both values were combined (with equal weight) to obtain the weight from Equations (29) and (30).

5.3. Analysis of Fire Indicators

From Figure 3, we can observe that the fire risk assessment of ancient vernacular residences revealed that 29% of fires were caused by human causes. This result is consistent with Ouache et al.’s [15] study, wherein 20.68% of fire risk was attributed to human factors. However, the difference in these two percentages is due to the distinct subjects studied by each research. Therefore, it is important for officials, village councils, and citizens to work together to prevent fires through means such as increased fire safety awareness campaigns and the use of new technologies in improving pre-fire damage assessment, early identification, and prevention of potential hazards.
Through a questionnaire survey of villagers, it was found that the probability of fire is highest in winter. This finding is supported by Chuvieco and Justice’s [59] research, which showed that winter is relatively dry, creating an environment around the ancient village that is extremely vulnerable to fire. Statistics from 1997 to 2017 revealed that there was a slight increase in the number of fire accidents and fatalities during December, January, and February each winter compared to the rest of the year. Dry air in winter makes these fires more likely to spread easily once they occur. Additionally, during festive seasons such as New Year’s Day and Spring Festival, residents tend to use more electrical appliances for entertainment and party activities, increasing their risk of starting a fire [7].
The second most influential fire risk is social management factors, accounting for 25.8%. Fire is not only a physical phenomenon but also a social one with complex consequences. To prevent fires from occurring, countries such as China and the United States have implemented successful fire awareness and training programs [60]. However, many rural dwellers lack knowledge of fire hazard management due to their poor social experience. Therefore, developing more effective fire safety education is essential to make people aware of how to better protect themselves from the risk of fire. Therefore, an effective fire safety accountability system and fire management system are crucial for the sustainability of the built cultural heritage of ancient villages. The establishment of systematic and routine fire safety inspections, corrective measures, and the integration of fire protection planning with urban planning departments can ensure adequate fire stations, evacuation routes, and safety exits in neighboring areas. Timely notification of relevant authorities, increased supervision, installation of additional firefighting equipment, and regular evacuation drills can ensure overall fire safety during major events.
The other two main categories of indicators that influence the risk of a fire in new buildings are facility factors (20.7%) and environmental factors (24.5%), which directly affect the objective factors of building fires. Wang et al. [61] used building information modeling and 3D modeling geometry data to simulate evacuation assessment, escape route planning, safety education, and fire management strategies. From 2012 to 2014, a survey conducted by the Ministry of Public Safety and Security of Korea regarding the financial support for fire safety facilities and technology research projects showed that investments in safety facilities were integral to fire prevention [62]. Kim and Kong’s [63] research showed a positive correlation between quality fire protection facilities and the rate of fire prevention conducted by studying management styles within apartment houses during inspections. However, the specific correlation between them was not stated, nor was its influence on reducing fires revealed. Guo et al. [64] studied the probability of failure when it came to steel structure resistance against fire load considering uncertain parameters like environmental factors such as air temperature and wind velocity/direction, which can significantly change evacuation plans during disasters, according to Nishino et al.’s [65] multi-scenario city post-earthquake study involving fire spread evacuation. Environmental contamination caused by fires, including air pollution and groundwater contamination, is also emphasized in Alvarez et al.’s [66] study. The authors found that complexes consisting of buildings with occupants can significantly contribute to higher levels of fire risk, but no criteria were established regarding precise correlations among both hazards.

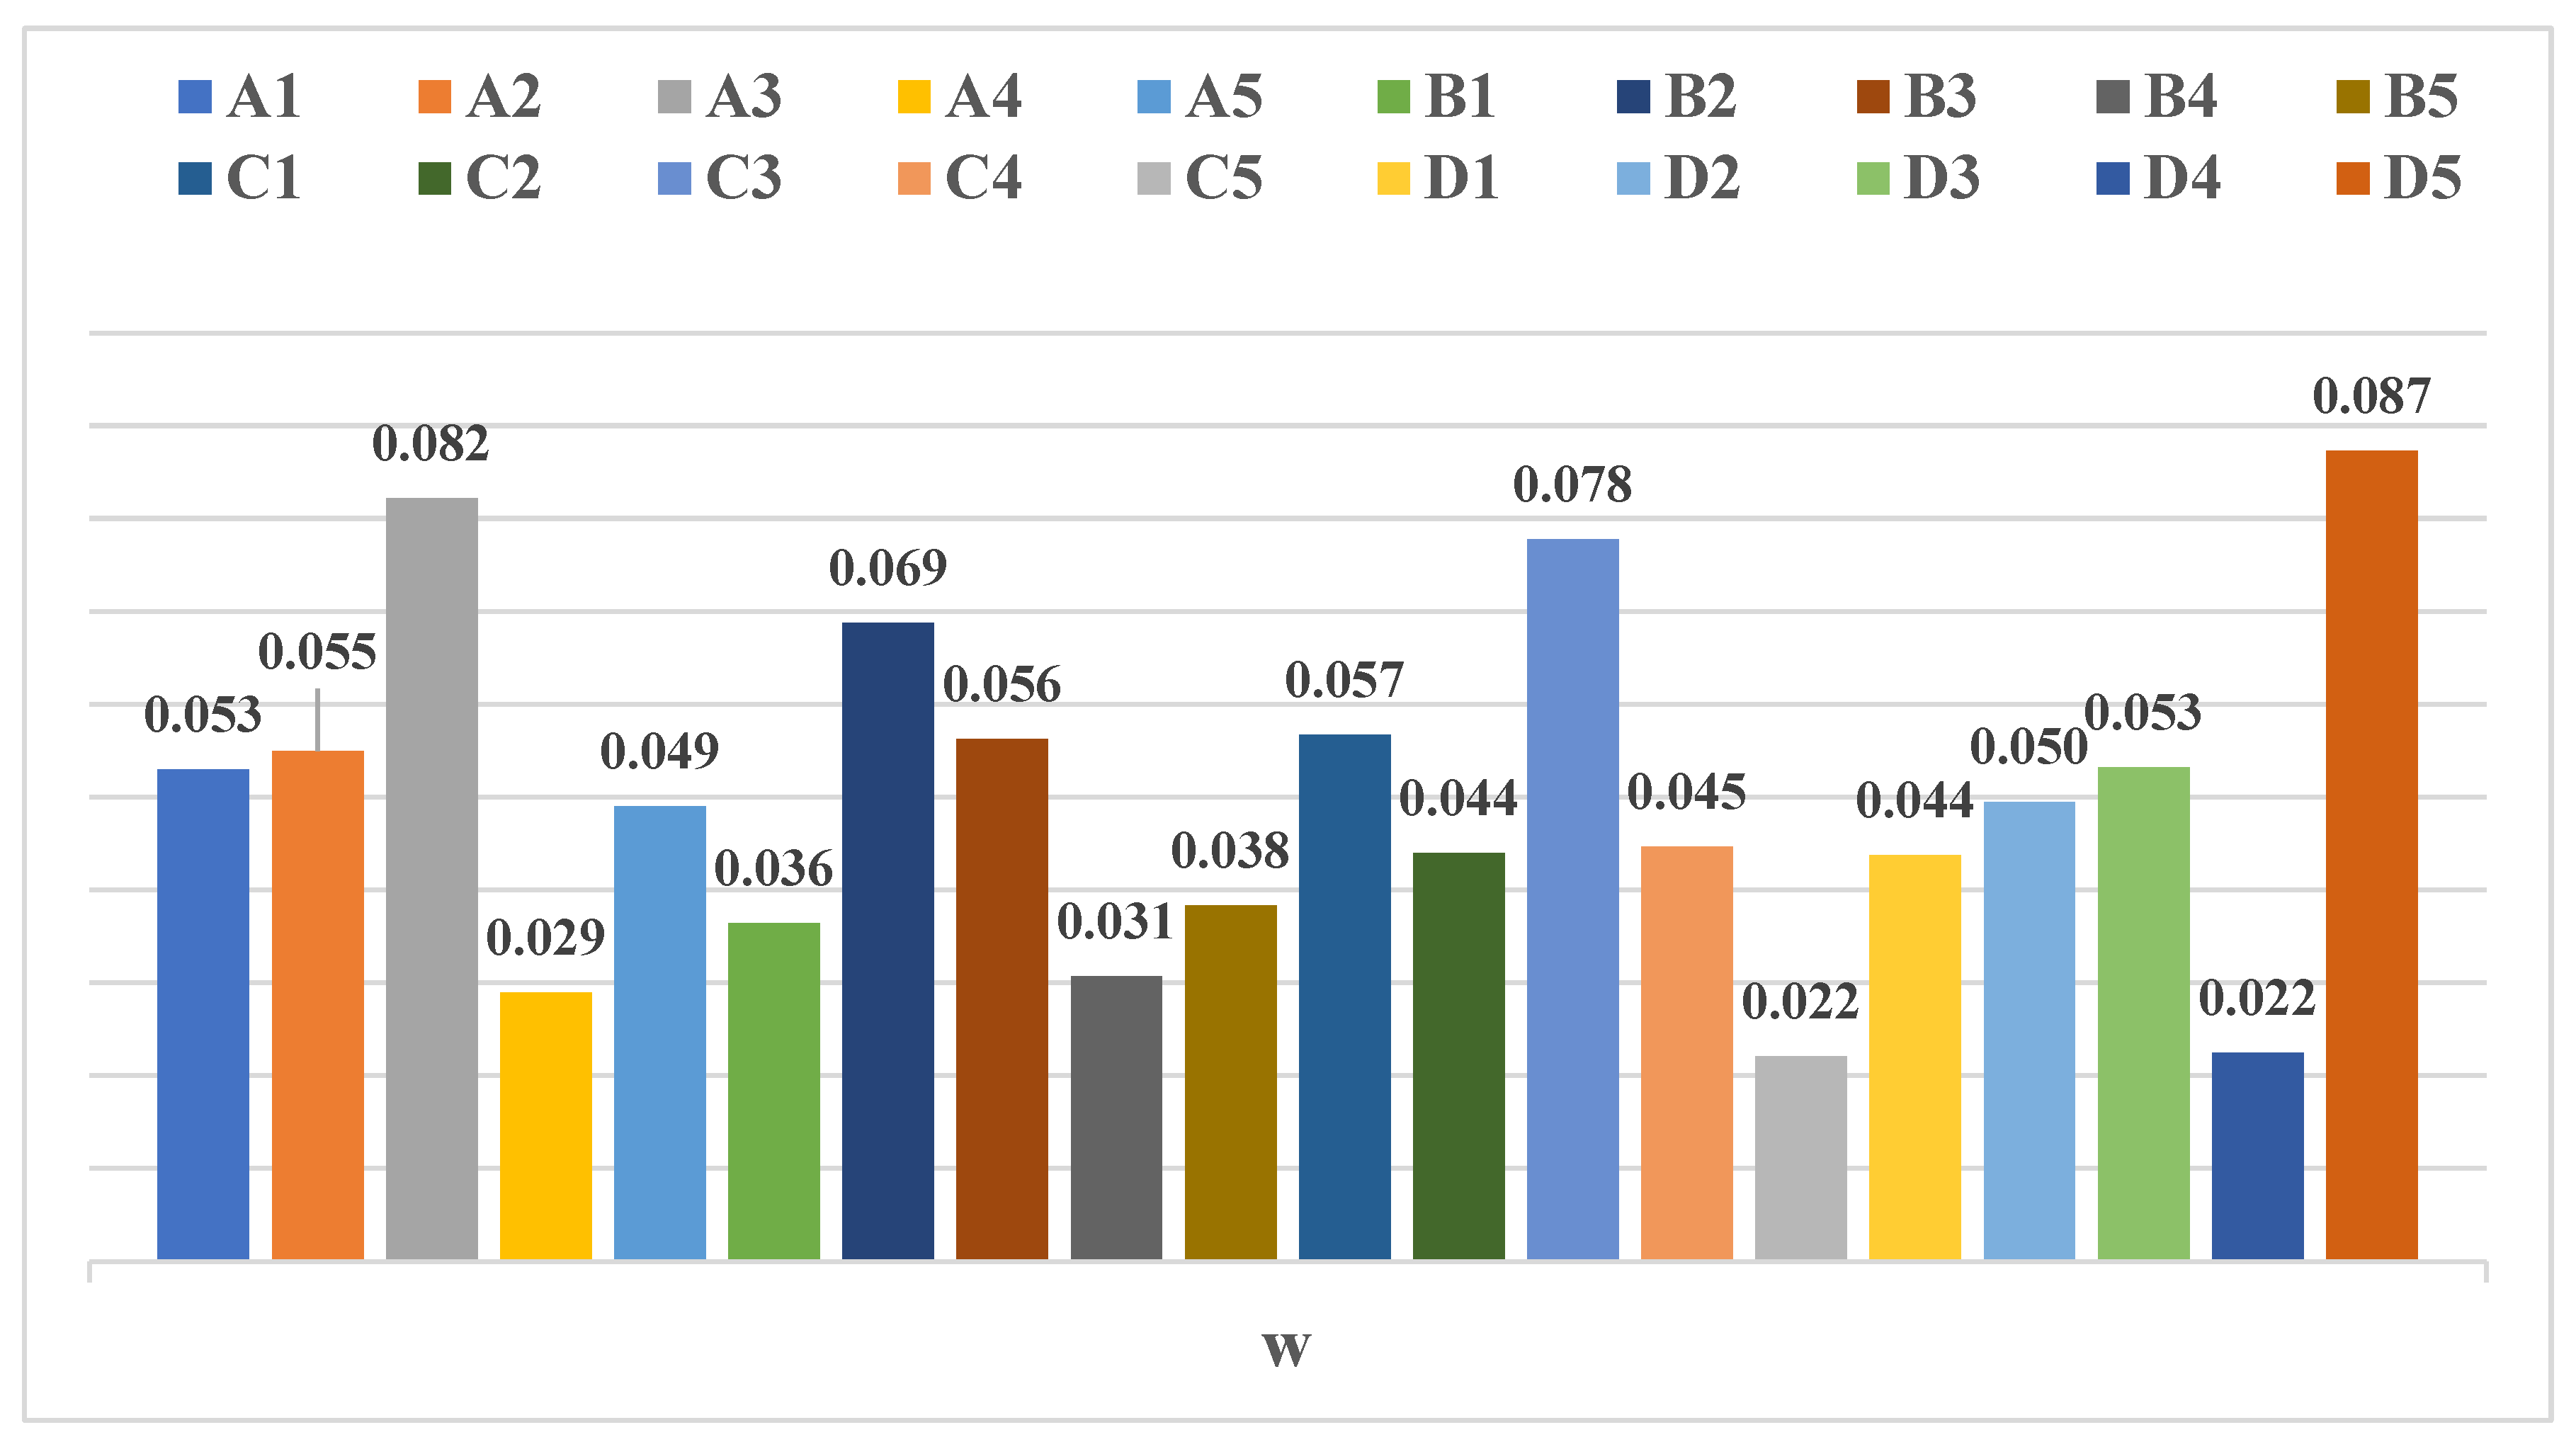
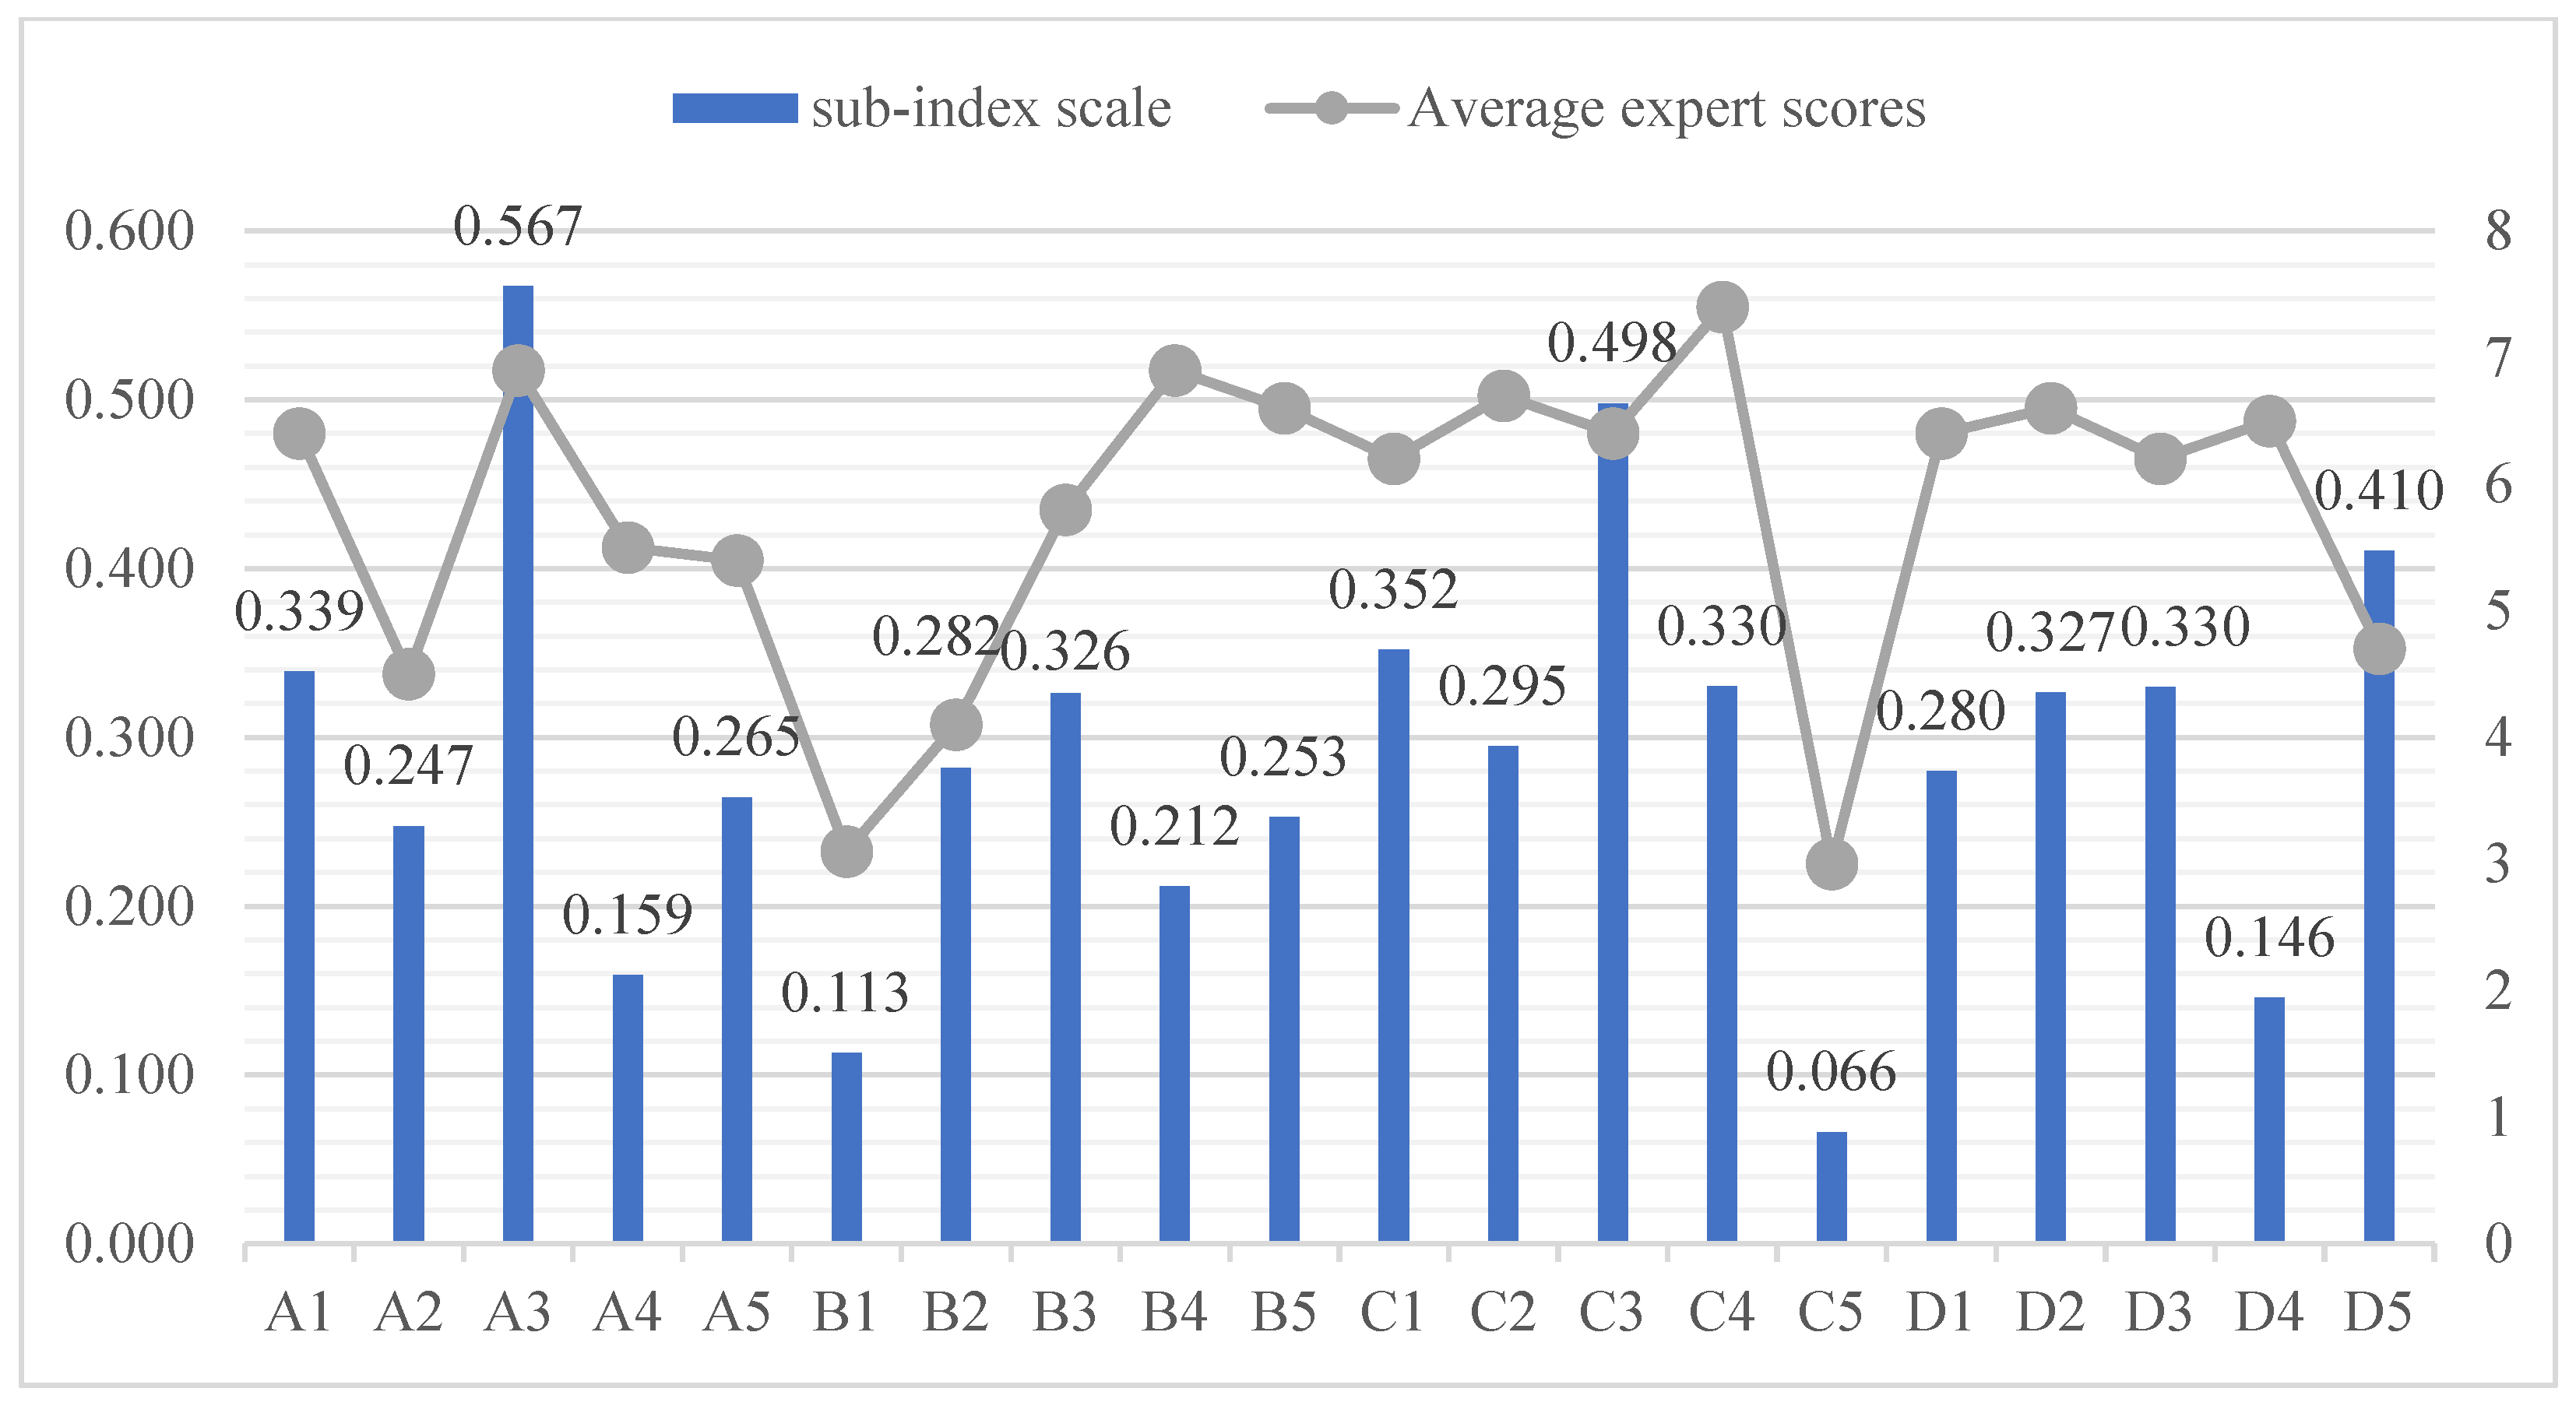
5.4. Weighting Analysis of Fire Risk Impact Subfactors

From the results of Figure 4 above, the five biggest fire risks that affect the Hexinwu Building Complex are D5—fire rescue capability (8.7%), A2—initial firefighting capability (8.2%), C3—fire resistance level of building materials (7.8%), B2—firefighting facilities (6.9%), and C1—fire load (5.7%). The most important factor for reducing the damage caused by a building fire is the fire rescue capability of urban management, which can greatly reduce the risk of such a disaster if it is properly handled immediately at its onset. Reports from China’s statistical data from 1997 to 2017 showed that the total number of fires and losses throughout China decreased overall; one of the contributing factors was cities developing and improving their rescue capabilities. All fires start as small sparks or hidden dangers; if the initial fire forms before help arrives and professional firefighters do not come to contain it, then the native inhabitant’s abilities to contain the spread of said fire are crucial. Second, building materials with higher ratings in terms of their degree of resistance against flames have an incredibly important role in preventing these fires from spreading. Such measurements are based on a graded scale determined by combustion properties and exhaust threshold limits for all components used in construction [67]. The bearing structure in the Hexinwu Building Complex is mainly made out of wood, which is far more flammable compared to reinforced concrete structures in larger buildings, making it considerably harder to reduce its risk of catching fire; therefore, it is essential when preserving this ancient tangible cultural heritage site that not only is research regarding traditional tourism culture performed correctly but also that proper coating and wrapping is applied on all major structures using flameproof materials to keep fires from spreading further should they occur [68].

5.5. Hexinwu Building Complex Fire Risk Situation

The composite average derived from the data in Figure 4 and the expert scoring can be used to calculate the fire risk score for the new sub-indicator (shown as dots in Figure 5). The total score resulting from all these scores is 5.797. According to Table 3, it can be concluded that the safety level of the Hexinwu Building Complex is Level 4, signifying that it is relatively dangerous. This corresponds to the preliminary determination made by the expert group. Therefore, measures must be taken to ensure fire safety protection for the cultural sustainability of this architectural heritage. The area is in a relatively remote, mostly rural location, making it difficult to achieve timely fire rescue capabilities. Furthermore, buildings here typically feature brick–timber materials, which are prone to catching fire. Most of these buildings are also in disrepair, and due to villagers’ lack of awareness regarding fire safety, unsafe practices such as improper use of electricity, smoking, playing with fire, and lightning strikes during dry winter months, all contribute significantly to the risk of a potential fire accident.
From Figure 5, it is clear that the greatest current danger is the ability to fight initial fires (A3), the fire resistance of building materials (C3), fire rescue capacity (D5), building fire load (C1), and the electricity situation of residents (A1). This danger is mainly caused by the architectural features and the environment of the Hexinwu Building Complex and most ancient vernacular residences in ancient villages. These vernacular residences are often located in remote areas, leading to delayed response times for fire rescues. In addition to limited awareness of fire safety and nonstandard use of electricity, these buildings are highly flammable and densely packed, making them much more susceptible to fires compared to high-rise buildings. Therefore, for the conservation of ancient villages, it is necessary to use new materials to establish adequate fireproof layers, improve the fire resistance rating of buildings, and implement cost-effective automatic fire protection facilities. For example, automatic fire alarms, fire extinguishing systems, and electrical monitoring can reduce the risk of heritage loss. The use of technologies such as the Internet of Things, artificial intelligence, and information from cell phone apps can enhance the firewall protection of heritage buildings.

6. Conclusions

This study conducted a fire risk assessment based on FAHP and EWM for the Hexinwu Building Complex in Guangdong province, which has heritage value. Combining the results of the entropy and fuzzy evaluation methods leads to a comprehensive assessment of fire risk in ancient buildings. This comprehensive assessment provides a more comprehensive and objective risk assessment that considers both quantitative and qualitative factors, as well as their relative importance. The simultaneous use of these two methods helps to synthesize multiple factors to provide a more comprehensive assessment of the fire risk of ancient buildings and to provide more accurate decision support. The methodology can also be adapted and customized to suit specific ancient building situations and different contexts and needs.
In an effort to reduce the subjectivity of the evaluation, a qualitative and quantitative safety level evaluation was undertaken, along with identifying important fire risk factors. Through fieldwork, expert interviews, and analysis of the actual situation of ancient villages, a framework consisting of 20 sub-indicators was identified for four evaluation systems based on human factors, facility factors, environmental factors, and social management factors from the viewpoint of operability and comprehensiveness. The results of the study provide a basic approach for reducing and controlling building fires in ancient villages.
Ancient village buildings have important historical and cultural values as cultural heritage, and there is a trade-off between fire risk and cultural values in fire assessment. Combining the fuzzy evaluation method and the EWM in assessing fire risk in ancient village buildings brings advantages such as comprehensive assessment, improved objectivity, handling uncertainty, adaptability to complex situations, and methodological rigor. The approach serves as a good demonstration of how to balance the preservation of cultural heritage while effectively assessing and reducing fire risk.
This study reveals the holistic fire hazards of architecturally preserved heritage villages. The proportion of human causes in ancient villages is as high as 29% relative to the fire risk factors in high-rise residential and commercial plazas. This provides insights for improving the assessment framework of fire risk in ancient village buildings and further research on potential fire hazards in ancient residences, as well as providing policymakers with references for effective management of fires in the Nanyue ancient road complex.
We have not taken into account the overall layout characteristics of the Hakka architectural complexes and anthropological factors, as well as the consideration of local climate and wind conditions for the evaluation model. Additionally, the evaluation was conducted from a static perspective without incorporating dynamic data, which lacks a long-term perspective. In the future, the utilization of three-dimensional scanning and point cloud modeling may provide more detailed information to assist in risk assessment.

Author Contributions

Conceptualization, G.L. (Guokai Li), H.Y. and A.G.; Formal analysis, Y.S., G.L. (Guiye Lin) and G.X.; Funding acquisition, H.Y.; Investigation, G.L. (Guiye Lin); Methodology, G.L. (Guokai Li) and G.X.; Supervision, A.G.; Validation, G.L. (Guokai Li); Writing—original draft, G.L. (Guokai Li); Writing—review and editing, H.Y., Y.S. and A.G. All authors have read and agreed to the published version of the manuscript.

Funding

The study was supported by The National Social Science Fund of China (Grant Number: 20BGL187).

Institutional Review Board Statement

Not applicable.

Informed Consent Statement

Not applicable.

Data Availability Statement

The data presented in this study can be found in Appendix A of the article.

Conflicts of Interest

The authors declare that they have no known competing financial interests or personal relationships that could have appeared to influence the work reported in this research.

Appendix A

Table A1. Expert scoring table of triangular fuzzy numbers for the four system indicators.
ABCD
A1.001.001.001.001.502.000.501.001.500.501.001.50
B0.500.671.001.001.001.000.671.002.000.500.671.00
C0.671.002.000.501.001.501.001.001.000.671.002.00
D0.671.002.001.001.502.000.501.001.501.001.001.00
ABCD
A1.001.001.001.001.502.001.001.502.000.501.001.50
B0.500.671.001.001.001.000.500.671.000.500.671.00
C0.500.671.001.001.502.001.001.001.000.500.671.00
D0.671.002.001.001.502.001.001.502.001.001.001.00
ABCD
A1.001.001.001.502.002.502.503.003.501.001.502.00
B0.400.500.671.001.001.000.500.671.000.330.400.50
C0.330.400.501.001.502.001.001.001.000.500.671.00
D0.500.671.002.002.503.001.001.502.001.001.001.00
Table A2. Expert scoring table of triangular fuzzy numbers of sub-indicators A1–A5.
A1A2A3A4A5
A11.0001.0001.0000.4000.5000.6670.2860.3330.400 0.400 0.500 0.667 0.400 0.500 0.667
A2 1.500 2.000 2.500 1.0001.0001.000 0.400 0.500 0.667 0.500 0.667 1.000 0.500 1.000 1.500
A3 2.500 3.000 3.500 1.500 2.000 2.500 1.0001.0001.000 1.500 2.000 2.500 2.000 2.500 3.000
A4 1.500 2.000 2.500 1.000 1.500 2.000 0.400 0.500 0.667 1.0001.0001.000 0.500 1.000 1.500
A5 1.500 2.000 2.500 0.667 1.000 2.000 0.333 0.400 0.500 0.667 1.000 2.000 1.0001.0001.000
A1A2A3A4A5
A11.0001.0001.000 0.500 0.667 1.000 0.333 0.400 0.500 0.333 0.400 0.500 0.400 0.500 0.667
A2 1.000 1.500 2.000 1.0001.0001.000 0.500 0.667 1.000 0.667 1.000 2.000 0.500 1.000 1.500
A3 2.000 2.500 3.000 1.000 1.500 2.000 1.0001.0001.000 1.000 1.500 2.000 1.500 2.000 2.500
A4 2.000 2.500 3.000 0.500 1.000 1.500 0.500 0.667 1.000 1.0001.0001.000 1.000 1.500 2.000
A5 1.500 2.000 2.500 0.500 0.667 1.000 0.400 0.500 0.667 0.500 0.667 1.000 1.0001.0001.000
A1A2A3A4A5
A11.0001.0001.000 0.333 0.400 0.500 0.333 0.400 0.500 0.400 0.500 0.667 0.500 0.667 1.000
A2 2.000 2.500 3.000 1.0001.0001.000 0.667 1.000 2.000 0.500 0.667 1.000 1.000 1.500 2.000
A3 2.000 2.500 3.000 0.500 1.000 1.500 1.0001.0001.000 2.000 2.500 3.000 1.500 2.000 2.500
A4 1.500 2.000 2.500 1.000 1.500 2.000 0.333 0.400 0.500 1.0001.0001.000 0.500 1.000 1.500
A5 1.000 1.500 2.000 0.500 0.667 1.000 0.400 0.500 0.667 0.667 1.000 2.000 1.0001.0001.000
Table A3. Table of calculated A1–A5 integrated triangular fuzzy numbers.
A1A2A3A4A5
A11.0001.0001.0000.3330.5111.0000.2860.3760.5000.3330.4640.6670.4000.5501.000
A21.0001.9573.0001.0001.0001.0000.4000.6932.0000.5000.7632.0000.5001.1452.000
A32.0002.6573.5000.5001.4422.5001.0001.0001.0001.0001.9573.0001.5002.1543.000
A41.5002.1543.0000.5001.3102.0000.3330.5111.0001.0001.0001.0000.5001.1452.000
A51.0001.8172.5000.5000.7632.0000.3330.4640.6670.5000.8742.0001.0001.0001.000
Table A4. Defuzzification of the resulting matrix for A1-A5.
U1=[1.0000.5890.3850.4820.625
1.9791.0000.9471.0071.198
2.7041.4711.0001.9792.202
2.2021.2800.5891.0001.198
1.7841.0070.4821.0621.000]
Calculation results: Y m a x = 5.372 ,   C I = 0.0926 ,   C R = 0.0831 < 0.1 .
Table A5. TFN values and Weight for A1–A5.
S1S2S3S4S5
TFN(0.053, 0.101, 0.220)(0.077, 0.194, 0.529)(0.135, 0.321, 0.687)0.086, 0.213, 0.476)(0.075, 0.171, 0.432)
S1S2S3S4S5
TFN(0.053, 0.101, 0.220)(0.077, 0.194, 0.529)(0.135, 0.321, 0.687)0.086, 0.213, 0.476)(0.075, 0.171, 0.432)
Sub-IndicatorsA1A2A3A4A5
W0.0810.2180.2890.2200.192
Table A6. Expert scoring table of triangular fuzzy numbers of sub-indicators B1–B5.
B1B2B3B4B5
B11.0001.0001.0000.4000.5000.6670.6671.0002.0000.5001.0001.5000.4000.5000.667
B21.5002.0002.5001.0001.0001.0000.5001.0001.5002.5003.0003.5001.5002.0002.500
B30.5001.0001.5000.6671.0002.0001.0001.0001.0002.5003.0003.5002.5003.0003.500
B40.6671.0002.0000.2860.3330.4000.2860.3330.4001.0001.0001.0000.5001.0001.500
B51.5002.0002.5000.4000.5000.6670.2860.3330.4000.6671.0002.0001.0001.0001.000
B1B2B3B4B5
B11.0001.0001.0000.5000.6671.0000.5000.6671.0001.0001.5002.0000.5000.6671.000
B21.0001.5002.0001.0001.0001.0000.5000.6671.0002.0002.5003.0001.5002.0002.500
B31.0001.5002.0001.0001.5002.0001.0001.0001.0002.5003.0003.5002.5003.0003.500
B40.5000.6671.0000.3330.4000.5000.2860.3330.4001.0001.0001.0000.5000.6671.000
B51.0001.5002.0000.4000.5000.6670.2860.3330.4001.0001.5002.0001.0001.0001.000
B1B2B3B4B5
B11.0001.0001.0000.4000.5000.6670.5000.6671.0001.0001.5002.0000.4000.5000.667
B21.5002.0002.5001.0001.0001.0000.6671.0002.0001.0001.5002.0002.0002.5003.000
B3 1.000 1.500 2.000 1.000 1.500 2.000 1.0001.0001.000 2.000 2.500 3.000 1.500 2.000 2.500
B4 0.500 0.667 1.000 0.500 0.667 1.000 0.333 0.400 0.500 1.0001.0001.000 0.333 0.400 0.500
B5 1.500 2.000 2.500 0.333 0.400 0.500 0.400 0.500 0.667 1.500 2.000 2.500 1.0001.0001.000
Table A7. Table of calculated B1–B5 integrated triangular fuzzy numbers.
B1B2B3B4B5
B11.0001.0001.0000.4000.5501.0000.5000.7632.0000.5001.3102.0000.4000.5501.000
B21.0001.8172.5001.0001.0001.0000.5000.8742.0001.0002.2413.5001.5002.1543.000
B30.5001.3102.0000.6671.3102.0001.0001.0001.0002.0002.8233.5001.5002.6213.500
B40.5000.7632.0000.2860.4461.0000.2860.3540.5001.0001.0001.0000.3330.6441.500
B51.0001.8172.5000.3330.4640.6670.2860.3820.6670.6671.4422.5001.0001.0001.000
Table A8. Defuzzification of the resulting matrix for B1–B5.
U2=[1.0000.6251.0071.2800.625
1.7841.0001.0622.2462.202
1.2801.3221.0002.7872.561
1.0070.5450.3741.0000.780
1.7840.4820.4291.5131.000]
Calculation results: Y m a x = 5.425 ,   C I = 0.1062 ,   C I = 0.0948 < 0.1 .
Table A9. TFN values and Weight for B1–B5.
S1S2S3S4S5
TFN(0.063, 0.141, 0.365)(0.113, 0.273, 0.626)(0.128, 0.306, 0.626)(0.054, 0.108, 0.313)(0.074, 0.172, 0.383)
Sub-IndicatorsB1B2B3B4B5
W0.1610.2560.2730.1320.179
Table A10. Expert scoring table of triangular fuzzy numbers of sub-indicators C1–C5.
C1C2C3C4C5
C11.0001.0001.0000.5001.0001.5000.5001.0001.5001.5002.0002.5002.0002.5003.000
C20.6671.0002.0001.0001.0001.0000.5000.6671.0000.5001.0001.5001.5002.0002.500
C30.6671.0002.0001.0001.5002.0001.0001.0001.0002.0002.5003.0002.5003.0003.500
C40.4000.5000.6670.6671.0002.0000.3330.4000.5001.0001.0001.0001.5002.0002.500
C50.3330.4000.5000.4000.5000.6670.2860.3330.4000.4000.5000.6671.0001.0001.000
C1C2C3C4C5
C11.0001.0001.0001.5002.0002.5000.5000.6671.0001.0001.5002.0002.5003.0003.500
C20.4000.5000.6671.0001.0001.0000.3330.4000.5000.5001.0001.5002.0002.5003.000
C31.0001.5002.0002.0002.5003.0001.0001.0001.0001.5002.0002.5002.0002.5003.000
C40.5000.6671.0000.6671.0002.0000.4000.5000.6671.0001.0001.0002.0002.5003.000
C50.2860.3330.4000.3330.4000.5000.3330.4000.5000.3330.4000.5001.0001.0001.000
Table A11. Table of calculated C1–C5 integrated triangular fuzzy numbers.
C1C2C3C4C5
C11.0001.0001.0000.5001.2602.5000.5000.8741.5001.0001.8172.5002.0002.6573.500
C20.4000.7942.0001.0001.0001.0000.3330.5621.0000.5001.0001.5001.5002.1543.000
C30.6671.1452.0001.0001.7783.0001.0001.0001.0001.5002.3213.0002.0002.8233.500
C40.4000.5501.0000.6671.0002.0000.3330.4310.6671.0001.0001.0001.5002.1543.000
C50.2860.3760.5000.3330.4640.6670.2860.3540.5000.3330.4640.6671.0001.0001.000
Table A12. Defuzzification of the resulting matrix for C1–C5.
U3=[1.0001.3800.9371.7842.704
0.9971.0000.6141.0002.202
1.2391.8891.0002.2862.787
0.6251.1670.4661.0002.202
0.3850.4820.3740.4821.000]
Calculation results: Y m a x = 5.2784 ,   C I = 0.0696 ,   C I = 0.0621 < 0.1 .
Table A13. TFN values and Weight for C1–C5.
S1S2S3S4S5
TFN(0.116, 0.254, 0.523)(0.087, 0.184, 0.404)(0.143, 0.302, 0.594)(0.091, 0.171, 0.364)(0.052, 0.089, 0.158)
Sub-IndicatorsC1C2C3C4C5
W0.2710.2100.3060.1920.020
Table A14. Expert scoring table of triangular fuzzy numbers of sub-indicators D1–D5.
D1D2D3D4D5
D11.0001.0001.0000.6671.0002.0000.5000.6671.0001.0001.5002.0000.4000.5000.667
D20.5001.0001.5001.0001.0001.0000.6671.0002.0001.5002.0002.5000.4000.5000.667
D31.0001.5002.0000.5001.0001.5001.0001.0001.0002.0002.5003.0000.5000.6671.000
D40.5000.6671.0000.4000.5000.6670.3330.4000.5001.0001.0001.0000.3330.4000.500
D51.5002.0002.5001.5002.0002.5001.0001.5002.0002.0002.5003.0001.0001.0001.000
D1D2D3D4D5
D11.0001.0001.0000.6671.0002.0000.5000.6671.0001.5002.0002.5000.3330.4000.500
D20.5001.0001.5001.0001.0001.0000.6671.0002.0001.5002.0002.5000.3330.4000.500
D31.0001.5002.0000.5001.0001.5001.0001.0001.0002.0002.5003.0000.4000.5000.667
D40.4000.5000.6670.4000.5000.6670.3330.4000.5001.0001.0001.0000.3330.4000.500
D52.0002.5003.0002.0002.5003.0001.5002.0002.5002.0002.5003.0001.0001.0001.000
D1D2D3D4D5
D11.0001.0001.0000.5000.6671.0000.4000.5000.6672.0002.5003.0000.2860.3330.400
D21.0001.5002.0001.0001.0001.0000.4000.5000.6672.0002.5003.0002.0002.5003.000
D31.5002.0002.5001.5002.0002.5001.0001.0001.0001.5002.0002.5000.3330.4000.500
D40.3330.4000.5000.3330.4000.5000.4000.5000.6671.0001.0001.0000.2860.3330.400
D52.0002.5003.0002.5003.0003.5002.0002.5003.0002.5003.0003.5001.0001.0001.000
Table A15. Table of calculated D1–D5 integrated triangular fuzzy numbers.
D1D2D3D4D5
D11.0001.0001.0000.5000.8742.0000.4000.6061.0001.0001.9573.0000.2860.4050.667
D20.5001.1452.0001.0001.0001.0000.4000.7942.0001.5002.1543.0000.3330.7943.000
D31.0001.6512.5000.5001.2602.5001.0001.0001.0001.5002.3213.0000.3330.5111.000
D40.3330.5111.0000.3330.4640.6670.3330.4310.6671.0001.0001.0000.2860.3760.500
D51.5002.3213.0001.5002.4663.5001.0001.9573.0002.0002.6573.5001.0001.0001.000
Table A16. Defuzzification of the resulting matrix for D1–D5.
U4=[1.0001.0620.6531.9790.441
1.1981.0000.9972.2021.230
1.7011.3801.0002.2860.589
0.5890.4820.3661.0000.385
1.9862.1831.6792.5041.000]
Calculation results: Y m a x = 5.4352 , C I = 0.1088 , C I = 0.0971 < 0.1
Table A17. TFN values and Weight for D1–D5.
S1S2S3S4S5
TFN(0.069, 0.158, 0.373)(0.080, 0.192, 0.536)(0.093, 0.220, 0.487)(0.049, 0.091, 0.187)(0.151, 0.339, 0.682)
Sub-IndicatorsD1D2D3D4D5
W0.1760.2300.2350.0400.319
Table A18. Value of sub-factors evaluation based on Security classification.
Sub-FactorsExpert 1Expert 2Expert 3Expert 4Expert 5Average ScoreWeight
A16.56.05.57.07.06.40.0422
A25.04.54.05.53.54.50.0466
A37.07.07.56.56.56.90.0806
A46.04.55.56.05.55.50.0344
A55.04.56.06.05.55.40.0422
B13.53.03.03.52.53.10.0396
B25.04.04.53.53.54.10.0846
B35.56.05.07.05.55.80.0561
B47.07.57.06.07.06.90.0340
B56.56.06.57.07.06.60.0396
C16.05.56.06.57.06.20.0470
C27.06.57.06.07.06.70.0364
C36.56.06.57.06.06.40.0806
C47.06.58.07.58.07.40.0422
C53.02.53.03.03.53.00.0392
D17.06.57.05.56.06.40.0422
D27.06.56.07.06.56.60.0396
D35.05.57.06.57.06.20.0457
D47.05.56.57.06.56.50.0344
D56.04.55.04.04.04.70.0925

References

  1. Fu, J.; Zhou, J.; Deng, Y. Heritage values of ancient vernacular residences in traditional villages in Western Hunan, China: Spatial patterns and influencing factors. Build. Environ. 2021, 188, 107473. [Google Scholar] [CrossRef]
  2. İpekoğlu, B. An architectural evaluation method for conservation of traditional dwellings. Build. Environ. 2006, 41, 386–394. [Google Scholar] [CrossRef]
  3. Li, J.; Li, H.; Zhou, B.; Wang, X.; Zhang, H. Investigation and Statistical Analysis of Fire Loads of 83 Historic Buildings in Beijing. Int. J. Archit. Herit. 2020, 14, 471–482. [Google Scholar] [CrossRef]
  4. Huang, Y.; Li, E.; Xiao, D. Conservation Key points and management strategies of historic villages: 10 cases in the Guangzhou and Foshan Area, Guangdong Province, China. J. Asian Archit. Build. Eng. 2022, 21, 1320–1331. [Google Scholar] [CrossRef]
  5. Chu, G.; Sun, J. Decision analysis on fire safety design based on evaluating building fire risk to life. Saf. Sci. 2008, 46, 1125–1136. [Google Scholar] [CrossRef]
  6. China Fire. The National Fire Situation in 2020 to Remain Stable. 2021. Available online: http://www.china-fire.com/article/show-4712.html (accessed on 28 January 2020).
  7. Luo, Y.X.; Li, Q.; Jiang, L.R.; Zhou, Y.H. Analysis of Chinese fire statistics during the period 1997–2017. Fire Saf. J. 2021, 125, 103400. [Google Scholar] [CrossRef]
  8. United States Fire Administration. A Profile of Fire in the United States 2003–2007, 15th ed.; United States Fire Administration: Emmitsburg, MD, USA, 2009; p. 4. Available online: https://www.usfa.fema.gov/downloads/pdf/publications/fa_325.pdf (accessed on 20 October 2009).
  9. Tao, J.; Chen, H.; Xiao, D. Influences of the natural environment on traditional settlement patterns: A case study of Hakka traditional settlements in Eastern Guangdong Province. J. Asian Archit. Build. Eng. 2017, 16, 9–14. [Google Scholar] [CrossRef]
  10. Li, S.Y.; Tao, G.; Zhang, L.J. Fire risk assessment of high-rise buildings based on gray-FAHP mathematical model. Procedia Eng. 2018, 211, 395–402. [Google Scholar] [CrossRef]
  11. Yuan, C.; He, Y.; Feng, Y.; Wang, P. Fire hazards in heritage villages: A case study on Dangjia Village in China. Int. J. Disaster Risk Reduct. 2018, 28, 748–757. [Google Scholar] [CrossRef]
  12. Zhang, F.; Shi, L.; Liu, S.; Shi, J.; Zhang, J. CFD-based framework for fire risk assessment of contiguous wood-frame villages in the western Hunan region. J. Build. Eng. 2022, 54, 104607. [Google Scholar] [CrossRef]
  13. Salazar, L.G.F.; Romão, X.; Paupério, E. Review of vulnerability indicators for fire risk assessment in cultural heritage. Int. J. Disaster Risk Reduct. 2021, 60, 102286. [Google Scholar] [CrossRef]
  14. Yang, L.Z.; Chen, H.; Yang, Y.; Fang, T.Y. The effect of socioeconomic factors on fire in China. J. Fire Sci. 2005, 23, 451–467. [Google Scholar]
  15. Ouache, R.; Bakhtavar, E.; Hu, G.; Hewage, K.; Sadiq, R. Evidential reasoning and machine learning-based framework for assessment and prediction of human error factors-induced fire incidents. J. Build. Eng. 2022, 49, 104000. [Google Scholar] [CrossRef]
  16. Maxim, P.; Plecas, D.; Garis, L. Report on the Feasibility of a Canadian National Fire Information Database; Centre for Public Safety and Criminal Justice Research, University of the Fraser Valley: Abbotsford, BC, Canada, 2013. [Google Scholar]
  17. Congress, USA. Federal Fire Prevention and Control Act of 1974. Public Law 2013, 93–498. Available online: https://www.nixonlibrary.gov/finding-aids/fg-170-national-commission-fire-prevention-and-control-white-house-central-files (accessed on 23 October 2014).
  18. Yung, D.; Hadjisophocleous, G.V.; Proulx, G.; Kyle, B.R. Cost-effective fire-safety upgrade options for a Canadian government office building. In Proceedings of the International Conference on Performance-Based Codes and Fire Safety Design Methods, Ottawa, ON, Canada, 24–26 September 1996; pp. 24–26. [Google Scholar]
  19. GB 50016-2014; Code for Fire Protection Design of Buildings. Ministry of Housing and Urban-Rural Development: Beijing, China, 2014. Available online: https://www.chinesestandard.net/PDF.aspx/GB50016-2014 (accessed on 23 October 2014).
  20. Zhang, Y.; Shen, L.; Ren, Y.; Wang, J.; Liu, Z.; Yan, H. How fire safety management attended during the urbanization process in China? J. Clean. Prod. 2019, 236, 117686. [Google Scholar] [CrossRef]
  21. Crippa, C.; Fiorentini, L.; Rossini, V.; Stefanelli, R.; Tafaro, S.; Marchi, M. Fire risk management system for safe operation of large atmospheric storage tanks. J. Loss Prev. Process Ind. 2009, 22, 574–581. [Google Scholar] [CrossRef]
  22. Su, L.; Yang, F.; Shen, Y.; Yang, Z. Electrical fire risk assessment of high-rise buildings based on hybrid decision model considering asymmetric proximity. Fire Mater. 2022, 47, 285–293. [Google Scholar] [CrossRef]
  23. Li, Y.; Li, Y.; Wu, Q.; Lu, X.; Han, L. Comprehensive Evaluation of Fire Risk for High-Rise Civil Buildings Based on Fuzzy Analytic Hierarchy Process. In Proceedings of the 2019 IEEE 11th International Conference on Advanced Infocomm Technology (ICAIT), Jinan, China, 18–20 October 2019; pp. 179–185. [Google Scholar]
  24. Wang, L.; Li, W.; Feng, W.; Yang, R. Fire risk assessment for building operation and maintenance based on BIM technology. Build. Environ. 2021, 205, 108188. [Google Scholar] [CrossRef]
  25. Li, W.; Li, H.; Liu, Y.; Wang, S.; Pei, X.; Li, Q. Fire risk assessment of high-rise buildings under construction based on unascertained measure theory. PLoS ONE 2020, 15, e0239166. [Google Scholar] [CrossRef]
  26. Durak, S.; Erbil, Y.; Akıncıtürk, N. Sustainability of an Architectural Heritage Site in Turkey: Fire Risk Assessment in Misi Village. Int. J. Archit. Herit. 2011, 5, 334–348. [Google Scholar] [CrossRef]
  27. Kodur, V.; Dwaikat, M.; Fike, R. High-temperature properties of steel for fire resistance modeling of structures. J. Mater. Civ. Eng. 2010, 22, 423–434. [Google Scholar] [CrossRef]
  28. Bastami, M.; Aslani, F. Preloaded high-temperature constitutive models and relationships for concrete. Trans. A Civ. Eng. 2010, 17, 11–25. [Google Scholar]
  29. Saaty, T.L. What is the analytic hierarchy process? In Mathematical Models for Decision Support; Springer: Berlin/Heidelberg, Germany, 1988; pp. 109–121. [Google Scholar]
  30. Ren, S. Assessment on logistics warehouse fire risk based on analytic hierarchy process. Procedia Eng. 2012, 45, 59–63. [Google Scholar] [CrossRef]
  31. Lee, C.A.; Sung, Y.C.; Lin, Y.S.; Hsiao, G.L.K. Evaluating the severity of building fires with the analytical hierarchy process, big data analysis, and remote sensing. Nat. Hazards 2020, 103, 1843–1856. [Google Scholar] [CrossRef]
  32. Zou, Q.; Zhang, T.; Liu, W. A fire risk assessment method based on the combination of quantified safety checklist and structure entropy weight for shopping malls. Proc. Inst. Mech. Eng. Part O J. Risk Reliab. 2021, 235, 610–626. [Google Scholar] [CrossRef]
  33. Liu, F.; Zhao, S.; Weng, M.; Liu, Y. Fire risk assessment for large-scale commercial buildings based on structure entropy weight method. Saf. Sci. 2017, 94, 26–40. [Google Scholar] [CrossRef]
  34. Guan, Y.X.; Fang, Z.; Wang, T.R. Fire risk assessment and daily maintenance management of cultural relic buildings based on ZigBee technology. Procedia Eng. 2018, 211, 192–198. [Google Scholar] [CrossRef]
  35. Tancogne-Dejean, M.; Laclémence, P. Fire risk perception and building evacuation by vulnerable persons: Points of view of laypersons, fire victims and experts. Fire Saf. J. 2016, 80, 9–19. [Google Scholar] [CrossRef]
  36. Akashah, F.W.; Ouache, R.; Zhang, J.; Delichatsios, M. A model for quantitative fire risk assessment integrating agent-based model with automatic event tree analysis. In Handbook of Probabilistic Models; Elsevier: Amsterdam, The Netherlands, 2020; pp. 107–129. [Google Scholar]
  37. Risco, G.V.; Zania, V.; Giuliani, L. Numerical assessment of post-earthquake fire response of steel buildings. Saf. Sci. 2023, 157, 105921. [Google Scholar] [CrossRef]
  38. Gulum, P.; Ayyildiz, E.; Taskin Gumus, A. A two-level interval valued neuromorphic AHP integrated TOPSIS methodology for post-earthquake fire risk assessment: An application for Istanbul. Int. J. Disaster Risk Reduct. 2021, 61, 102330. [Google Scholar] [CrossRef]
  39. Ding, Y.; Weng, F.; Jin, P.Y. Applying BP neural network in high-rising buildings fire risk assessment. In Proceedings of the 2011 3rd International Conference on Advanced Computer Control, Harbin, China, 18–20 January 2011. [Google Scholar]
  40. Wang, N.; Gao, Y.; Li, C.-Y.; Gai, W.-M. Integrated agent-based simulation and evacuation risk-assessment model for underground building fire: A case study. J. Build. Eng. 2021, 40, 102609. [Google Scholar] [CrossRef]
  41. Mi, H.; Liu, Y.; Wang, W.; Xiao, G. An Integrated Method for Fire Risk Assessment in Residential Buildings. Math. Probl. Eng. 2020, 2020, 9392467. [Google Scholar] [CrossRef]
  42. Roshan, S.A. Fire risk assessment and its economic loss estimation in Tehran subway, applying Event Tree Analysis. Iran. J. Health Saf. Environ. 2015, 2, 229–234. [Google Scholar]
  43. Sun, B.; Xiao, R. Bridge fire risk assessment system based on analytic hierarchy process-fuzzy comprehensive evaluation method. J. Tongji Univ. 2015, 43, 1619–1625. [Google Scholar]
  44. Kubler, S.; Robert, J.; Derigent, W.; Voisin, A.; Le Traon, Y. A state-of the-art survey & testbed of fuzzy AHP (FAHP) applications. Expert Syst. Appl. 2016, 65, 398–422. [Google Scholar]
  45. Van Laarhoven, P.J.; Pedrycz, W. A fuzzy extension of Saaty’s priority theory. Fuzzy Sets Syst. 1983, 11, 229–241. [Google Scholar] [CrossRef]
  46. Saaty, T.L. Multicriteria Decision Making: The Analytic Hierarchy Process: Planning, Priority Setting Resource Allocation; RWS Publications: Pittsburgh, PA, USA, 1980. [Google Scholar]
  47. Bakır, M.; Atalık, Ö. Application of fuzzy AHP and fuzzy MARCOS approach for the evaluation of e-service quality in the airline industry. Decis. Mak. Appl. Manag. Eng. 2021, 4, 127–152. [Google Scholar] [CrossRef]
  48. Bozbura, F.T.; Beskese, A.; Kahraman, C. Prioritization of human capital measurement indicators using fuzzy AHP. Expert Syst. Appl. 2007, 32, 1100–1112. [Google Scholar] [CrossRef]
  49. Cheng, C.H. Evaluating naval tactical missile systems by fuzzy AHP based on the grade value of membership function. Eur. J. Oper. Res. 1997, 96, 343–350. [Google Scholar] [CrossRef]
  50. Heo, E.; Kim, J.; Boo, K.J. Analysis of the assessment factors for renewable energy dissemination program evaluation using fuzzy AHP. Renew. Sustain. Energy Rev. 2010, 14, 2214–2220. [Google Scholar] [CrossRef]
  51. Chang, D.Y. Extent analysis and synthetic decision. Optim. Tech. Appl. 1992, 1, 352–355. [Google Scholar]
  52. Chang, D.Y. Applications of the extent analysis method on fuzzy AHP. Eur. J. Oper. Res. 1996, 95, 649–655. [Google Scholar] [CrossRef]
  53. Moussaoui, F.; Cherrared, M.; Kacimi, M.A.; Belarbi, R. A genetic algorithm to optimize consistency ratio in AHP method for energy performance assessment of residential buildings—Application of top-down and bottom-up approaches in Algerian case study. Sustain. Cities Soc. 2018, 42, 622–636. [Google Scholar] [CrossRef]
  54. Bascetin, A. A decision support system using analytical hierarchy process (AHP) for the optimal environmental reclamation of an open-pit mine. Environ. Geol. 2007, 52, 663–672. [Google Scholar] [CrossRef]
  55. Meacham, B.J.; Charters, D.; Johnson, P.; Salisbury, M. Building fire risk analysis. In SFPE Handbook of Fire Protection Engineering; Springer: Berlin/Heidelberg, Germany, 2016; pp. 2941–2991. [Google Scholar]
  56. Van Weyenberge, B.; Deckers, X.; Caspeele, R.; Merci, B. Development of an integrated risk assessment method to quantify the life safety risk in buildings in case of fire. Fire Technol. 2019, 55, 1211–1242. [Google Scholar] [CrossRef]
  57. Watts, J.M.; Hall, J.R. Introduction to fire risk analysis. In SFPE Handbook of Fire Protection Engineering; Springer: Berlin/Heidelberg, Germany, 2016; pp. 2817–2826. [Google Scholar]
  58. Subramaniam, C. Human factors influencing fire safety measures. Disaster Prev. Manag. Int. J. 2004, 13, 110–116. [Google Scholar] [CrossRef]
  59. Chuvieco, E.; Justice, C. Relations between human factors and global fire activity. In Advances in Earth Observation of Global Change; Springer: Berlin/Heidelberg, Germany, 2010; pp. 187–199. [Google Scholar]
  60. Krawchuk, M.A.; Moritz, M.A. Fire regimes of China: Inference from statistical comparison with the United States. Glob. Ecol. Biogeogr. 2009, 18, 626–639. [Google Scholar] [CrossRef]
  61. Wang, S.H.; Wang, W.C.; Wang, K.C.; Shih, S.Y. Applying building information modeling to support fire safety management. Autom. Constr. 2015, 59, 158–167. [Google Scholar] [CrossRef]
  62. Chung, J.H.; Han, Y.T. Accomplishment Analysis of the Fire Fighting and Safety Research Development Program Supported by Ministry of Public Safety and Security (2012–2014). Fire Sci. Eng. 2016, 30, 141–147. [Google Scholar] [CrossRef]
  63. Kim, J.N.; Kong, H.S. Multivariate Analysis of Fire Prevention Activities, Special Investigations of Fire Safety, and Fire Safety Management by the Apartment Buildings Management Methods and Inspection of Firefighting Facilities. J. Converg. Cult. Technol. 2020, 6, 489–502. [Google Scholar]
  64. Guo, Q.; Shi, K.; Jia, Z.; Jeffers, A.E. Probabilistic Evaluation of Structural Fire Resistance. Fire Technol. 2013, 49, 793–811. [Google Scholar] [CrossRef]
  65. Nishino, T.; Tanaka, T.; Hokugo, A. An evaluation method for the urban post-earthquake fire risk considering multiple scenarios of fire spread and evacuation. Fire Saf. J. 2012, 54, 167–180. [Google Scholar] [CrossRef]
  66. Alvarez, A.; Meacham, B.; Dembsey, N.; Thomas, J. A framework for risk-informed performance-based fire protection design for the built environment. Fire Technol. 2014, 50, 161–181. [Google Scholar] [CrossRef]
  67. GB50039-2010; National Standard Rural Fire Code. Ministry of Housing and Urban-Rural Development: Beijing, China, 2010. Available online: https://www.mohurd.gov.cn/gongkai/fdzdgknr/tzgg/201906/20190610_240815.html (accessed on 7 April 2009).
  68. Nimlyat, P.S.; Audu, A.U.; Ola-Adisa, E.O.; Gwatau, D. An evaluation of fire safety measures in high-rise buildings in Nigeria. Sustain. Cities Soc. 2017, 35, 774–785. [Google Scholar] [CrossRef]
Figure 1. Location and information of the Hexinwu Building Complex, China.
Applsci 13 12368 g001aApplsci 13 12368 g001b
Figure 2. Framework of fire risk assessment.
Applsci 13 12368 g002
Figure 3. Indicator weighting values.
Applsci 13 12368 g003
Figure 4. Sub-index factor weights.
Applsci 13 12368 g004
Figure 5. Fire risk score for the He Xin Estate sub-index.
Applsci 13 12368 g005
Table 1. Linguistic scales and fuzzy scales for importance.
Linguistic ScaleTriangular Fuzzy ScaleTriangular Fuzzy Reciprocal Scale
Just equal(1, 1, 1)(1, 1, 1)
Equally important(1/2, 1, 3/2)(2/3, 1, 2)
Weakly more important(1, 3/2, 2)(1/2, 2/3, 1)
Strongly more important(3/2, 2, 5/2)(2/5, 1/2, 2/3)
Very strongly more important(2, 5/2, 3)(1/3, 2/5, 1/2)
Absolutely more important(5/2, 3, 7/2)(2/7, 1/3, 2/5)
Table 2. The value of RI.
n12345678
RI000.520.891.121.261.361.41
Table 3. Security classification.
GradeIIIIIIIVV
DescriptionVery safeMore safeWeakly safeMore dangerousVery dangerous
Fire safety is in very good condition and very low risk of fireGood fire safety with low risk of fireAverage fire safety, with some degree of fire riskPoor fire safety condition, a greater risk of fireVery poor fire safety and high fire risk
Scoring Criteria[0, 1][1–3][3–5][5–7][7–9]
Table 4. Comparison matrix of indicator factors.
ABCD
A(1, 1, 1)(1, 1.65, 2.5)(0.5, 1.65, 3.5)(0.5, 1.14, 2)
B(0.4, 0.61, 1)(1, 1, 1)(0.5, 1.65, 3.5)(0.33, 0.56, 1)
C(0.33, 0.64, 2)(0.5, 1.31, 2)(1, 1, 1)(0.5, 0.76, 2)
D(0.5, 0.87, 2)(1, 1.78, 3)(0.5, 1.31, 2)(1, 1, 1)
Disclaimer/Publisher’s Note: The statements, opinions and data contained in all publications are solely those of the individual author(s) and contributor(s) and not of MDPI and/or the editor(s). MDPI and/or the editor(s) disclaim responsibility for any injury to people or property resulting from any ideas, methods, instructions or products referred to in the content.

