Article

A New Approach of Well Productivity Evaluation for Fractured Buried Hill Gas Reservoirs Based on Imaging Logging Data

College of Geosciences, Yangtze University, Wuhan 430100, China
*
Author to whom correspondence should be addressed.
Appl. Sci. 2023, 13(22), 12328; https://doi.org/10.3390/app132212328
Submission received: 23 October 2023 / Revised: 8 November 2023 / Accepted: 13 November 2023 / Published: 15 November 2023
(This article belongs to the Special Issue Geomechanics and Reservoir Simulation)

Abstract

:
Fractures function as storage spaces and effective seepage channels for metamorphic rock buried hill reservoirs. Their effectiveness and permeability govern the content and enrichment of oil and gas. Owing to the convoluted distribution patterns of fractures, it is arduous to gauge the effectiveness and permeability of fractures with precision, thus rendering well productivity prediction difficult. This article cites fractured gas reservoirs in a metamorphic rock buried hill as an example. Through comprehensive usage of core and imaging logging data to finely interpret fractures, calculate the fracture parameters that control productivity, including fracture density, fracture width, and fracture porosity. According to the evaluation index of fracture effectiveness, the method of constructing effectiveness index is proposed to quantitatively evaluate the effectiveness. Combined with the study of the law of influence of fracture parameters on reservoir permeability, the permeability index is established to reflect permeability. Productivity coefficients for fractured reservoirs with pollution factors have been established by using well-test interpretation data. To evaluate the well productivity of buried hill reservoirs, a productivity assessment chart is constructed by integrating the fracture effectiveness index, permeability index, and productivity coefficient. This chart enables prompt predictions of the buried hill reservoir’s productivity. In order to verify the reliability of the method, a comprehensive comparison is made through conventional, array acoustic logging data and test data. The results show that the method is well applied in the evaluation of metamorphic rock buried hill reservoirs and provides a new idea for the rapid prediction of well productivity.

1. Introduction

With the advancement of exploration technology and the broadening of exploration scope, the buried hill reservoir situated on an unconformity surface within a bedrock reservoir has emerged as a significant area for oil and gas exploration and accumulation [1,2]. Large reserves have been uncovered in several oil and gas fields worldwide, including the Qiongdongnan buried hill field in China, the Baihu field in the Mekong Basin of Southeast Asia and the fields in the Bongor and Sirte Basins of Africa [3,4,5]. Metamorphic rock buried hills mostly produce fractured condensate gas reservoirs. The amount of reserve and their level of enrichment are closely tied to the degree of fracture development and permeability [6,7]. By examining the effectiveness of fractures, well productivity is determined by pinpointing effective reservoirs. Due to the complexity of the lithology and strong heterogeneity of reservoir in the metamorphic buried hill undergoing multi-stage tectonic movement. Traditional techniques for interpreting fractures are not appropriate for metamorphic rock reservoirs. These methods fail to meet the necessary requirements for further exploration and development.
Currently, well productivity of fractured reservoir is evaluated primarily through three methods: the conventional well test productivity equation method, the analytical formula based on the seepage model, and the empirical formula based on well logging data. For instance, Al-Hussainy examined the effects of turbulence on gas flow within the formation and utilized the pseudo-pressure method in well testing to forecast gas well output [8]. Teng Sainan et al. combined with well productivity test to obtain empirical values of the well and then used the well testing one-point method equation to predict gas well production capacity [9]. Sun Hedong et al. opted for the well test productivity evaluation equation for pressure and pressure flat method to promptly calculate productivity using distinct PVT data from real gas reservoirs [10]. Kang Kai et al. also performed similar research. The authors developed analytical calculation formulas for well productivity by constructing the equivalent formation coefficient of fractured gas reservoirs using a seepage model [11]. Zheng Xuerui et al. forecasted the production of fractured reservoirs employing the Stehfest numerical inversion technique based on the seepage and mathematical models of fractured reservoirs [12]. Li Yong proposed an equivalent simulation method to characterize fractured reservoirs for different types of reservoir models, which guides well productivity prediction by taking into account the natural characteristics of fractured gas reservoirs [13]. Muhammad et al. utilised geological, seismic, well logging and engineering data to define the attributes of natural fractured basement reservoirs in carbonate formations to enhance production prediction accuracy [14]. Xu Sainan et al. assessed gas well productivity quantitatively by establishing a relationship between rock elastic modulus and fracture porosity, and combines it with production profile logging [15]. Yang Feng et al. established the relationship between the fracture productivity coefficient interpreted by imaging logging and meter gas production index to predict the regression formula of gas well productivity [16]. Mao Zhiqiang used the effective permeability of oil and gas reservoirs as a breakthrough point and established a method for predicting production capacity using conventional logging data before oil and gas reservoir testingy [17]. The methods for predicting the productivity of fractured gas reservoirs include the one-point method, binomial equation method, productivity prediction model based on seepage mechanics, and empirical formula method based on logging data. All of these methods rely on the physical and fluid parameters of the reservoir for the prediction and evaluation of productivity. However, for offshore oilfields, productivity evaluation primarily relies on DST tests and lacks segmented productivity test data, hence making it impossible to identify the effective production layer segments of buried hills. Furthermore, accurately calculating reservoir parameters is challenging due to the complex fracture seepage patterns present in metamorphic buried hill reservoirs. The prediction of productivity is not highly reliable due to the lack of accurate determination regarding effective producing layers and reservoir parameters.
This paper focuses on predicting well productivity in fractured reservoirs of metamorphic rock buried hills. Through the analysis of geological data, combined with imaging logging and array acoustic logging, it has obvious advantages in fracture identification and evaluation. A fracture validity index has been constructed using fracture parameters such as aperture, porosity and density to provide a quantitative assessment of reservoir validity. Following an accurate description of the effective reservoirs within the buried hill and an analysis of the seepage characteristics of fractures, a reservoir permeability index is established. Using the real productivity coefficient, a productivity evaluation chart for the buried hill reservoir is produced. The validity of this method is demonstrated through comparison with tested data obtained from actual gas wells. This presents a novel concept for appraising and predicting the productivity of the efficient reservoir of metamorphic rock in the research site.

2. Construction of Productivity Prediction Method of Reservoir

2.1. Construction of Fracture Effectiveness Index

The effectiveness of the reservoir is provide an objective measure of the productivity of an individual well. The study area is characterized by reservoirs with buried hills that have developed fractures serving as storage space and effective seepage channels for oil and gas. The effectiveness of fractures is a direct indicator of the reservoir’s performance. Two main criteria are used to evaluate the effectiveness of fractured reservoirs: firstly, the degree of fracture development [18,19], which encompasses the number, scale and distribution of fractures. The existence of fractures greatly improves the permeability of the reservoir and increases the storage space. The better developed the fractures, the higher the quality of the reservoir and the greater the degree of enrichment. The fracture density determined by imaging logging typically reflects the extent of fracture development [20,21]. Conversely, array acoustic logging enables the characterization of fracture development by measuring changes in shear wave amplitude and attenuation [22,23]. Fracture seepage capacity, or the conductivity of fractures during fluid migration, is also an important factor [24,25]. When the degree of fracture development is identical, higher permeability leads to faster oil and gas migration and better supply capacity, which indicates the higher productivity potential of the oil and gas reservoir. Imaging logging is commonly employed to calculate fracture opening and porosity for the characterization of a single fracture’s percolation properties. Meanwhile, array acoustic logging can demonstrate the reservoir’s permeability based on the amplitude and reflection coefficient of Stoneley wave [26,27].
By thoroughly assessing the criteria for evaluating the effectiveness of fractured reservoirs, in conjunction with wall core data and imaging logging technology, we can determine effective fractures and calculate fracture parameters to quantitatively evaluate the longitudinal distribution characteristics of fractures. Using measurements of fracture density to describe the degree of fracture development, the width of fractures, and the porosity of fractures to reflect their Seepage capacity, we have constructed a fracture effectiveness index, Fi.
F i = Log ( Z i × φ i W i ) Log ( Z i × φ i W i ) min Log ( Z i × φ i W i ) max Log ( Z i × φ i W i ) min
where Fi is the fracture effectiveness index, dimensionless; Z is the fracture density, 1/m; W is the fracture opening, um; φi is the fracture porosity, %. The subscript min is the calculated minimum and the subscript max is the calculated maximum.
Array acoustic logging data has an advantage in detecting fractures at a greater radial depth by employing acoustic parameters such as shear wave amplitude and attenuation parameters. This compensatory method addresses the shallow depth detection limitation of imaging logging, and results in a more comprehensive evaluation of fracture effectiveness.
F J = Log ( 1 A T T U × A M P ) Log ( 1 A T T U × A M P ) min Log ( 1 A T T U × A M P ) max Log ( 1 A T T U × A M P ) min
where Fj is the acoustic effectiveness index, dimensionless; ATTU is the attenuation of the waveform in the array sound wave, 1/m; AMP is the amplitude of the sound wave, mv. The subscript min is the calculated minimum value, and the subscript max is the calculated maximum value.

2.2. Calculation of Fracture Parameters

2.2.1. Fracture Density

Fracture width is determined by means of image logging, and it indicates the quantity and spatial distribution of fractures, as well as the level of concentrated development, by representing the number of fractures per unit length along the wellbore direction. The formula for calculating fracture width is as follows [21]:
ρ = 1 L cos θ i i = 1 N L i
where, L is the window length, m; θ is the apparent inclination angle of the i fracture.

2.2.2. Fracture Width

Fracture width is calculated through imaging logging. The hydraulic electrical fracture aperture parameter (FVAH) is used to reflect the degree of fracture opening, taking into account the influence of fracture size on fluid flow characteristics. This allows for the reflection of both the strength and weakness of fracture permeability. The formula is as follows [21]:
F V A H = i = 1 N L i W i 3 i = 1 N L i 3
where, Wi is the width of the i fracture, mm; Li is the i fracture, length, mm.

2.2.3. Fracture Porosity

Fracture porosity is primarily computed using the medium-depth and shallow resistivity curves of conventional log interpretation data. This value is subsequently expressed as [28]:
φ f = R m ( 1 R L L S 1 R L L D ) 1 / m f
where, φf is the fracture porosity, %; mf is the fracture porosity index; Rm is the mud resistivity, Ω·m.

2.3. Construction of Fracture Permeability Index

Fracture permeability is a crucial parameter for productivity prediction in metamorphic buried hill fractured reservoirs. The matrix of a buried hill reservoir is tight formation, with undeveloped primary pores. Thus fracture permeability is almost considered as reservoir permeability. However, in metamorphic rock reservoirs buried deep underground, heterogeneous condition is prevalent. Therefore, fracture permeability is not only challenging to determine with accuracy, but also the characterization form is complex.
Based on previous CT scanning experiments of fractured cores, the influence of fracture parameters on permeability was investigated [6,29], and we established a fracture permeability index based on the functional relationship between fracture parameters and permeability and combined with the plate flow theory to reflect the differences in permeability between reservoirs (Equation (6))
K i = W i 3 D cos α
where, Ki is fracture permeability, mD; Wi is fracture opening, um; D is fracture spacing, um; α is fracture inclination, (°).
In array logging data, Stoneley waves have the characteristics of low frequency and large amplitude and are sensitive to fractures, pores and holes. There are obvious reflected Stoneley waves at the fractures and layer interfaces. By separating the wave field, the direct Stoneley waves and reflected Stoneley waves are respectively subjected to a fast Fourier transform to obtain the spectrum to calculate the Stoneley wave reflection coefficient, The equation is expressed as [30]:
r ( f ) = X R ( f ) X D ( f ) max X D ( f ) X D ( f ) , 0.01 E
where, XD(f) is the amplitude of the direct Stoneleigh wave, and f is the frequency; X*D(f) is the conjugation of XD(f); XR(f) is the amplitude of the reflected Stoneley wave, and E is the maximum peak of the direct Stoneley wave amplitude.
Currently, a majority of scholars estimate the permeability of buried hill reservoirs composed of metamorphic rock through the interpretation and processing of Stoneley wave data. As the permeability of the reservoir section grows, the Stoneley wave amplitude decreases significantly while the coefficients of attenuation and reflection increase. Conversely, as the permeability of the reservoir section diminishes, the Stoneley wave amplitude rises while the coefficients of attenuation and reflection decrease. By using Stoneley wave data to calculate Equation (2) and comparing it with the reservoir permeability index, the accuracy of the verification is confirmed.

2.4. Construction of Productivity Coefficients

For fractured reservoirs located in buried hills of metamorphic rocks, well productivity evaluation is carried out through DST testing. This method offers the benefits of fast speed and abundant data acquisition. However, it also has the disadvantage of lengthy well test section. Due to strong heterogeneity, the reservoir displays intricate seepage patterns, causing discontinuity in the vertical direction of the reservoir’s effectiveness. As a result, the effective thickness of reservoir is significantly smaller than well test section. Furthermore, testing operations may face potential contamination and additional pressure at the well’s bottom. Based on the aforementioned scenario, it is challenging to depict the actual production capacity of the reservoir through a comparison of the gas production index J (Equation (8)), The equation is expressed as [16]:
J = Q g ( P e P wf ) h
where J is the meter gas production index, (104 m3·(d·MPa·m)−1); Qg is the daily gas production, 104 m3/d; Pe is the formation pressure, MPa; Pwf is the bottom hole flowing pressure, MPa; h is the thickness of test section, m.
To address well productivity evaluation, this article initially utilizes imaging logging data-derived fracture parameters to form the fracture effectiveness index. Furthermore, it thoroughly analyses conventional logging and array acoustic data to establish the effective reservoir thickness. Using the skin coefficient derived from well-test data, one can determine the actual productivity coefficient of the reservoir by calculating the pressure drop. The use of the productivity coefficient Ji, as compared to the gas production index J, can improve the precision of reservoir productivity evaluation (Equation (9)).
J i = Q g ( Δ P i ) h i
where Ji is the real productivity coefficient of the reservoir, (104 m3·(d·MPa·m)−1); Qg is the daily gas production, 104 m3/d; ∆p = PePwf + Ps, Ps is the additional pressure, MPa; hi is the effective reservoir thickness determined by the fracture index, m.
The gas production capacity of fractured reservoirs heavily relies on their effective thickness and permeability. As a result, variations in the effectiveness and permeability of reservoirs occur between wells, leading to significant variances in test yields among different exploration wells. To improve the comparability of logging data in both vertical and horizontal directions between individual wells, it is essential to consider these differences. This article employs the fracture parameter ratio technique, which measures the fracture parameter ratio E between the tight section and the reservoir section (Equation (10)). By avoiding subjective evaluations and excluding the influence of good conditions, wellbore diameters, lithology and other related factors on the calculation results, this method allows for a better assessment of fracture parameters impacting on the fracture efficiency and formation permeability. By combining conventional logging, and mud logging data to verify the accuracy of reservoir effectiveness and permeability of multiple test wells, the quantitative evaluation criteria for effectiveness and permeability in the study area is achieved, The equation is expressed as [23]:
E = i = 1 N R i i = 1 N R O
In the Equation (10) for calculating the effectiveness ratio, Ri is the fracture effectiveness index of the dense interval, dimensionless; Ro is the fracture effectiveness index of the effective formation interval, dimensionless; When calculating the permeability ratio, Ri is the permeability index of the dense interval, dimensionless; Ro is the permeability index of the effective formation interval, dimensionless.
The efficiency and permeability indices obtained the Equation (10) are projected onto a plane formed by horizontal and vertical coordinates. Then, based on the productivity index, the high gas production area, middle gas production area and low gas production area are distinguished. As a result, the productivity assessment plan for the buried hill reservoir is devised. A quantitative comparison of well productivity across multiple wells was achieved by evaluating the discrepancies in in productivity (Figure 1).
The research results indicate that when the productivity index of a gas reservoir is higher, the ratio of reservoir effectiveness and permeability index is lower. The disparities in effectiveness and permeability index vary significantly between areas of high, medium and low production. This indicates that these indices can proficiently differentiate varying productivity zones of reservoirs and prompt prediction of reservoir productivity (Table 1).

3. Application Examples

This article examines the Archean metamorphic rock reservoir at buried hill as the subject of research. The lithology primarily consists of diorite gneiss, plagioclase gneiss, and mixed gneiss. The mineral components are mainly feldspar minerals like quartz, feldspar and mica, and contain a small proportion of dark minerals. The storage space is made up of fractures and dissolution pores with fractures being the primary storage space. Based on the statistical analysis of physical property data, fractured reservoirs in buried hills present a core porosity ranging from 0.1% to 16.7%, with an average value of 3.82%. Likewise, the core permeability spans from 0.01 to 11.8 mD, with an average value of 0.44 mD. The reservoir is identified by low porosity and low permeability levels.

3.1. Calculation of Fracture Parameters

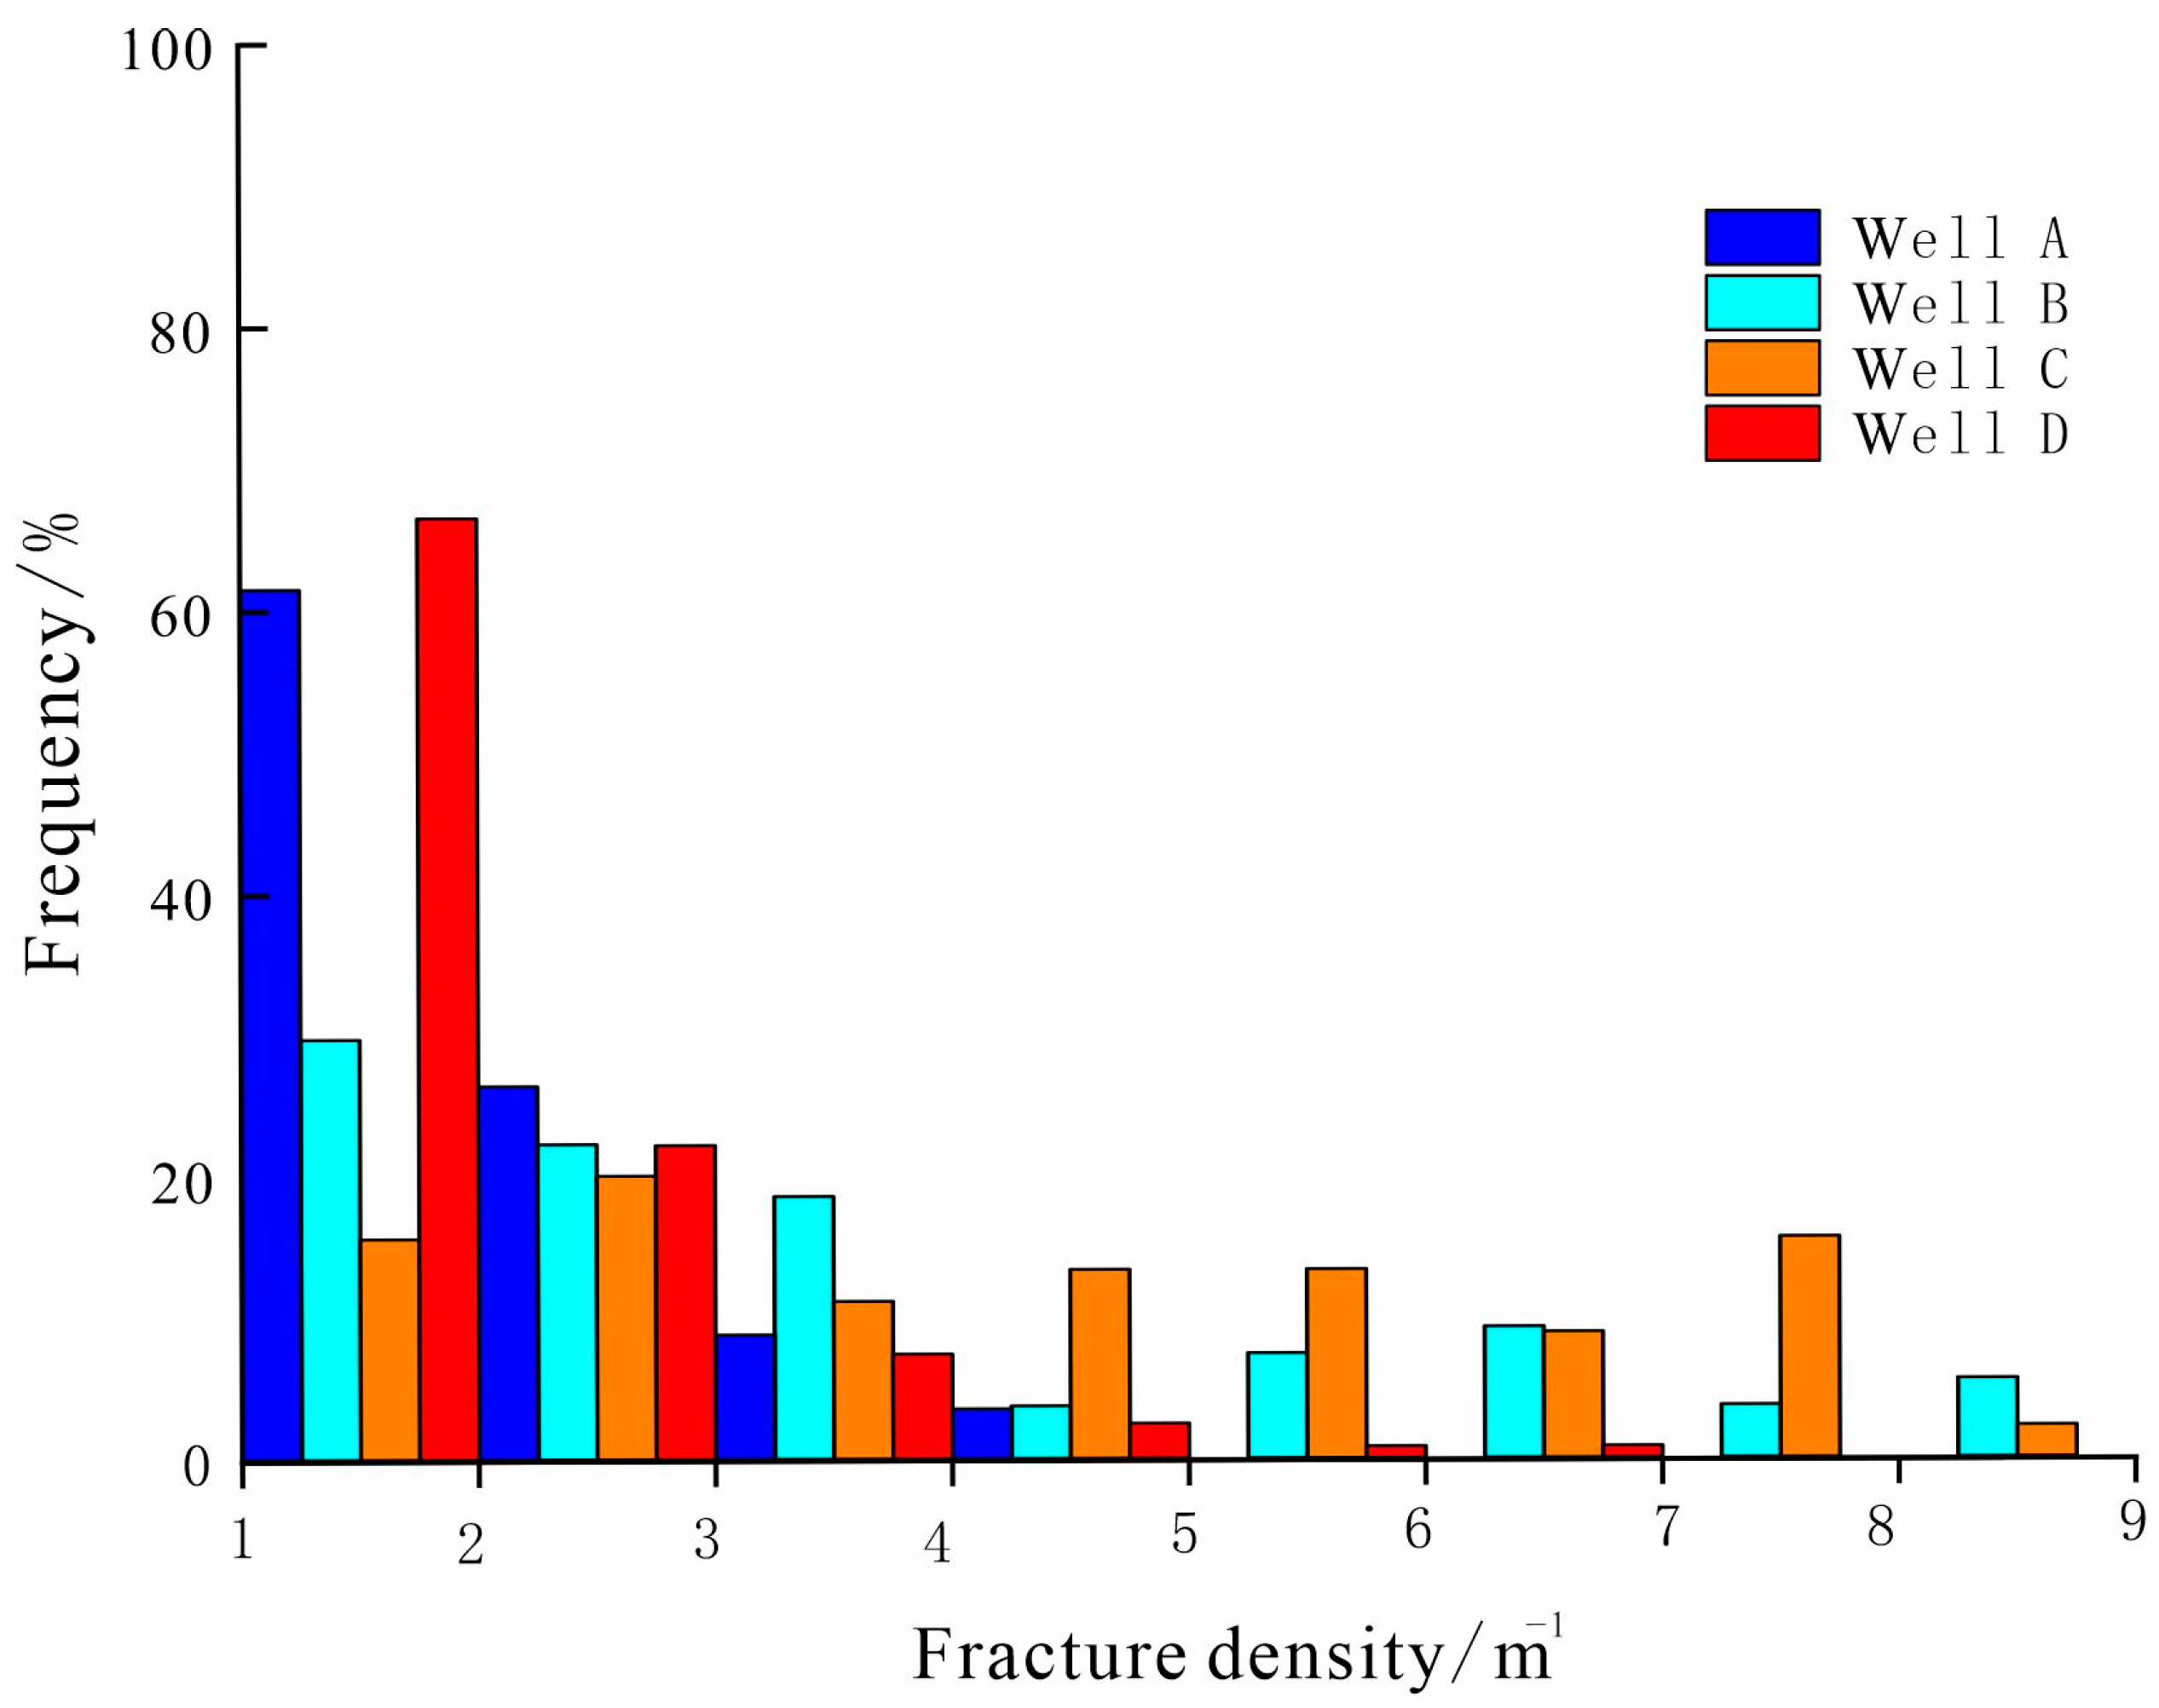
3.1.1. Fracture Density

Calculating fracture parameters is essential for assessing the effectiveness and permeability of fractures. By selecting four wells within the study area that have not undergone hydraulic fracturing, fracture parameters were analyzed and statistically processed using electrical imaging data. The distribution differences of fracture parameters between each well are significant. The analysis results are shown in Figure 2, and the fracture density of each well is mainly distributed in 1–5/m, with an average value of 1.3–4.5/m. Additionally, statistical analysis is performed on the fracture angles of four wells, which are illustrated in Figure 3. The fractures predominantly fall into the medium to high-angle range, varying from 40°to 80°, and account for over 75% of the total quantity of fractures.

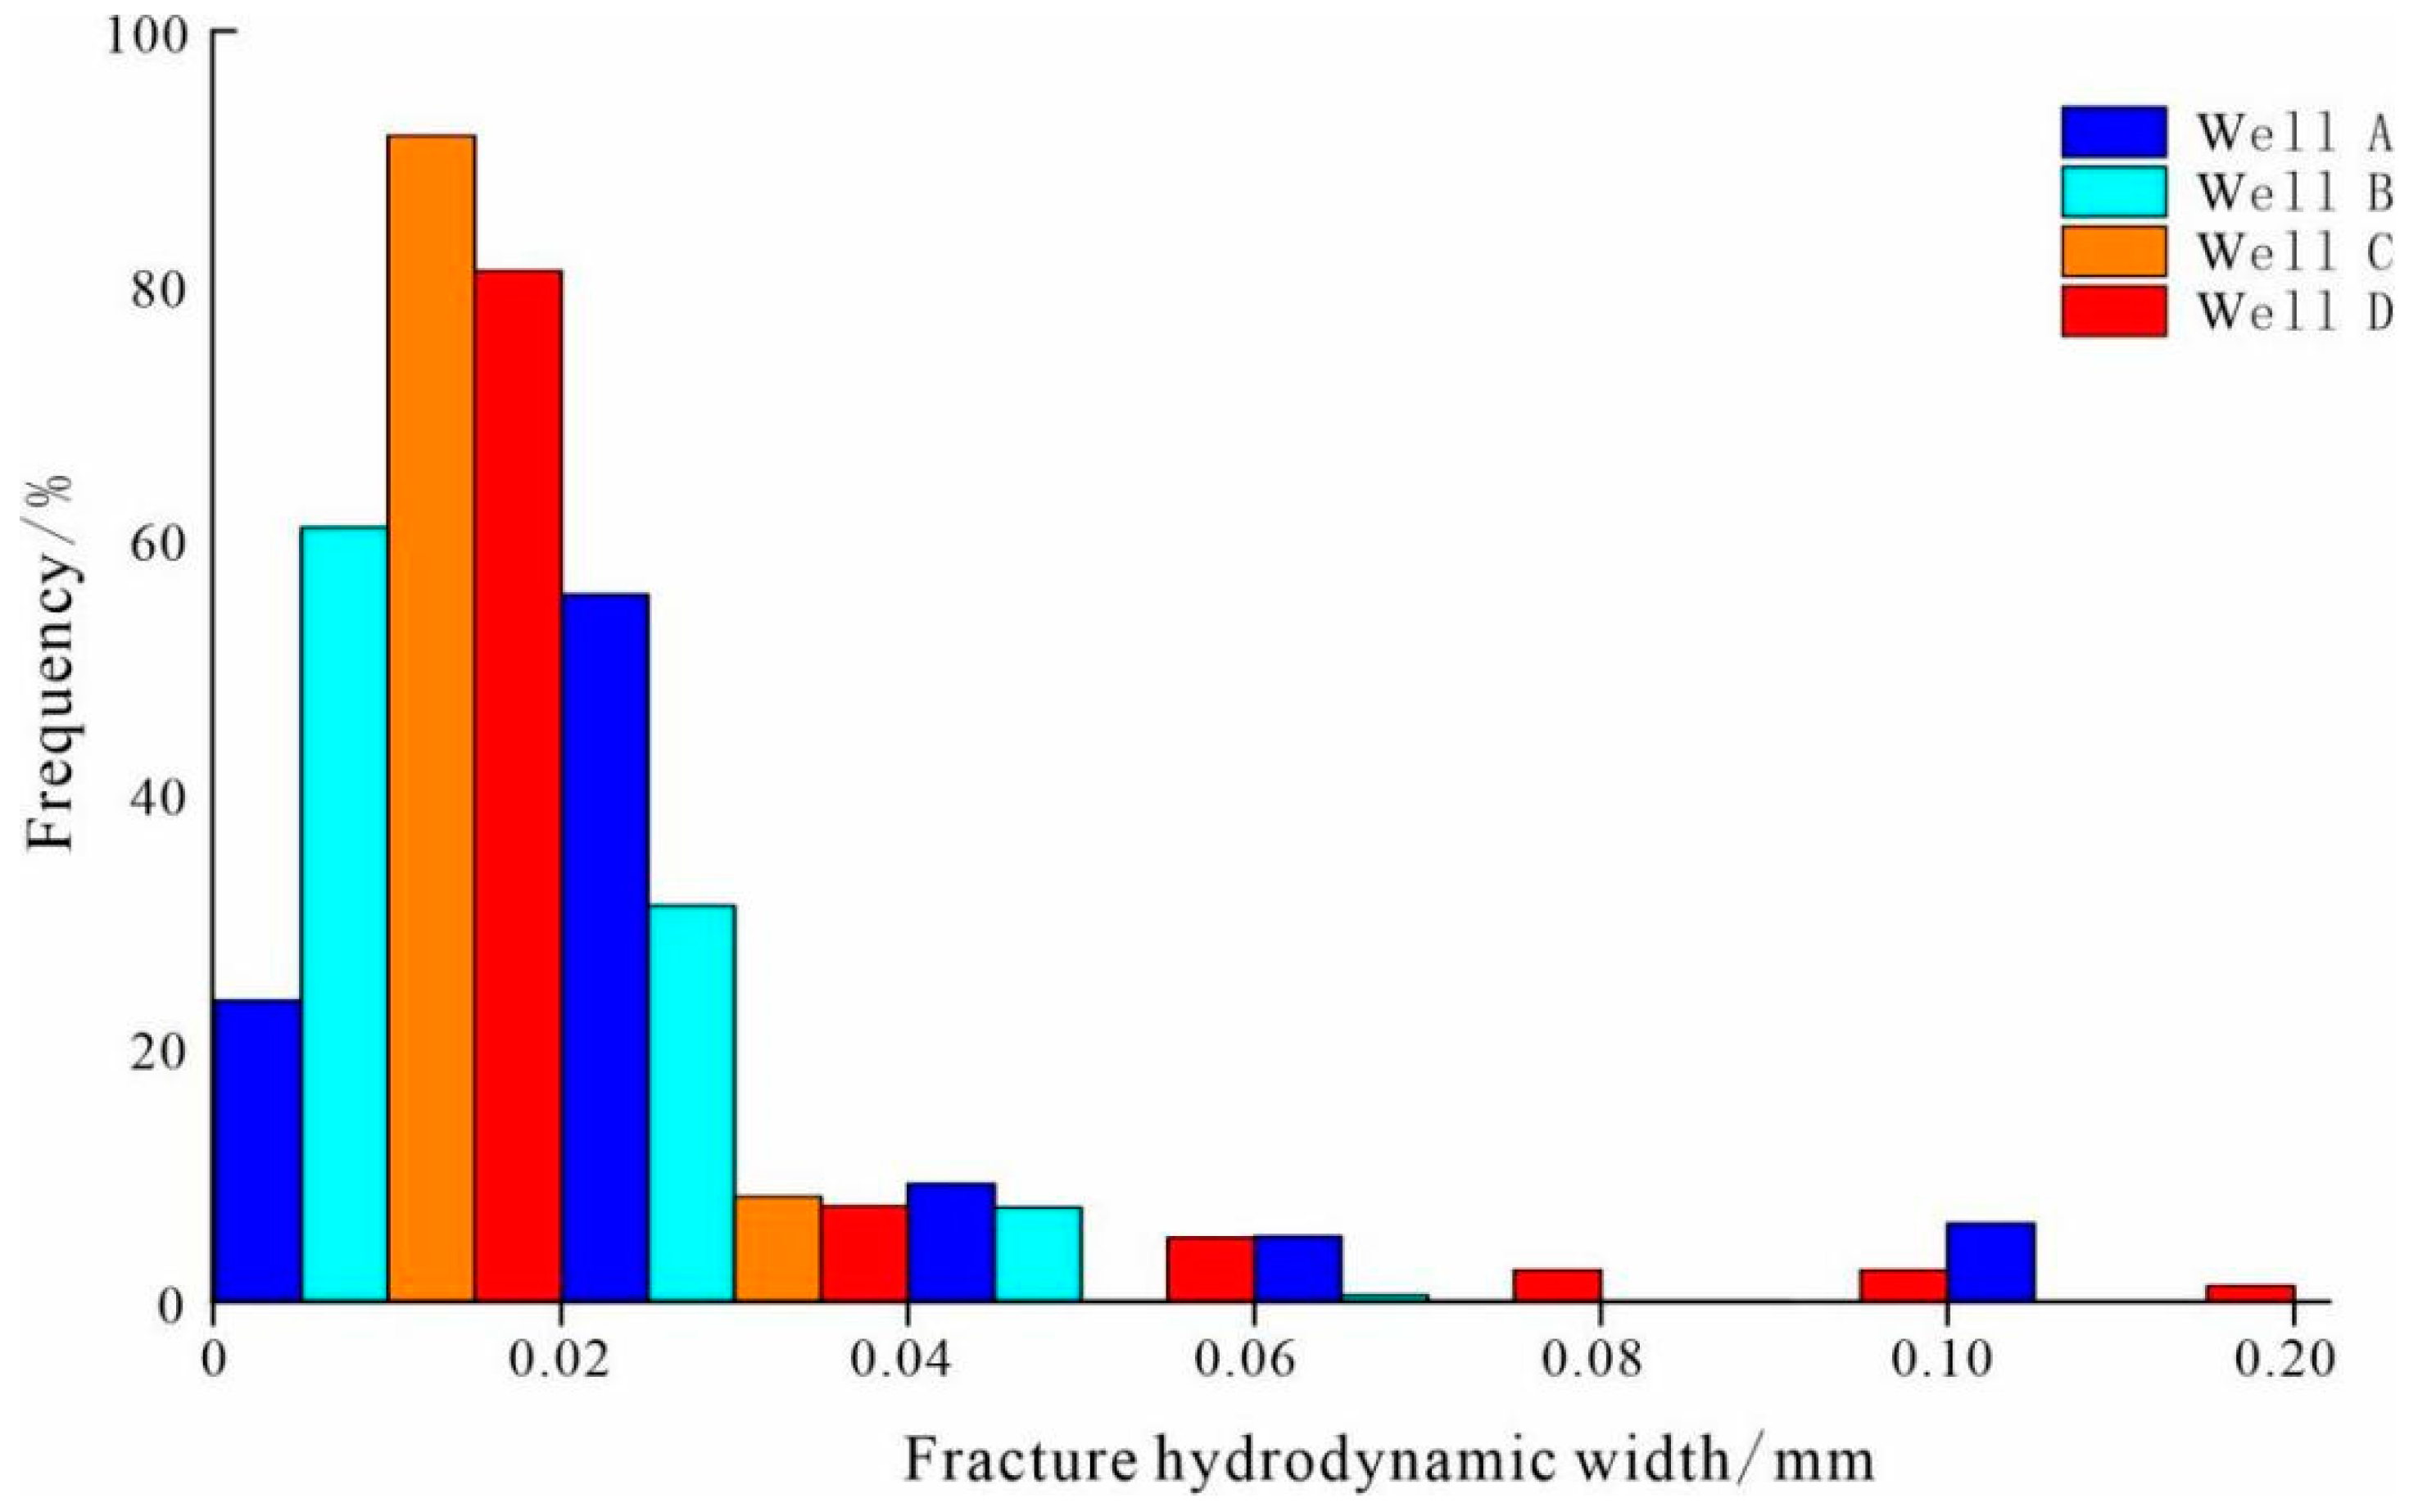
3.1.2. Fracture Width

Identify fractures by analysing wall core and imaging logging data. Calculate the hydrodynamic width of fractures by utilising Equation (4). According to the statistical analysis results shown in Figure 4, the average hydrodynamic width of the fracture is mainly between 0.02 and 0.1 mm.

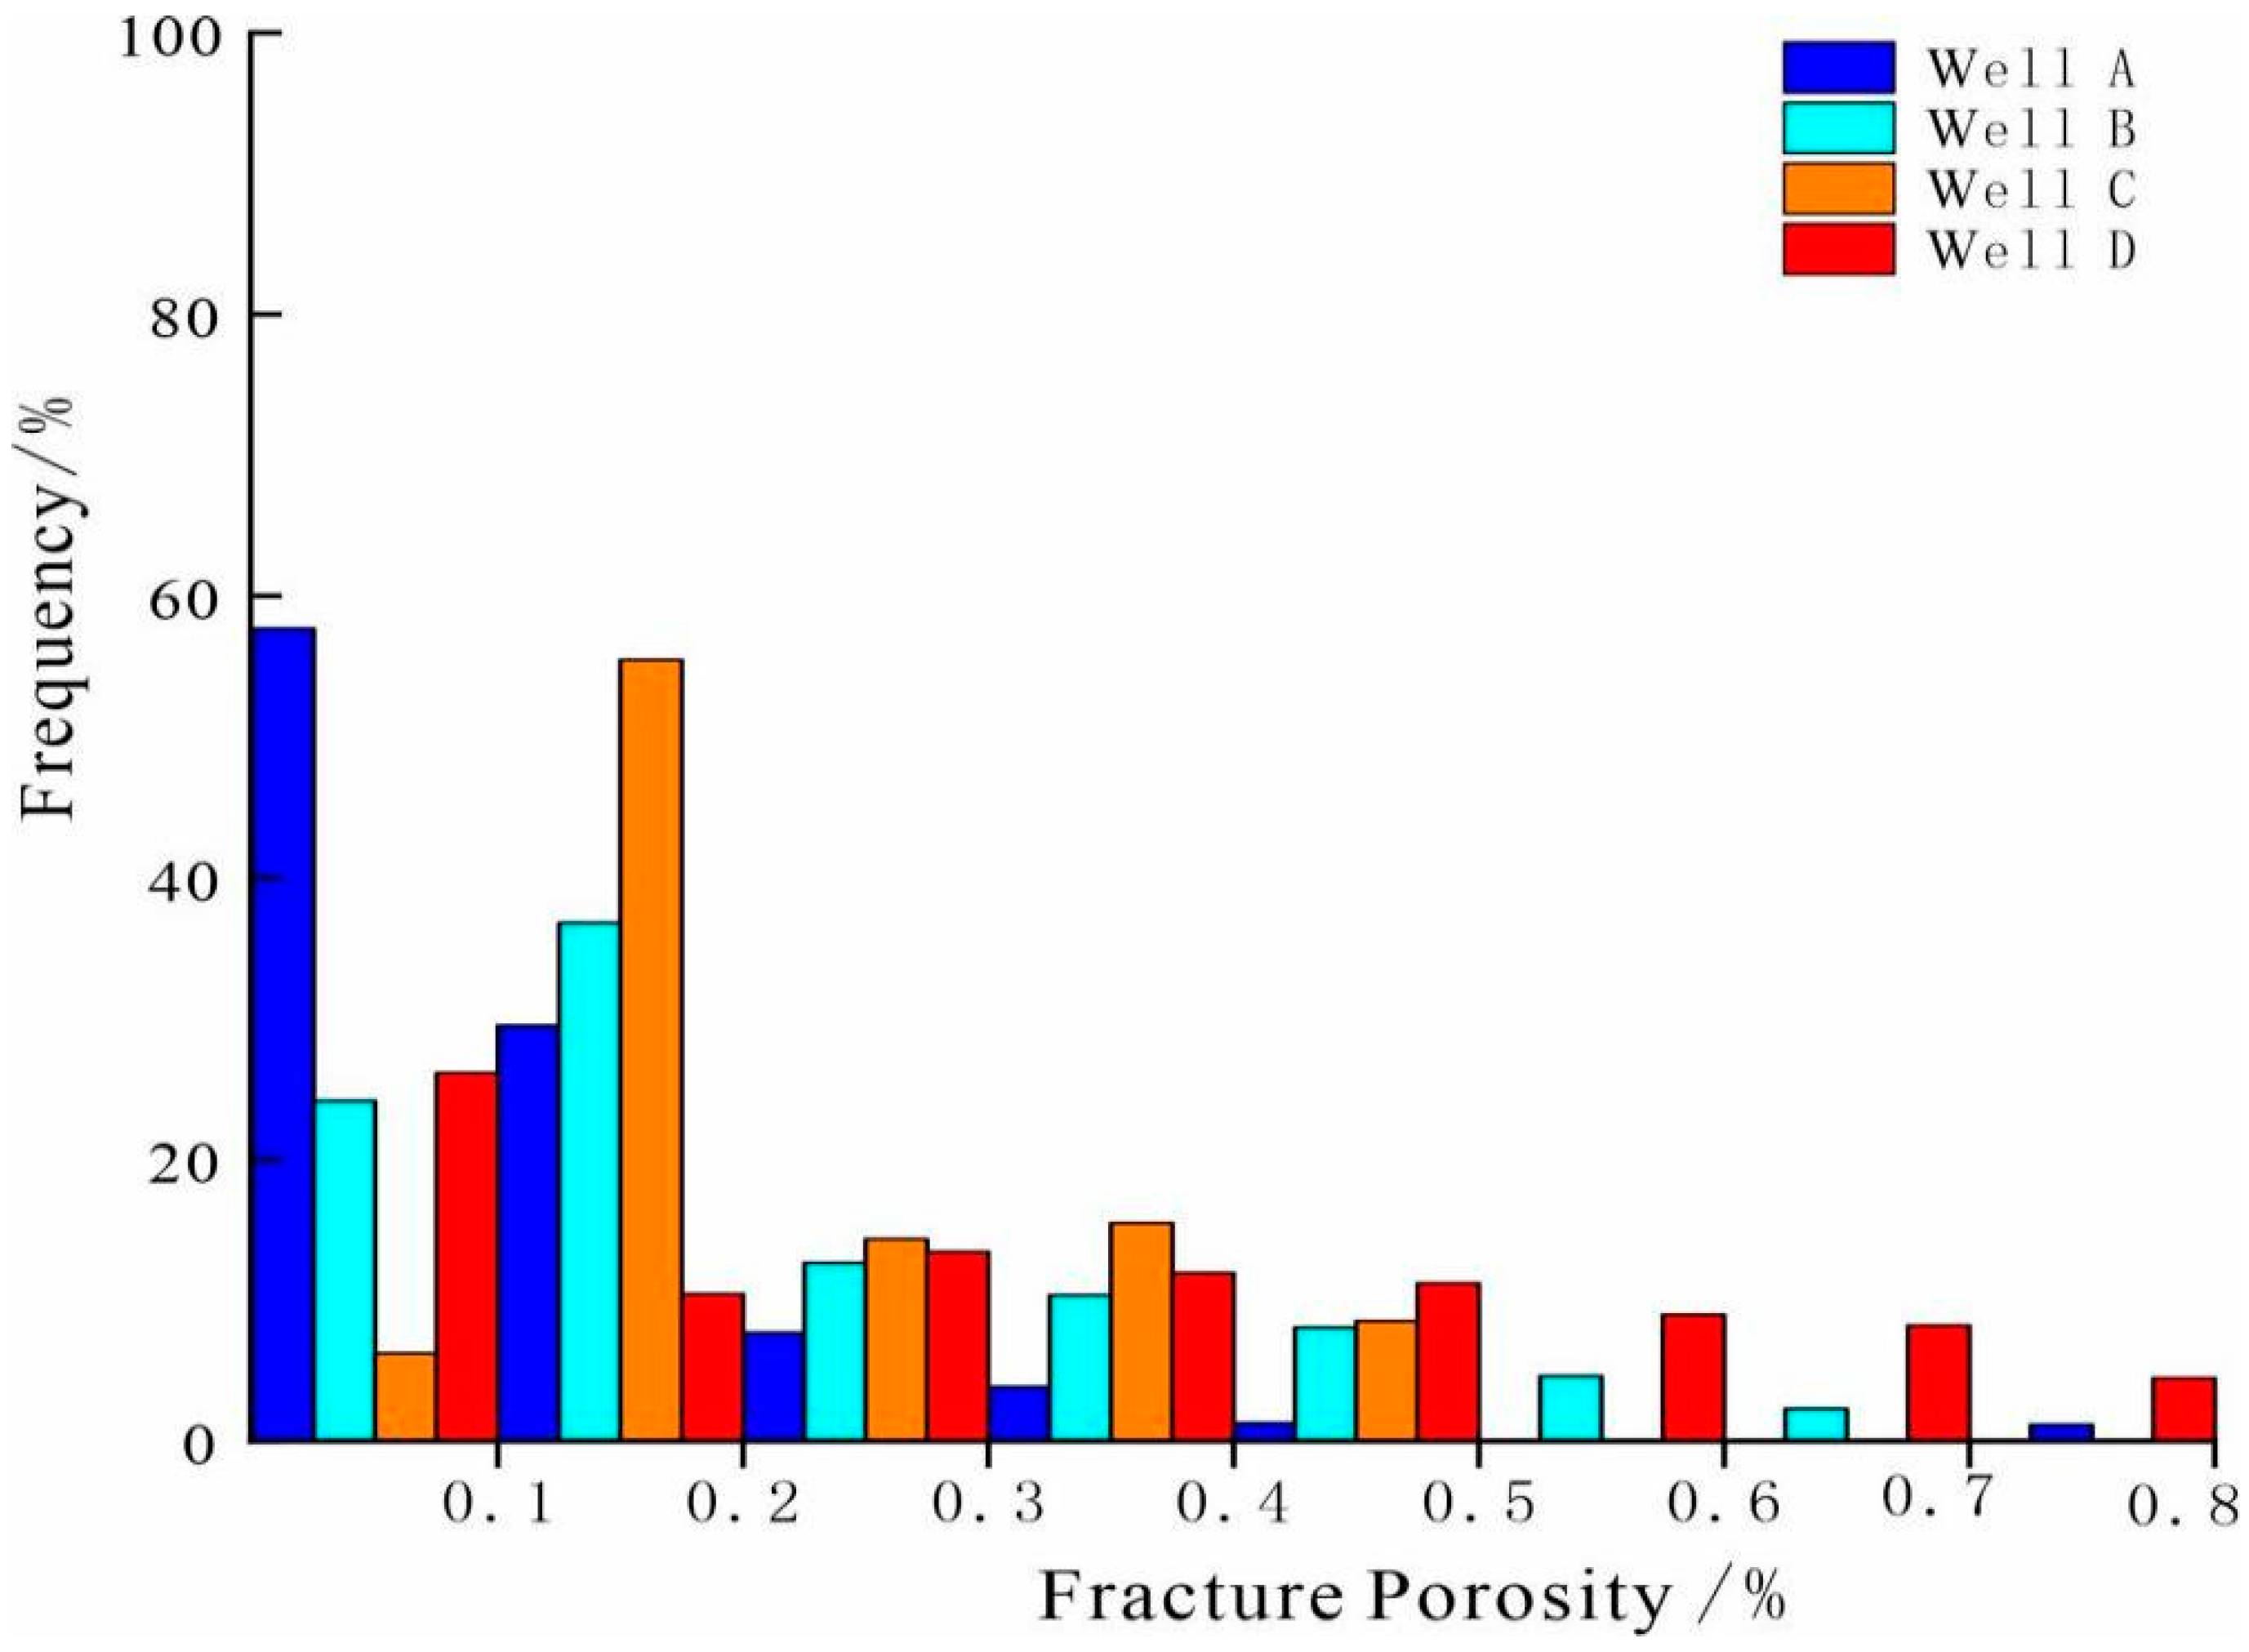
3.1.3. Fracture Porosity

Calculate fracture porosity using Equation (5) based on conventional logging interpretation of deep and shallow resistivity data. According to the statistical analysis results shown in Figure 5, the range of fracture porosity is mainly distributed between 0.1% and 0.5%.

3.2. Evaluation of Fracture Effectiveness

The fracture effectiveness index, which was constructed using fracture parameters from both single and multi-well data, was compared with other multi-scale logging data to assess the suitability of using it for reservoir evaluation.
According to Equation (1), the calculation result is dimensionless. The reservoir is considered more effective when the index is larger. Using Well A as an example, the effective interval of formation lies between 4093–4110 m, and the gas logging shows unusually high levels of hydrocarbon gas. The deep and shallow resistivity values are low, with an apparent positive difference in amplitude. For array acoustic waves, transverse waves and Stoneley waves have low wave amplitude, but high attenuation. In the context of electric imaging for fracture development, the static-static diagram shows high fracture parameters with a fracture effectiveness index of 0.73, indicating good formation effectiveness. Conversely, the 4050–4093 m section exhibits a fracture effectiveness index of 0.45, indicating a relatively poor reservoir (Figure 6).
The effectiveness index for fractures shows a significant correlation with the array acoustic effectiveness index and other logging data. This not only proves the accuracy of fracture identification but also enables effective formation identification through the effectiveness index in a quantitative manner.
Multi-well formation effectiveness was evaluated using B, D, and E wells as examples, via exploring the differences between deep and shallow resistivity in conventional logging, fracture density and length in imaging logging, shear wave amplitude and attenuation ratio in array acoustic logging, and the productivity index of test data.
Based on the Table 2, the multi-well formation’s effectiveness is highest in B, D and E wells, as evidenced by their fracture effectiveness ratios: less than 0.4, 0.5–0.7, and more than 0.7 respectively. These ratios correspond with the wells’ respective productivity indexes of 219.3, 58.2, and 2.8. Thus, the fracture effectiveness index is a useful tool for quantitatively evaluating multi-well formation.

3.3. Reservoir Permeability Evaluation

The evaluation of reservoir permeability involves comparing Stoneley wave data with the reservoir permeability index for verification purposes. Taking Wells A and B as case studies, Equation (2) is used to calculate the Stoneley wave index, which reflects the reservoir permeability. Equation (7) is used to calculate the Stoneley wave reflection coefficient. The Stoneley wave index and the Stoneley wave reflection coefficient are then compared with the reservoir permeability index, and a strong correlation is observed, indicating that the seepage index accurately reflects the reservoir permeability (Figure 7).

3.4. Well Productivity Evaluation

Comprehensive analysis has been conducted on wells D-DST2 and G using conventional logging, imaging logging and array acoustic logging data. The fracture development interval was processed, the fracture effectiveness index and fracture seepage characteristic index were projected onto the well productivity evaluation chart. These indexes are concentrated in the high and middle zones. Based on the collected data, the productivity indexes for D-DST2 and G wells are 124.5 and 24.1, correspondingly, in line with the results obtained from the productivity evaluation (Figure 8).

4. Discussion

In this article, we take the fracture as the main controlling factor of production productivity, and use the imaging logging data to evaluate the production productivity of the fractured gas reservoirs in metamorphic rocks. Since there are more fracture-related factors controlling the production productivity, this part focuses on the other factors of fracture on the production productivity control.
(1) Angle between the natural fracture strike and the direction of the present maximum principal stresses
According to previous research results, when the angle between the natural fracture strike and the direction of the present maximum principal stress is basically the same or the angle is smaller, the fracture effectiveness and permeability are better, and the production capacity is relatively higher. Combined with the actual data, the angles between the fracture strikes and the present-day maximum principal stress direction in the wells of high, medium, and low production areas were statistically analyzed and compared with the new method of production capacity prediction, and it was found that the correlation between the three was consistent (Figure 9).
(2) The degree of fracture filling
The effect of the degree of filling of a fracture occurs during or late in the formation of the fracture, when the generated sediment plugs the pore seams formed earlier, narrowing or blocking the fracture channel. The higher the degree of filling, the poorer the permeability of the fracture and the relatively low capacity. The filling degree of fractures is reflected according to the percentage of unfilled seams in the wall core data. Combined with the actual production data, by comparing with the new method of capacity prediction, it is found that the correlation between the three is consistent (Table 3).

5. Conclusions

(1) From the perspective of the influence of fracture properties on the well productivity of buried hill reservoirs, a new method for predicting the well productivity of buried hill fractured reservoirs was established based on the fracture effectiveness index and permeability index established from the fracture parameters calculated from imaging logging data and the Productivity coefficients created from well-test data.
(2) Comprehensive comparison of the fracture effectiveness index and permeability index is carried out through multi-scale data such as conventional logging, mud logging and array acoustic wave logging. The results show that the fracture effectiveness index and permeability index can accurately reflect the characteristics of fracture development and seepage capacity in the formation.
(3) The new method of productivity prediction is used to predict six wells in the study area, which is in good agreement with the actual production data. The results show that the method proposed in this paper can quickly and accurately predict the production capacity of a single well, which provides a new idea for the well productivity prediction of buried hill reservoirs.

Author Contributions

Conceptualization, H.B.; Methodology, H.B.; Validation, H.B. and P.C.; Data curation, P.C.; Writing—original draft, H.B.; Writing—review & editing, H.B.; Supervision, P.C.; Funding acquisition, P.C. All authors have read and agreed to the published version of the manuscript.

Funding

This work was supported by the National Natural Science Foundation of China (No. 62273060).

Data Availability Statement

All data can be obtained from the corresponding author.

Conflicts of Interest

We declare that we have no financial and personal relationships with other people or organizations that can have a bad effect on our work.

References

  1. Landes, K.K.; Amoruso, J.J.; Charlesworth, L.J., Jr.; Heany, F.; Lesperance, P.J. Petroleum resources in basement rocks. AAPG Bull. 1960, 44, 1682–1691. [Google Scholar]
  2. Pan, Z.X. Petroleum in basement rocks. AAPG Bull. 1982, 66, 1579–1643. [Google Scholar]
  3. Xu, C.G.; Du, X.F.; Liu, X.J.; Liu, W.; Hao, Y. Formation mechanism of high-quality deep burie-hill reservoir of Archaean metamorphic rocks and its significance in petroleum expolration in Bohai Sea area. Oil Gas Geol. 2020, 41, 235–247, 294. [Google Scholar]
  4. Hou, M.C.; Cao, H.Y.; Li, H.Y.; Chen, A.; Wei, A.; Chen, Y.; Wang, Y.; Zhou, X.; Ye, T. Characteristics and controlling factors of deep buried-hill reservoirs in the BZ19-6 structural belt, Bohai Sea area. Nat. Gas Ind. 2019, 39, 33–44. [Google Scholar] [CrossRef]
  5. Li, W.; Dou, L.R.; Wen, Z.G.; Zhang, G.; Cheng, D.; Du, Y.; Hu, Y. Buried-hill hydrocarbon genesis and accumulation process in Bongor Basin, Chad. Acta Petro-Lei Sin. 2017, 38, 1253–1262. [Google Scholar]
  6. Li, X.Y.; Qin, R.B. Method of Fracture Characterization and Productivity Prediction of 19-6 Buried-Hill Fractured Reservoirs, Bohai Bay Basin. Earth Sci. 2023, 48, 475–487. [Google Scholar]
  7. Ren, F.X.; Guo, Y.J.; Zhang, J.C.; Gu, T. Research on seismic response characteristics of fracture developed section of reservoirs inside the buried hill. Nat. Gas Geo-Sci. 2014, 25, 565–573. [Google Scholar]
  8. Al-Hussainy, R.; Ramey, H.J., Jr.; Crawford, P.B. The flow of real gases through porous media. J. Pet. Technol. 1966, 18, 624–636. [Google Scholar] [CrossRef]
  9. Teng, S.N.; Liang, J.W.; Li, Y.S.; Lei, G. One point method productivity prediction formula for low permeability gas reservoirs. XinJiang Pet. Geol. 2012, 33, 92–94. [Google Scholar]
  10. Sun, H.D.; Meng, G.R.; Cao, W.; Su, X.; Liang, Y.; Zhang, R.; Zhu, S.; Wang, S. Applicable conditions of the binomial pressure method and pressure-squared method for gas well deliverability evaluation. Nat. Gas Ind. 2020, 40, 69–75. [Google Scholar] [CrossRef]
  11. Kang, K.; Zhao, L.; Luo, X.B.; Zhang, L.; Wu, H. A new productivity evaluation method for fractured buried hill gas reservoirs and its application. China Offshore Oil Gas 2021, 33, 100–106. [Google Scholar]
  12. Zheng, X.R.; Li, X.B.; Li, X.L. New prediction method for fracture reservoir productivity. Fault-Block Oil Filed 2015, 22, 744–746+751. [Google Scholar]
  13. Li, Y.; Li, B.; Wang, Q.; Deng, X. Different equivalent simulation methods for fractured-vuggy carbonate gas condensate reservoirs. In Proceedings of the SPE Europec Featured at 79th EAGE Conference and Exhibition, Paris, France, 12–15 June 2017. [Google Scholar]
  14. Akbar, M.N.A.; Nemes, I.; Bihari, Z.; Soltész, H.; Bárány, Á.; Tóth, L.; Borka, S.; Ferincz, G. Naturally fractured carbonate reservoir characterization: A case study of a mature high-pour point oil field in Hungary. Petrophysics 2022, 63, 634–649. [Google Scholar] [CrossRef]
  15. Xu, S.N.; Cui, Y.J.; Lu, Y.L.; Xu, J.; Bie, X.; Han, Z. New quantitative calculation method for buried-hill reservoir productivity by rock mechanical parameters. Fault-Block Oil Filed 2017, 24, 674–677. [Google Scholar]
  16. Yang, F.; Zhu, C.Q.; Wang, X.H.; Qu, H.; Zhang, F.; Niu, X. A capacity prediction model for the low porosity fractured reservoirs in the Kuqa foreland basin, NW China. Pet. Explor. Dev. 2013, 40, 341–345. [Google Scholar] [CrossRef]
  17. Mao, Z.Q.; Li, J.F. Method and Model for Predicting Oil and Gas Reservoir Productivity. Acta Pet. Sin. 2000, 21, 58–61+3. [Google Scholar]
  18. Xie, Q.; Li, G.; Yang, X.; Peng, H. Evaluating the Degree of Tectonic Fracture Development in the Fourth Member of the Leikoupo Formation in Pengzhou, Western Sichuan, China. Energies 2023, 16, 1797. [Google Scholar] [CrossRef]
  19. Qu, H.Z.; Zhang, F.X.; Wang, Z.Y.; Yang, X.; Liu, H.; Ba, D.; Wang, X. Quantitative fracture evaluation method based on core-image logging: A case study of Cretaceous Bashijiqike Formation in ks2 well area, Kuqa depression, Tarim Basin, NW China. Pet. Explor. Dev. 2016, 43, 465–473. [Google Scholar] [CrossRef]
  20. Chen, Y.X.; Ren, X.F.; Mu, Y.; Chen, H.; Yu, B.; Yao, H.; Liu, L. Effectiveness evaluation method for tight carbonate reservoirs based on electrical imaging logging data. Well Logging Technol. 2020, 44, 49–54. [Google Scholar]
  21. Wu, W.; Shao, G.H.; Gui, P.F.; Zhang, Q.; Wei, H.; Li, G.; Ren, P. Fracture effectiveness evaluation and reservoir quality classification based on electrical imaging data: A case study of Cretaceous in Yaerxia Oilfield. Lithol. Reserv. 2019, 31, 102–108. [Google Scholar]
  22. Tan, L.H.; Zhang, G.Q.; Tan, Z.J.; Zhang, G.; Zhang, C.; Cai, M. Evaluation of metamorphic reservoir effectiveness by array acoustic logging data. Oil Geophys. Prospect. 2022, 57, 1464–1472+1263. [Google Scholar]
  23. Zhang, G.Q. Effectiveness evaluation of buried hill reservoirs based on acoustic amplitude quantification. Oil Geophys. Prospect. 2023, 58, 206–213+227. [Google Scholar]
  24. Tong, K.J.; Zhao, C.M.; Lyu, Z.B.; Zhang, Y.; Zheng, H.; Xu, S.; Wang, J.; Pan, L. Reservoir evaluation and fracture characterization of the metamorphic buried hill reservoir in Bohai Bay. Pet. Explor. Dev. 2012, 39, 56–63. [Google Scholar] [CrossRef]
  25. Wanniarachchi, W.A.M.; Ranjith, P.G.; Perera, M.S.A.; Rathnaweera, T.D.; Zhang, C.; Zhang, D.C. An integrated approach to simulate fracture permeability and flow characteristics using regenerated rock fracture from 3-D scanning: A numerical study. J. Nat. Gas Sci. Eng. 2018, 53, 249–262. [Google Scholar] [CrossRef]
  26. Chen, Y.B.; Zhang, C.G.; Cai, M.; Zhang, Z.T. Calculation model and application of fracture permeability based on Stoneley wave. Fault-Block Oil Filed 2022, 29, 609–613+640. [Google Scholar]
  27. Tang, J.; Zhang, C.G.; Cai, D.Y. Effectiveness evaluation of tight sandstone reservoir based on Stoneley wave characteristic parameters. J. Oil Gas Technol. 2013, 35, 79–85. [Google Scholar]
  28. Sibbit, A.M.; Faivre, O. The dual laterolog response in fractured rocks. In Proceedings of the SPWLA 26th Annual Logging Symposium, Dallas, TX, USA, 17–20 June 1985. [Google Scholar]
  29. Shang, S.G.; Gao, K.C.; Gao, Q.Y.; Ma, J.X.; Wangm, P.C. Influence of fracture development on seepage characteristics of low-porosity rocks. Sci. Technol. Eng. 2023, 23, 9809–9819. [Google Scholar]
  30. Cui, Y.; Wang, Z.; Xu, F.; Han, R.; Qi, X. Analysis of Fracture Formation Characteristics of Igneous Rock Based on Stoneley Wave and Electrical Imaging Logging. J. Jilin Univ. (Earth Sci. Ed.) 2022, 52, 624–632. [Google Scholar]
Figure 1. Well productivity evaluation chart based on the ratio of fracture availability to permeability.
Applsci 13 12328 g001
Figure 2. Distribution map of fracture density in the study area.
Applsci 13 12328 g002
Figure 3. Distribution of fracture angle in the study area.
Applsci 13 12328 g003
Figure 4. Distribution of fracture hydrodynamic width in the study area.
Applsci 13 12328 g004
Figure 5. Distribution of Fracture Porosity in the Study Area.
Applsci 13 12328 g005
Figure 6. Logging Data Processing Results of Well A Buried Hill Section.
Applsci 13 12328 g006
Figure 7. Processing Results of Seepage Characteristics in Buried Hill Reservoirs of Wells A and B.
Applsci 13 12328 g007
Figure 8. Production Capacity Evaluation and Processing Results of D-DST2 and G Wells.
Applsci 13 12328 g008
Figure 9. Fracture strike and The direction of the present maximum principal stress.
Applsci 13 12328 g009
Table 1. Productivity Evaluation of Metamorphic Buried Hill Reservoir.
Productivity CoefficientEffectiveness IndexPermeability Index
high-yield well>100<0.5<0.4
Middle-yield well10–1000.5–0.70.4–0.7
Low-yield well<10>0.7>0.7
Table 2. Effectiveness Evaluation of Multiple Inter-well Buried Hill Reservoirs.
Well NameDifference in Deep and Shallow ResistivityFracture Density
1/m
Fracture Length
m/m2
Shear Wave Amplitude RatioEffectiveness IndexProductivity Coefficient
B well2.870.781.830.47<0.5219.3
D well2.490.491.640.650.5–0.758.2
E well2.170.341.180.82>0.72.8
Table 3. Comparison of other fracture factors and productivity prediction method.
Well NameProductivity CoefficientEffectiveness IndexPermeability IndexAngle
°
Percentage
of Unfilled Fractures
%
B well219.3<0.5<0.4045
D well58.20.5–0.70.4–0.7<3033
E well2.8>0.7>0.7>3020
Disclaimer/Publisher’s Note: The statements, opinions and data contained in all publications are solely those of the individual author(s) and contributor(s) and not of MDPI and/or the editor(s). MDPI and/or the editor(s) disclaim responsibility for any injury to people or property resulting from any ideas, methods, instructions or products referred to in the content.

