


Lateral Ultimate Capacity of Monopile Foundations for Offshore Wind Turbines: Effects of Monopile Geometry and Soil Stiffness Properties


Abstract
:1. Introduction
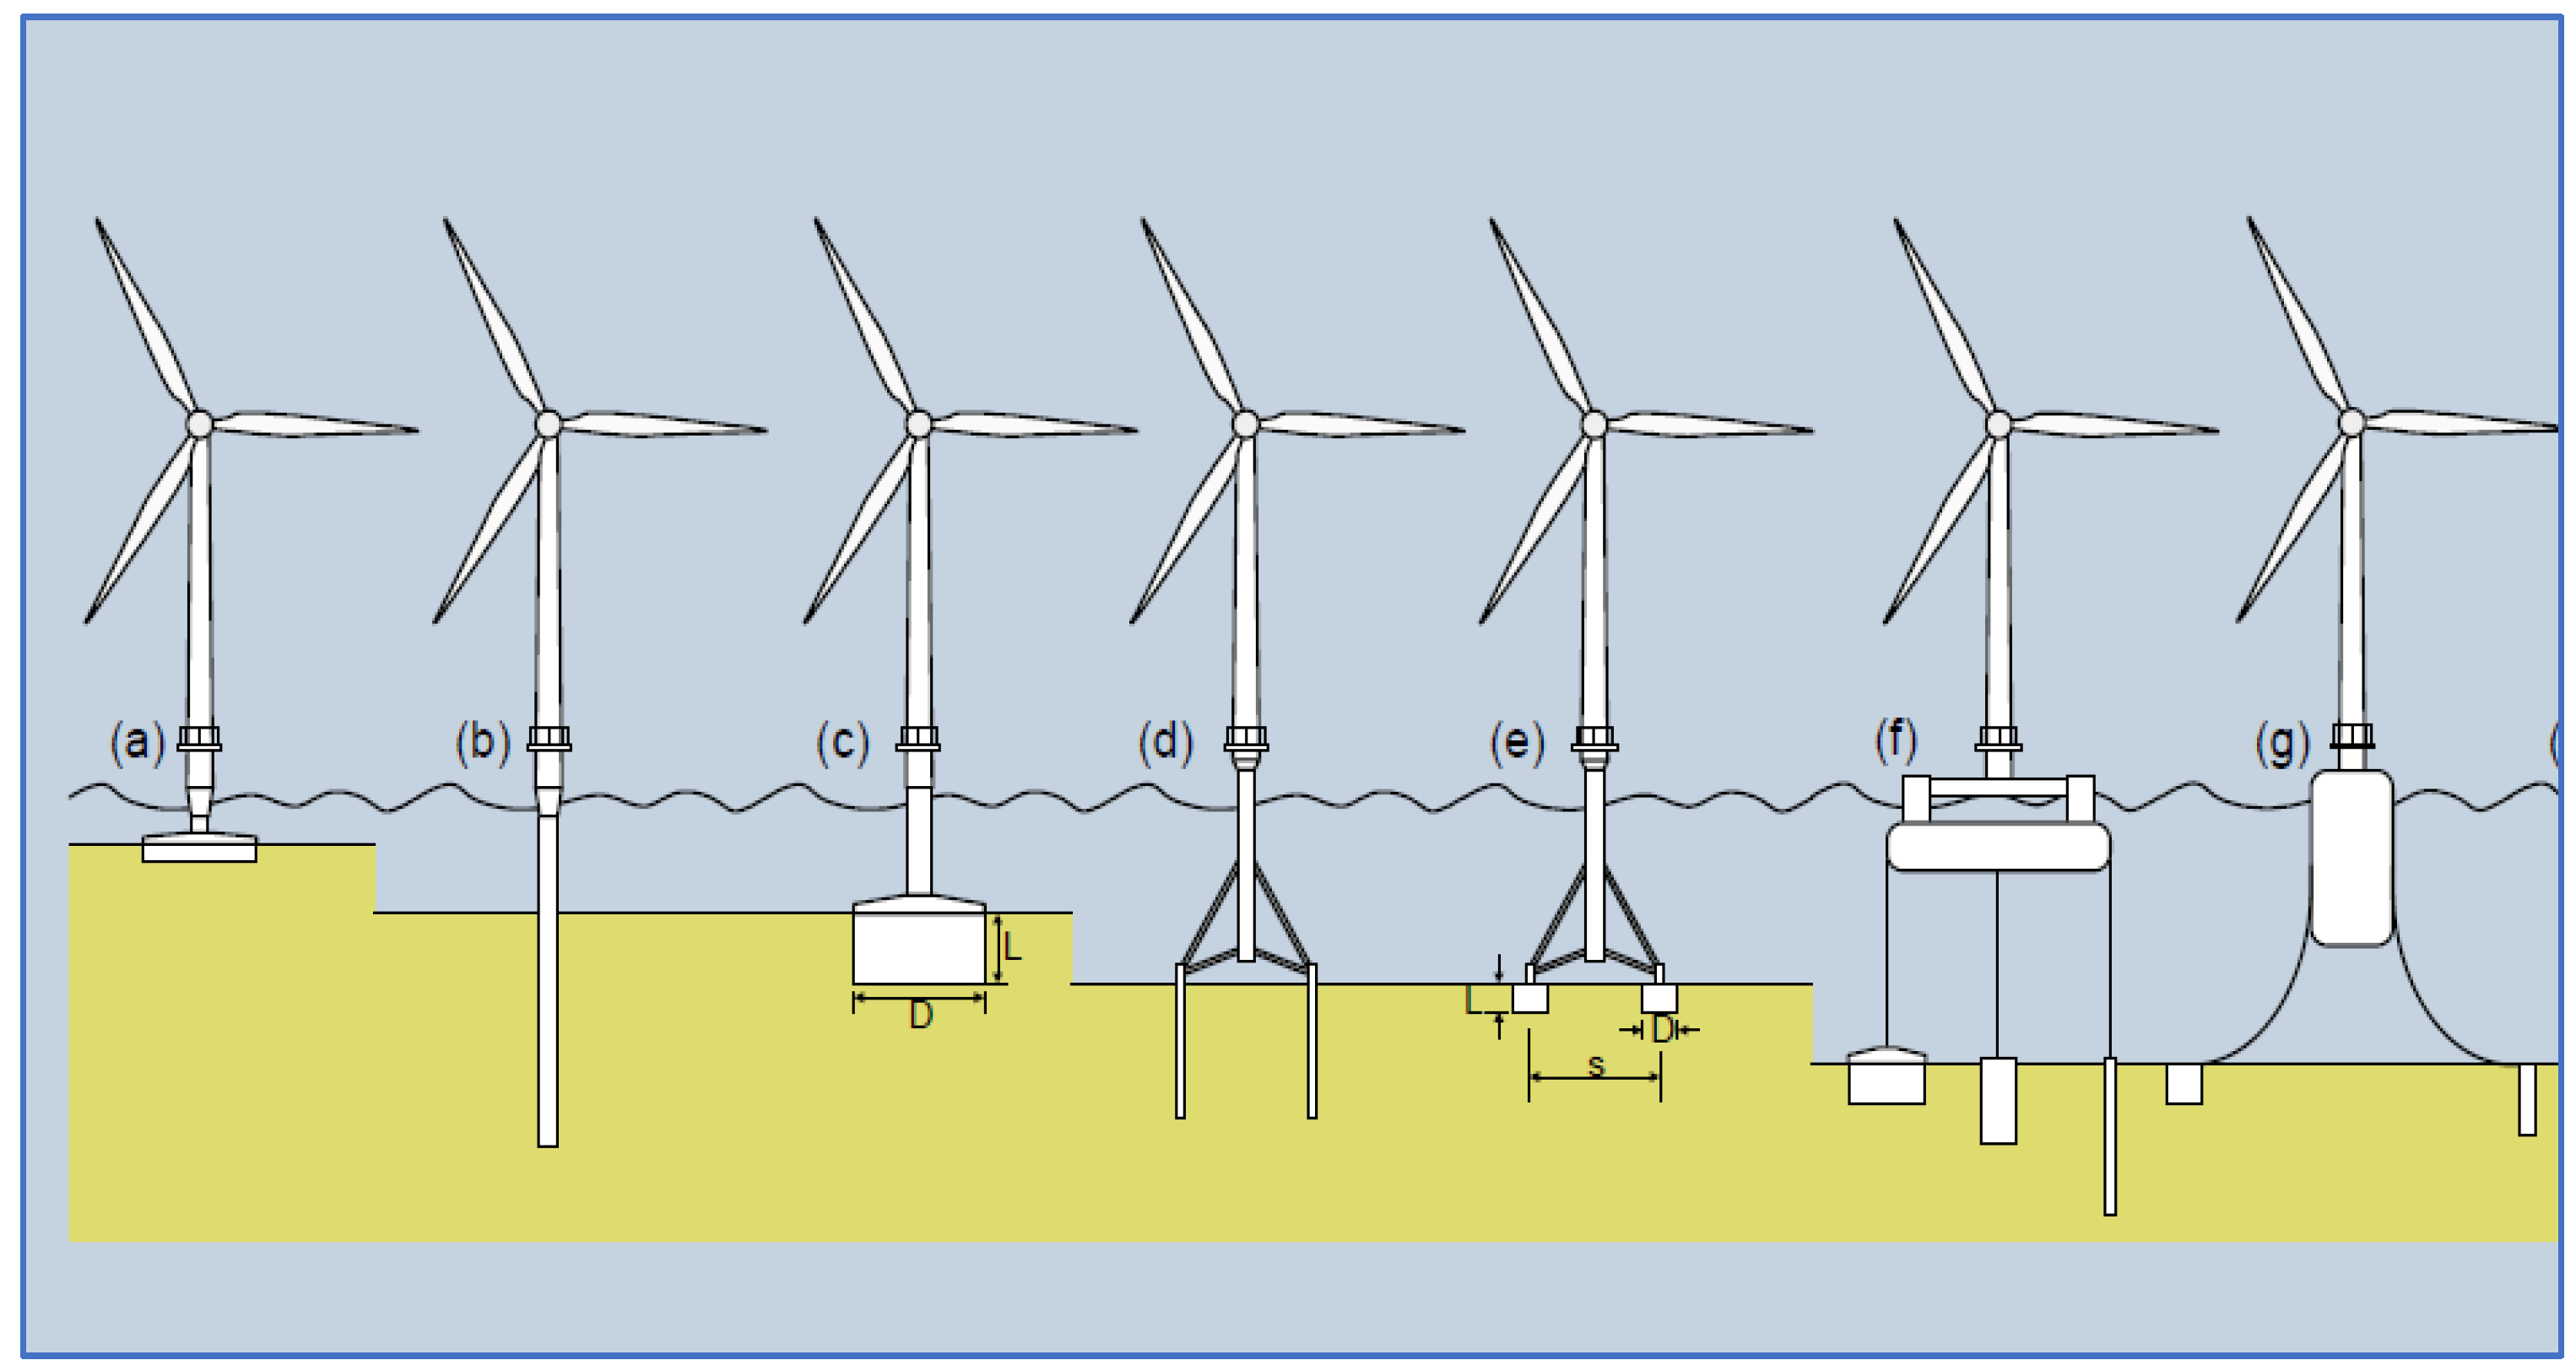
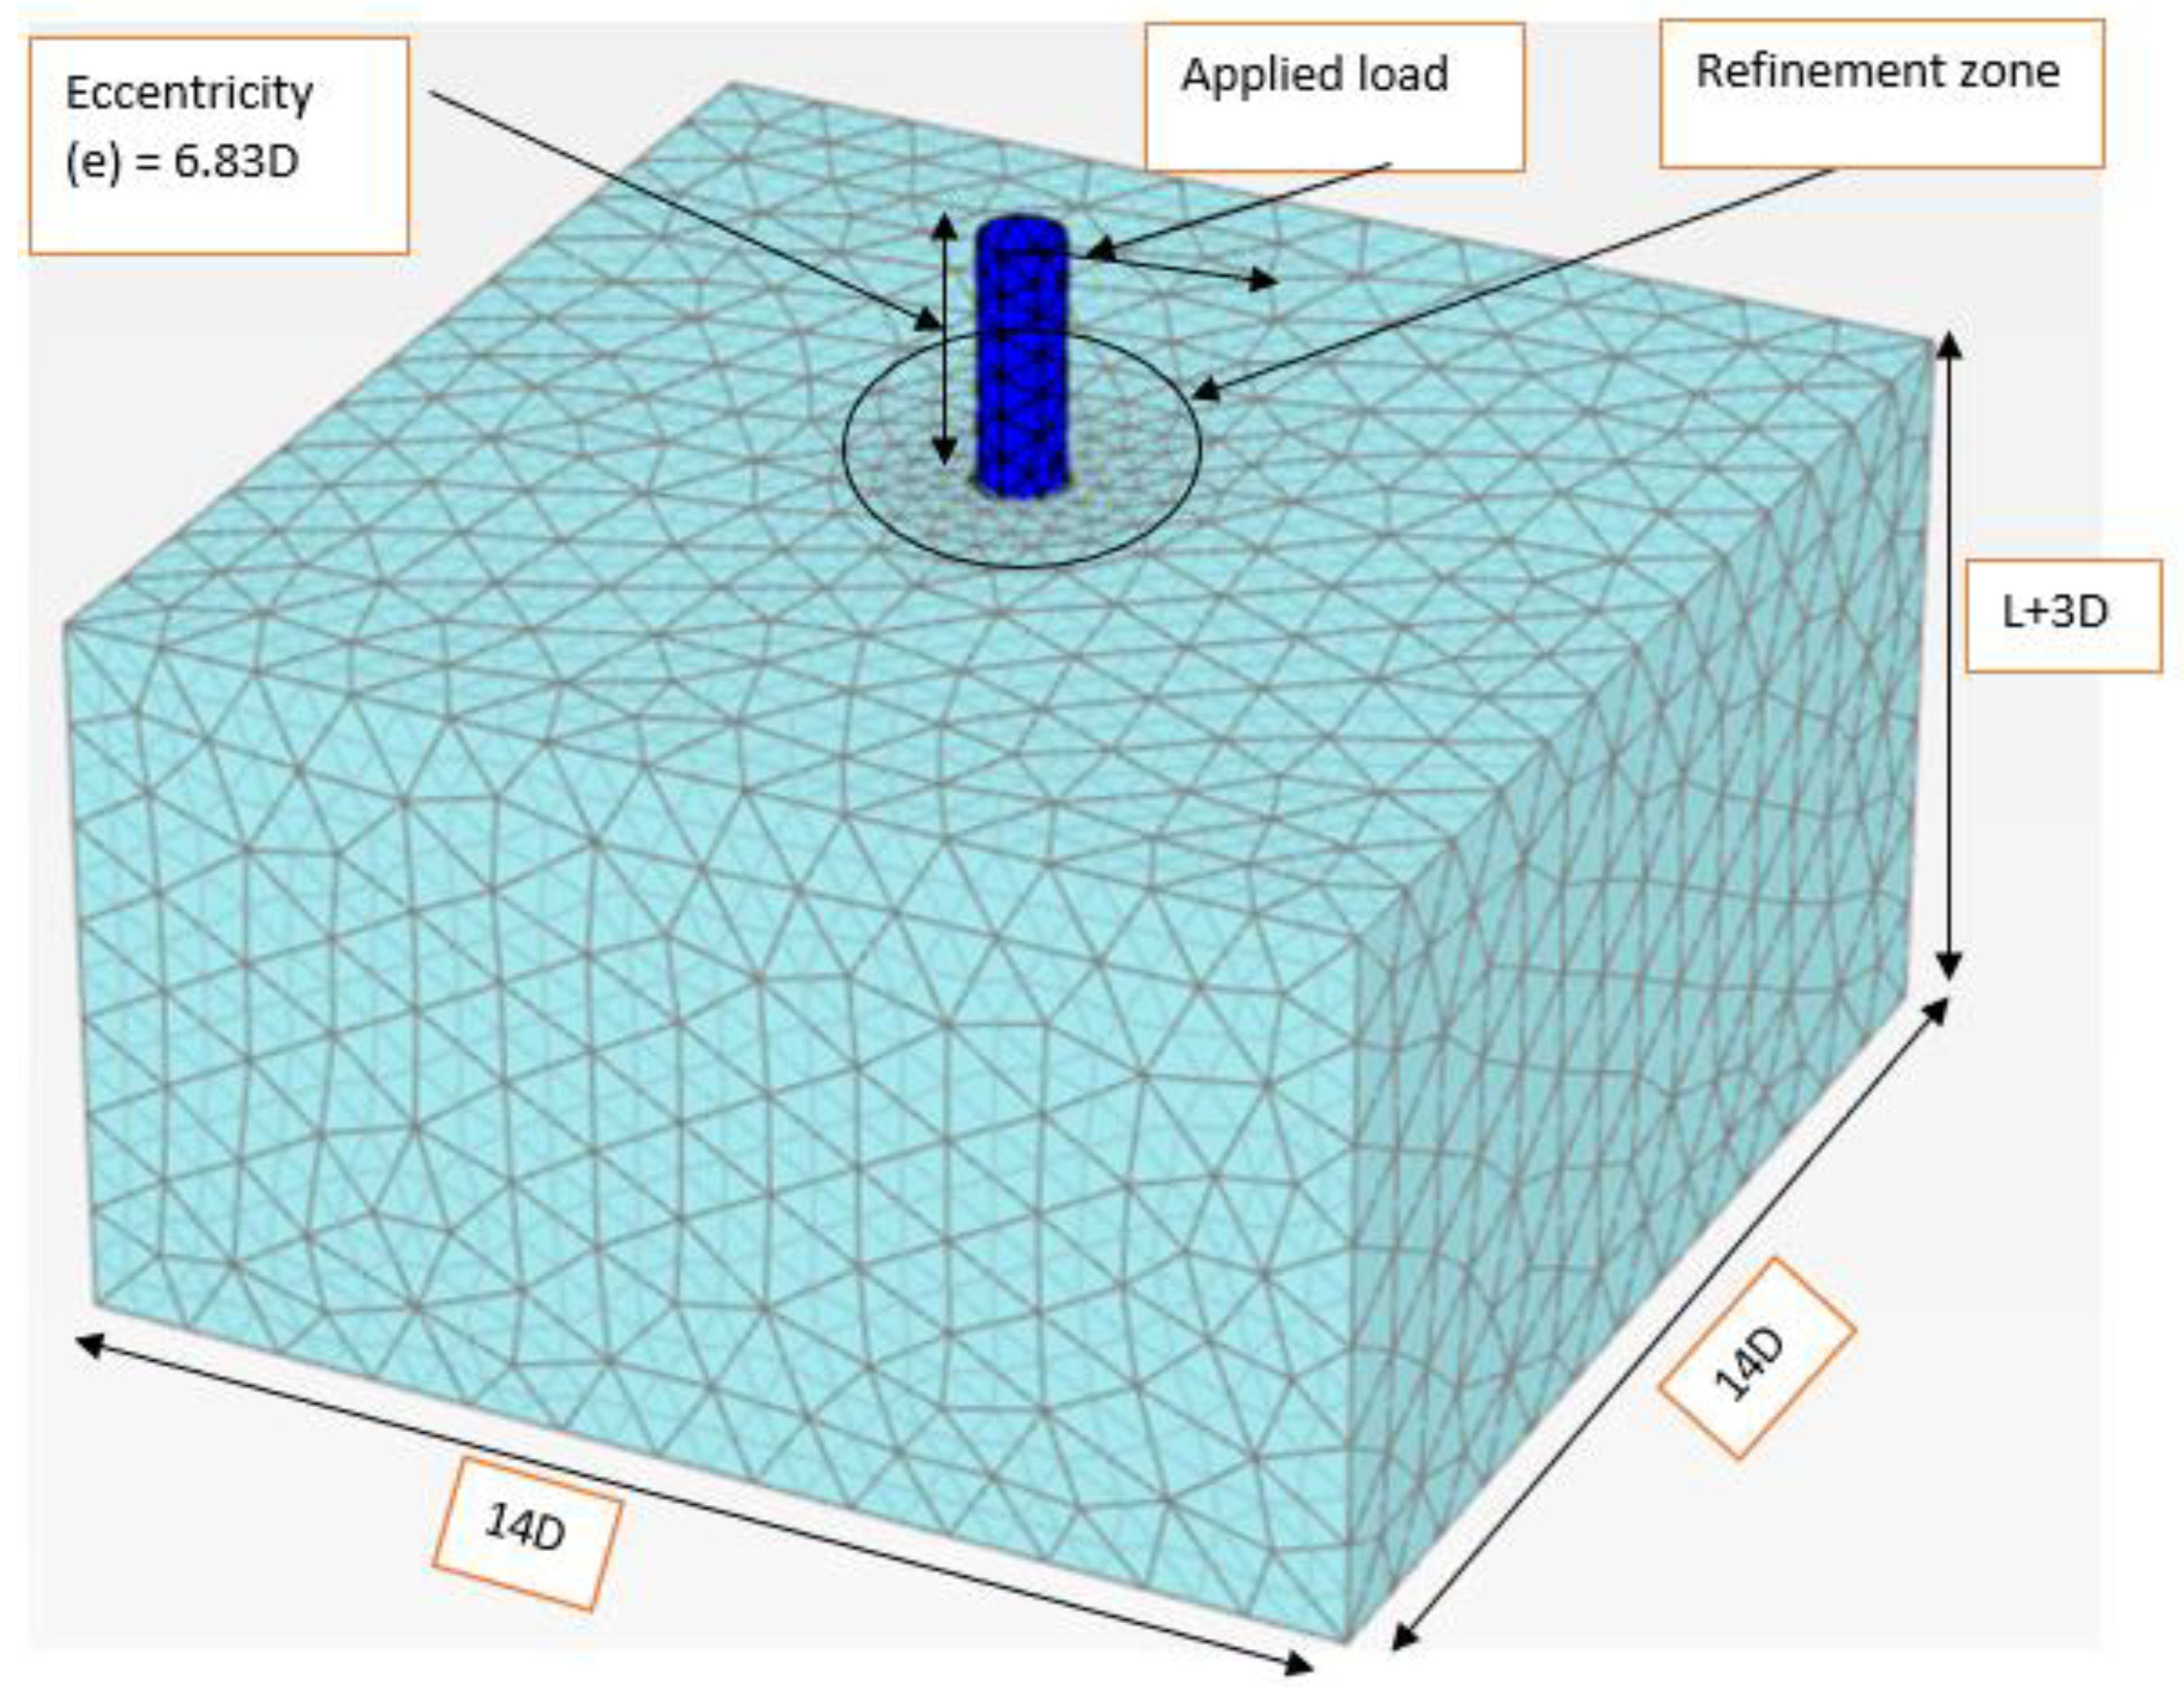
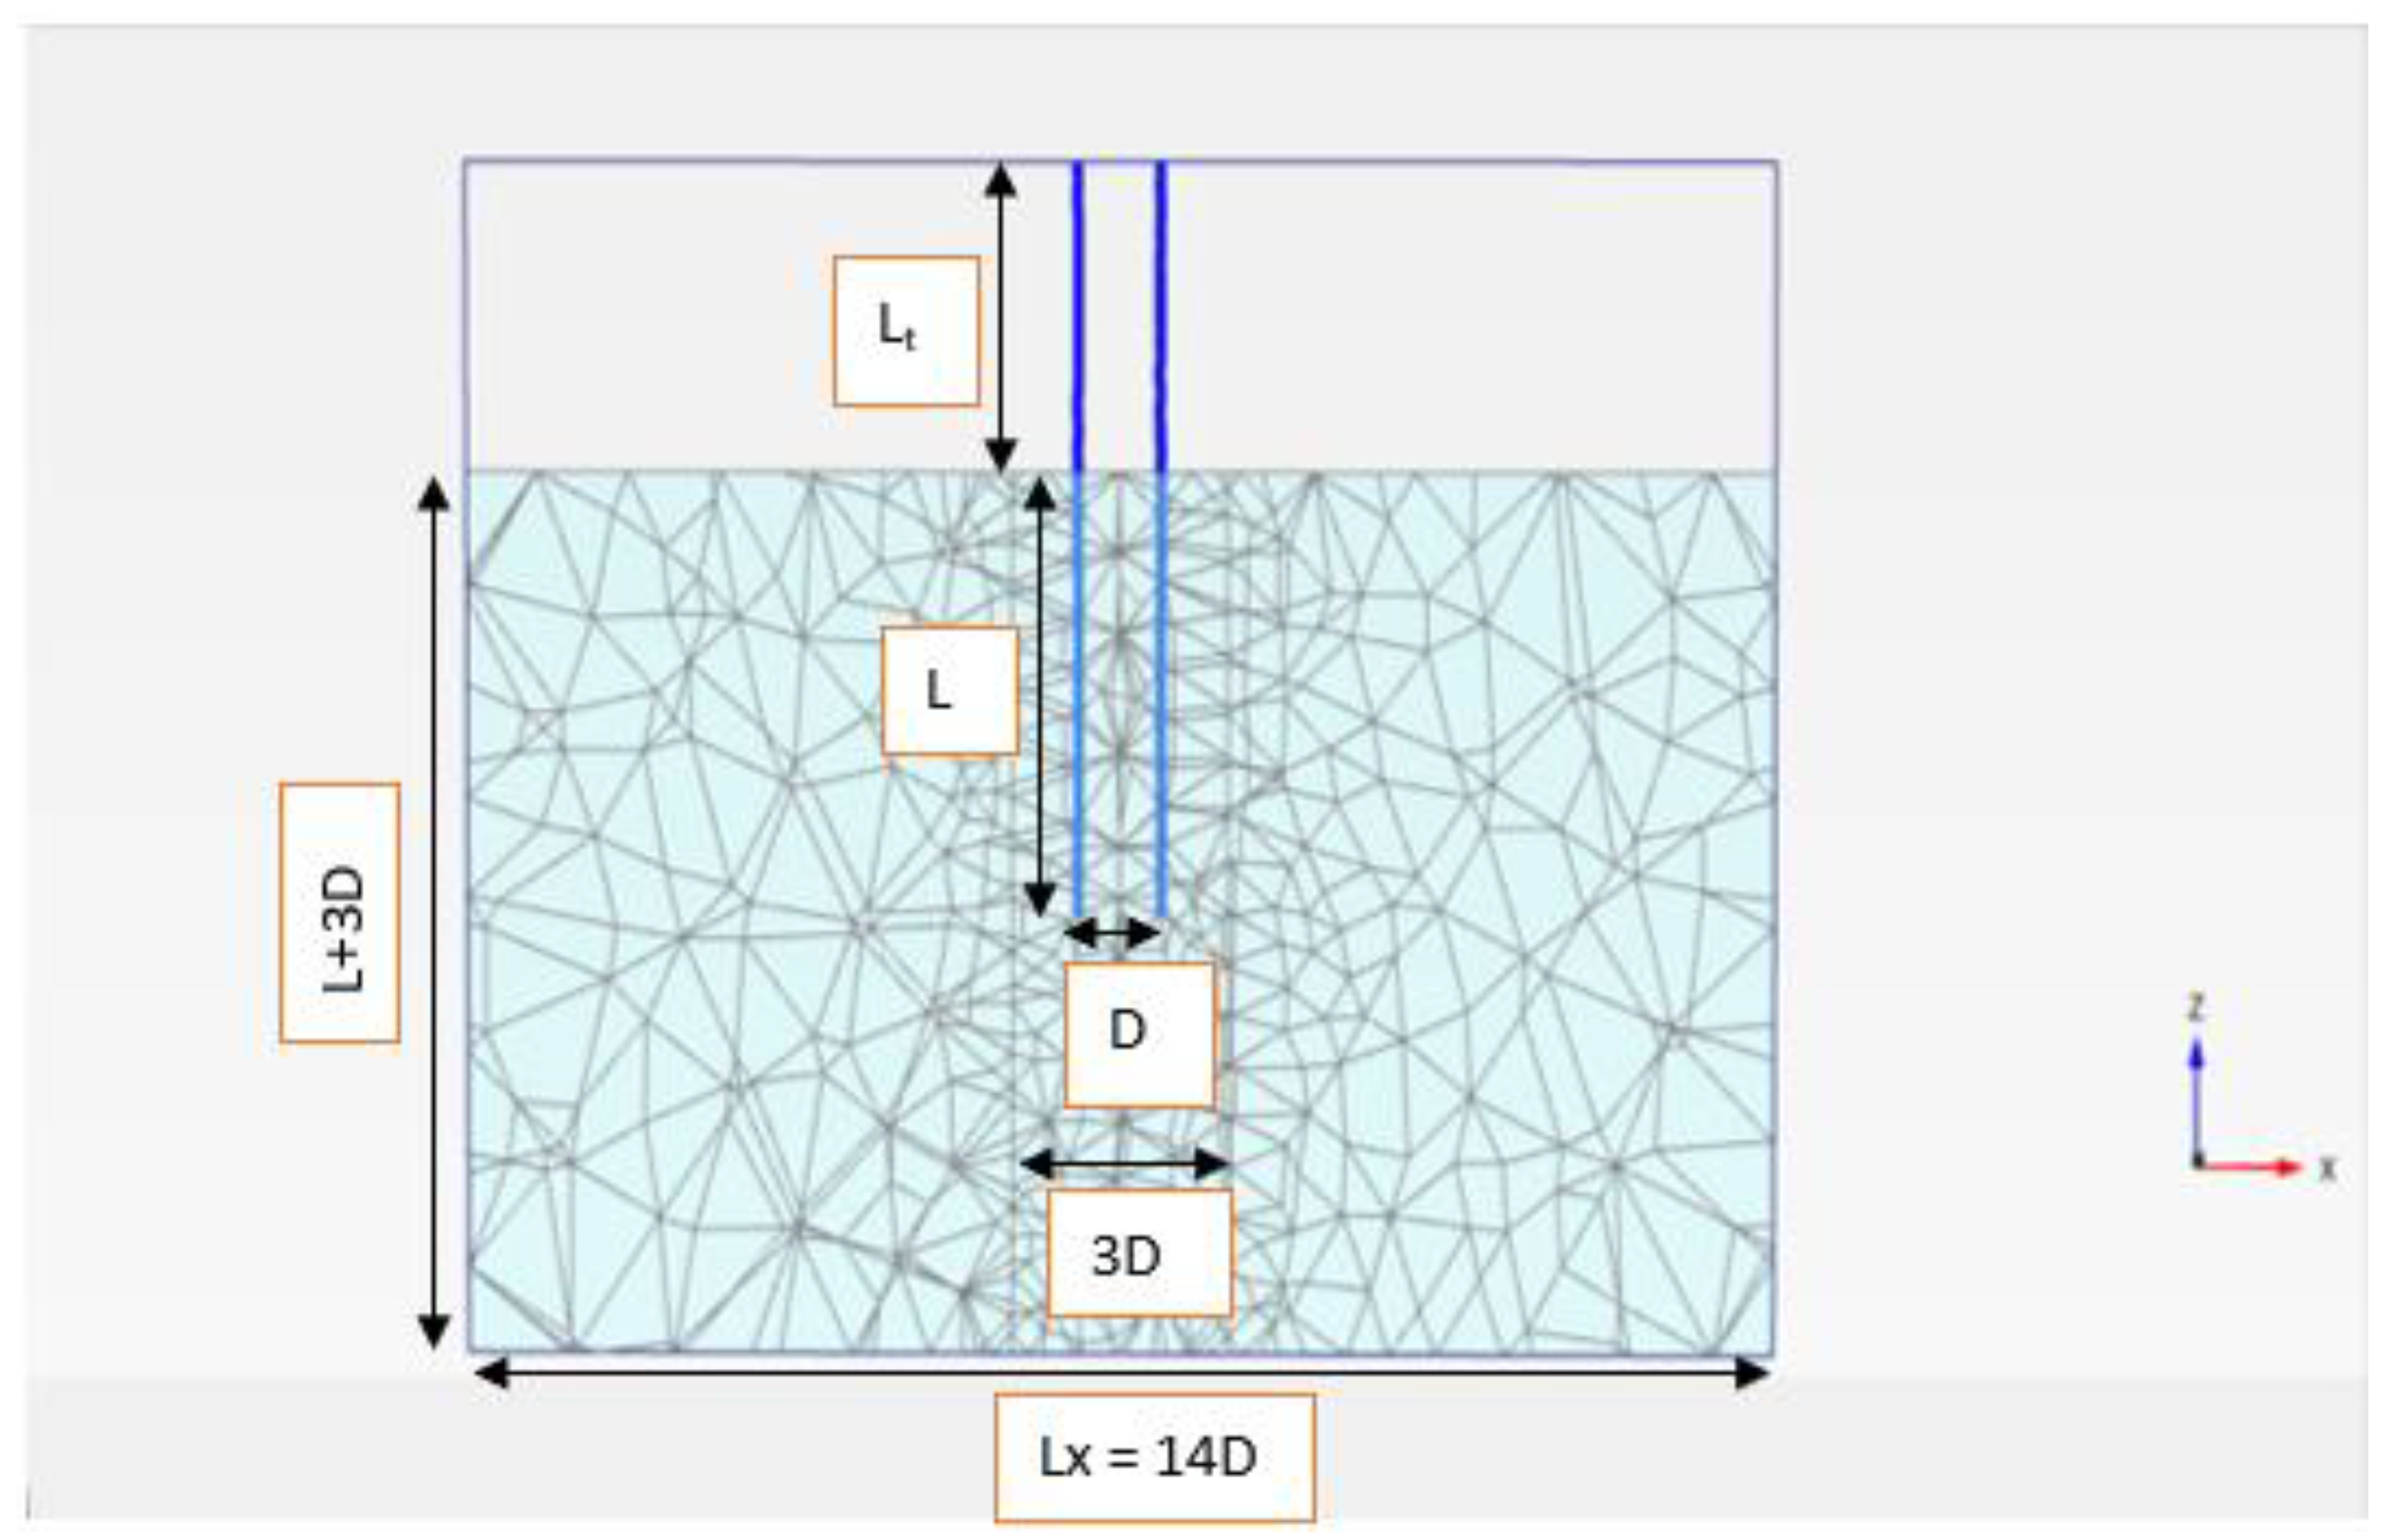
1.1. Methodology
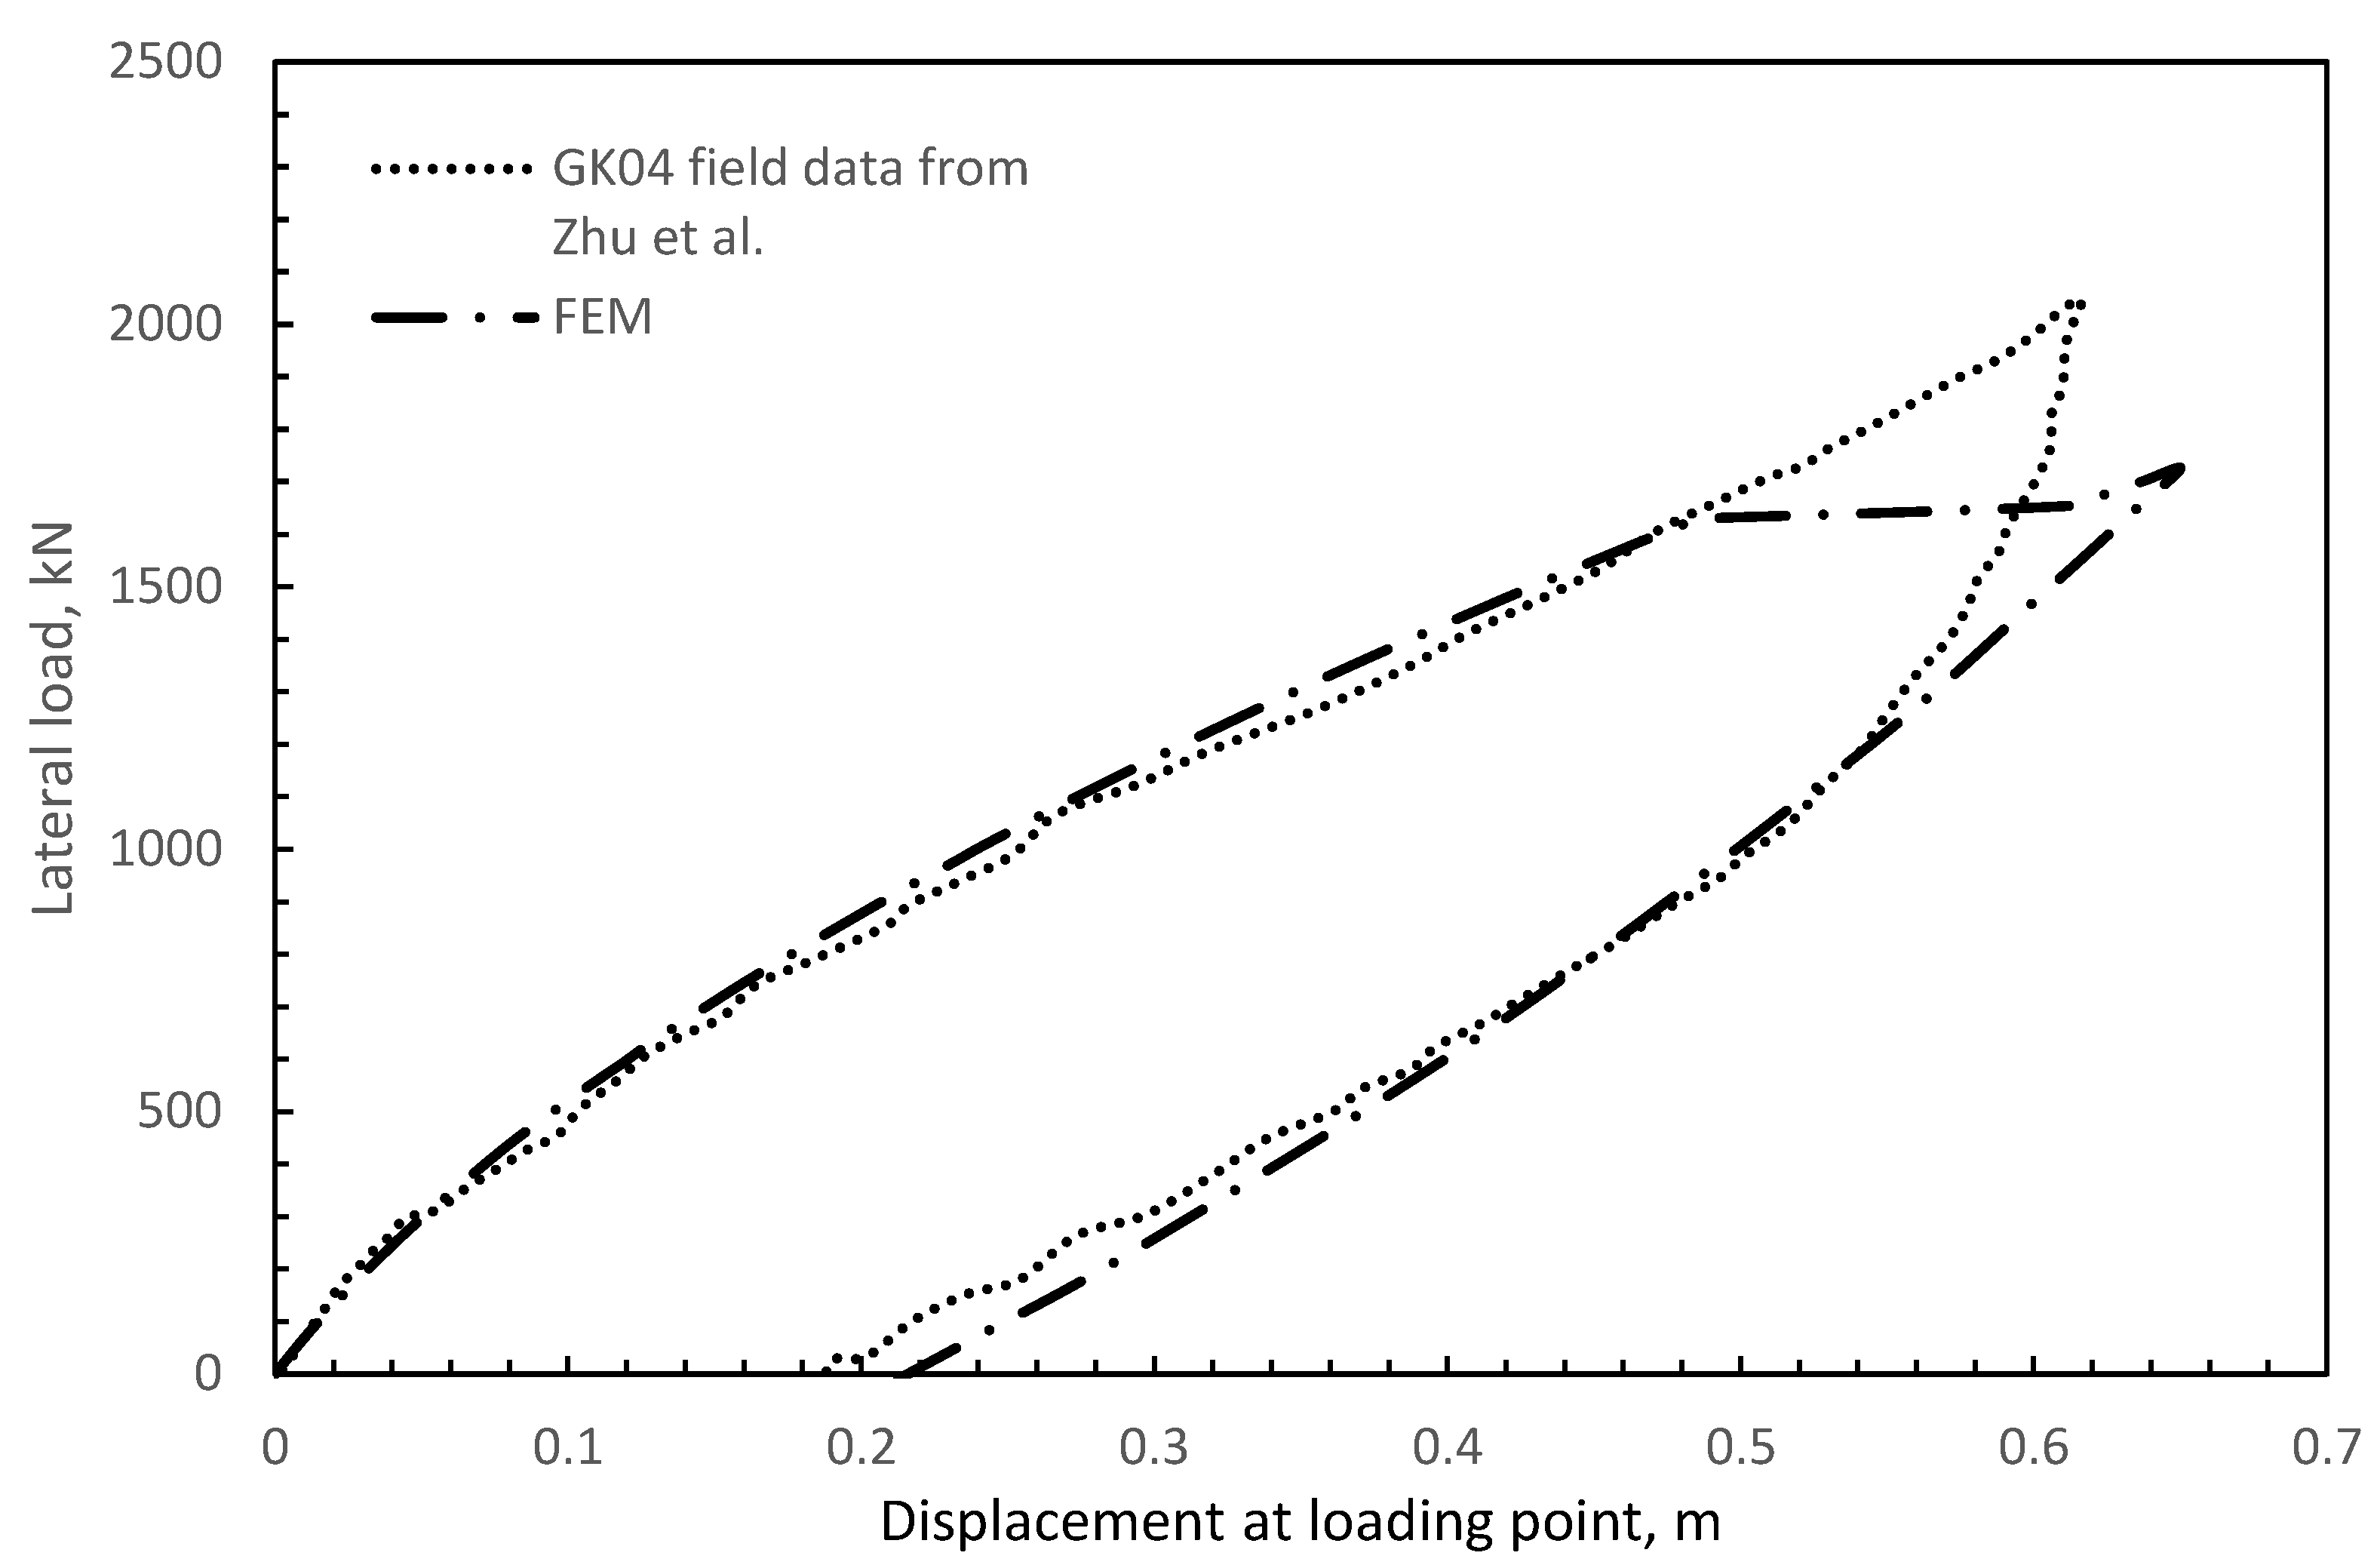
1.1.1. Validation
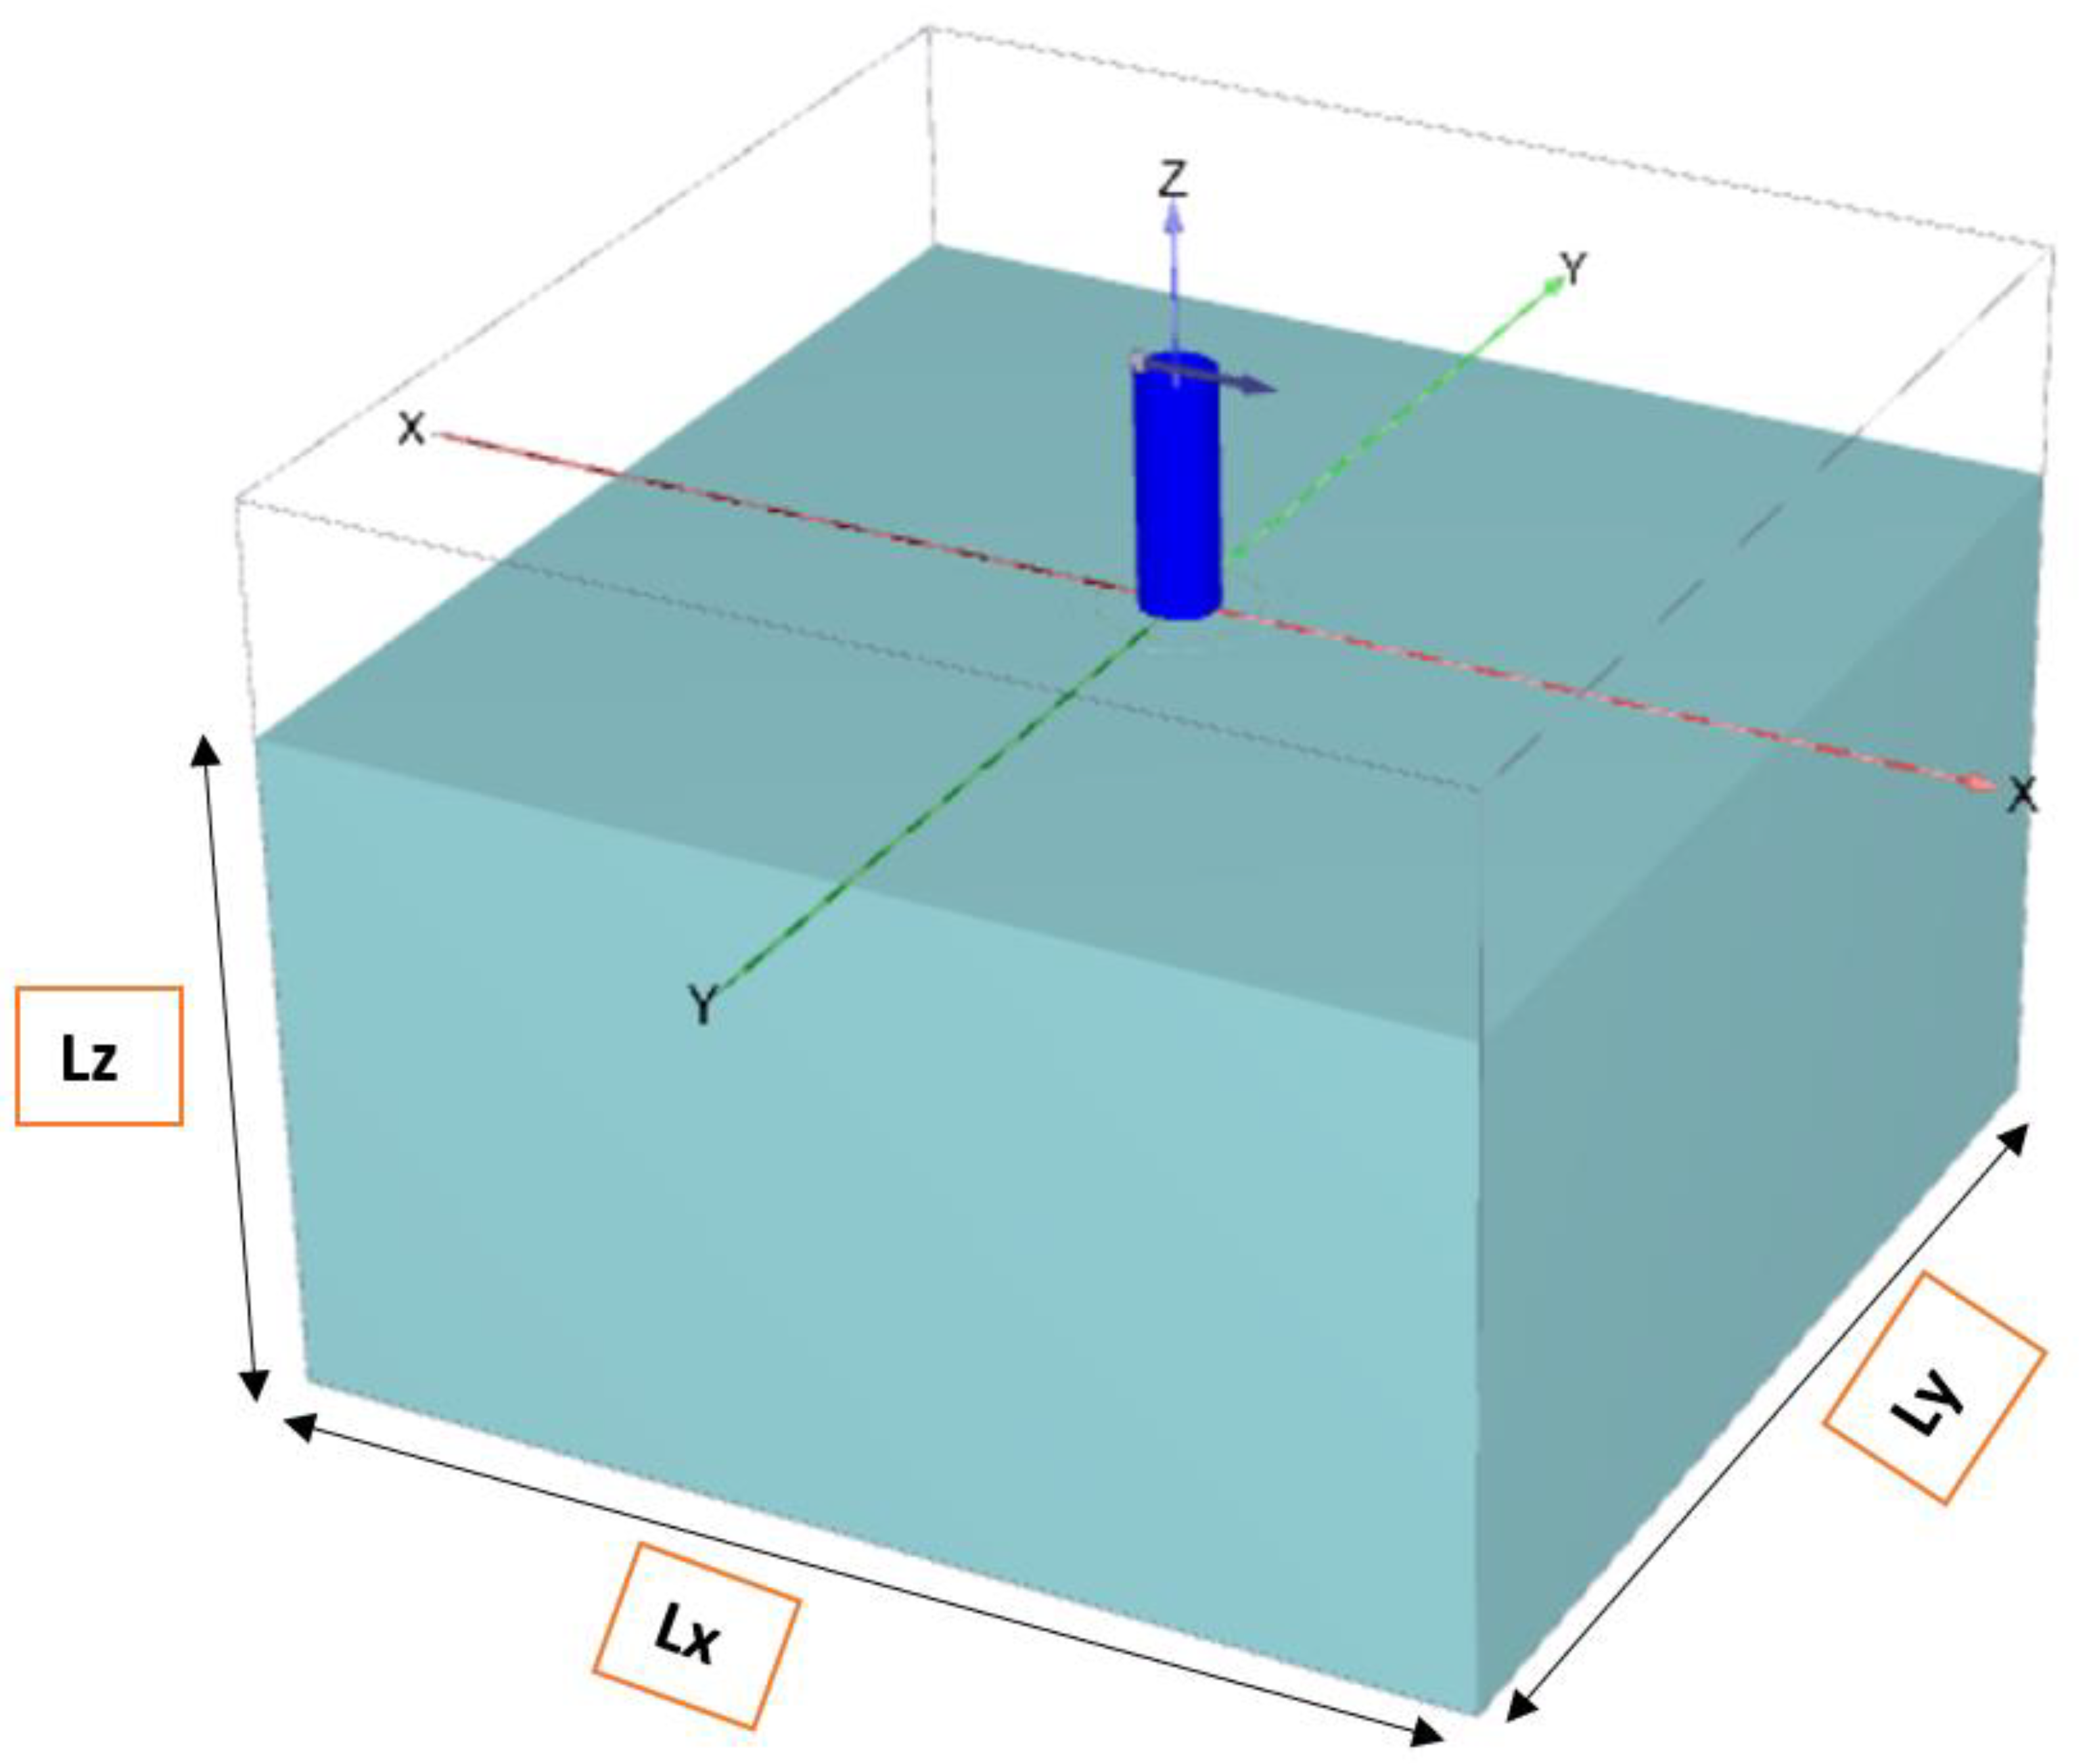
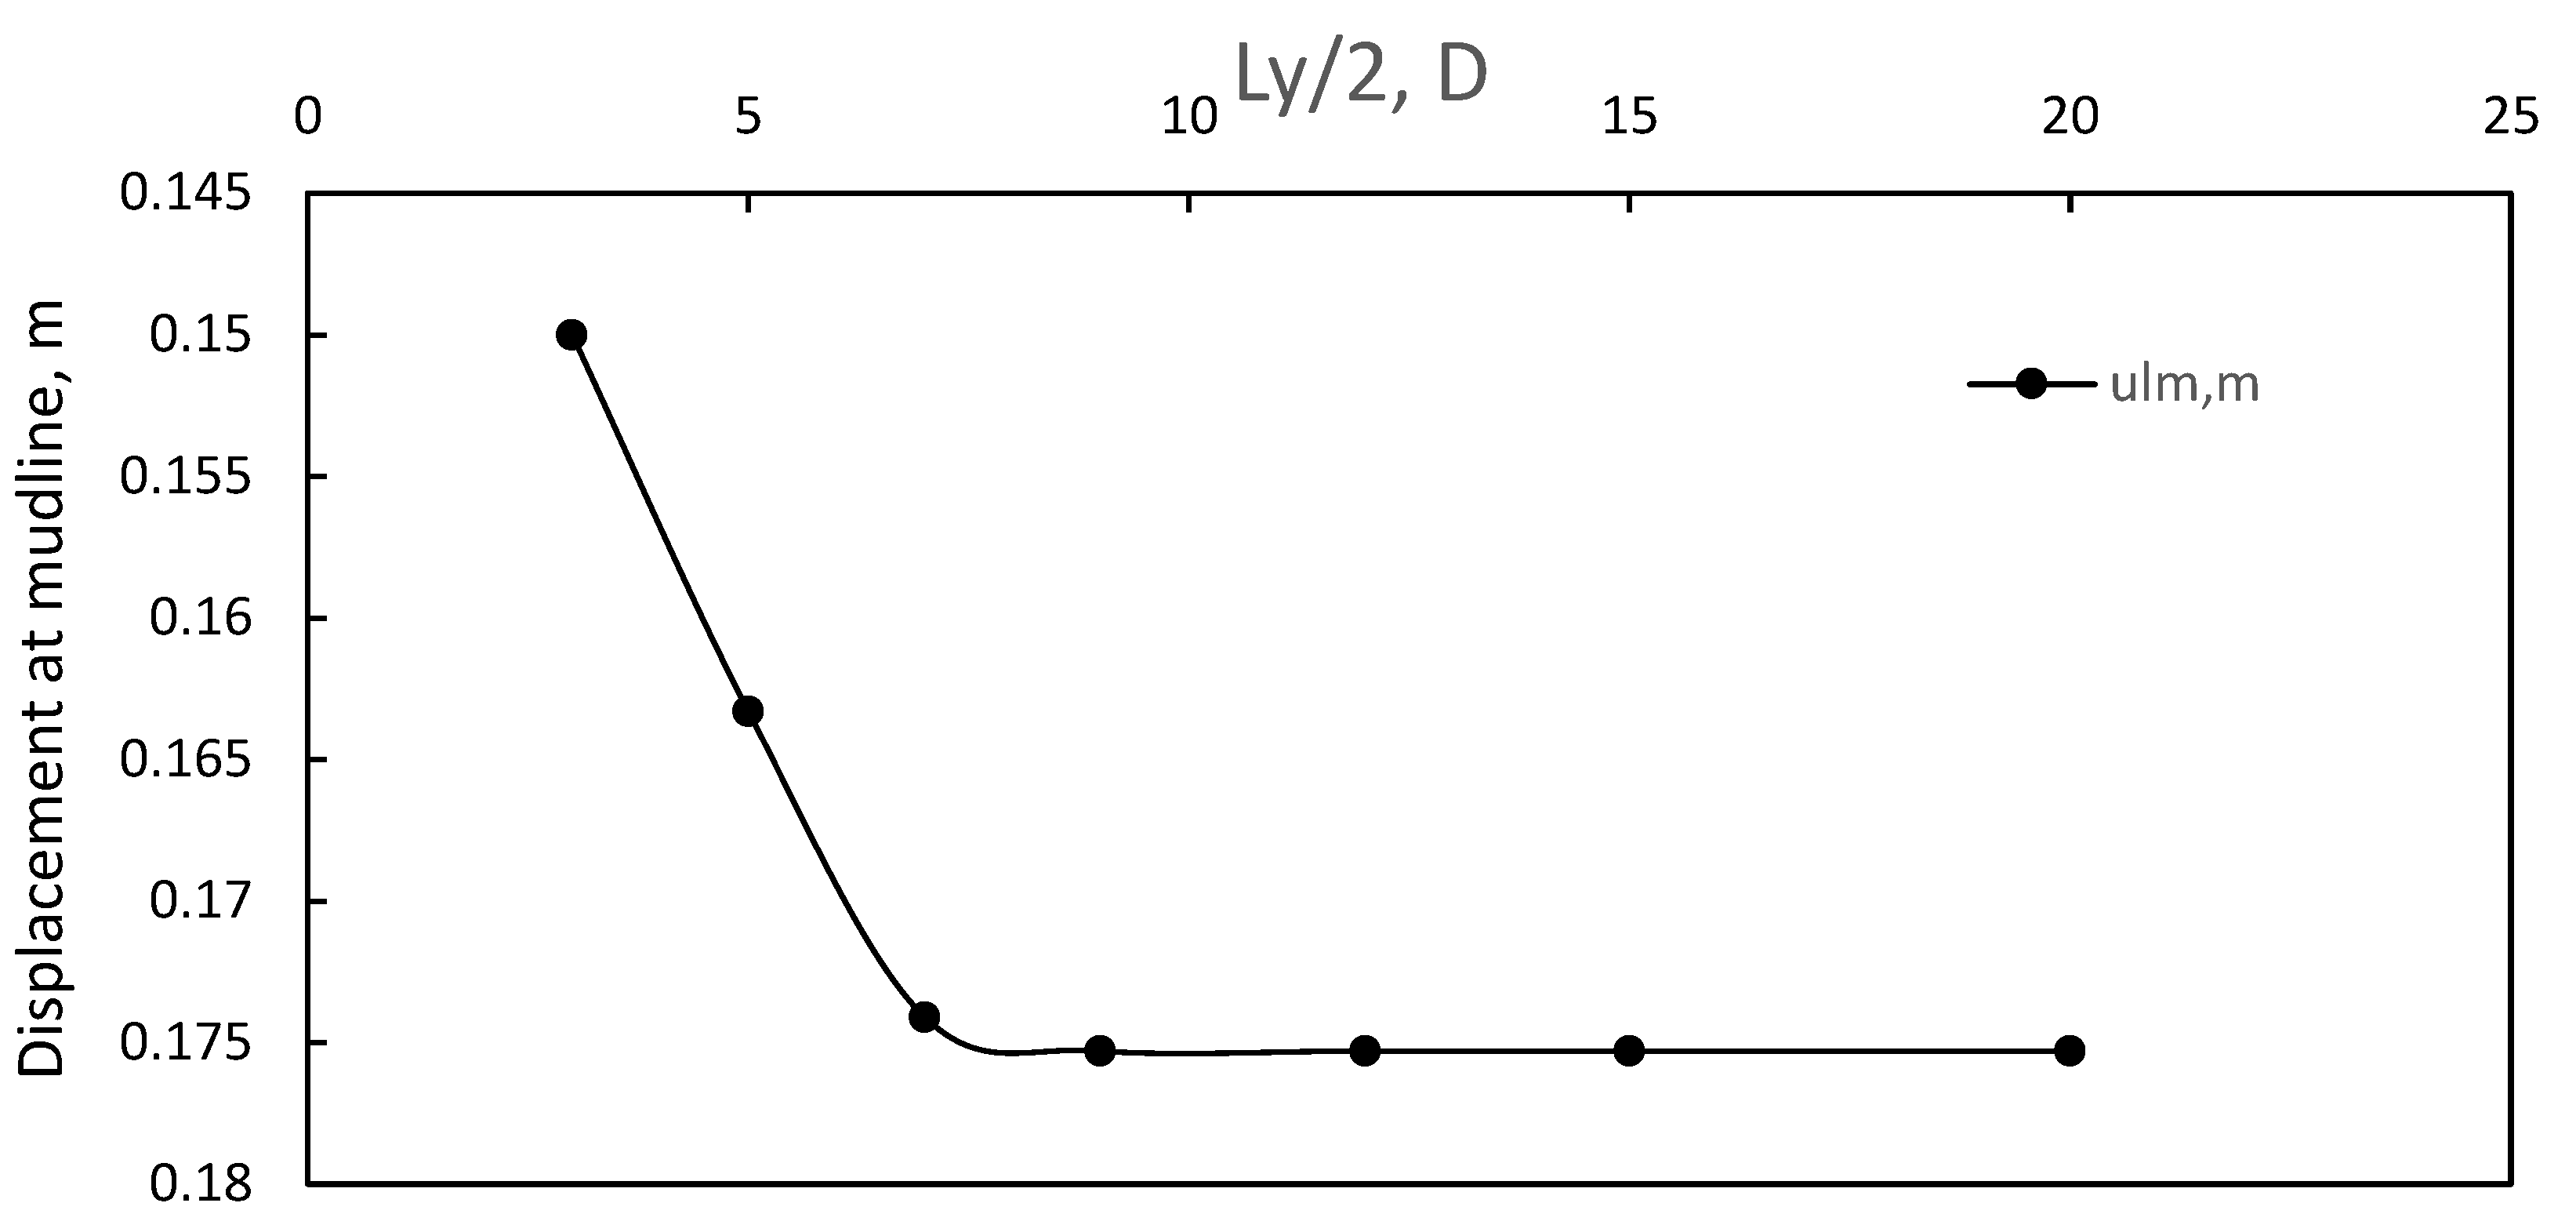
1.1.2. Convergence Study
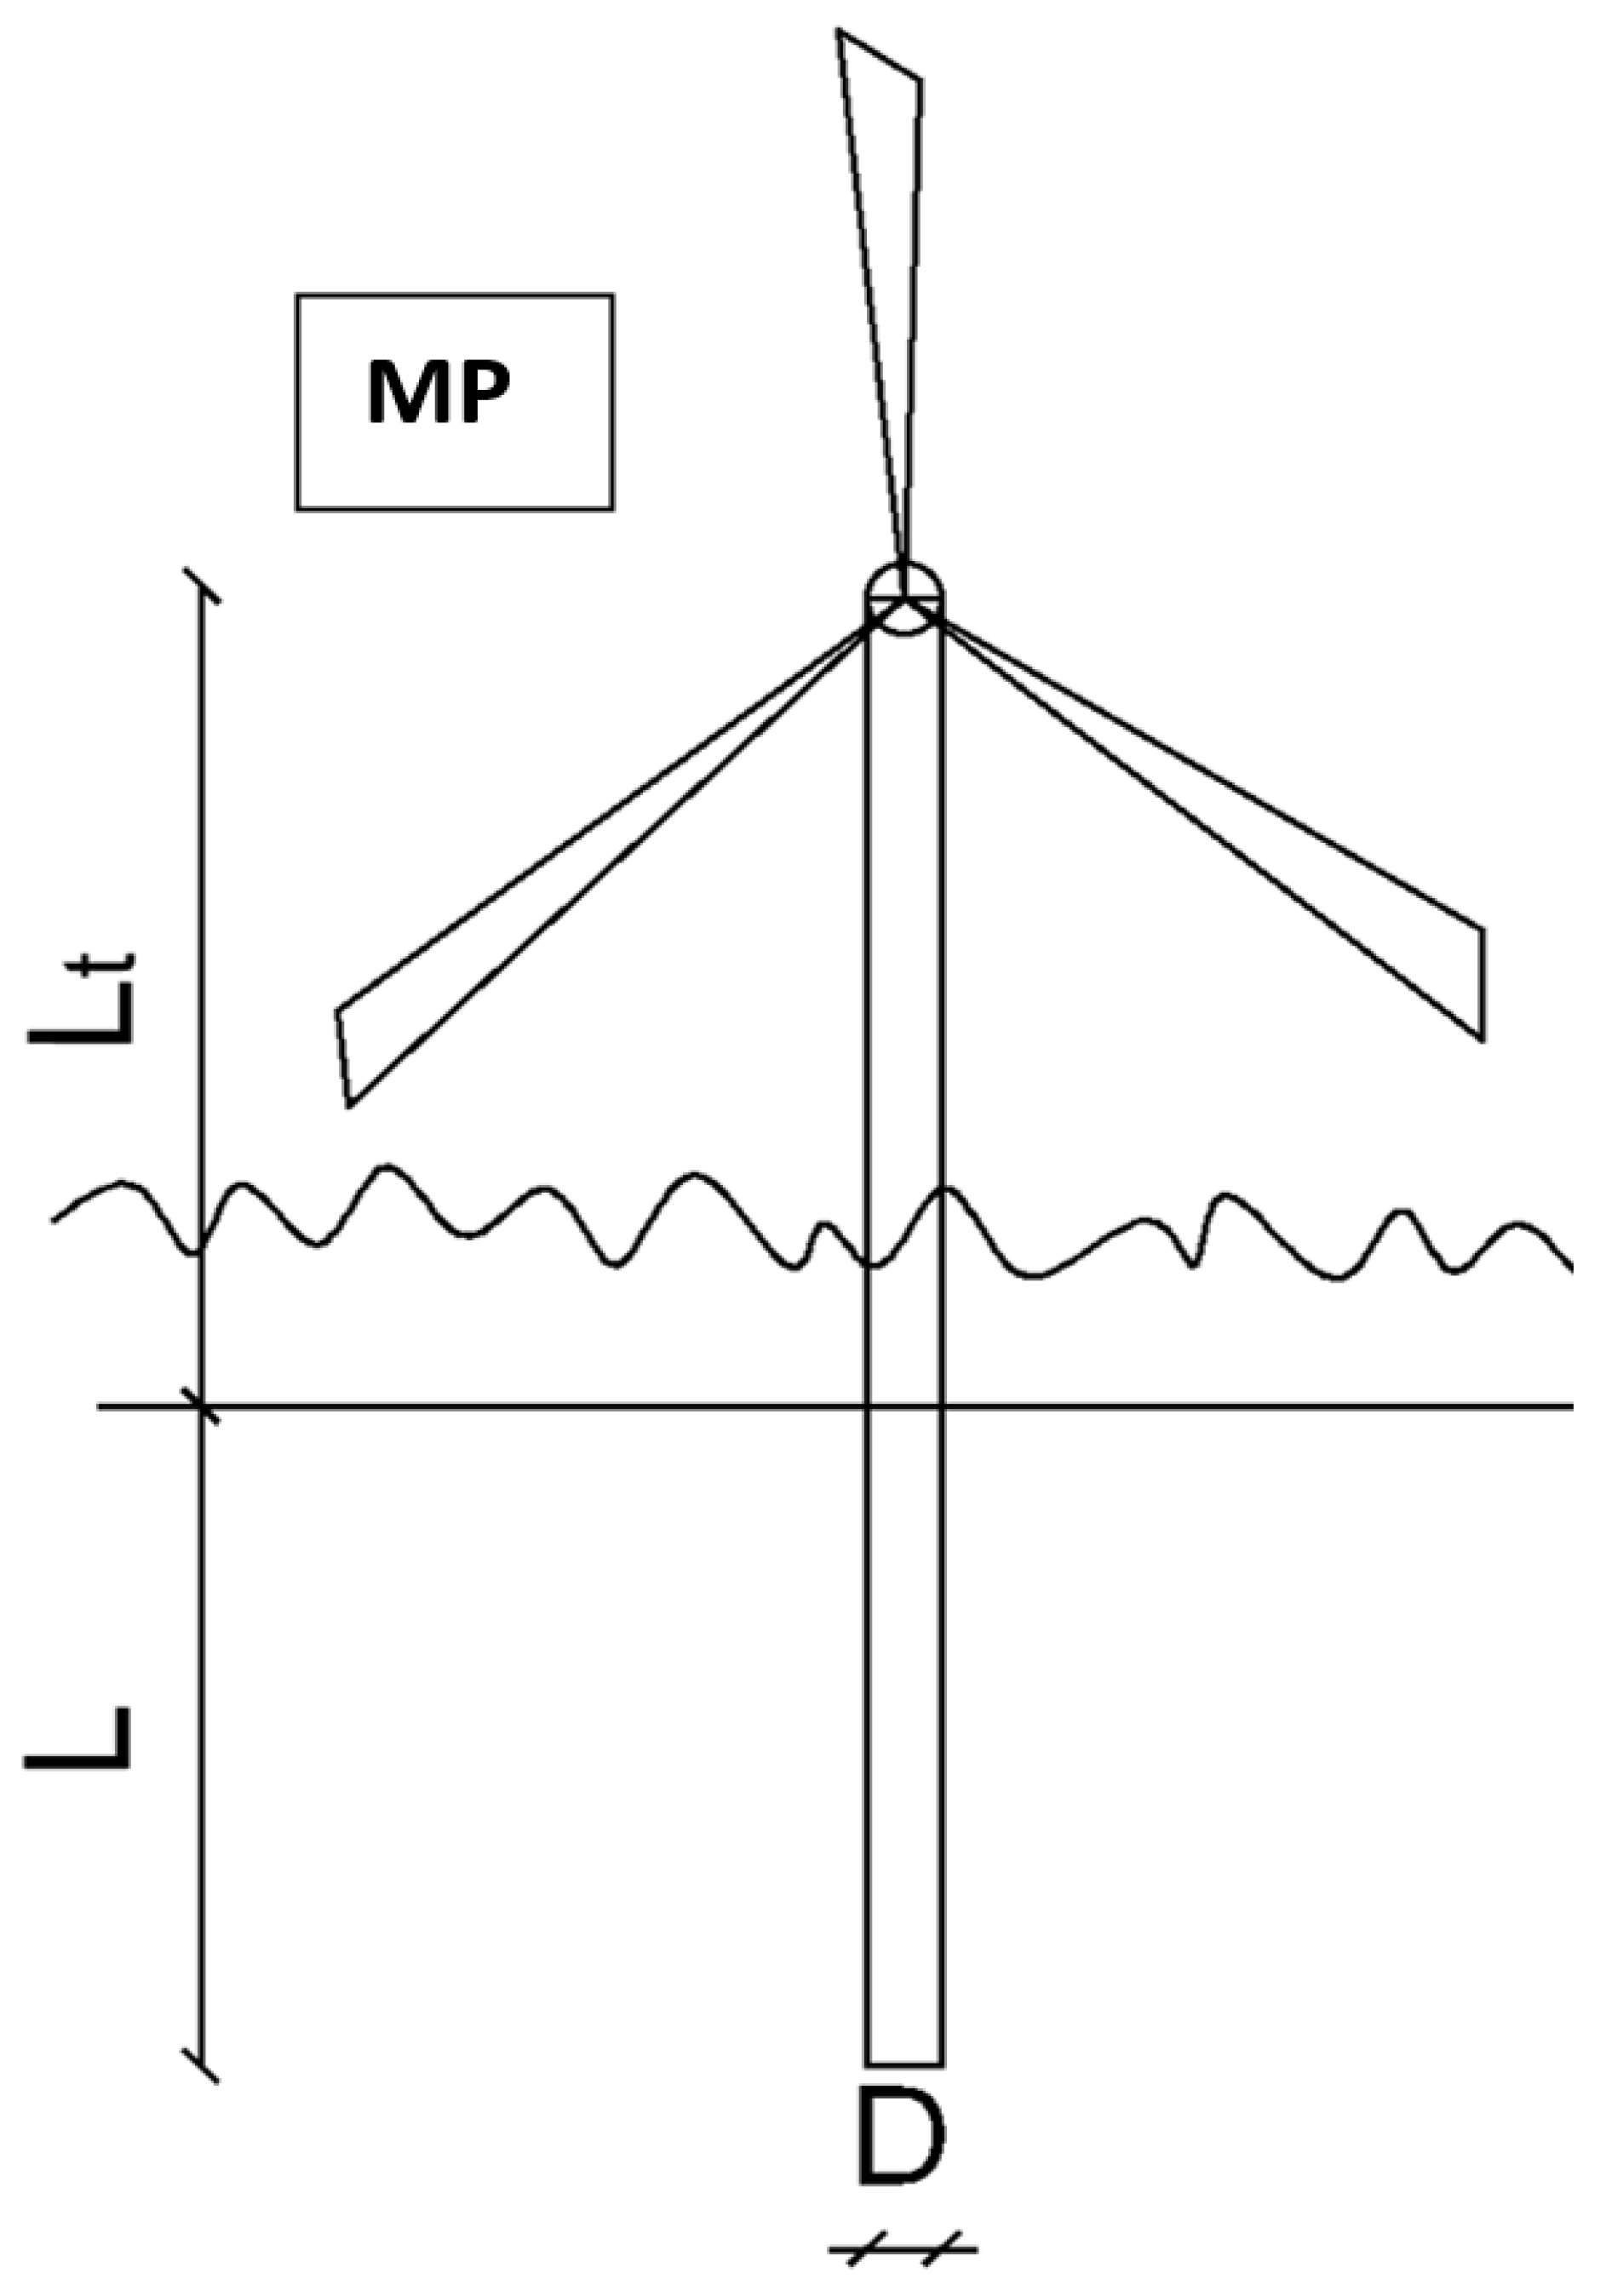
2. Parametric Study
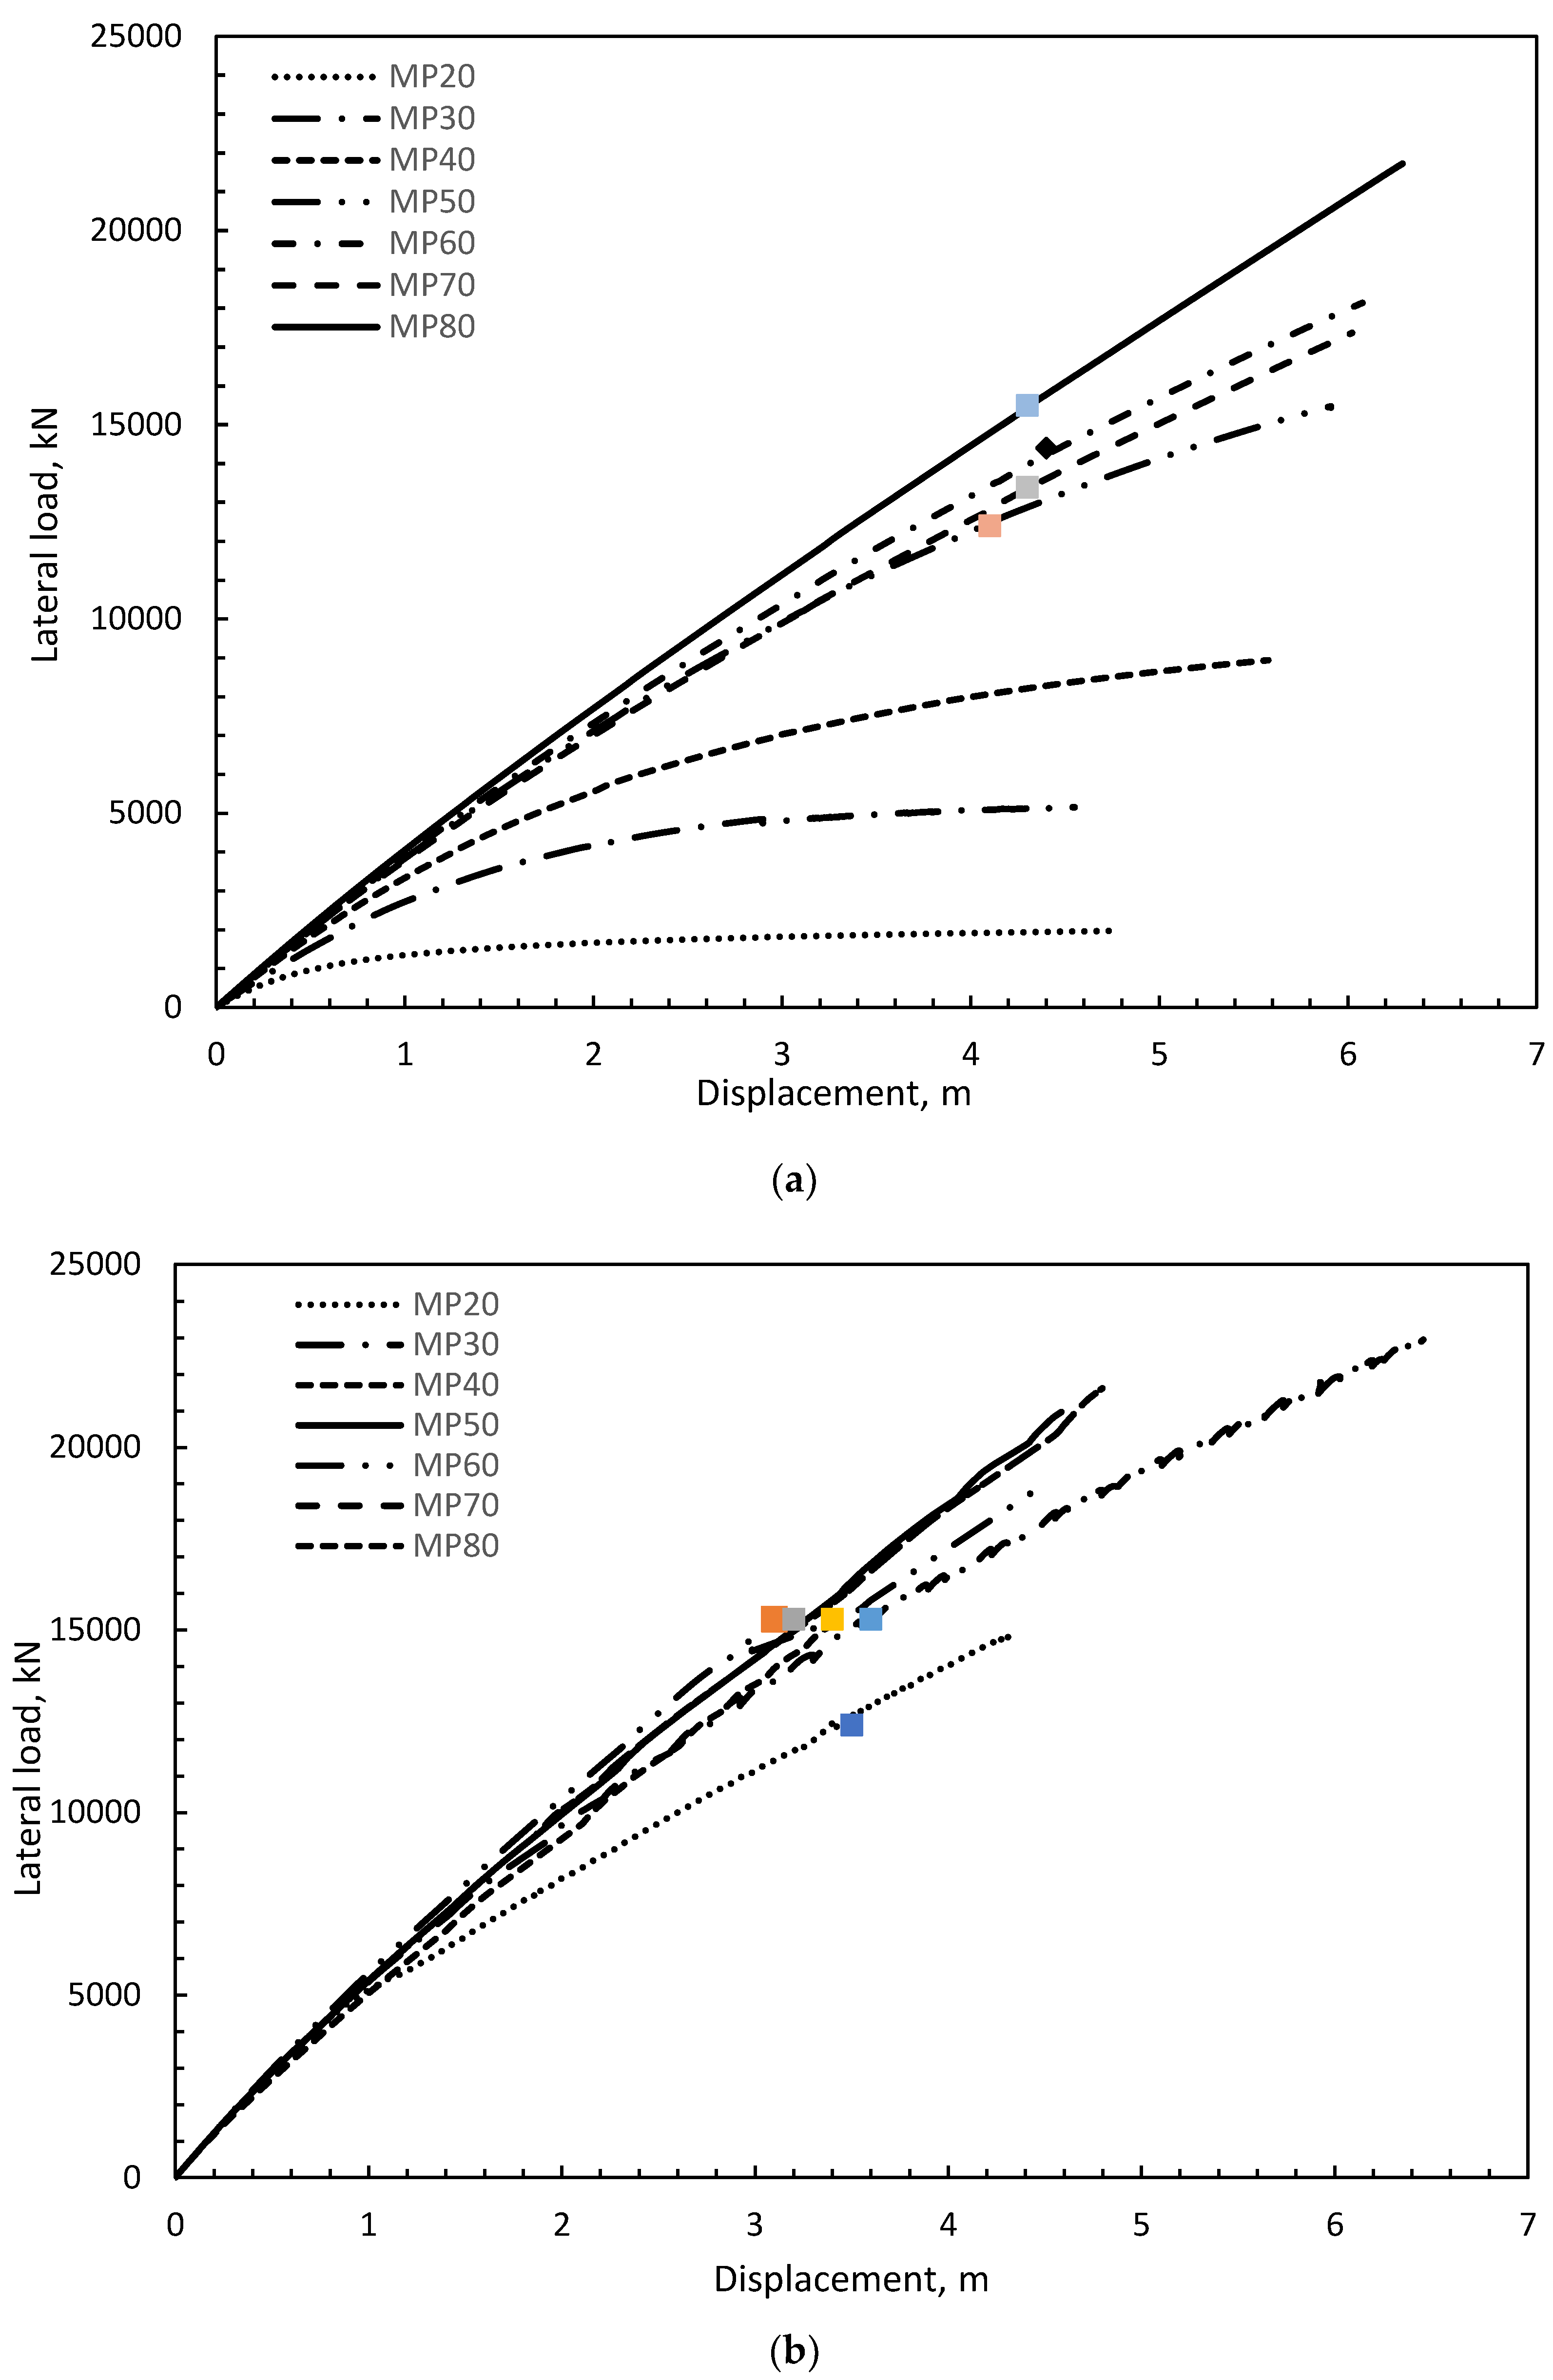
Monopile Lateral Ultimate Capacity
3. Results
4. Discussion
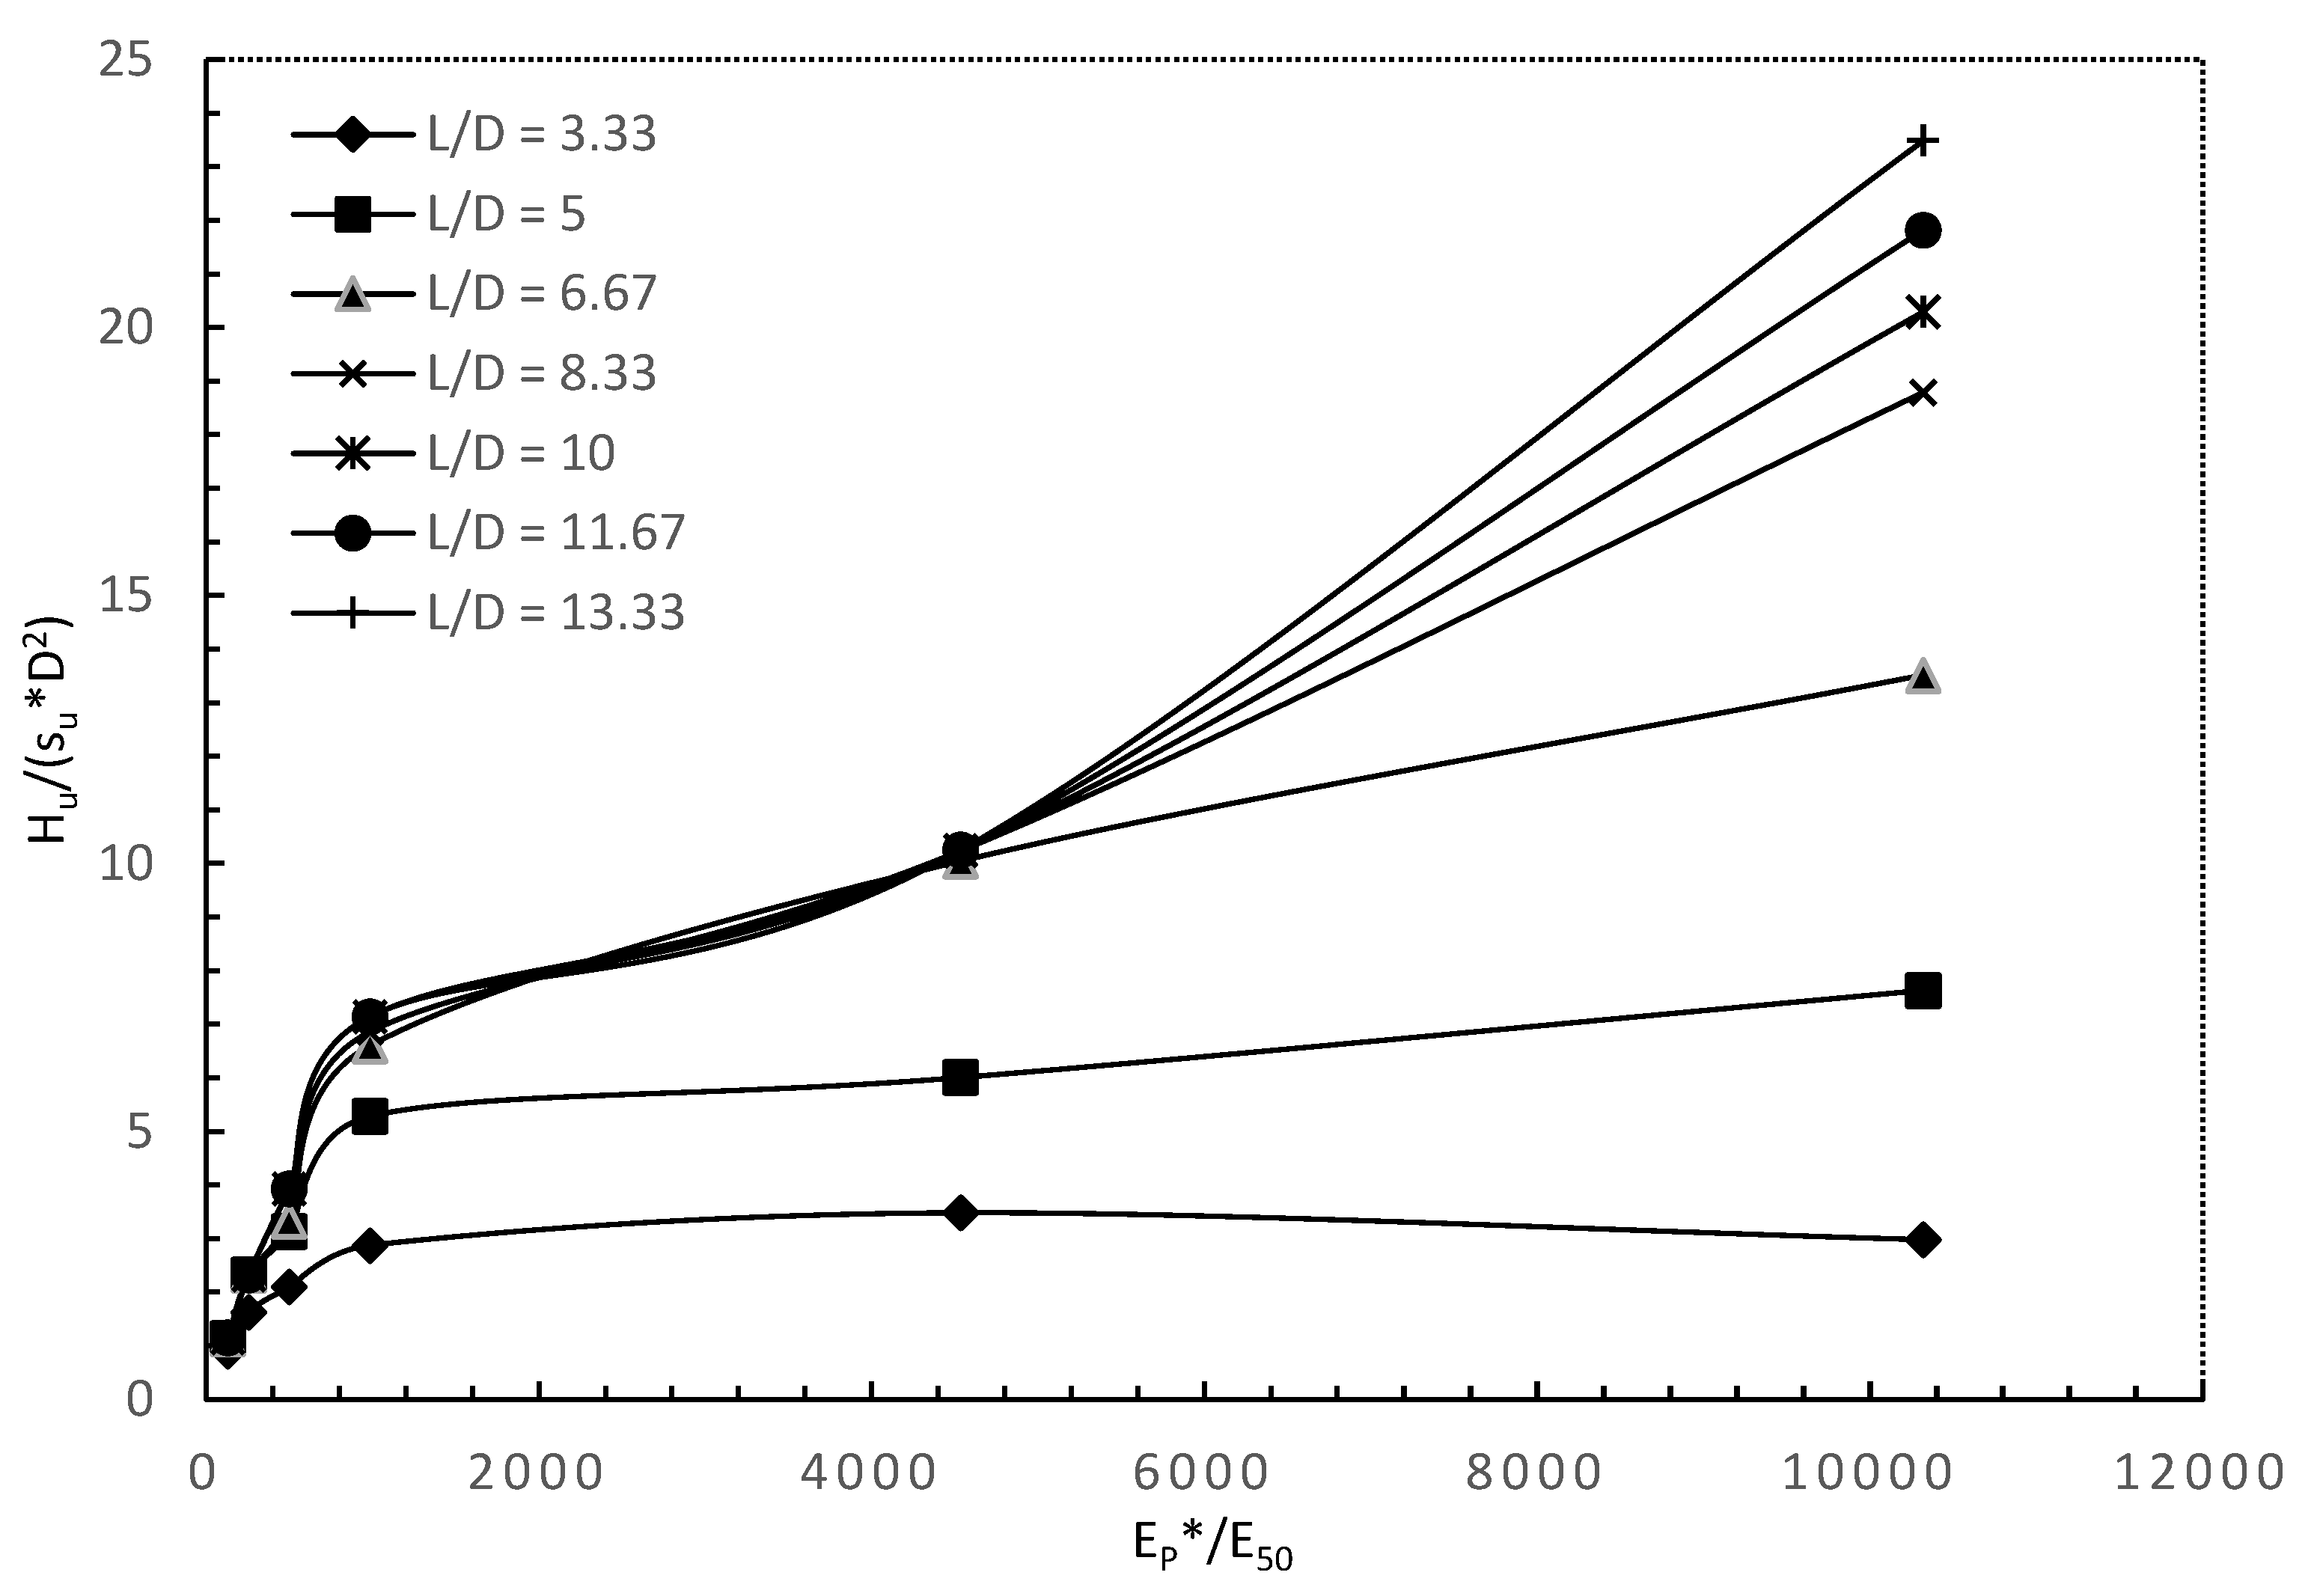
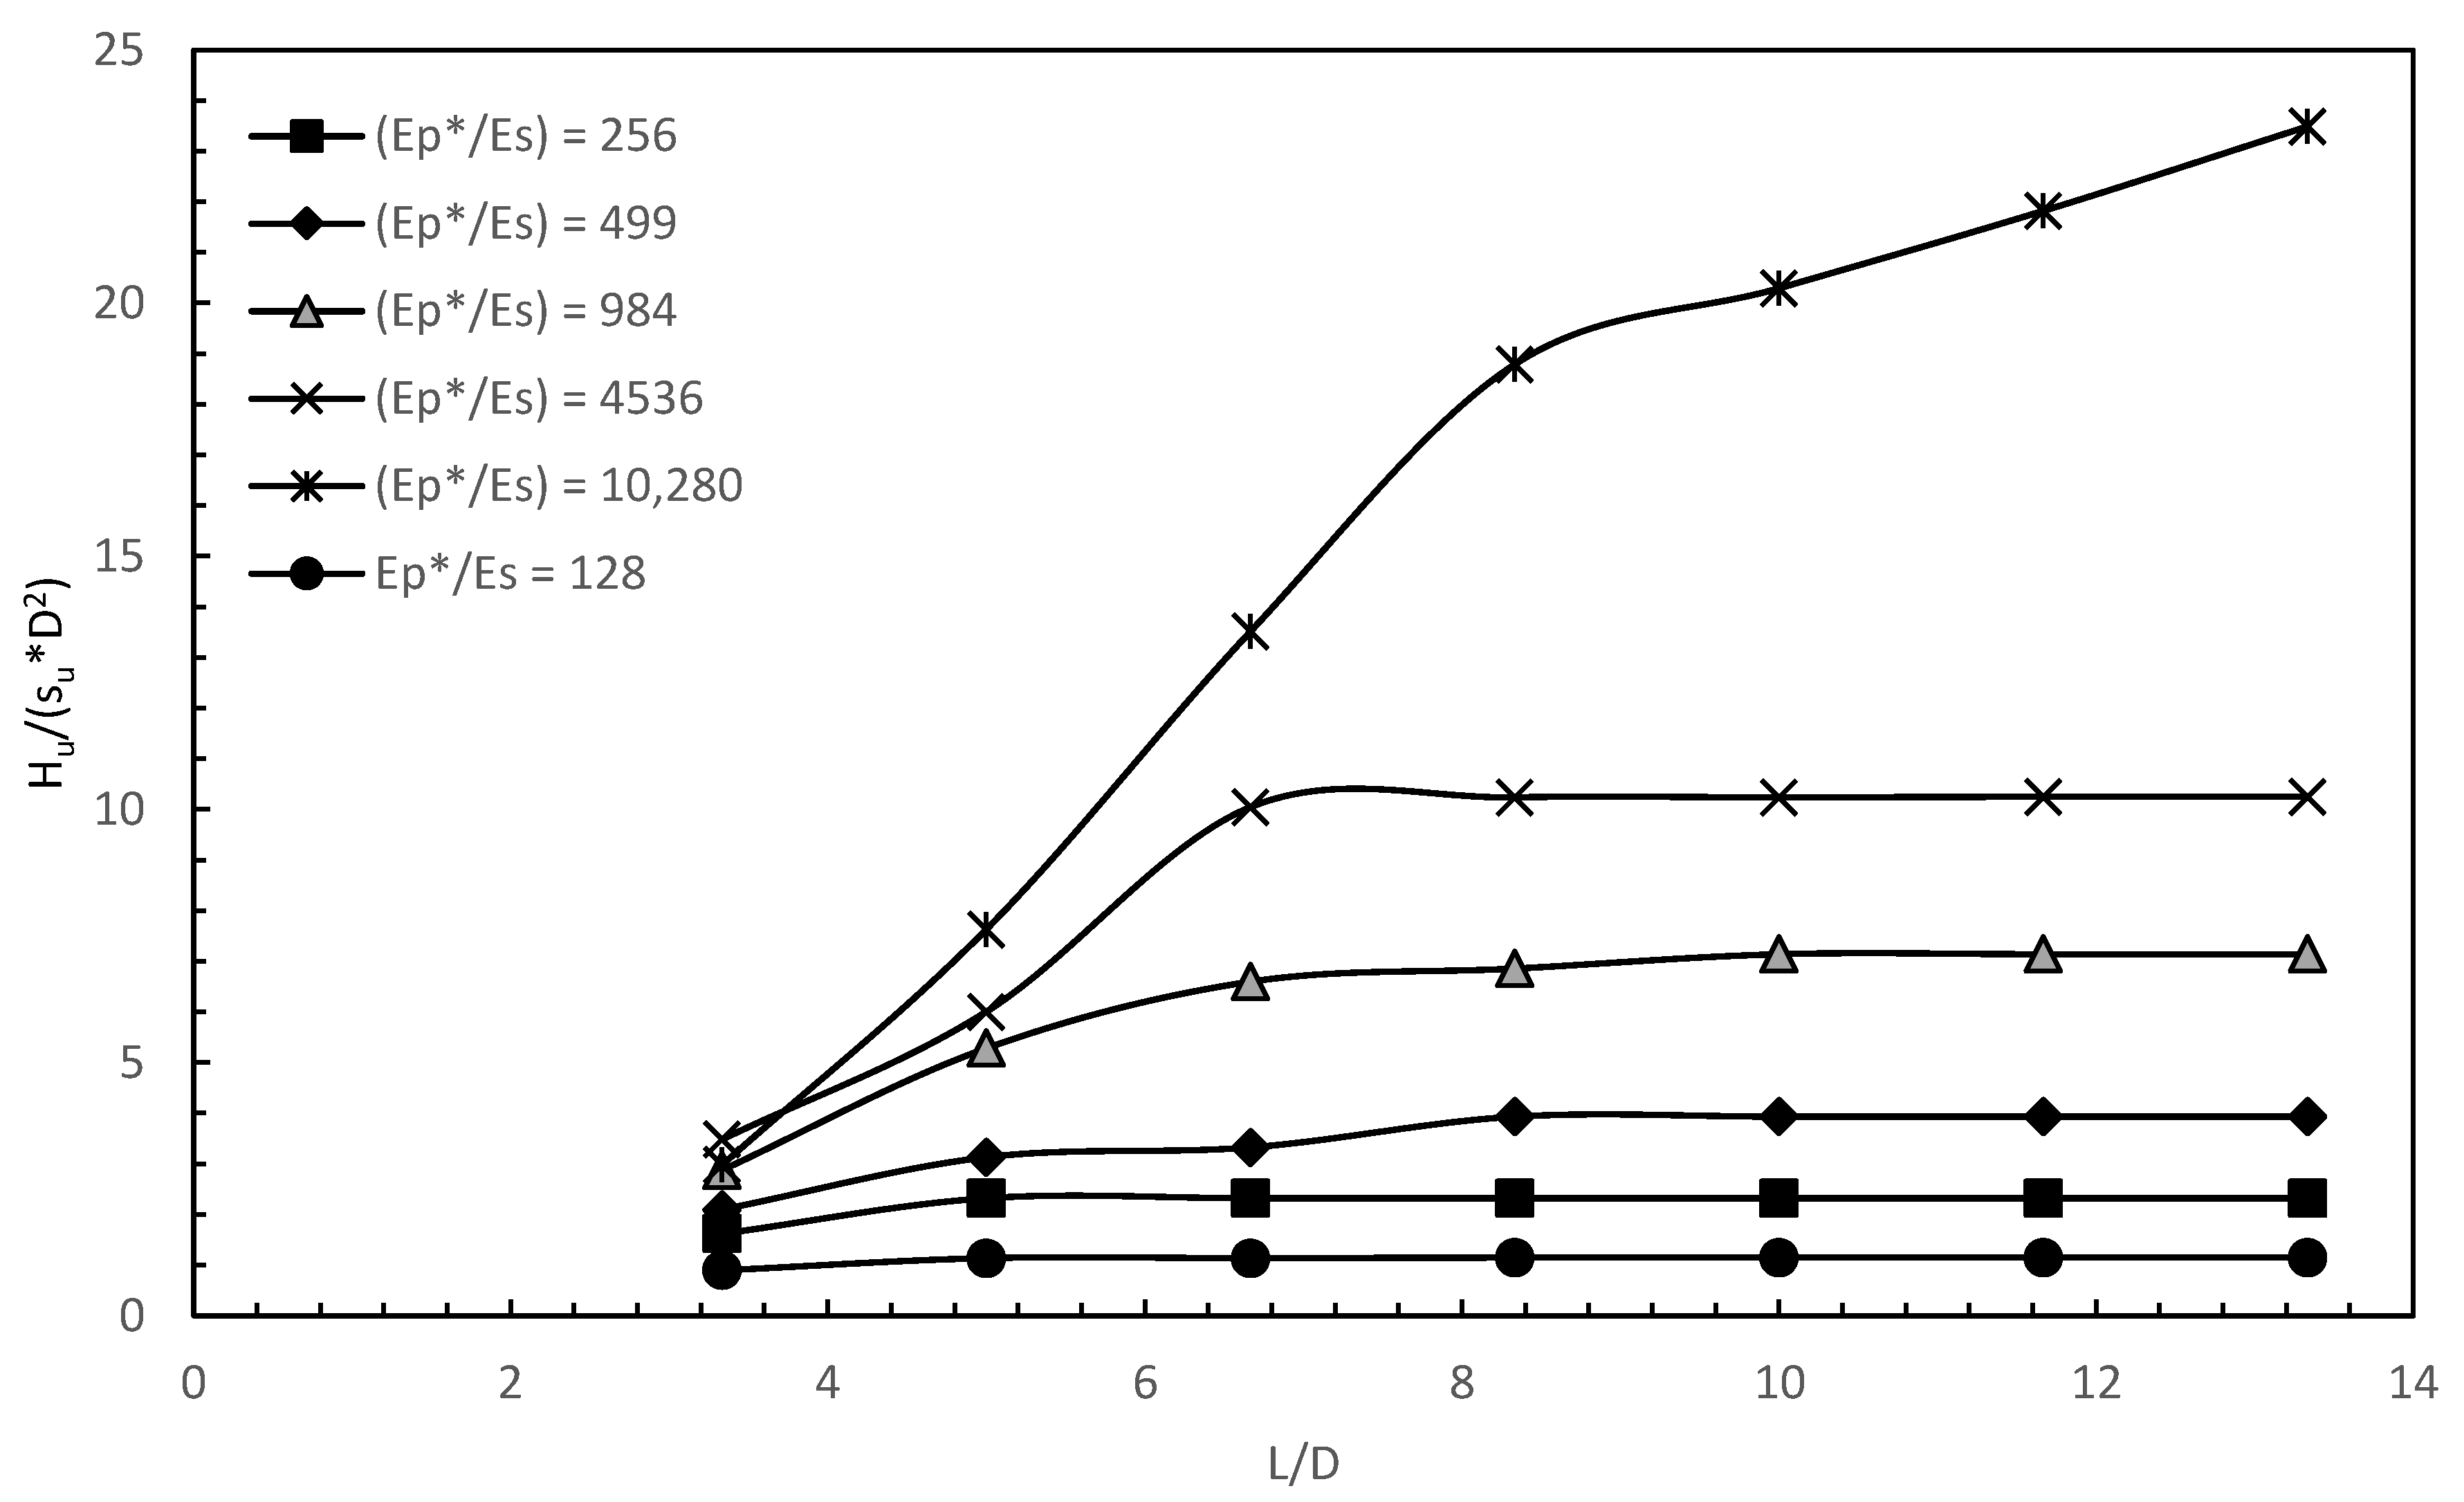
4.1. Discussion of Lateral Ultimate Capacity
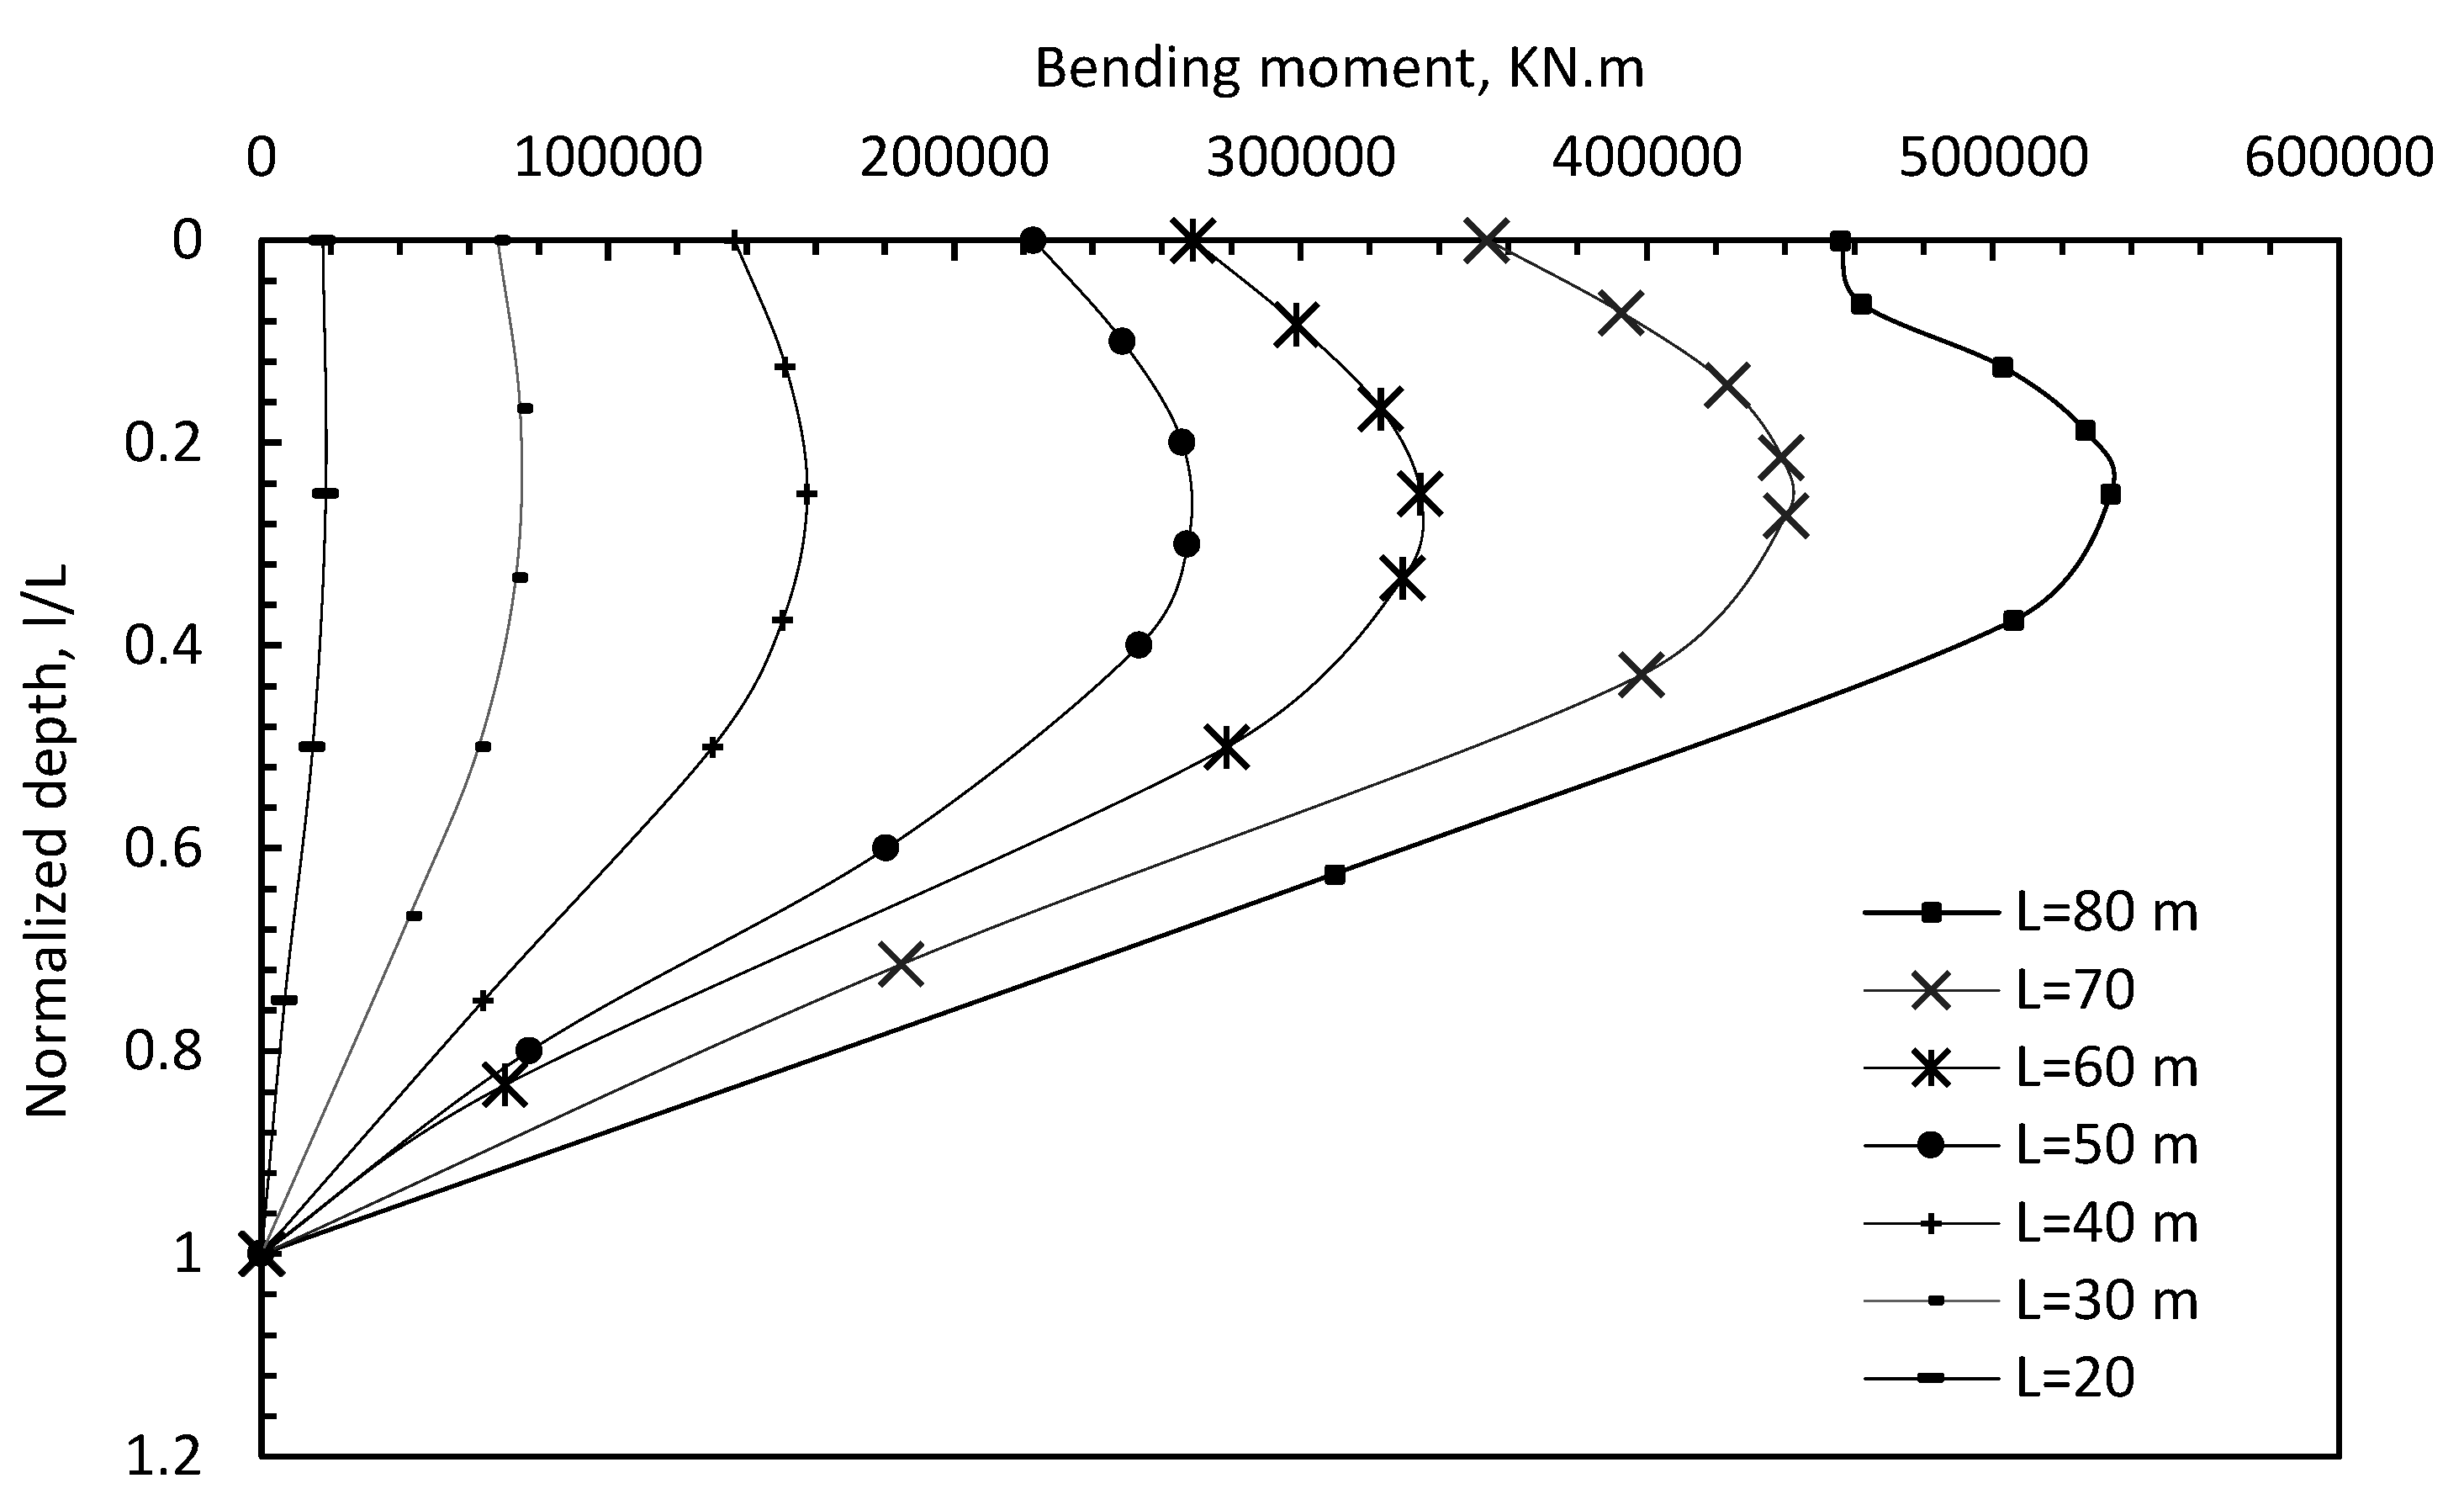
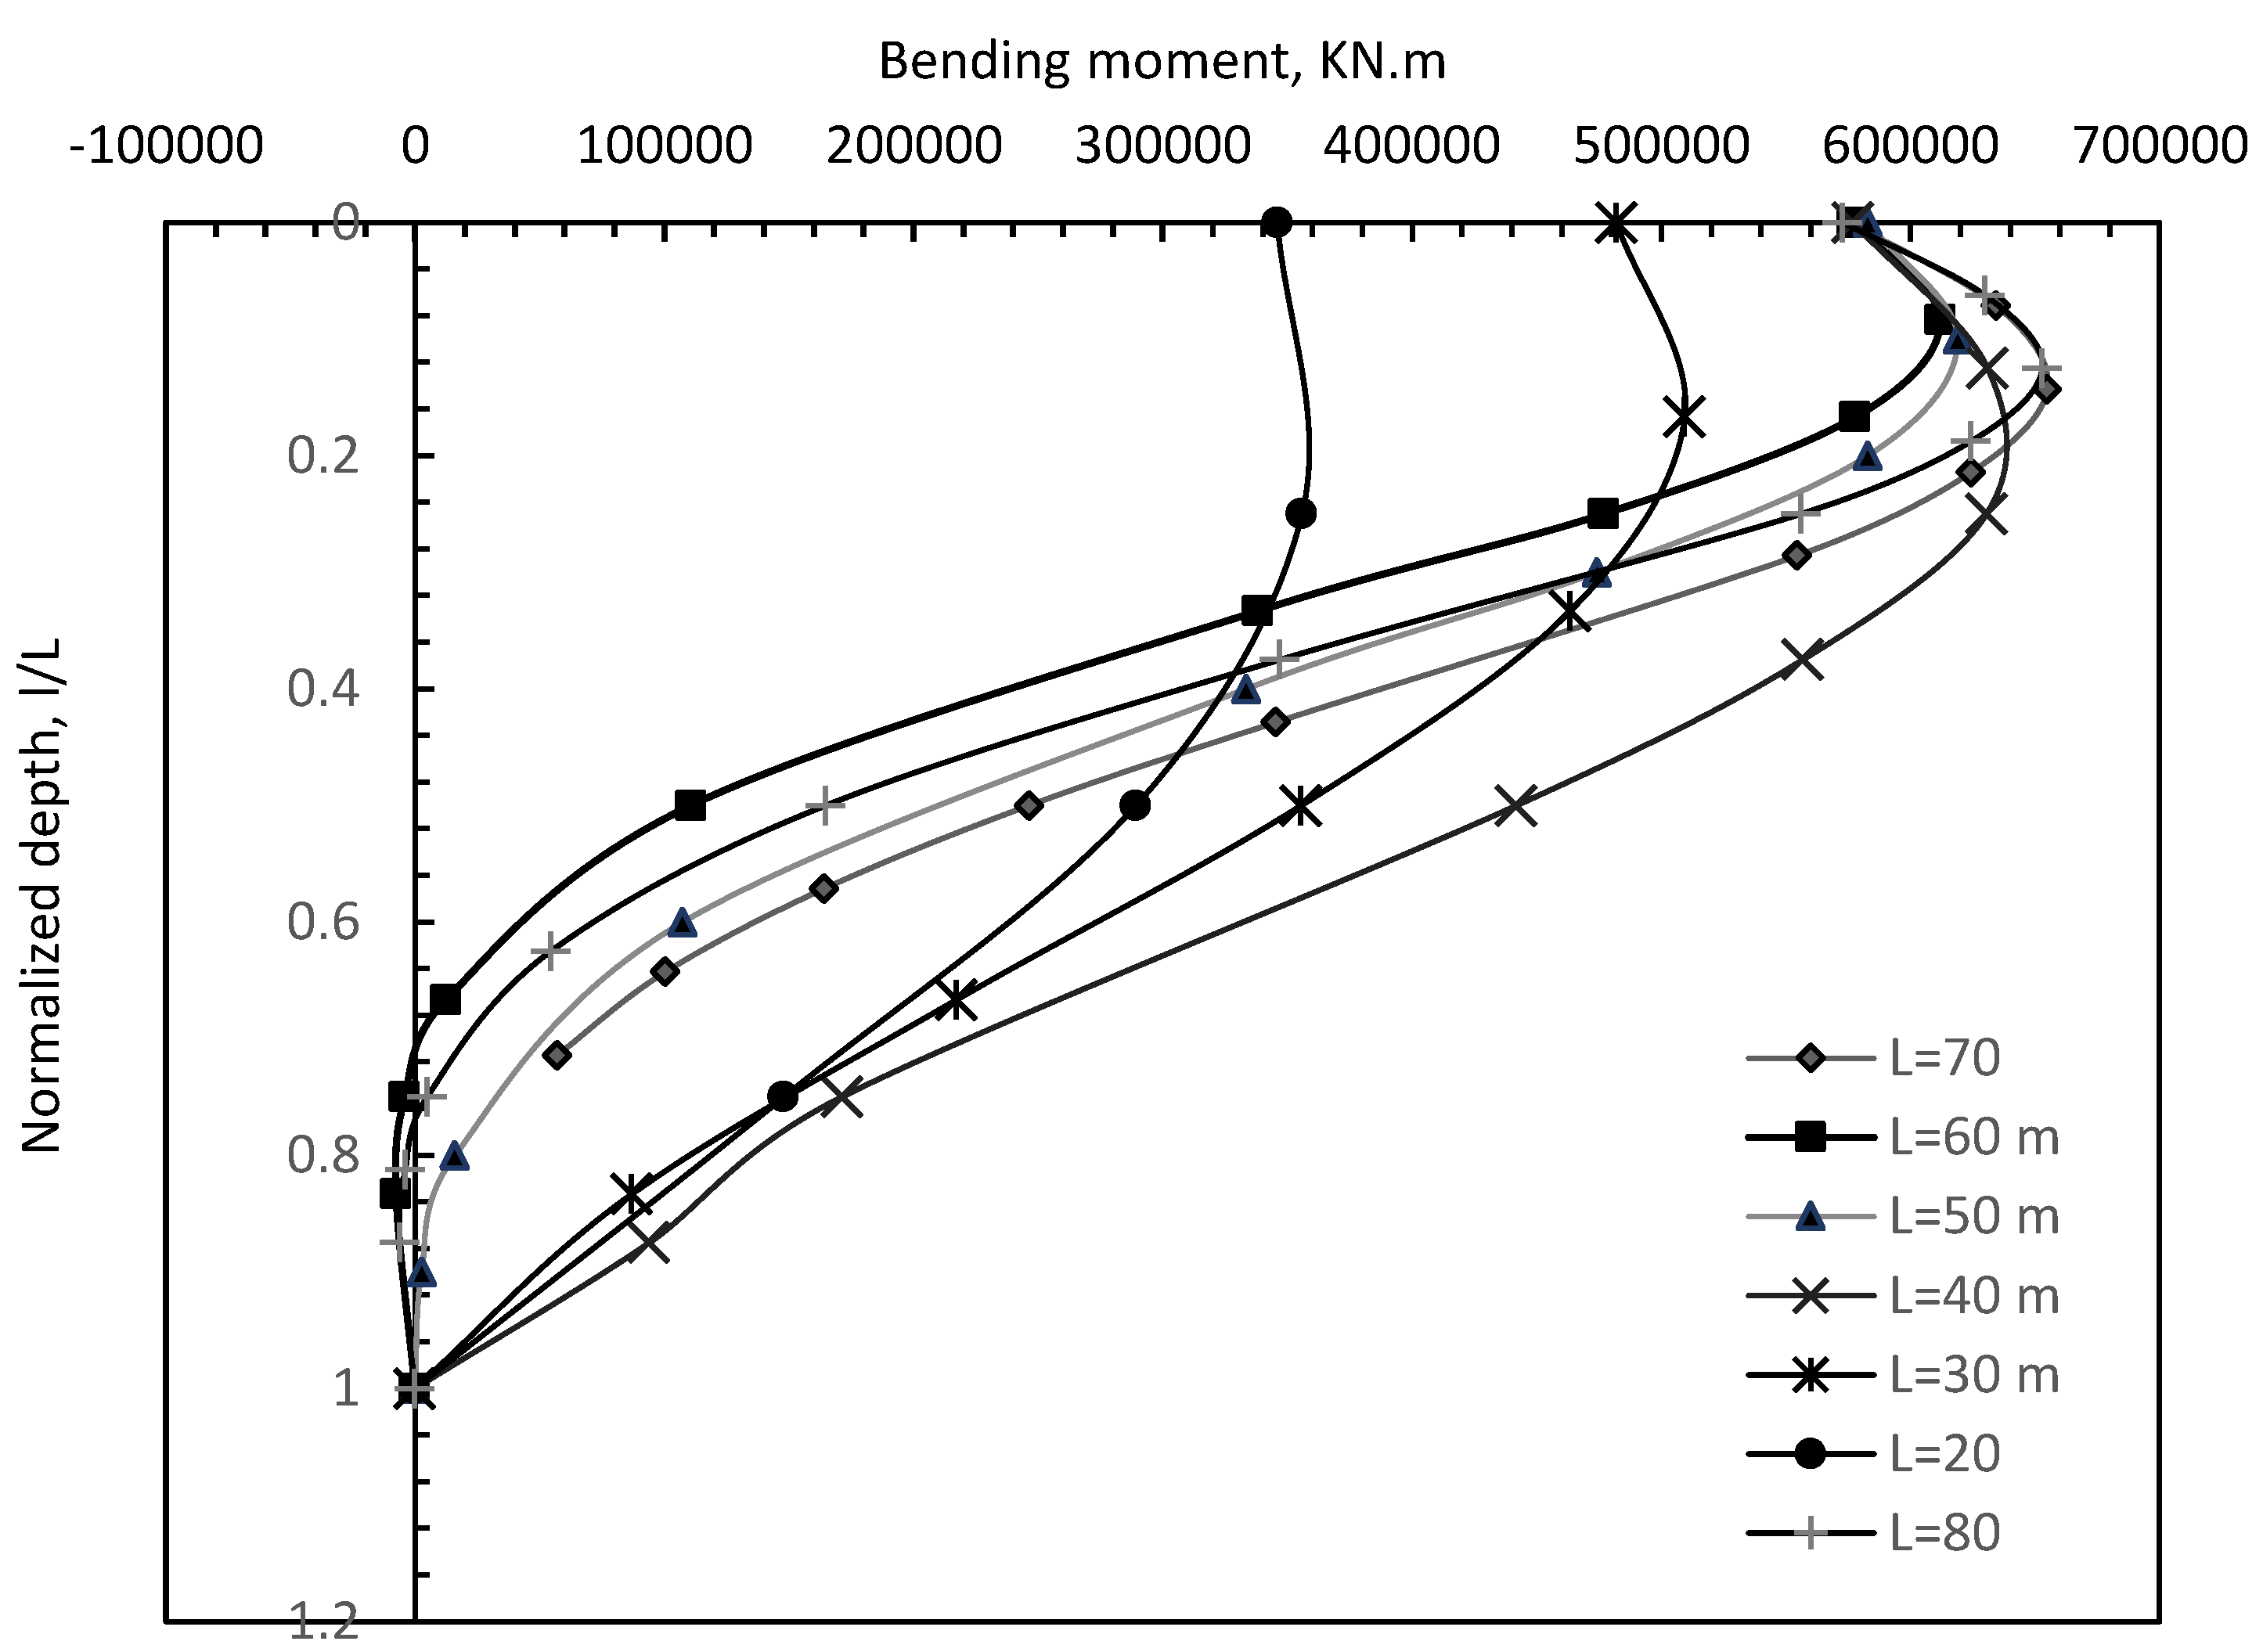
4.1.1. Monopile Bending Moment at Lateral Ultimate Capacity
4.1.2. Predictive Equations for Determining Lateral Ultimate Capacity for Monopiles
5. Conclusions
- The normalized ultimate capacity versus normalized stiffness of MPs showed three distinct slopes, and the normalized ultimate capacity was observed to increase significantly for Ep*/E50 values less than 984 for all L/D ratios. At normalized stiffness values of more than 2000, the effects of increasing the stiffness for a given L/D ratio was small for L/D ratios less than six and was considerable for higher L/D ratios.
- The normalized lateral ultimate capacity increase with L/D ratio was dependent on the normalized stiffness (Ep*/E50) values. At large Ep*/E50 values, the piles behaved as rigid piles and linear growth of the normalized lateral ultimate capacity was observed for the L/D ratios considered herein. As normalized stiffness (Ep*/E50) values decrease below 984, the effects of L/D ratio on the lateral ultimate capacity diminish around L/D values of 5–8. These findings are better understood through inspection of the bending-moment profiles for clay soils 1 and 6.
- Higher L/D ratios had increased normalized lateral capacity for clays 1–5. In clay 6, no effects on the normalized lateral capacity were observed with changes in L/D.
- For clay 1, increasing L/D ratio from 3.3 to 13.3 gave substantial increases in normalized lateral ultimate capacity of more than 700%. For clay 2, a similar observation was made, however, with a lower magnitude.
- For clays 3–4, the effects of L/D ratio on the normalized lateral ultimate capacity were noticeable, amounting to 100%. However, the increase ceased after L/D values of 8.3.
- For clays 5–6, the effects of L/D ratio on the normalized lateral ultimate capacity were negligible due to the flexibility of the monopiles.
- Predictive polynomials showed excellent matches with the FE data, giving promising results and paving the way for more FE-based charts for preliminary estimates of monopile lateral ultimate capacity.
Author Contributions
Funding
Institutional Review Board Statement
Informed Consent Statement
Data Availability Statement
Acknowledgments
Conflicts of Interest
References
- Alsharedah, Y.; Black, J.A.; Newson, T.; El Naggar, M.H. Centrifuge Testing of Improved Monopile Foundation for Offshore Wind Turbines. Ocean Eng. 2023, 2, 285. [Google Scholar] [CrossRef]
- Alsharedah, Y.A. Behavior of Hybrid and Monopile Foundation Systems for OWT: Centrifuge Testing and Numerical Modelling. Doctoral Dissertation, The University of Western Ontario, London, ON, Canada, 2022; p. 8580. Available online: https://ir.lib.uwo.ca/etd/8580 (accessed on 23 December 2022).
- Alsharedah, Y.; Black, J.A.; Newson, T.; El Naggar, M.H. Monopile and Hybrid Foundation Comparisons under Lateral Loading. In Proceedings of the International Conference on Physical Modelling in Geotechnics (ICPMG 2022), Daejeon, Republic of Korea, 19–23 September 2022. [Google Scholar]
- Prendergast, L.J.; Igoe, D. Examination of the reduction in natural frequency of laterally loaded piles due to strain-dependence of soil shear modulus. Ocean Eng. 2022, 258, 111614. [Google Scholar] [CrossRef]
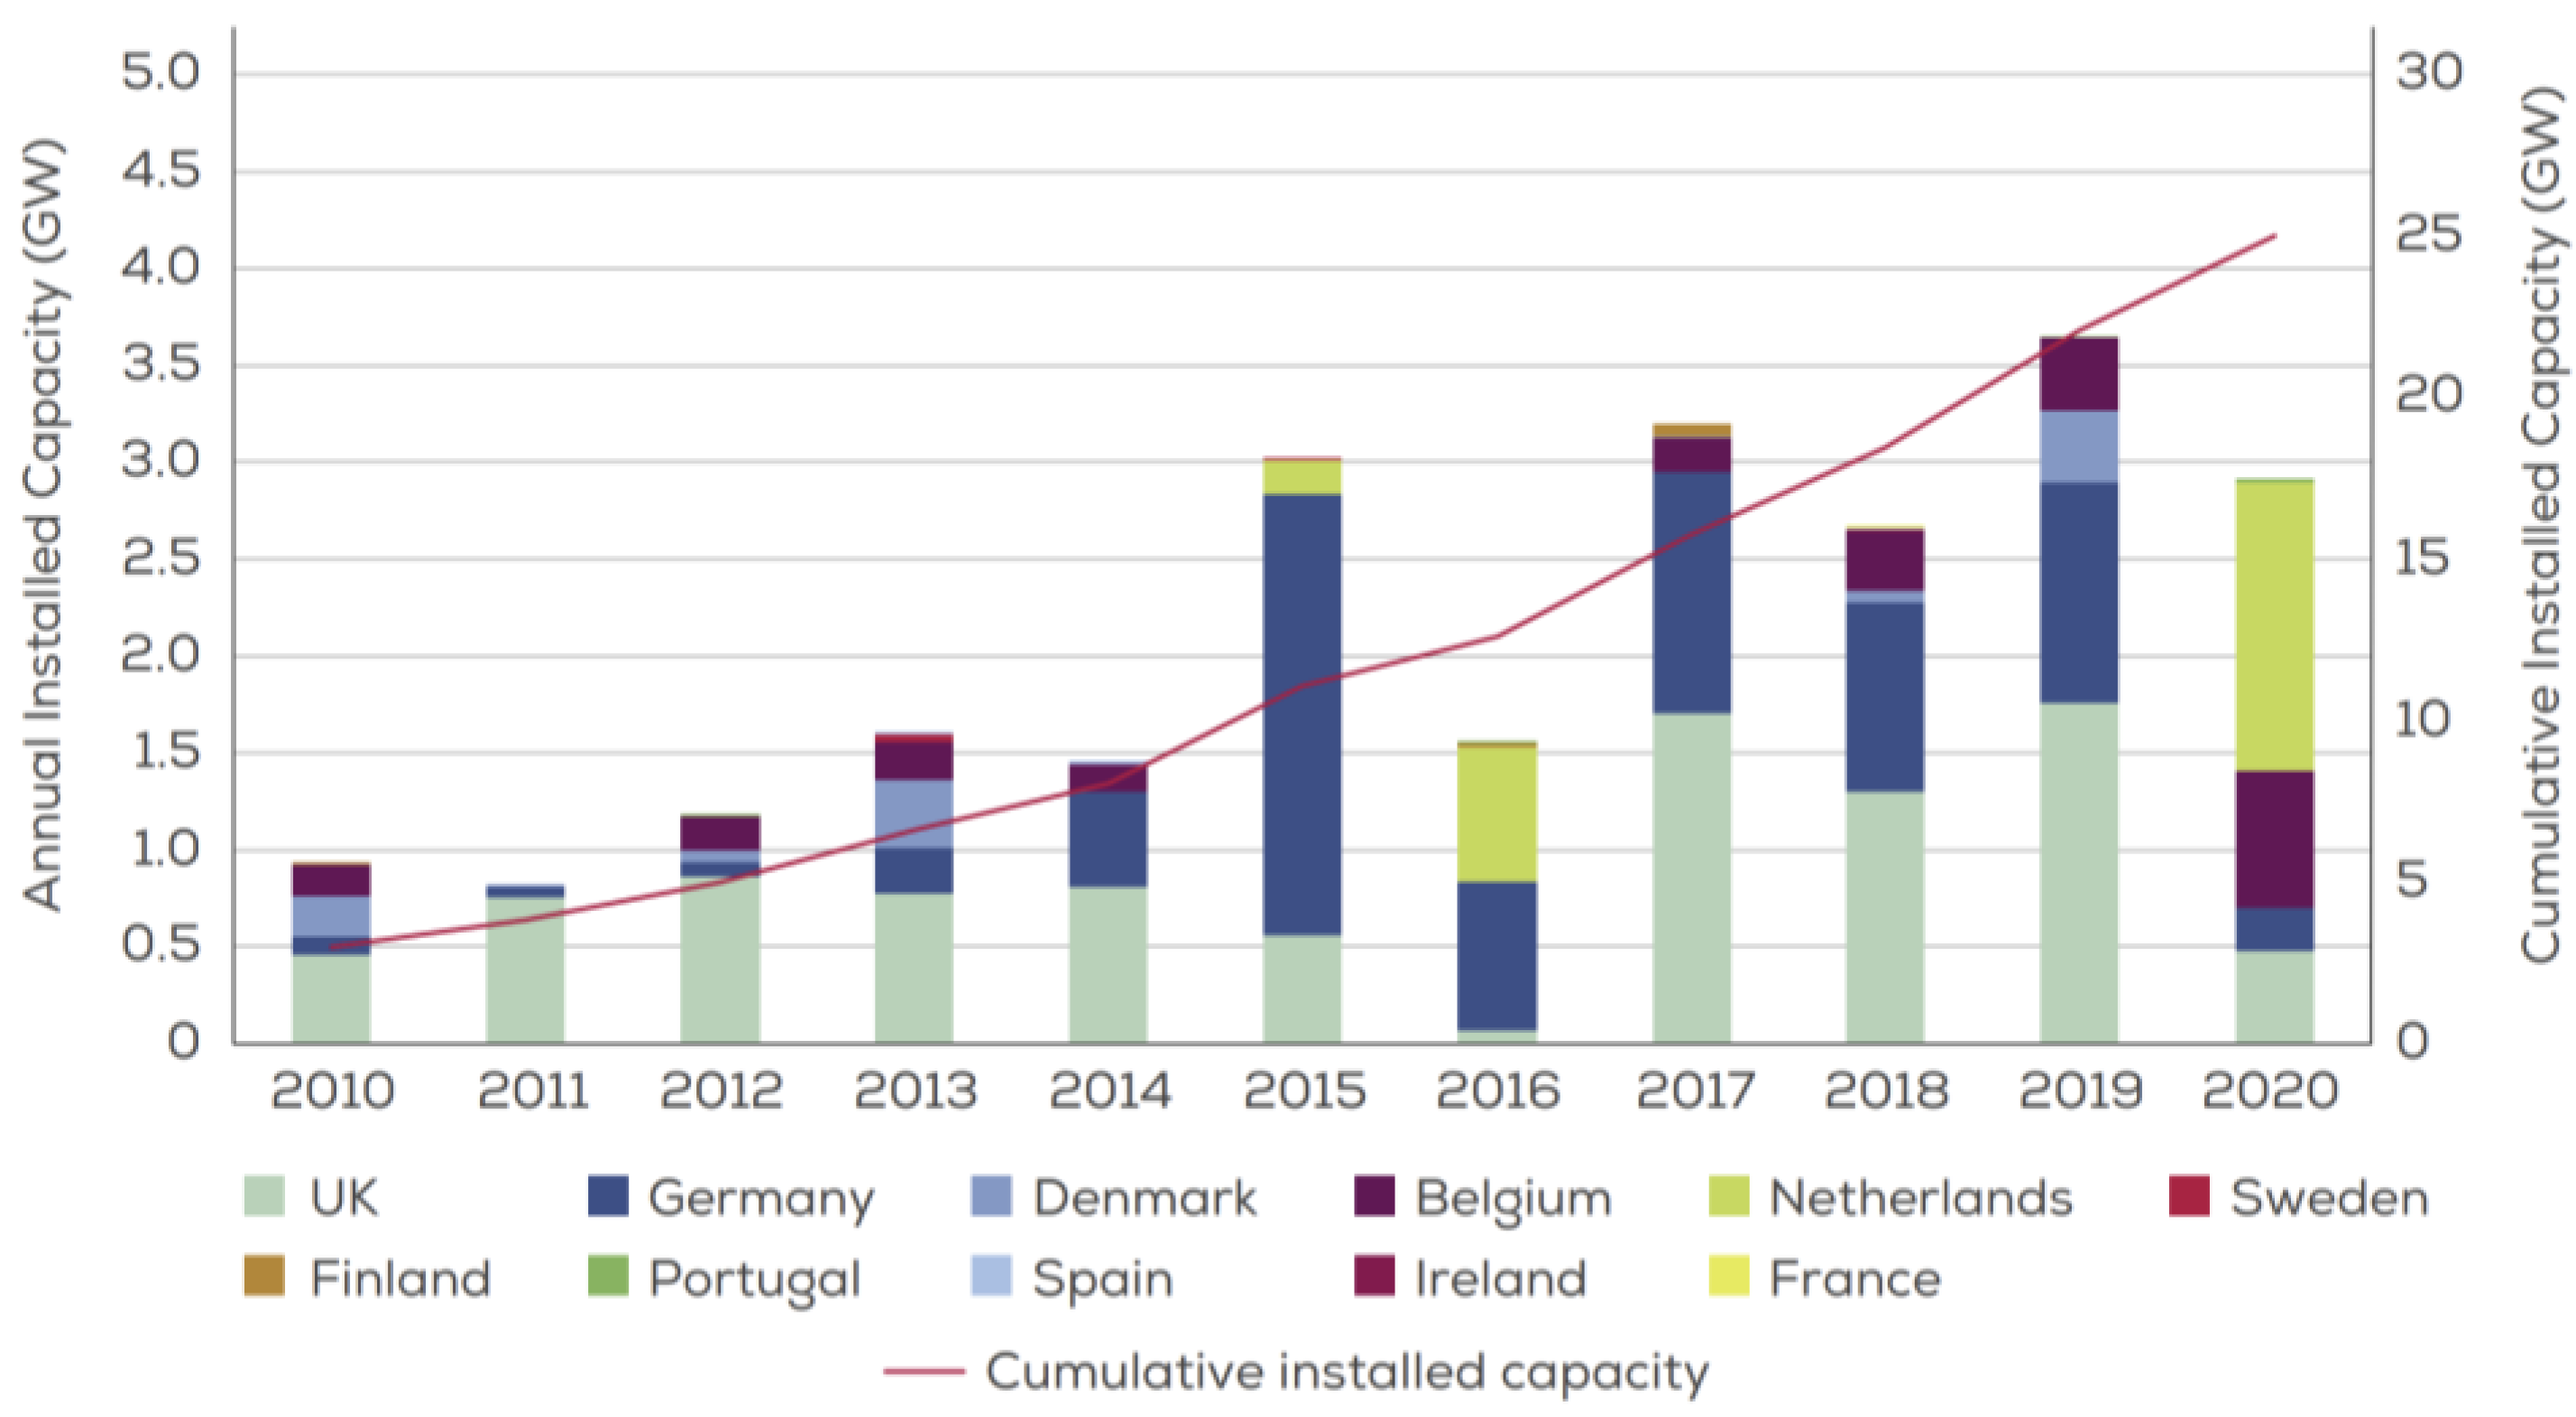
- National Wind Energy Associations. Offshore Wind in Europe—Key Trends and Statistics 2020. Report 2020. Available online: https://windeurope.org/intelligence-platform/product/offshore-wind-in-europe-key-trends-and-statistics-2020/ (accessed on 29 October 2023).
- Abdelkader, A.M. Investigation of Hybrid Foundation System for Offshore Wind Turbine. Doctoral Dissertation, The University of Western Ontario, London, ON, Canada, 2016. [Google Scholar]
- Byrne, B.W.; Houlsby, G.T. Foundations for Offshore Wind Turbines. Philos. Trans. R. Soc. Lond. Ser. A Phys. Eng. Sci. 2003, 361, 2909–2930. [Google Scholar] [CrossRef] [PubMed]
- El-Marassi, M. Investigation of Hybrid Monopile-Footing Foundation Systems Subjected to Combined Loading; The University of Western Ontariol: London, ON, Canada, 2011. [Google Scholar]
- Poulos, H.G. Tall building foundations: Design methods and applications. Innov. Infrastruct. Solut. 2016, 1, 10. [Google Scholar] [CrossRef]
- Byrne, B.W.; McAdam, R.; Burd, H.J.; Houlsby, G.T.; Martin, C.M.; Zdravković, L.; Taborda DM, G.; Potts, D.M.; Jardine, R.J.; Sideri, M.; et al. New design methods for large diameter piles under lateral loading for offshore wind applications. Front. Offshore Geotech. 2015, 1, 705–710. [Google Scholar]
- Bisoi, S.; Haldar, S. Dynamic analysis of offshore wind turbine in clay considering soil-monopile-tower interaction. Soil Dyn. Earthq. Eng. 2014, 63, 19–35. [Google Scholar] [CrossRef]
- McClelland, B.; Focht, J.A., Jr. Soil modulus for laterally loaded piles. Trans. Am. Soc. Civ. Eng. 1958, 123, 1049–1063. [Google Scholar] [CrossRef]
- PY-2014/01/14SP—SN—978-1-138-00152-7T1; Haigh, Stuart—Foundations for Offshore Wind Turbines. Available online: https://www.researchgate.net/profile/Stuart-Haigh/publication/275538646_Foundations_for_offshore_wind_turbines/links/55433ed10cf24107d3949628/Foundations-for-offshore-wind-turbines.pdf (accessed on 29 October 2023).
- O’Neill, M.W.; Reese, L.C.; Brown, D.A. Cyclic lateral loading of a large-scale pile group. J. Geotech. Eng. 1987, 113, 1326–1343. [Google Scholar] [CrossRef]
- Matlock, H. Correlations for Design of Laterally Loaded Piles in Soft Clay. In Proceedings of the 2nd Offshore Technology Conference, Houston, TX, USA, 22–24 April 1970; Volume 1, pp. 577–594. [Google Scholar]
- Reese, L.C.; Cox, W.R.; Koop, F.D. Field testing and analysis of laterally loaded piles in stiff clay. In Proceedings of the 7th Offshore Technology Conference, Houston, TX, USA, 5–8 May 1975; Volume 2, pp. 671–690. [Google Scholar]
- Byrne, B.W.; McAdam, R.; Burd, H.J.; Houlsby, G.T.; Martin, C.M.; Gavin, K.; Doherty, P.; Igoe, D.; Zdravković, L.; Taborda DM, G.; et al. Field testing of large diameter piles under lateral loading for offshore wind applications. In Proceedings of the XVI European Conference on Soil Mechanics and Geotechnical Engineering, Edinburgh, UK, 13–17 September 2015; pp. 1255–1260. [Google Scholar]
- Philippe, J. Re-assessment of P-Y curves for soft clays from centrifuge testing and finite element modeling. In Proceedings of the Offshore Technology Conference, Houston, TX, USA, 4 May 2009. [Google Scholar] [CrossRef]
- Meyer, B.J.; Reese, L.C. Analysis of Single Piles under Lateral Loading; FHWA report/TX-79/38+244-l; Center for Highway Research, University of Texas at Austin: Austin, TX, USA, 1979. [Google Scholar]
- Lau, B. Cyclic Behaviour of Monopile Foundations for Offshore Wind Turbines in Clay. Ph.D. Dissertation, University of Cambridge, Cambridge, UK, 2015. [Google Scholar]
- Wang, Z.; Hong, Y.; Ng CW, W.; Wang, L.Z.; Mašín, D.; He, B. Cyclic lateral response and failure mechanisms of semi-rigid pile in soft clay: Centrifuge tests and numerical modelling. Can. Geotech. J. 2017, 54, 806–824. [Google Scholar] [CrossRef]
- Zhu, B.; Zhu, Z.; Li, T.; Liu, J.; Liu, Y. Field Tests of Offshore Driven Piles Subjected to Lateral Monotonic and Cyclic Loads in Soft Clay. J. Waterw. Port Coast. Ocean Eng. 2017, 143, 5017003. [Google Scholar] [CrossRef]
- Heidari, M.; Jahanandish, M.; Naggar, H.E.; Ghahramani, A. Nonlinear cyclic behavior of laterally loaded pile in cohesive soil. Can. Geotech. J. 2014, 51, 129–143. [Google Scholar] [CrossRef]
- API. Recommended Practice for Planning, Designing, and Constructing Fixed Offshore Platforms; API, RPT2A-WSD; American Petroleum Institute (API): Washington, DC, USA, 1993. [Google Scholar]
- Bayton, S.; Black, J.; Klinkvort, R. Centrifuge modelling of long term cyclic lateral loading on monopiles. In Physical Modelling in Geotechnics, 1st ed.; Routledge: London, UK, 2018; pp. 689–694. [Google Scholar] [CrossRef]
- Broms, B.B. Lateral Resistance of Piles in Cohesive Soils. J. Soil Mech. Found. 1964, 90, 27–64. [Google Scholar] [CrossRef]
- Brown, D.A. Rapid lateral load testing of deep foundations. DFI J. J. Deep Found. Inst. 2007, 1, 54–62. [Google Scholar] [CrossRef]
- Cherchia, M. Centrifuge Modeling of Hybrid Foundations for Offshore Wind Turbines. Doctoral Dissertation, Rensselaer Polytechnic Institute, Troy, NY, USA, 2016. [Google Scholar]
- Gerolymos, N.; Giannakos, S.; Drosos, V. Generalised failure envelope for laterally loaded piles: Analytical formulation, numerical verification and experimental validation. Géotechnique 2020, 70, 248–267. [Google Scholar] [CrossRef]
- Lehane, B.; Powrie, W.; Doherty, J. Centrifuge model tests on piled footings in clay for offshore wind turbines. In Frontiers in Offshore Geotechnics II; CRC Press: Boca Raton, FL, USA, 2010. [Google Scholar]
- Powrie, W.; Daly, M.P. Centrifuge modeling of embedded retaining walls with stabilizing bases. Geotechnique 2007, 57, 485–497. [Google Scholar] [CrossRef]
- Wang, X.; Zeng, X.; Yang, X.; Li, J. Feasibility study of offshore wind turbines with hybrid monopile foundation based on centrifuge modeling. Appl. Energy 2018, 209, 127–139. [Google Scholar] [CrossRef]
- Zhang, G. A centrifuge study of the seismic response of pile–raft systems embedded in soft clay. Géotechnique 2017, 67, 479–490. [Google Scholar] [CrossRef]
- Schanz, T.; Vermeer, P.A.; Bonnier, P.G. The hardening soil model: Formulation and verification. Beyond 2000 Comput. Geotech. 1999, 1, 281–296. [Google Scholar]
- Lai, Y.; Wang, L.; Hong, Y.; He, B. Centrifuge modeling of the cyclic lateral behavior of large-diameter monopiles in soft clay: Effects of episodic cycling and reconsolidation. Ocean. Eng. 2020, 200, 107048. [Google Scholar] [CrossRef]
- Dao, T.P.T. Validation of PLAXIS Embedded Piles for Lateral Loading; Delft University of Technology: Mekelweg, The Netherlands, 2011. [Google Scholar]


| Parameter | Clay1 | Units |
|---|---|---|
| c′ | 15 | kPa |
| Ψ | 0 | Degrees |
| 8 | Degrees | |
| 15 | kPa | |
| 41 | kPa | |
| eini. | 4.23 | - |
| ɣ | 17.9 | KN/m3 |
| 1406 | kPa | |
| 1758 | kPa | |
| 5000 | kPa | |
| vur | 0.2 | - |
| m | 0.6 | - |
| PI | 30 | % |
| Ko,NC | 0.86 | - |
| Rf | 0.9 | - |
| Depth | 0–5 | m |
| Type of analysis | Undrained A | - |
| Parameter | Clay1 | Clay2 | Clay3 | Clay4 | Clay5 | Clay6 | Units |
|---|---|---|---|---|---|---|---|
| c′ | 4.23 | 24 | 44 | 87 | 170 | 354 | kPa |
| Ψ | 0 | 0 | 0 | 0 | 0 | 0 | Degrees |
| 8 | 10 | 10 | 10 | 10 | 10 | Degrees | |
| 13 | 51 | 83 | 140 | 240 | 414 | kPa | |
| 41 | 100 | 100 | 100 | 100 | 100 | kPa | |
| e(ini). | 4.209 | 4.209 | 4.209 | 4.209 | 4.209 | 4.209 | - |
| ɣ | 17.9 | 17.9 | 17.9 | 17.9 | 17.9 | 17.9 | kN/m3 |
| 1406 | 3461 | 14,747 | 29,040 | 56,628 | 113,134 | ||
| 1758 | 4000 | 18,439 | 36,310 | 70,805 | 141,457 | ||
| 5000 | 10,000 | 52,444 | 103,271 | 201,380 | 402,326 | ||
| vur | 0.2 | 0.2 | 0.2 | 0.2 | 0.2 | 0.2 | - |
| m | 0.6 | 0.6 | 0.6 | 0.6 | 0.6 | 0.6 | - |
| PI | 30 | 30 | 30 | 30 | 30 | 30 | % |
| Ko,NC | 0.54 | 0.54 | 0.54 | 0.54 | 0.54 | 0.54 | - |
| Depth | 0–25 | 0–26 | 0–27 | 0–28 | 0–29 | 0–30 | m |
| Rf | 0.9 | 0.9 | 0.9 | 0.9 | 0.9 | 0.9 | - |
| L, m | L/D/(Lp/W) | Foundation System | e/Dt | V, kN |
|---|---|---|---|---|
| 20 | 3.33 | Monopile | 6.83 | Own weight 1 |
| 30 | 5 | 6.83 | ||
| 40 | 6.67 | 6.83 | ||
| 50 | 8.33 | 6.83 | ||
| 60 | 10 | 6.83 | ||
| 70 | 11.67 | 6.83 | ||
| 80 | 13.33 | 6.83 |
Disclaimer/Publisher’s Note: The statements, opinions and data contained in all publications are solely those of the individual author(s) and contributor(s) and not of MDPI and/or the editor(s). MDPI and/or the editor(s) disclaim responsibility for any injury to people or property resulting from any ideas, methods, instructions or products referred to in the content. |
© 2023 by the authors. Licensee MDPI, Basel, Switzerland. This article is an open access article distributed under the terms and conditions of the Creative Commons Attribution (CC BY) license (https://creativecommons.org/licenses/by/4.0/).
Share and Cite
Alsharedah, Y.A.; Newson, T.; El Naggar, M.H.; Black, J.A. Lateral Ultimate Capacity of Monopile Foundations for Offshore Wind Turbines: Effects of Monopile Geometry and Soil Stiffness Properties. Appl. Sci. 2023, 13, 12269. https://doi.org/10.3390/app132212269
Alsharedah YA, Newson T, El Naggar MH, Black JA. Lateral Ultimate Capacity of Monopile Foundations for Offshore Wind Turbines: Effects of Monopile Geometry and Soil Stiffness Properties. Applied Sciences. 2023; 13(22):12269. https://doi.org/10.3390/app132212269
Chicago/Turabian StyleAlsharedah, Yazeed A., Timothy Newson, M. Hesham El Naggar, and Jonathan A. Black. 2023. "Lateral Ultimate Capacity of Monopile Foundations for Offshore Wind Turbines: Effects of Monopile Geometry and Soil Stiffness Properties" Applied Sciences 13, no. 22: 12269. https://doi.org/10.3390/app132212269
APA StyleAlsharedah, Y. A., Newson, T., El Naggar, M. H., & Black, J. A. (2023). Lateral Ultimate Capacity of Monopile Foundations for Offshore Wind Turbines: Effects of Monopile Geometry and Soil Stiffness Properties. Applied Sciences, 13(22), 12269. https://doi.org/10.3390/app132212269