Article

Assessing Change of Direction Ability in Young Male Athletes: A Comparative Analysis of Change of Direction Deficit and Change of Direction Total Time

1
College of Athletic Performance, Shanghai University of Sport, Shanghai 200438, China
2
The Center of Teaching and training, Nanjing Sport Institute, Nanjing 210014, China
3
Principal’s Office, Shandong Sport University, Jinan 250102, China
*
Authors to whom correspondence should be addressed.
Appl. Sci. 2023, 13(22), 12211; https://doi.org/10.3390/app132212211
Submission received: 11 September 2023 / Revised: 25 October 2023 / Accepted: 9 November 2023 / Published: 10 November 2023

Abstract

:
This study aimed to explore the relationship between change of direction deficit (CODD), change of direction total time (CODTT), and linear sprint time and to compare the differences between CODD and CODTT in assessing an athlete’s change of direction (COD) ability. Forty-four highly trained male young athletes underwent Y-shaped pre-planned agility, Pro-agility, and 30 m linear sprint tests. The results showed a moderate to highly significant correlation between CODTT and linear speed time at 0–5 m, 0–10 m, and 0–30 m (r = 0.5–0.8), while there was no statistically significant relationship between CODD and linear speed time at 0–5 m and 0–10 m (r = 0.0–0.3). CODD and CODTT were moderate to highly correlated (r = 0.4–0.8), with CODD for 180° COD showing a higher predictive value for CODTT compared to 45° COD (14–35% vs. 49–63%). Additionally, 13–22% of the participants showed opposing results for COD ability when comparing the standardized Z-score of Pro-agility 0–10 m CODTT and CODD. Pro-agility 0–10 m CODD also resulted in a higher asymmetry ratio (2% vs. 7%) and COD ability imbalances (0% vs. 38%) than Pro-agility 0–10 m CODTT. In conclusion, CODD may provide a more accurate assessment of an athlete’s COD ability than CODTT.

1. Introduction

Change of direction (COD) is the skill of changing movement direction, velocity, or mode and is a crucial aspect of agility [1,2], significantly impacting athletic performance. A practical evaluation method based on the COD definition should measure the athlete’s ability to change direction, velocity, and movement pattern, namely “actual COD ability”. Measuring the center of mass velocity before and after the braking phase during deceleration and acceleration within a 1 m distance enables an accurate evaluation of the athlete’s actual COD ability [3]. However, due to test time and equipment limitations, previous studies have primarily relied on the COD total time (CODTT) to assess athletes’ COD ability in sports such as football, rugby, basketball, and tennis [3,4].
Multiple variables, such as energy metabolism, linear sprint, and actual COD ability, may influence CODTT. As the COD test time increases, the impact of the athlete’s anaerobic metabolism ability on the CODTT also increases [5]. Shorter CODTT tests, like Y-shaped pre-planned agility, 505 agility, and Pro-agility, are less affected by the above factors and are commonly used to assess 45° and 180° COD ability [6]. Moreover, numerous studies have reported a significant correlation between CODTT and sprint time at the same distance, particularly when measuring COD types involving a significant proportion of short sprint distance [7,8]. This correlation could introduce noteworthy measurement inaccuracies when assessing an athlete’s actual COD ability. As demonstrated in a previous study, rugby players allocated approximately 31% of the total time during the 505 agility test to execute actual COD maneuvers [9]. Furthermore, another investigation distinctly affirmed that, as opposed to the total time taken in the 505 agility test, the center of mass velocity of the athletes before and after braking at 0.3 m, 0.5 m, and 1 m weakly correlated with the 5 m and 10 m sprint speeds [7]. Hence, the evaluation results of COD ability based on the CODTT may not be congruent with the actual COD ability.
In 2013, a study introduced the COD deficit (CODD) concept as a convenient method to evaluate athletes’ actual COD ability, derived from the difference between the times of the same distance COD and sprint test [9]. Although the CODD has received attention and application from relevant scholars in recent years, the evidence that it can accurately reflect the actual COD ability still needs to be improved. Few studies have analyzed the correlation between CODTT, CODD, and sprint time for the same sample under different COD distances, angles, and types [5,9].
Research on the impact of CODTT and CODD on the assessment results of athletes’ COD ability is also scarce. Therefore, the aim of this study was twofold. The first was to evaluate the relationship between Y-shaped pre-planned agility, Pro-agility, and the 30 m sprint. The second was to compare the differences between CODTT and CODD in evaluating athletes’ COD ability. We hypothesized that there would be a trivial correlation between short sprints and CODD and that using CODD as the standard for assessing athletes’ COD ability would be more scientific.

2. Method

2.1. Participants

A total of 44 highly trained male adolescent athletes participated in the study (age = 16 ± 1 years, body height = 178 ± 7 cm, body mass = 69 ± 12 kg), including 12 rugby sevens players, 16 martial artists (sanda), and 16 boxers. All participants were members of the Shanghai provincial team in China and engaged in at least 6–10 specialized training sessions and 2–4 physical training sessions per week. The experimental sessions were conducted at the beginning of the pre-season. None of the participants reported lower limb injuries, such as anterior cruciate ligament tears. The participants did not receive high-intensity training within 24 h before the test. The study was conducted under the ethical principles of the Helsinki Declaration for Human Research and was approved by the Ethics Commission of the local university (No. 102772021RT010).

2.2. Design and Procedures

This is cross-sectional research. The participants were categorized into three groups based on their sports events. Rugby sevens athletes underwent testing on the first day, martial artists on the second day, and boxing athletes on the third day. The order of testing for athletes was arranged alphabetically by their last names. Participants sequentially participated in Y-shaped pre-planned agility, Pro-agility, and 30 m sprint tests from 1:00 p.m. to 5:00 p.m. on the test day. Before the testing, participants engaged in a standardized 20 min warm-up, including running exercises (6 min), dynamic stretching for the glutes, thigh, and calf muscles (3 min), bodyweight squats and lunge exercises (3 min), jumping exercises (3 min), and 20 m sprint and COD exercises (5 min). The researchers familiarized the participants with the details of each test to minimize learning effects, and the same test team conducted all tests. During testing, loud verbal encouragement and immediate test feedback were provided to the participants to optimize the test outcome.

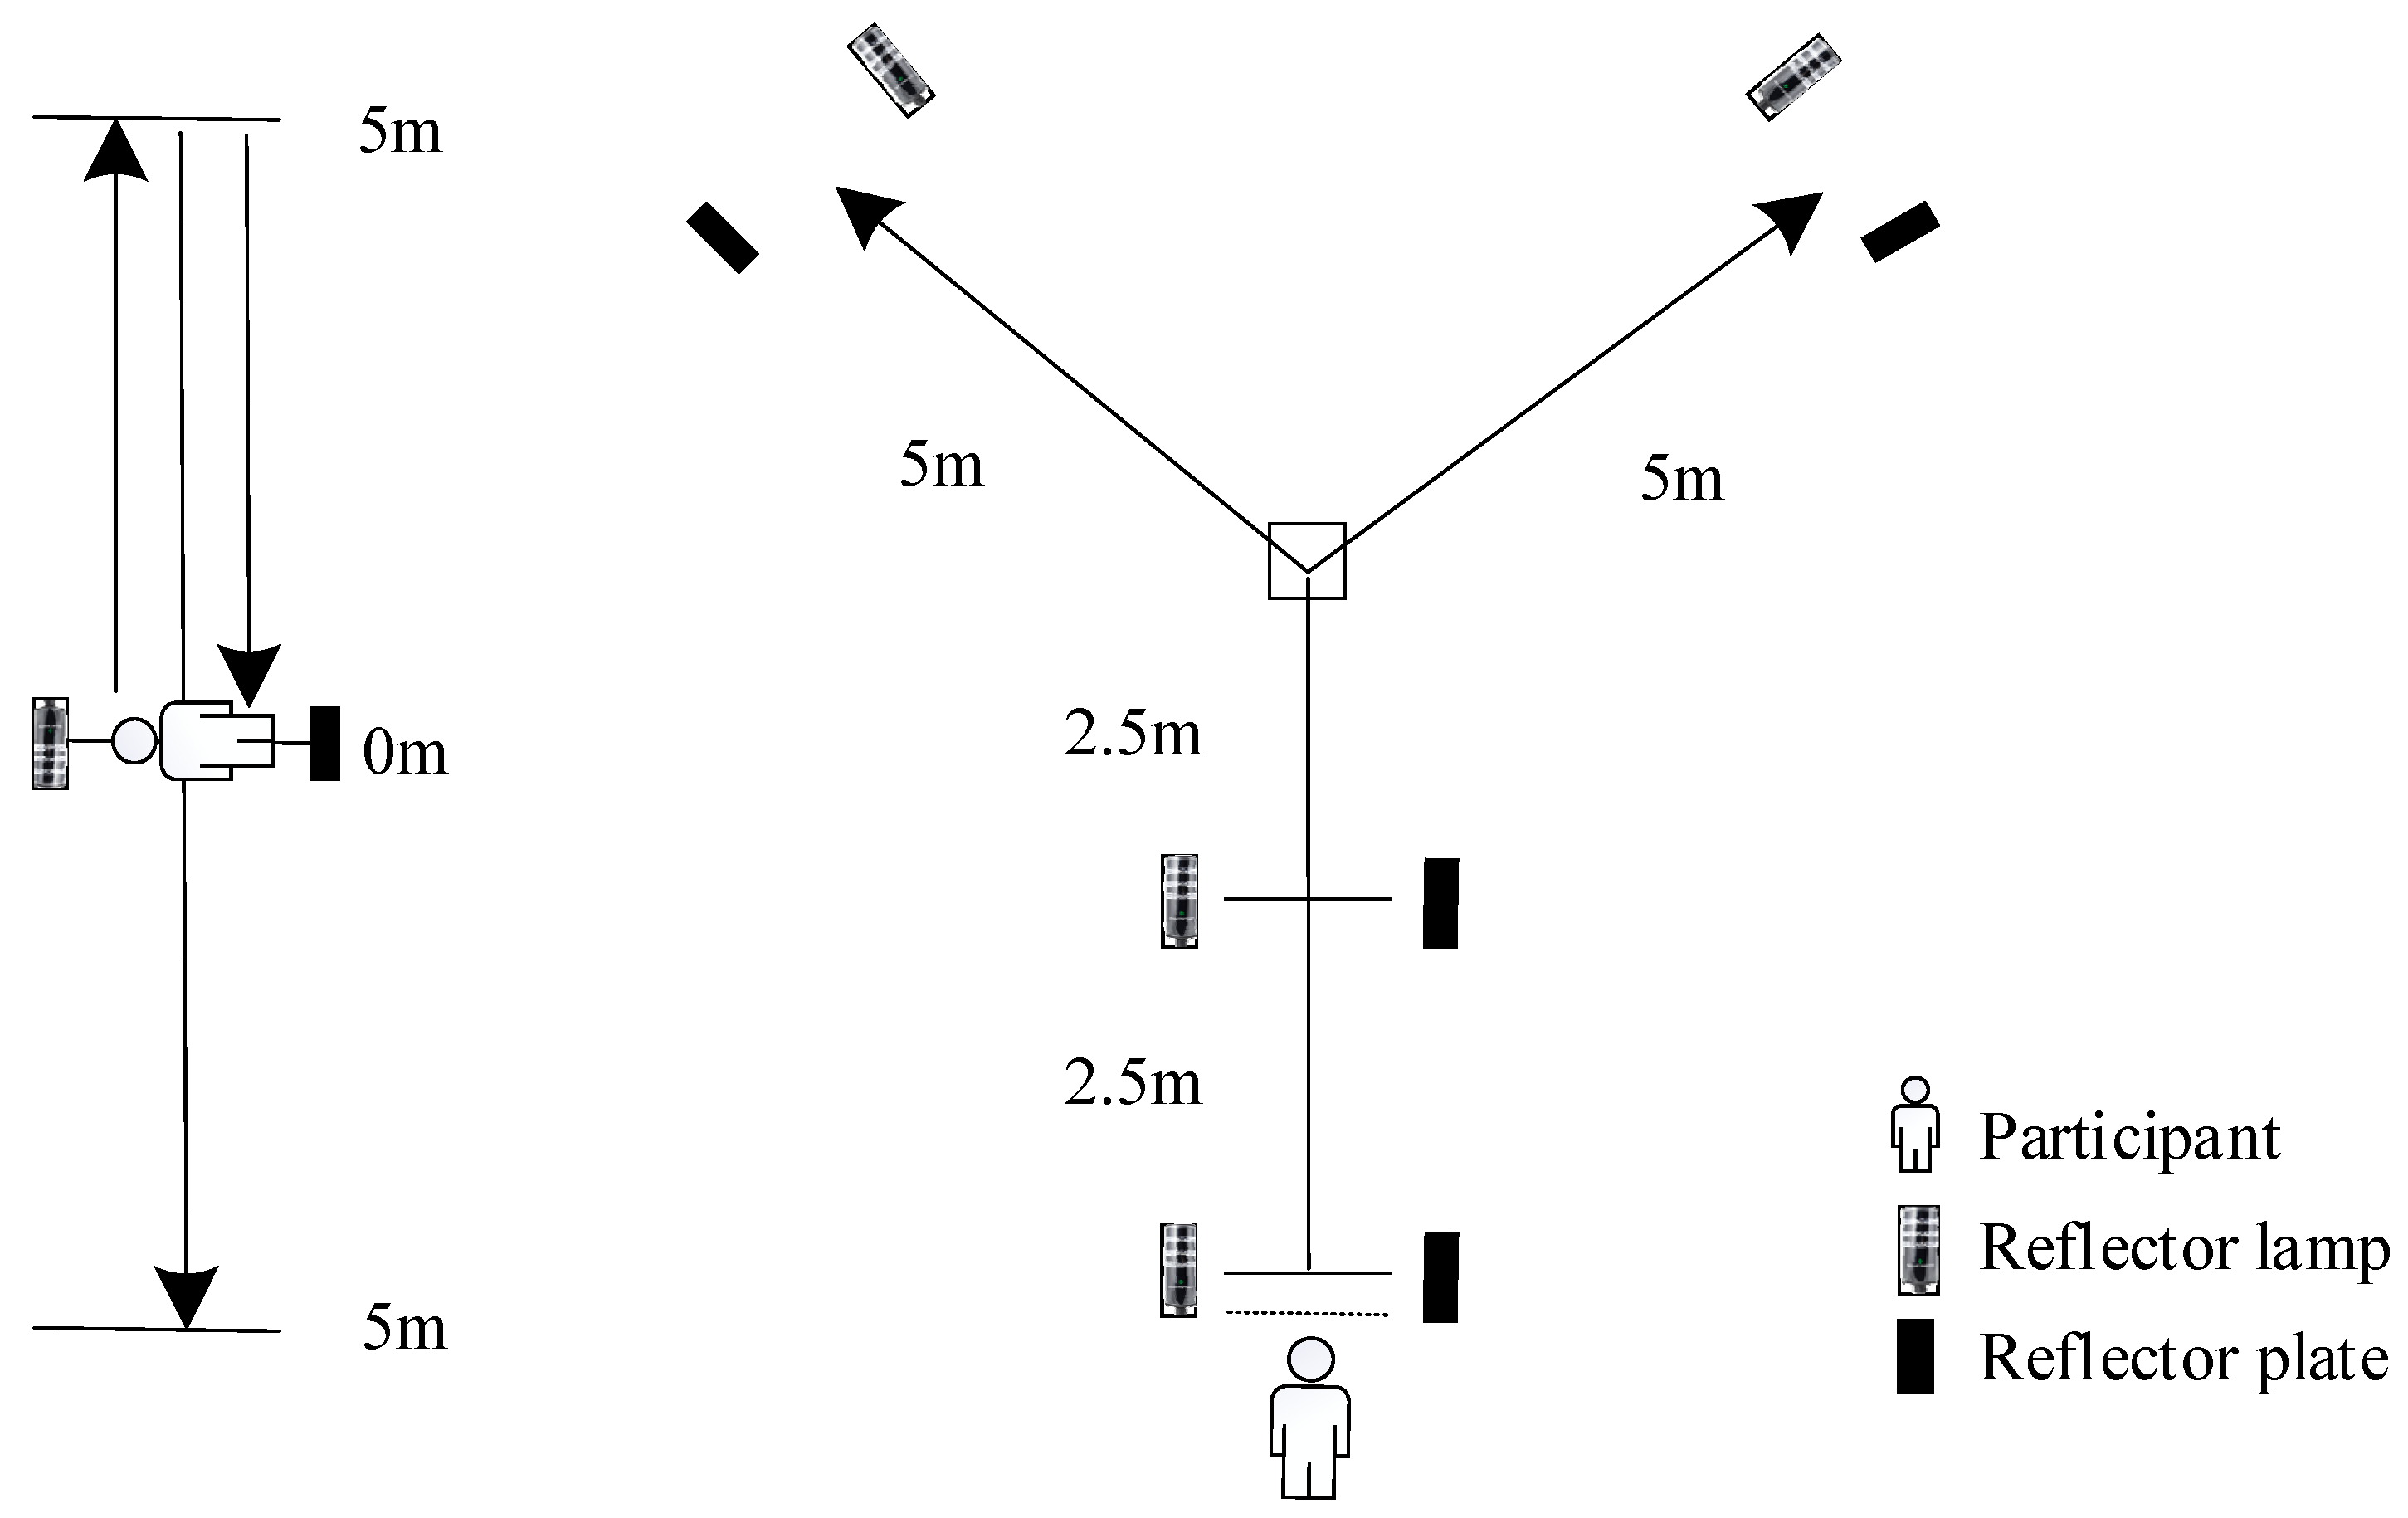
2.2.1. Linear Speed Test

The 30 m sprint test used the photocell system (SmartSpeed, Fusion Sport, Queensland, Australia). Photocell gates were placed at the start, 5 m, 10 m, and 30 m, with a height and width of 1.2 m and 1.5 m, respectively, to record acceleration times from 0 to 5 m, 0 to 10 m, and 0 to 30 m. Before the start, players took a split-leg stance, standing 0.5 m behind the starting line, with no signal given. The formal test consisted of two valid trials with a 3 min interval. Researchers recorded the time for each distance to the nearest 0.01 s and used the mean of two tests for data analysis.

2.2.2. COD Test

The Y-shaped pre-planned agility [6] and Pro-agility tests [9] were conducted using the photocell system (SmartSpeed, Fusion Sport, Queensland, Australia) (Figure 1). The starting position for the Y-shaped pre-planned agility was the same as that for the 30 m test. Participants first clearly indicated the direction, then sprinted 5 m at the fastest speed, followed by sprinting 5 m in the left or right 45° direction. For the Pro-agility test, the photocell gates were placed equidistant from the centerline, 5 m away on both sides. The participant started in a half-squat, one-hand touch-ground stance, straddling the centerline and facing the photocell gates, and ran 5 m to reach the sideline while running in the same direction as the hand touching the ground. Upon touching the sideline, the participant turned 180° and sprinted 10 m, then turned 180° again and sprinted 5 m after touching the sideline with their hand. Before the test, the participants practiced 50% and 70% of the maximum intensity. They then performed two valid tests in the left and right directions, respectively, with a 3 min interval between tests. The researchers accurately recorded the time of each distance at 0.01 s and used the average of the two valid test scores for data analysis. Pro-agility requires the athlete’s high deceleration, braking, COD, and acceleration abilities [9]. This study further analyzed the impact of the CODTT and CODD indicators based on Pro-agility from 0–10 m on evaluating an athlete’s COD ability on both sides. Defining the kicking leg during a shot as the dominant (DOM) side and the supporting leg as the non-dominant (Not-DOM) side [2].

2.3. Data Processing

The CODD of Y-shaped pre-planned agility and Pro-agility 0–10 m was obtained by calculating the difference between the CODTT and the 0–10 m sprint time. The CODD of the Pro-agility was obtained by dividing the difference between the CODTT and the 10–30 m sprint time, i.e., CODD (s) = CODTT (s) − sprint time (s). Z-scores are calculated as (individual test scores − team average test scores)/standard deviations of the team test score [10,11]. A negative Z-score indicates that the athlete’s COD ability is better than the team average. In contrast, a positive Z-score suggests that the athlete’s COD ability is lower than the team average. The asymmetry index was used to measure the symmetry of the athlete’s COD ability between the DOM and Not-DOM sides. The asymmetry index is calculated as [(DOM − Not-DOM)/DOM] × 100% [12]. An asymmetry index of 0% indicates complete symmetry between the two sides; an index of 0–10% indicates relative symmetry ability between the two sides; and an index greater than 10% indicates an asymmetry between the two sides of COD ability [13].

2.4. Statistical Analysis
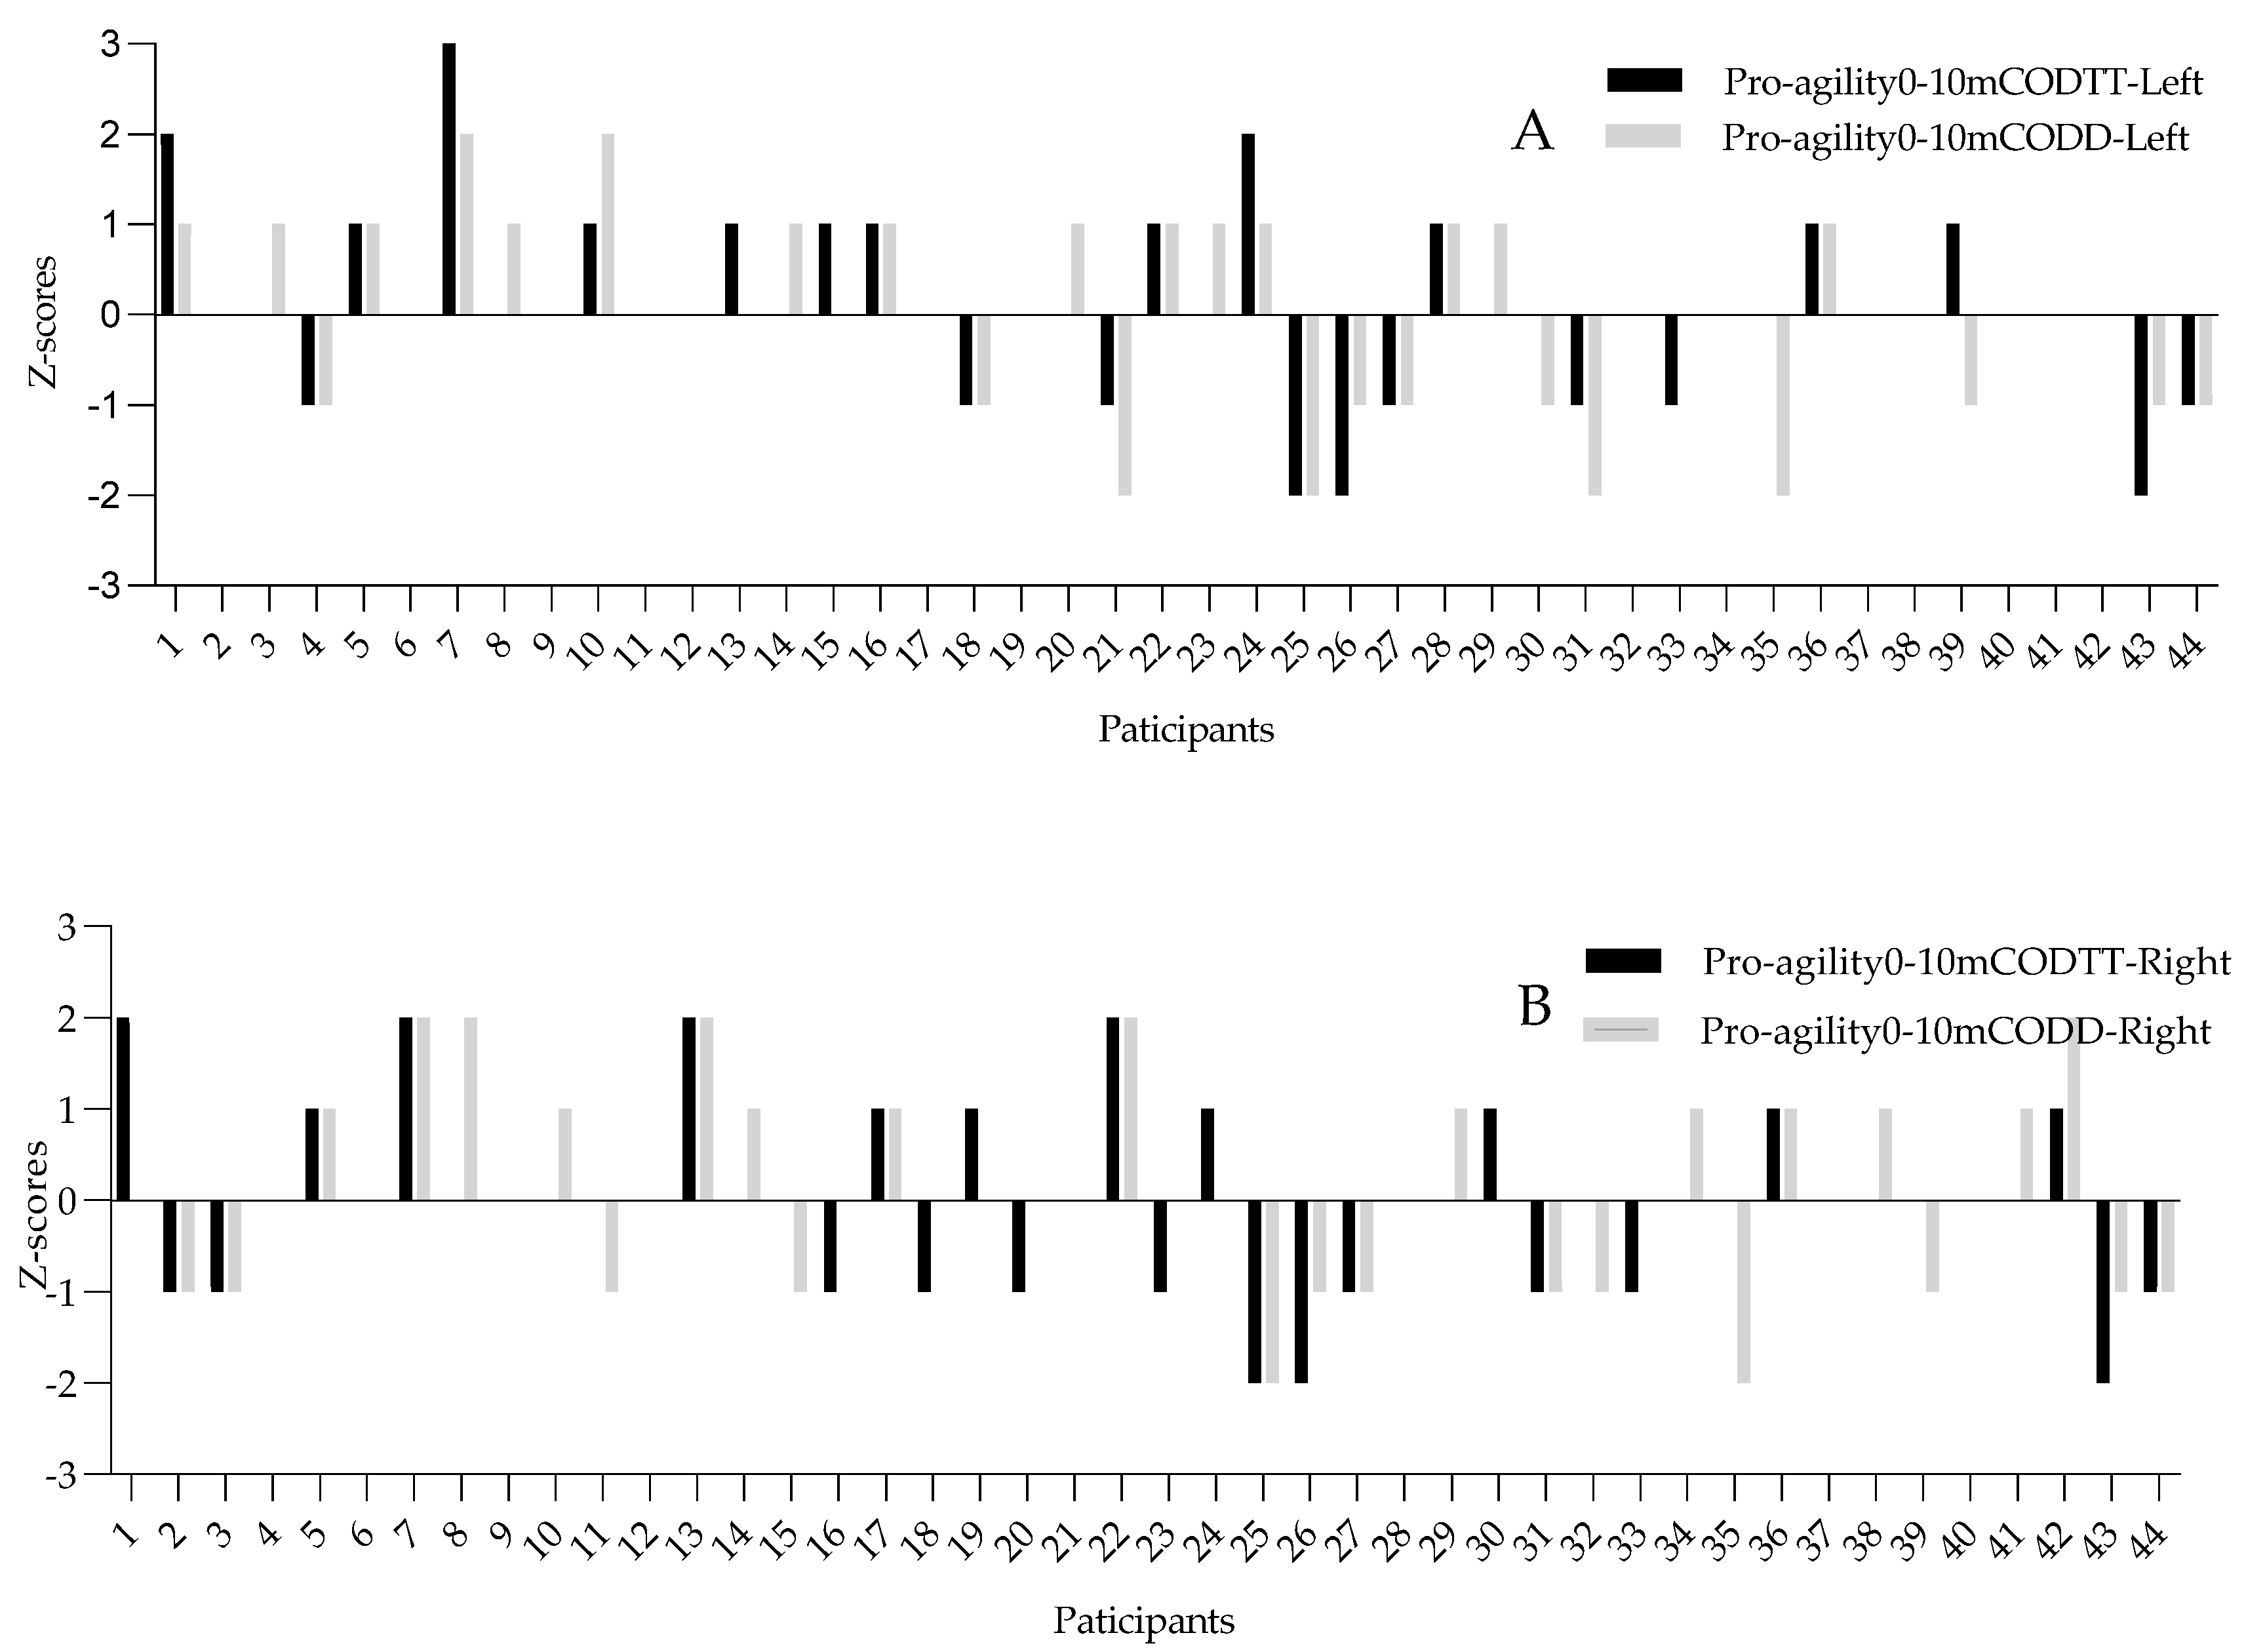
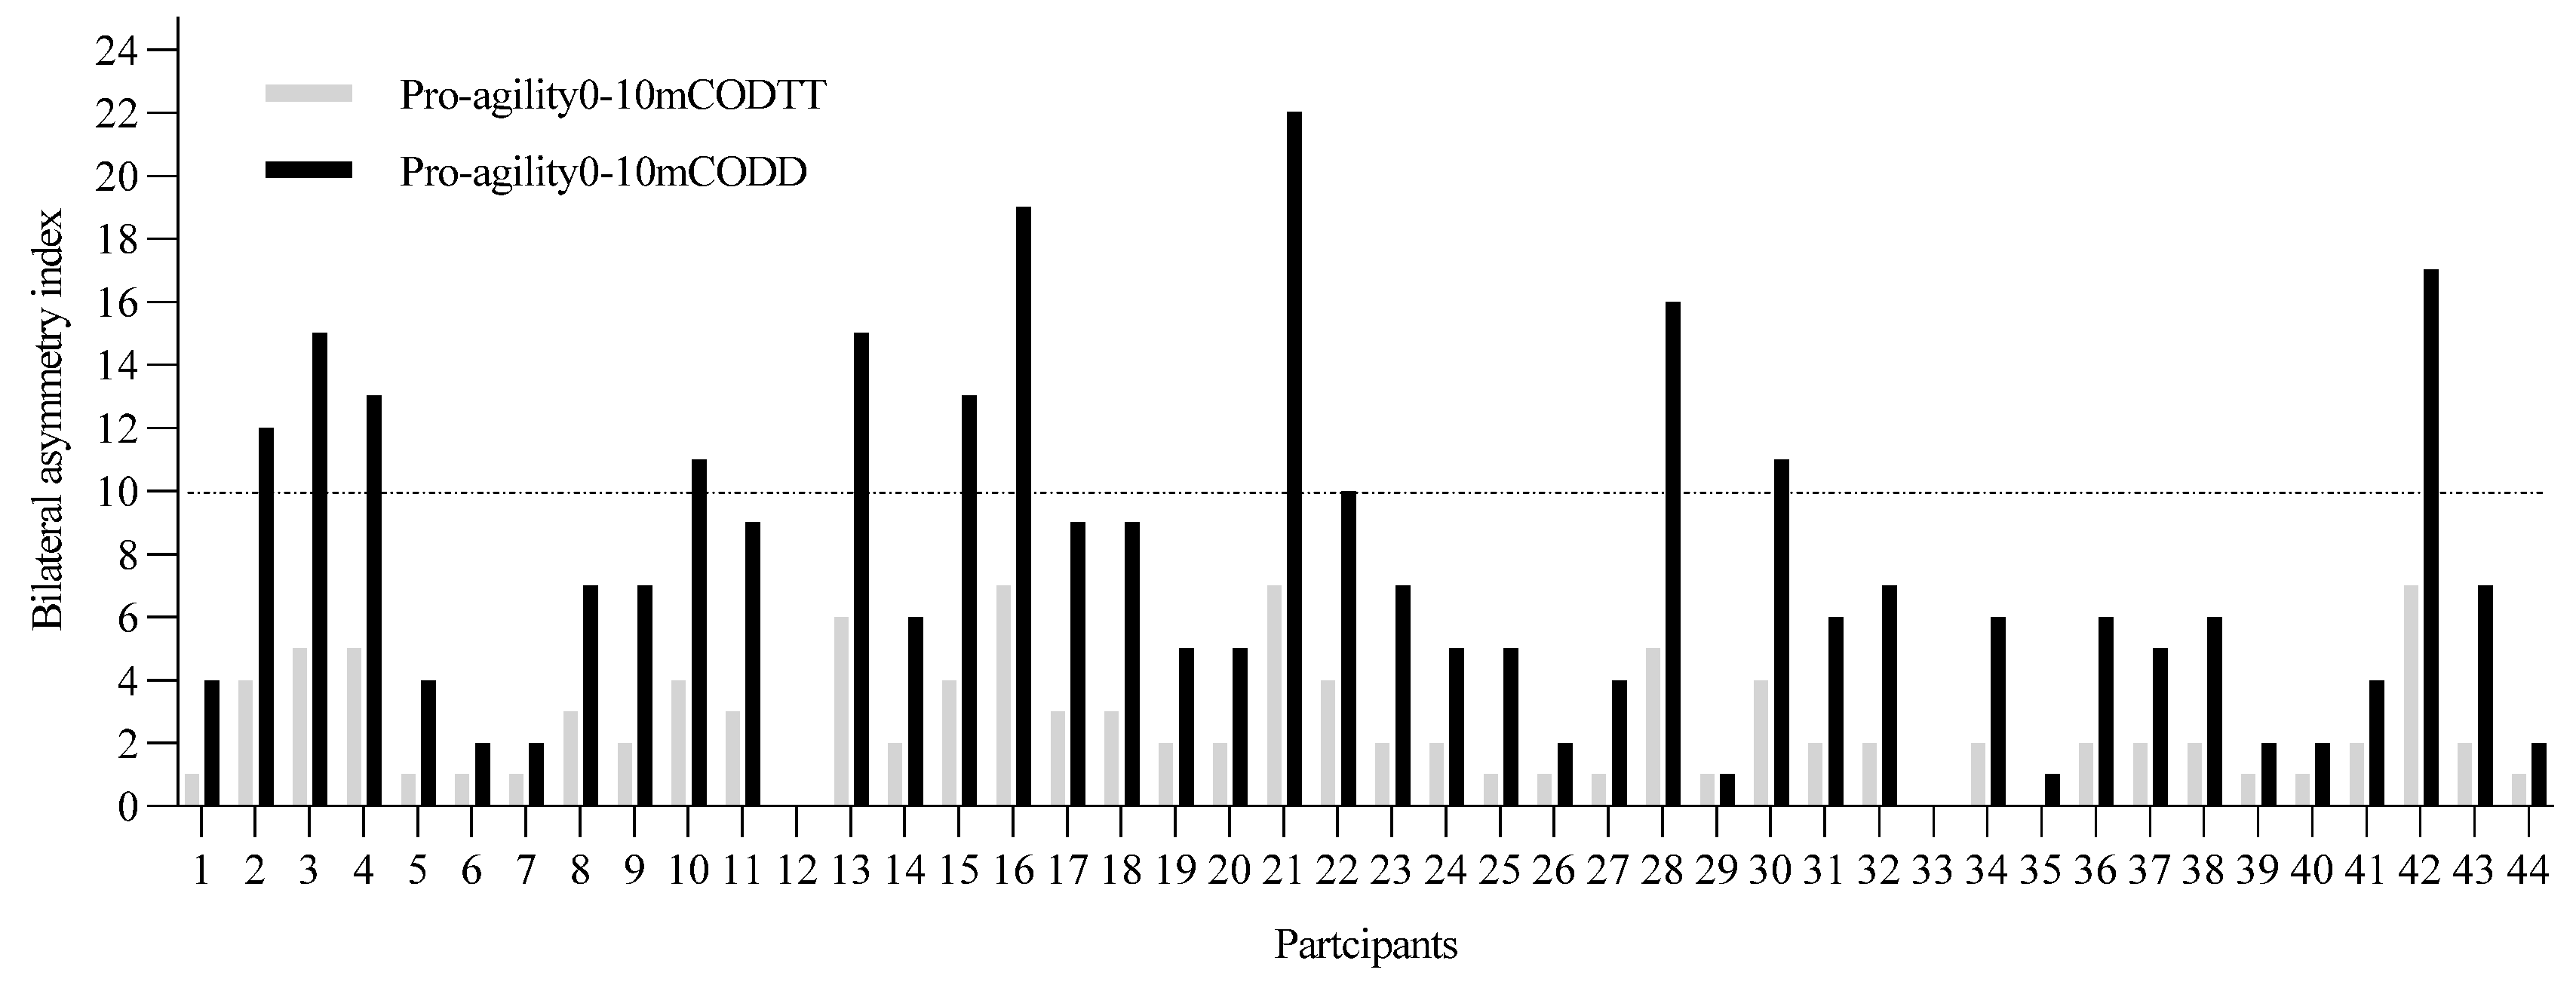
Statistical analysis was performed using the IBM SPSS statistics version 26.0 (SPSSInc., Chicago, IL, USA). All data were represented by the mean ± standard deviation (M ± SD). The normality of the data was confirmed using the Shapiro–Wilk test. The correlation between the left and right CODTT, CODD, and linear sprint time was analyzed by the Pearson correlation coefficient and the coefficient of determination (R2 × 100%). The correlation coefficient (r) was classified as small (0.10–0.29), moderate (0.30–0.49), large (0.50–0.69), very large (0.70–0.89), and perfect correlation (0.90–1.00) [14]. A paired sample t-test was used to compare the COD ability of players between the DOM and Not-DOM sides. Cohen’s d effect size (ES) was calculated and interpreted as small (0.2–0.49), moderate (0.5–0.79), and large (≥0.8). Descriptive statistics were used to analyze the impact of Pro-agility 0–10 m CODTT and CODD on assessing an athlete’s COD ability. The significance level was set at p < 0.05.

3. Results

Table 1 shows that the CODD in the Pro-agility 0–10 m test was higher than the Y-shaped pre-planned agility test when controlling for the same running distance and number of cuts, indicating that CODD increases with cut angle. Additionally, when comparing similar running types and angles, the CODD in the Pro-agility test was higher than in the Pro-agility 0–10 m test, suggesting that CODD increases with the number of cuts.
Table 2 shows a moderate to highly significant correlation between CODTT in the Y-shaped pre-planned agility test on both left and right sides and sprint times at 0–5 m, 0–10 m, and 0–30 m. The CODD on both sides is mildly to moderately correlated with the 30 m sprint times. The CODD and CODTT in Y-shaped pre-planned agility had a significantly moderate to large correlation, with CODD explaining 14–35% of the CODTT variable.
Table 3 presents the Pro-agility 0–10 m CODTT on both the left and right sides, which were moderately to highly positively correlated with the 0–5 m, 0–10 m, and 0–30 m sprint times. The CODD on both sides during the Pro-agility 0–10 m slightly correlated with the 0–5 m, 0–10 m, and 0–30 m sprint times. There was a very high positive correlation between the Pro-agility 0–10 m CODD and CODTT, with the CODD explaining 63% of the CODTT variable.
Table 4 shows that the Pro-agility CODTT on both the left and right sides was positively correlated with the 0–5 m, 0–10 m, and 0–30 m sprint times. The CODD of Pro-agility on both sides weakly correlated with 30 m sprint time. The CODD of Pro-agility was positively correlated with the CODTT, with the CODD explaining 49–52% of the CODTT variable.
A comparison of the CODD Z-score and CODTT Z-score of the left side of the Pro-agility 0–10 m revealed that among the 44 participants, 12 participants (numbered 6, 8, 17, 19, 23, 30, 32, 34, 37, 38, 39, and 41) showed opposite classification results for their COD ability (Figure 2A,B). The Z-score changed from positive (slower than the average level of the team) to negative (faster than the average level of the group) and vice versa, with a ratio of 27%. In comparing the COD ability of the right side, 6 out of 44 participants (numbered 4, 6, 14, 20, 30, and 39) showed different classifications, with a ratio of 13%.
Table 5 indicates no significant differences in COD ability between the left and right sides when using CODTT and CODD as measurement indices. However, the asymmetry index was lower on the left than on the right. Additionally, all participants had a relatively balanced COD ability when using CODTT as a measurement index (Figure 3). Twelve participants (numbered 2, 3, 4, 10, 13, 15, 16, 21, 22, 29, 31, and 42) had an asymmetry in COD abilities, as indicated by an asymmetry index of ≥10% based on CODD, which represented 27% of the 44 participants.

4. Discussion

One of the aims of this study was to analyze the correlation between CODTT, CODD, and sprint time. We observed significant correlations between CODTT of Y-shaped pre-planned agility, Pro-agility 0–10 m, and Pro-agility and sprint times at 0–5 m, 0–10 m, and 0–30 m, consistent with some previous findings. For instance, a study involving 25 high school American football players revealed a significant relationship between total time in the 505 agility test and sprint times at 5 yards, 10 yards, and 40 yards [15]. Another study, which included 36 male university students participating in team sports, detected a significant correlation between CODTT in the context of the 90° COD test and the 505 agility test and sprint times at 5 m, 10 m, and 20 m distances [10]. The previously highlighted facts indicate that CODTT is commonly affected by short sprint times. A primary reason for this phenomenon may be that the COD and sprint tests involve similar acceleration movement patterns and running distances. In this study, Y-shaped pre-planned agility, Pro-agility 0–10 m, involved two 5 m sprints, while Pro-agility covered two 5 m sprints and one 10 m sprint. Similar to the 30 m sprint, athletes must adopt a running strategy of quick steps and short strides in the acceleration phase to achieve the desired speed in the shortest time. However, a study investigated the center of mass velocity using three motion-capture techniques at distances of 0.3 m and 0.5 m following deceleration in rugby players [7]. They found that the center of mass velocity was not significantly correlated with 5 m and 10 m sprint speeds. Thus, we can infer that the CODTT may not accurately reflect an athlete’s COD ability.
As researchers increasingly recognize the importance of accurately measuring COD ability, more and more scholars have challenged the validity of the CODTT. The investigation of the CODD began in 2013, suggesting that the CODD might reflect the actual COD ability [9]. Previous studies have shown that there is a significant correlation between the CODD and the CODTT in the 505 agility test [11], the Pro-agility test [9], the L-shaped COD test [10], and the Zigzag test [16]. This study showed a significant correlation between the CODTT and the CODD in the Y-shaped pre-planned agility, the Pro-agility 0–10 m, and the Pro-agility, further confirming previous findings. Additionally, the results show that the CODD in the Y-shaped pre-planned agility, Pro-agility 0–10 m, and Pro-agility tests only had small to moderate correlations with the 0–5 m, 0–10 m, and 0–30 m sprint times, which is similar to previous research findings. Studies have confirmed that the correlation between the CODD in Pro-agility 0–10 m and the 10 m sprint time [9], the CODD in the 505 agility test and the sprint times at 10 m and 30 m [5], and the CODD in the L-shaped COD test and the sprint times at 5 m, 10 m, and 20 m [10] have no statistical differences. Reducing the possible influence of the short sprint time on the CODD might be possible because the CODD is obtained by subtracting the sprint time from the CODTT over the same distance. Therefore, the CODD is an essential component of the CODTT, and the CODD and the short sprint time are two independent variables.
Furthermore, we found that compared to the Y-shaped pre-planned agility, the CODD of the Pro-agility 0–10 m test was more significant, and its prediction degree of CODTT variables was higher. The reason may be the different cut angles requiring different COD abilities. From a sports biomechanics perspective, the deceleration amplitude of an athlete before the braking stage is proportional to the cut angle [17], resulting in an increased ground contact time of the cut action with an increase in the cut angle. As the ground contact time in a 180° COD is greater than that of a 45° COD [17], the proportion of actual COD time in the CODTT in the 180° COD is higher, resulting in the higher predictability of the CODTT variables of the Pro-agility 0–10 m test. It can be inferred that the relationship between the CODD and the COD angle is almost consistent with the relationship between the ground contact time of the cut action and the cut angle. From the above analysis, the CODTT mainly consists of the actual COD action and a short sprint time. Using the CODTT as a basis for evaluating the athlete’s actual COD ability may not be appropriate. As an essential component of the CODTT, the CODD is independent of the straight sprint time variable and is related to the ground contact time of the cut action. Hence, it can be inferred that CODD might accurately reflect an athlete’s actual COD ability, suggesting that employing CODD as an indicator for assessing an athlete’s actual COD ability could represent a more scientifically rigorous evaluation approach.
Assessing athletes’ COD ability is the prerequisite for mastering their COD ability characteristics and devising tailored training plans. Identifying the strengths and weaknesses of athletes’ COD abilities is a vital test goal. A comparison of the standardized Z-score of CODTT and CODD revealed differences of 22% and 13% in the classification of athletes’ COD ability on the left and right sides, meaning that the Z-score changed from positive to negative or negative to positive. These findings align with previous research [5,10,11]. A plausible explanation for these variations may include substantial short sprint distances within the COD tests, allowing athletes to capitalize on their proficiency in straight sprints to minimize CODTT. However, their actual COD ability still needs improvement. This need for improvement was confirmed in a study that divided 49 professional male rugby players into fast and slow groups based on their 0–5 m sprint times, showing that the fast-group athletes achieved significantly better results in the Zigzag test than the slow group [18]. Another study compared the Zigzag ability and 20 m sprint ability among rugby athletes spanning different age groups, including U15, U17, U20, and adults [19]. The findings revealed that CODTT and 20 m sprint time increased with age across all age categories. In contrast, CODD exhibited an inverse trend, declining as athletes advanced in age. The low efficiency of actual COD actions might be due to a lack of targeted COD training, leading to the athletes’ inability to improve their deceleration, braking, and re-acceleration abilities [2]. Hence, relying on the CODTT for evaluating an athlete’s COD performance could result in incorrect judgments.
The asymmetry of an athlete’s COD ability on both sides can serve as a valuable reference for predicting the risk of sports-related injuries, monitoring post-injury recovery progress, and developing targeted training regimens to enhance COD performance. A previous study demonstrated that the asymmetry index based on CODD in the 505 agility test was higher than CODTT, and the proportion of COD ability asymmetry based on CODD was significantly higher than CODTT [11]. This study is similar to the above findings, with the asymmetry index and the proportion of COD ability asymmetry based on the CODD being higher than the CODTT. This phenomenon may be due to the differences between the CODTT and CODD in reflecting actual COD ability [11], as confirmed by previous empirical research. Moreover, a study that involved implementing the 505 agility test on a female athlete with a history of a 2-year-old ACL injury on her right leg revealed that the difference in left and right leg COD ability based on CODTT and CODD was only 0.1. However, CODTT’s asymmetry index was much lower than CODD [20]. The above study, combined with video analysis technology, indicated that the 0.1 s mainly came from the actual difference in left and right leg COD ability. Consequently, existing research suggests that, compared to CODD, quantifying the asymmetry index of an athlete based on CODTT may underestimate the asymmetry of an athlete’s COD ability on both sides. In conclusion, there is a significant difference between CODTT and CODD in evaluating the superiority and asymmetry of an athlete’s COD ability. Based on the CODTT, it is possible to conceal the expected problems found through COD tests. Such concealment could lead to a misjudgment of an athlete’s COD ability and significantly impact the following COD training program. Therefore, using the CODD to evaluate an athlete’s COD ability is necessary.

5. Conclusions

Short sprints and CODD can influence the CODTT, reducing its validity in evaluating athletes’ actual COD ability. However, the CODD minimizes the impact of sprint speed and can reflect actual COD ability more accurately. Moreover, using the CODTT and CODD as metrics for evaluating athletes’ COD ability and asymmetry may result in different categorization outcomes. Furthermore, relying solely on the CODTT might undervalue the proportion of COD bilateral asymmetry in athletes, potentially hindering the identification of the actual COD weakness. Therefore, using CODD for evaluating athletes’ COD ability may be more objective and have a more excellent reference value than the CODTT. In future practical applications and scientific research, the CODD should be considered a basis for evaluating athletes’ COD ability.

Author Contributions

Conceptualization, B.G., Y.W. and J.Y.; methodology, J.Y.; software, J.Y.; validation, B.G., Y.W. and J.Y.; formal analysis, J.Y.; investigation, J.Y.; resources, Y.W. and J.Y.; data curation, B.G. and J.Y.; writing original draft preparation, J.Y.; writing—review and editing, B.G., Y.W. and J.Y.; visualization, J.Y.; supervision, B.G., Y.W. and J.Y.; project administration, B.G., Y.W.; funding acquisition, Y.W. All authors have read and agreed to the published version of the manuscript.

Funding

This research was co-funded by “The University Philosophy and Social Science Research Project of Jiangsu Province (2023SJYB0384), Education Reform Research Project of Nanjing Sport Institute (JG202338)”.

Institutional Review Board Statement

The study was conducted according to the guidelines of the Declaration of Helsinki and approved by the Ethics Commission of the Shanghai University of Sport (No. 102772021RT010).

Informed Consent Statement

Informed consent was obtained from all subjects involved in the study. Written informed consent has been obtained from the patient(s) to publish this paper.

Data Availability Statement

The data presented in this study are available on request from the first author. The data presented in this study are available on request from the corresponding author. The data are not publicly available due to participants have consented to the use of their data for specific research purposes, but have not authorized public release.

Acknowledgments

Thanks to the relevant authors’ affiliations for equipment, testing and site completely support.

Conflicts of Interest

The authors declare no conflict of interest.

References

  1. Sheppard, J.M.; Young, W.B. Agility literature review: Classifications, training and testing. J.Sports Sci. 2006, 24, 919–932. [Google Scholar] [CrossRef] [PubMed]
  2. Rouissi, M.; Haddad, M.; Bragazzi, N.L.; Owen, A.L.; Moalla, W.; Chtara, M.; Chamari, K. Implication of dynamic balance in change of direction performance in young elite soccer players is angle dependent? J. Sports Med. Phys. Fitness. 2018, 58, 442–449. [Google Scholar] [CrossRef] [PubMed]
  3. Young, W.B.; Dawson, B.; Henry, G.J. Agility and change-of-direction speed are independent skills: Implications for training for agility in invasion sports. Int. J. Sports. Sci. Coach. 2015, 10, 159–169. [Google Scholar] [CrossRef]
  4. Paul, D.J.; Gabbett, T.J.; Nassis, G.P. Agility in team sports: Testing, training and factors affecting performance. Sports Med. 2016, 46, 421–442. [Google Scholar] [CrossRef] [PubMed]
  5. Nimphius, S.; Callaghan, S.J.; Spiteri, T.; Lockie, R.G. Change of direction deficit: A more isolated measure of change of direction performance than total 505 time. J. Strength Cond. Res. 2016, 30, 3024–3032. [Google Scholar] [CrossRef] [PubMed]
  6. Fiorilli, G.; Mitrotasios, M.; Iuliano, E.; Pistone, E.M.; Aquino, G.; Calcagno, G.; Di Cagno, A. Agility and change of direction in soccer: Differences according to the player ages. J. Sports Med. Phys. Fitness. 2017, 57, 1597–1604. [Google Scholar] [PubMed]
  7. Sayers, M.G. Influence of test distance on change of direction speed test results. J. Strength Cond. Res. 2015, 29, 2412–2416. [Google Scholar] [CrossRef] [PubMed]
  8. Hornikova, H.; Zemkova, E. Relationship between physical factors and change of direction speed in team sports. Appl. Sci. 2021, 11, 655. [Google Scholar] [CrossRef]
  9. Nimphius, S.; Geib, G.; Spiteri, T.; Carlisle, D. “Change of direction” deficit measurement in division i american football players. Aust. Strength Cond. Res. 2013, 21, 115–117. [Google Scholar]
  10. Cuthbert, M.; Thomas, C.; Dos’Santos, T.; Jones, P.A. Application of change of direction deficit to evaluate cutting ability. J. Strength Cond. Res. 2019, 33, 2138–2144. [Google Scholar] [CrossRef] [PubMed]
  11. Dos’Santos, T.; Thomas, C.; Jones, P.A.; Comfort, P. Assessing asymmetries in change of direction speed performance: Application of change of direction deficit. J. Strength Cond. Res. 2019, 33, 2953–2961. [Google Scholar] [CrossRef] [PubMed]
  12. Jones, P.A.; Bampouras, T.M. A comparison of isokinetic and functional methods of assessing bilateral strength imbalance. J. Strength Cond. Res. 2010, 24, 1553–1558. [Google Scholar] [CrossRef] [PubMed]
  13. Zwolski, C.; Schmitt, L.C.; Thomas, S.; Hewett, T.E.; Paterno, M.V. The utility of limb symmetry indices in return-to-sport assessment in patients with bilateral anterior cruciate ligament reconstruction. Am. J. Sport Med. 2016, 44, 2030–2038. [Google Scholar] [CrossRef] [PubMed]
  14. Hopkins, W.G.; Marshall, S.W.; Batterham, A.M.; Hanin, J. Progressive statistics for studies in sports medicine and exercise science. Med. Sci. Sport. Exer. 2009, 41, 3–12. [Google Scholar] [CrossRef] [PubMed]
  15. Lockie, R.G.; Farzad, J.; Orjalo, A.J.; Giuliano, D.V.; Moreno, M.R.; Wright, G.A. A methodological report: Adapting the 505 change-of-direction speed test specific to american football. J. Strength Cond. Res. 2017, 31, 539–547. [Google Scholar] [CrossRef] [PubMed]
  16. Freitas, T.T.; Pereira, L.A.; Alcaraz, P.E.; Arruda, A.F.S.; Guerriero, A.; Azevedo, P.; Loturco, I. Influence of strength and power capacity on change of direction speed and deficit in elite team-sport athletes. J. Hum. Kinet. 2019, 68, 167–176. [Google Scholar] [CrossRef]
  17. Havens, K.L.; Sigward, S.M. Whole body mechanics differ among running and cutting maneuvers in skilled athletes. Gait Posture 2015, 42, 240–245. [Google Scholar] [CrossRef]
  18. Loturco, I.; Pereira, L.A.; Freitas, T.T.; Alcaraz, P.E.; Zanetti, V.; Bishop, C.; Jeffreys, I. Maximum acceleration performance of professional soccer players in linear sprints: Is there a direct connection with change-of-direction ability? PLoS ONE 2019, 14, e0216806. [Google Scholar] [CrossRef]
  19. Loturco, I.; Jeffreys, I.; Abad, C.C.C.; Kobal, R.; Zanetti, V.; Pereira, L.A.; Nimphius, S. Change-of-direction, speed and jump performance in soccer players: A comparison across different age-categories. J. Sports Sci. 2020, 38, 1279–1285. [Google Scholar] [CrossRef] [PubMed]
  20. Nimphius, S.; Callaghan, S.J.; Bezodis, N.E.; Lockie, R.G. Change of direction and agility tests: Challenging our current measures of performance. J. Strength Cond. Res. 2018, 40, 26–38. [Google Scholar] [CrossRef]
Figure 1. Example of a Pro-agility test (right) and a Y-shaped pre-planned agility test (left).
Applsci 13 12211 g001
Figure 2. (A,B) The difference between Z-scores for CODTT and CODD in Pro-agility 0–10 m left and right side.
Applsci 13 12211 g002
Figure 3. The bilateral asymmetry index of Pro-agility 0–10 m CODTT and CODD. Dotted line: The asymmetry index is 10%.
Applsci 13 12211 g003
Table 1. Descriptive for change of direction and linear sprint test results with 95% CI.
TestVariableResult (s)95%CI
Lower (s)Upper (s)
Pro-agility
0–10 m
CODTT-left2.70 ± 0.132.423.05
CODD-left0.95 ± 0.110.711.21
CODTT-right2.70 ± 0.132.413.02
CODD-right0.96 ± 0.100.751.18
Pro-agilityCODTT-left5.22 ± 0.224.755.68
CODD-left2.62 ± 0.212.193.12
CODTT-right5.23 ± 0.214.795.69
CODD-right2.63 ± 0.202.293.03
Y pre-planned agilityCODTT-left1.83 ± 0.101.672.14
CODD-left0.08 ± 0.080.050.29
CODTT-right1.83 ± 0.081.662.04
CODD-right0.09 ± 0.050.040.27
30 m sprint0–5 m1.00 ± 0.050.891.15
0–10 m1.74 ± 0.081.611.94
0–30 m4.34 ± 0.233.904.91
Table 2. Correlation coefficients between Y-shaped pre-planned agility and 30 m sprint performance.
VariableY CODTTY CODD
rR2prR2p
Left0–5 m0.6543<0.01−0.1420.37
0–10 m0.6542<0.01−0.2350.13
0–30 m0.4924<0.01−0.32100.03
CODTT1.00//0.5935<0.01
Right0–5 m0.7657<0.01−0.1940.20
0–10 m0.7861<0.01−0.2880.06
0–30 m0.6440<0.01−0.34120.02
CODTT1.00//0.38150.01
Y: Y-shaped pre-planned agility; CODTT: change of direction total time; CODD: change of direction deficit.
Table 3. Correlation coefficients between Pro-agility 0–10 m and 30 m sprint performance.
DirectionVariablePro-Agility 0–10 m CODTTPro-Agility 0–10 m CODD
rR2prR2p
Left0–5 m0.6137<0.010.0600.69
0–10 m0.5632<0.01−0.0500.73
0–30 m0.42170.01−0.1520.34
CODTT1.00//0.7963<0.01
Right0–5 m0.6543<0.010.1220.42
0–10 m0.6038<0.010.0100.95
0–30 m0.4722<0.01−0.0810.57
CODTT1.00//0.7963<0.01
CODTT: change of direction total time; CODD: change of direction deficit.
Table 4. Correlation coefficients between Pro-agility and 30 m sprint performance.
DirectionVariablePro-Agility CODTTPro-Agility CODD
rR2prR2p
Left0–5 m0.6643<0.010.2350.14
0–10 m0.6340<0.010.0610.66
0–30 m0.4924<0.01−0.2350.13
CODTT1.00//0.7352<0.01
Right0–5 m0.6543<0.010.2460.11
0–10 m0.6644<0.010.10110.50
0–30 m0.5833<0.01−0.1630.29
CODTT1.00//0.7049<0.01
CODTT: change of direction total time; CODD: change of direction deficit.
Table 5. Pro-agility 0–10 m left and right side of the bilateral asymmetry index.
Dominant Side (s)Non-Dominant Side (s)Asymmetry Index (%)pES
CODTT2.70 ± 0.132.70 ± 0.132.59 ± 1.880.68−0.04
CODD0.95 ± 0.110.96 ± 0.107.26 ± 5.220.68−0.05
Disclaimer/Publisher’s Note: The statements, opinions and data contained in all publications are solely those of the individual author(s) and contributor(s) and not of MDPI and/or the editor(s). MDPI and/or the editor(s) disclaim responsibility for any injury to people or property resulting from any ideas, methods, instructions or products referred to in the content.

