Abstract
In response to the problem of bowl seedling detachment caused by the shaking of the transplanting machine in plant factories, this paper proposes a physical entity monitoring method for the digital twin (DT) plant factory transplanting system. The method is used to analyze the vibration signals of the transplanting machine under different operating conditions and explore the optimal working conditions. Firstly, a demand analysis for the physical entity of the DT plant factory transplanting system is conducted, focusing on practical applications. Then, an optimal deployment plan is designed based on the axiomatic design (AD) theory. Subsequently, a comparative analysis of the operating conditions of the plant factory transplanting equipment is carried out using data-driven approaches. Finally, the optimal working condition parameters are determined by comparing the modal vibration power spectral density of the transplanting equipment under different operating conditions. The results show that the maximum amplitude occurs in the Z-axis, with a magnitude of 2.1 m/s2. By comparing the cloud maps, it is evident that the vibration trends in the Z-axis and X-axis above the transplanting robotic arm are more pronounced compared to the Y-axis. This indicates that under the operating condition of transplanting 3000 plants per hour, a high transplanting efficiency can be maintained, and the vibration signals in the XYZ-axis above the transplanting robotic arm are relatively smooth, making them suitable for transplanting operations. This study combines digital twin technology to analyze the vibration signals of the plant factory transplanting machine under different operating conditions and explore the optimal working conditions. Compared to traditional monitoring platforms, this method facilitates the real-time visualization of different operating conditions of the transplanting machine in a virtual mapping, providing a more intuitive reflection of the equipment operation status.
1. Introduction
As a key piece of technical equipment in plant factories, the vegetable transplanting machine directly affects the quality and survival rate of seedlings, which in turn affects the overall yield and economic benefits [1,2]. During the operation of high-speed transplanting robots, vibrations can occur, and mechanical vibrations can cause seedlings to slip off and fail to be properly planted on the planting tray. It is necessary to explore the impact of such mechanical vibrations on the transplanting process. Therefore, it is important to design a monitoring system that can be adapted to the plant factory environment and present the working status of transplanters in real time [2,3]. The newest and most advanced technologies are the intelligent detection technologies that integrate virtual reality and physical sensing networks, which offer new ideas for transplant monitoring. The digital twin is a strong driving force for this development [4,5].
Since its proposal in 2003, the concept of the digital twin (DT) has gained significant interest from the academia and industry. It has found application primarily in the aerospace sector, addressing challenges related to equipment maintenance and failure prediction [6]. NASA has utilized digital twin technology to predict and prevent complex system failures in flight systems, while the U.S. Air Force Research Laboratory has developed a virtual computational model to forecast aircraft structural lives by considering structural deviation and temperature in a virtual space. Several studies have supported these developments [7,8,9,10,11]. Siemens, GE, RWTH Aachen University, and Pennsylvania State University, among others, have conducted separate research on the system and application of digital twin technology. Domestic ICT institutes, such as Sadie and Ansys Asia Pacific, have also made significant contributions to the development of the digital twin through white papers and exploration of its concept, technology, standardization, and practical applications [12,13,14,15,16]. Tao et al. thoroughly explained the concept of the digital twin workshop under the digital twin framework. They examined the fault prediction and health management issues of wind turbines, leading to improvements in the digital twin structure. They introduced a novel five-dimensional digital twin model architecture comprising a model for the physical entity, a model for the virtual device, a service model, a digital twin data model, and an association model. The composition of each model is visually represented through an equation.
In terms of replicating reality in a productive manner, Dong, Lei-Ting et al. utilized a simplified model to meet the time-dependent requirements of the digital twin for aircraft structures. Regarding functional mapping, Zhou, You-Cheng et al. also explored this aspect. In their study, Zhou Youcheng [17] used the concept of a digital twin to illustrate the modular capabilities of smart objects. This approach allows physical objects to effectively map their functions in the realm of information. Concerning data flow, Liu Linyan and colleagues [18] focused on the essential components of the manufacturing process at the factory. They explained the data collection of the tangible layer of the virtual replica and the real-time depiction of the manufacturing operation procedure using the unified structure of the industrial norm OPC (OLE for process control). The digital twin system emphasizes establishing a real-time connection between the physical and virtual layers, utilizing data as the medium. Qi Zhang [19] examined the relationship between physical data and the information model in the context of a stamping production line. The study employed an object-oriented approach to develop a physical data model and analyzed the motion behavior and logic of the production line to construct a digital information model. In a separate study on the intelligent control problem of microassembly lines, Huang Jia-Sheng et al. [20] demonstrated the effectiveness of a four-dimensional fusion twin model. This model incorporates multi-source heterogeneous data classification, cleaning, parsing, and real-time driving, enabling the real-time mapping of behavior, states, and actions.
Numerous excellent cases have greatly promoted the development of digital twin technology [21,22,23,24,25,26]. However, existing research mostly focuses on the innovation of digital twin frameworks and concepts, and digital twin modeling techniques are still a hot and difficult research area in the field of smart manufacturing [27]. During the transplanting process in a plant factory, mechanical vibrations that cause the gripper to shake can result in vegetable seedlings falling off and failing to be transplanted into the tray. The quality of planting operations has a significant impact on the yield of plant factories, making the physical monitoring of the transplanting system necessary. Analyzing the vibration characteristics during monitoring provides data support for the subsequent use of damping materials to reduce the vibration and noise. Therefore, this paper proposes to create a digital twin of a plant factory transplanter to visually represent the physical properties and potential laws of the factory equipment through a physical model, construct a digital twin behavior model through a standardized description method, and optimize the operational performance by overlaying feedback control functions on top of the hardware module through an information decision model. This method can achieve virtual-to-real mapping of the planting process in plant factories, providing technical references for the automated monitoring and control of agricultural production in various scenarios.
In terms of vibration monitoring, Hu Tianliang, Luo Weichao, and others proposed a study on predictive maintenance for CNC machine tools, which combines the DT with a sensor network to achieve early fault diagnosis for CNC machine tools. Chen Qipeng and others conducted research on key technologies for monitoring the manufacturing process state of automated production lines based on digital twins. They proposed a lightweight state monitoring model based on gated recurrent unit neural networks, providing a foundation for constructing digital twin models of automated production line manufacturing processes at the macro level. These studies provide a background foundation for researching vibration monitoring methods for plant transplanting machines based on digital twins.
This study extensively investigates the physical entity requirements and implementation strategies of the plant factory transplant system using DT technology, as shown in Figure 1. The remaining sections of this paper are organized as follows. Section 2 presents the analysis of the application requirements for the plant factory transplant system DT, the development of application-oriented deployment plans based on axiomatic design (AD) theory, and the workflow of physical entity implementation strategies. Subsequently, in Section 3, the feasibility and effectiveness of the proposed method are validated through a comparative analysis of sensor deployment plans and vibration diagnostics for the plant factory transplant (PFT) machine. Finally, Section 4 summarizes the findings of this study.
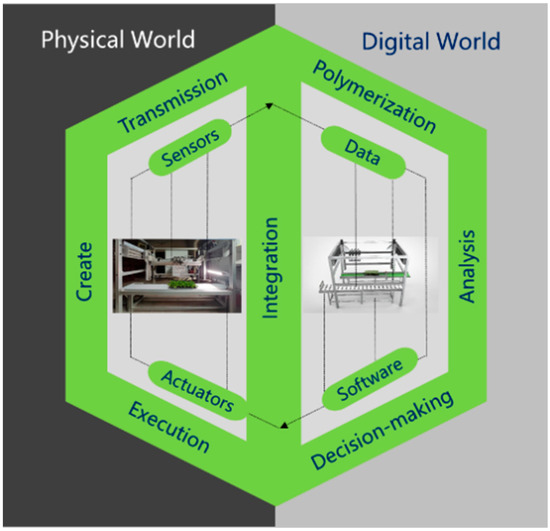
Figure 1.
DT-based PFT working condition analysis model.
2. Materials and Methods
2.1. DT Application Requirements Analysis
Firstly, it is necessary to conduct a requirement analysis for the digital twin transplanting system in a plant factory. Based on the findings of Professor Fei Tao’s study on digital twin technology and the report by Deloitte titled ‘Industry 4.0 and the Digital Twin’, the essential components of digital twin technology include physical sensors, actuators, data, and modifiable digital models [28,29]. Hence, while addressing DT technology-related issues in specific applications, the plant transplanting system as a physical entity should possess the ability to fulfill various demands, including constructing models, updating models, collecting data, and controlling the implementation. It will cover areas such as manufacturing application domains, systems involving different physical entities for application services, and application-oriented DT physical entity requirements. This analysis is illustrated in Figure 2.
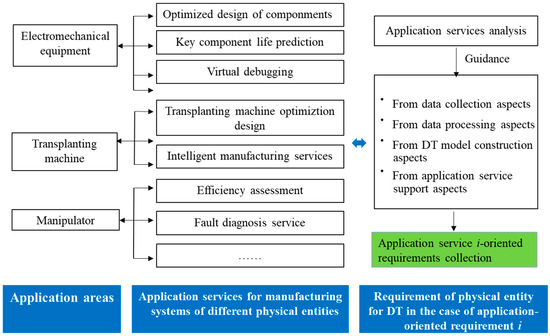
Figure 2.
Application-oriented analysis of physical entity requirements for the plant factory transplant system using digital twin technology.
When deciding on the utilization of a DT for a particular application in a plant production system, the foremost concern is the development of the implementation plan for the tangible object [30,31]. As stated in Section 1, AD theory is a scientific approach for designing and making decisions that converts design and application requirements into solutions, effectively addressing the issue of ambiguity in the main objectives of the design and providing a more scientifically precise design. As shown in Figure 3, the first step involves conducting application requirement analysis based on digital twin (DT) technology, which includes aspects such as model creation, transplanting, integration, and analysis. The second step involves developing application-oriented deployment plans using AD theory.
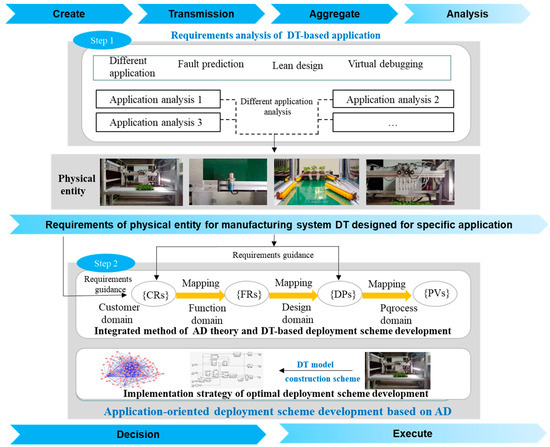
Figure 3.
Physical entity workflow for DT requirements and implementation of the plant transplanting system.
Figure 3 provides a description of the application requirements analysis based on the DT, which includes the characterization of various physical entities in the plant production system and the specific requirements of the DT for the designed plant system.
2.2. AD-Based Development of Application-Based Deployment Solutions
First proposed by Professor Nam P Suh at the Massachusetts Institute of Technology (MIT), axiomatic design theory is a fundamental axiom-guided design approach that guides the design process. By guiding designers to make scientific decisions in the design process, it provides a good way of thinking about innovative design. The main purpose of developing application-oriented deployment solutions for this particular application is to strategically plan the necessary hardware and software requirements for effectively deploying and implementing physical entities. Axiomatic design theory has been applied to digital twin-controlled machine tools and has found applications in the industrial sector. The transplanting equipment in a plant factory environment shares similarities with CNC machine tools, as they both operate in fixed work scenarios and involve production processes. This enables them to seamlessly collaborate with the DT model in order to efficiently address specific problems. Below, we outline two stages involved in creating a deployment solution focused on applications using AD.
2.2.1. Development of a Deployment Solution Based on the DT and Its Integration with the AD Theory
To begin with, it is important to clarify the application needs of tangible objects in order to address practical issues using DT technology. Additionally, it is necessary to organize their application requirements, functional requirements, and design requirements and the relationships between process variables. A comprehensive strategy for developing deployment solutions for plant transplanters can be discovered using the digital twin concept. Figure 4 illustrates the correlation between the remaining design areas and the creation of a deployment solution focused on applications.
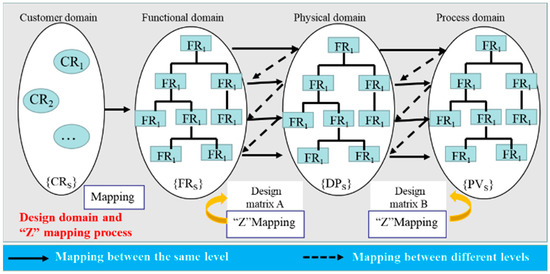
Figure 4.
Physical entity design domain of the AD-based plant transplanting system DT.
- (1)
- Requirements domain: It refers to the expression of user requirements for a product, as well as the product attributes. For the design of a digital twin transplantation machine, the requirement domain involves utilizing digital twin technology to construct a virtual entity that can monitor and provide real-time feedback on the operational status of the transplantation machine.
- (2)
- Functional domain: It pertains to the product’s functional requirements determined based on user needs. The functional requirements for the design of a digital twin transplantation machine involve meeting the requirements for vibration monitoring and optimal operational condition assessment.
- (3)
- Physical domain: It encompasses the design parameters aimed at fulfilling the functional requirements. The physical domain parameters for the design of a digital twin transplantation machine include vibration information, rotational speed information, timing information, and so on.
- (4)
- Process domain: It refers to the process variables established based on the design parameters. In this study, the process domain can be considered the deployment and implementation plan for the design elements within the physical domain.
2.2.2. Implementation Strategy for Optimal Deployment Scheme Development Based on the Digital Twin
Deploying a large number of sensors is necessary when constructing a digital twin system, and factors such as the accuracy, measurement range, material cost, installation cost, safety, and operation should all be taken into consideration. Therefore, it is necessary to study the optimal deployment plan for digital twin systems. The approach to developing an optimized deployment scheme involves combining AD theory with the specific needs of the physical entity in the DT of the plant transplanting system. This allows for the selection of a deployment scheme that requires minimal information to offer guidance for the implementation of the corresponding physical entity’s sensing system deployment, data storage, etc., and determine the most suitable deployment scheme.
Figure 5 illustrates the step-by-step process of creating a well-optimized deployment solution design for applications, which is based on the principles of independence and the information axiom.
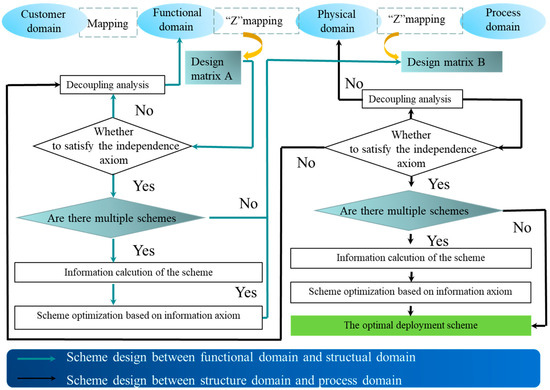
Figure 5.
DT’s AD-based plant transplanting system requires a well-designed physical entity for its deployment.
2.3. Vibration Energy Power Spectrum Density Analysis Method
Power spectral density analysis (PSD) is a technique employed in the field of signal processing and spectral analysis. By presenting the signal’s attributes in the frequency domain, it aids in comprehending and effectively utilizing the signal. The examination of the power distribution of a signal, known as power spectral density analysis, yields an image that depicts the fluctuation of power density in relation to frequency. This image shows the energy distribution of the signal at each frequency, with higher peaks indicating a greater signal strength at that frequency. The power spectral density is defined as follows for a signal that is randomly generated.
where is the vibration signal, is the Fourier transform of , and is the distribution of the average power spectrum of the signal in the frequency domain; that is, the power per unit frequency band is transformed with the frequency. The power spectral density (in dB per unit time) is obtained by integrating the time–frequency spectrum of the signal, revealing the variation in energy per frequency band in the frequency domain. This method can test the vibration conditions under different operating conditions above the transplantation robot hand, providing data support for selecting the operational conditions for transplantation.
2.4. Transplanter Condition Settings and Dataset Description
Table 1 displays the complete set of data, M = {M1, M2, M3, M4}, representing the data collected at various operating conditions during the plant’s operation for 20 s, 40 s, 60 s, and 80 s. There are 256 data files in every group. To guarantee the synchronization of signals from various sources, the digital twin system receives data from identical time periods. The data files in this paper are captured between 20 and 80 s from the midpoint, specifically. The vibration and video signals are uploaded as distinct data points. The vibration signals are stacked as 6-channel samples, and the XYZ channels of the same time period have a data dimension of 128 × 2048 × 6. The test set consists of 15% of the data.

Table 1.
Transplanting digital twin system dataset.
2.5. DT-Based PFT Model
When exploring the optimal operating conditions for PFT (plant factory transplantation) based on the digital twin (DT) approach, the main method used is the mechanical vibration analysis model to evaluate the performance of the transplantation equipment. Currently, the hardware configuration for the DT-based PFT mechanical vibration analysis is shown in Figure 6. This system includes the physical entity of the transplantation machine, virtual entity, data twin service system, three-axis acceleration sensors, industrial cameras, position sensors, multi-channel signal acquisition system, human–machine interaction interface, slide rail control box, and transplantation robot control box.
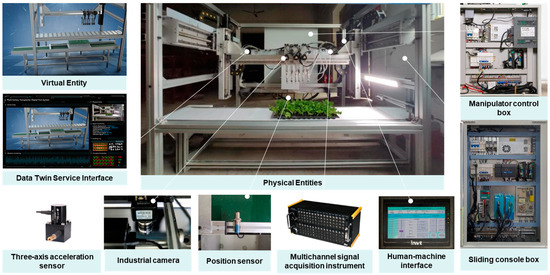
Figure 6.
Multi-domain PFT model based on DT.
3. Results and Discussion
To verify the practicality and efficiency of the suggested DT plant factory transplant system and its implementation techniques, this study identifies the most suitable sensor setup by considering real requirements and integrating technical, economic, and social indicators of the digital twin system. Afterwards, the scheme is followed to install and deploy sensors, and a comparative analysis is performed on the operational state of the transplant equipment in the plant factory. The appropriate operational parameters for the transplanting machine are determined by analyzing the power spectral density of modal vibrations in various operating conditions. Therefore, the entire analysis process can be divided into three steps. The first step is a comparative analysis of sensor schemes based on application deployment. The second step is a comparative analysis of the operating conditions of the plant factory transplant equipment based on data-driven approaches. The third step is the comparison of modal vibration power spectral density under different operating conditions of the transplant equipment.
3.1. Analyzing Different Sensor Solutions for the Deployment of AD Applications
The axiomatic design theory states that in the presence of multiple deployment schemes it is essential to evaluate these schemes using the information axiom theory. After careful consideration, the fault analysis applications in the DT plant factory transplant system have determined the most suitable deployment scheme for PFT vibration analysis. Three different sensor deployment schemes that satisfy the axioms have been determined based on factors like the PFT model’s modification space, input from field technicians, sensor characteristics, and analysis of sensor requirements. These schemes are presented in Table 2.
Table 2.
Deployment schemes of sensors in the plant factory transplant DT system.
The calculation method for the information content of the deployment options varies depending on the evaluation indicators. The assessment criteria for the PFT of the plant transplantation system DT deployment plan are categorized into technical, societal, and economic indicators, taking into account factors like sensor attributes. The field worker guidance and sensor procurement are used to acquire the initial values of the various evaluation indicator deployment schemes. The ES matrix, which is a standardized evaluation matrix, was derived from the EI matrix, which is a standardized initial evaluation matrix. Eventually, the DI sequence for the perfect design information interval was acquired with the aforementioned assessment criteria, frameworks, and so forth. Table 3 displays the presented information. The material and sensor costs are calculated based on actual production costs. The sensors used are produced by Donghua Test, and the specific pricing can be obtained from Donghua Test at http://www.dhtest.com/ (accessed on 13 January 2022).
Table 3.
Data for the design of deployment scenarios and its corresponding design matrix.
Based on the contents of Table 3, it is possible to calculate the factor values and information for the deployment scenario of the PFT in the DT application of the plant transplanting system, as shown in Table 4.
Table 4.
Performance parameters and information content of deployment options.
Based on the ideal standard of the information axiom, it is evident that the most suitable plan is Sc-2. This plan includes placing a triaxial accelerometer sensor above the robotic arm used for transplanting, an infrared sensor on the conveyor table, and a vision sensor above the rack for seedling trays. Considering economic, technical, and social factors, this ideal deployment plan is achieved. By meeting the technical requirements for PFT vibration analysis applications, it enables a reduction in sensor equipment expenses while guaranteeing the safety of field workers and the feasibility of sensor deployment. Subsequently, by deploying sensors based on this scheme, comparative analysis of the operational parameters of the transplanting machine can be conducted to explore the optimal operational parameters for the suitable operation of the transplanting machine.
3.2. Comparative Analysis of Working Conditions for Plant Transplanting Equipment Using Data-Driven Methods
To examine the most effective operational parameters of the plant transplanter, it is essential to analyze the variations in vibration properties when subjected to various working conditions. To examine the acceleration condition of the lifting manipulator for plant transplantation equipment, three-axis acceleration sensors were positioned on the beam located above the manipulator for transplantation. Figure 7 shows a fitted vibration cloud of the transplanter during horizontal sliding. During a single transplanting session, the test condition involves the horizontal slider of the transplanting manipulator moving laterally. The signal is sampled at a frequency of 2560 Hz, and the RMS value is calculated every second. The duration of the lateral movement of the horizontal slider is approximately 2 s.
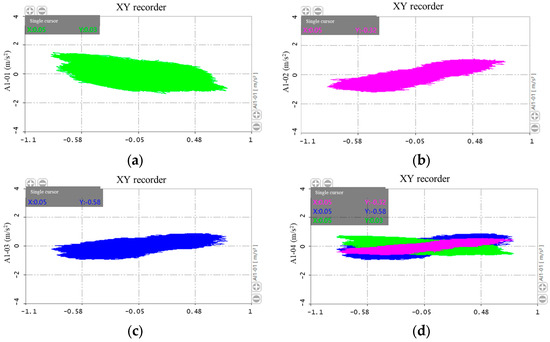
Figure 7.
Fitting cloud of transplanter vibration during horizontal sliding. (a) Vibration cloud fitting in the X-axis direction. (b) Vibration cloud fitting in the Y-axis direction. (c) Cloud fitting vibration along the Z-axis direction. (d) Comparing clouds for vibration fitting in the direction of the XYZ-axis.
According to Figure 8, the vibration amplitude above the transplanting manipulator remains below 3 m/s2. The vibration cloud in the X-axis orientation has a shape resembling a rugby ball, exhibiting a small amplitude of vibration and a uniform vibration signal in the X-axis direction. From Figure 7b,c, the fitted vibration clouds in the Y and Z directions are dumbbell-shaped. The comparison of the clouds reveals that the vibration trend is more noticeable in the Z and X axes above the transplanting manipulator compared to the Y-axis. However, these observations only consider the effect of the amplitude of the vibration and a frequency domain analysis should be carried out to obtain more information on the vibration characteristics.
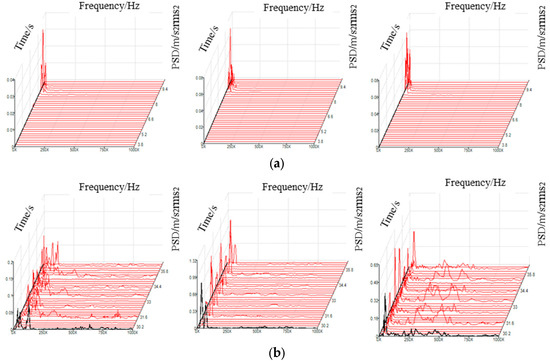
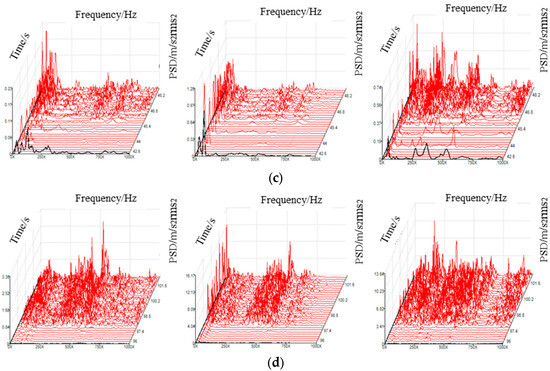
Figure 8.
Waterfall of power spectral density. (a) PSD waterfall clouds in the XYZ-axis under working condition one. (b) PSD waterfall cloud in the XYZ-axis under working condition two. (c) PSD waterfall clouds in XYZ-axis direction under working condition three. (d) PSD waterfall clouds in the XYZ-axis direction under working condition four.
3.3. Comparison of the Power Spectral Density of Modal Vibrations When Using Different Operating Conditions for Transplanting Equipment
To examine the probability distribution of vibration energy in different frequency domains and time periods, we utilize power spectral density (PSD) analysis. PSD analysis represents the distribution of the mean square value of statistical parameters in the frequency domain of the stochastic process. By analyzing the power spectral density, we can determine the average concentration of vibration energy in a vibration excitation with varying intrinsic frequencies. This information helps us prevent or enhance vibration excitation to minimize vibration damage. For solving the power spectral density, we employ spectral analysis using rectangular as the type of window, 100 spectral lines, a resolution of 10,000 Hz, and an interval of 0.2 Hz. Linear averaging is employed for this analysis. In Figure 8 below, you can observe the power spectral density waterfall in the XYZ orientation for various operational circumstances. Figure 8 displays a waterfall diagram that allows for the visualization of the average density of vibration energy present in the vibration excitation at various inherent frequencies through the analysis of the power spectrum density. Figure 8a illustrates that the initial vibration magnitude in the XYZ-axis direction is negligible when subjected to working condition one. Following the equipment’s initiation, a surge arises in the low-frequency vibration range, aligning with the findings from the prior FFT analysis. Under condition two, the Y-axis vibration amplitude experiences a substantial increase, exhibiting multiple peaks in the mid-frequency range along the Z-axis direction, as depicted in Figure 8b. The findings align with the outcomes of the prior analysis; however, the peaks display variability and could potentially be attributed to the robot’s significant impact on vibration solely during the clamping of transplants and the release of seedlings. Significant amplitude enhancement in the Z-axis direction is observed for working condition three (Figure 8c). The amplitude in the X-axis direction is higher than in the other two directions within the 0–80 Hz low-frequency range. In condition four, the power spectral density exhibits increased turbulent peaks in the X and Y directions. The highest vibration amplitude is 12.03 Hz, which means that there may be more parts resonating. Based on the analysis provided above, it is evident that conditions one and two exhibit a minimal vibration amplitude; however, the efficiency of transplantation remains low. Under condition four, the components are prone to coupling resonance, which can easily cause damage to the transplanting components. When transplanting at a moderate speed of 3000 plants per hour, it is possible to maintain a high level of efficiency and ensure that the vibration signal of the XYZ-axis above the transplanting manipulator remains gentle, making it suitable for the transplantation process.
4. Conclusions
This paper proposes a physical entity vibration monitoring method for the DT plant factory transplanting system. Firstly, a demand analysis for the physical entities of the DT plant factory transplanting system is conducted, focusing on practical applications. Then, an optimal deployment plan is designed based on the AD theory. The feasibility and effectiveness of the proposed method are validated using the digitalized system robotic arm that is tailored for vibration analysis requirements. The customized deployment plan takes into consideration the industry’s profitability, the technical feasibility of the application, the worker safety at the field site, and the reliability of plan implementation.
Next, a comparative analysis based on data was conducted to evaluate the conditions of the equipment used for transplanting plants. The Z-axis exhibited the highest magnitude, measuring 2.1 m/s2. When comparing the clouds, it is evident that the Z-axis and X-axis exhibit a more noticeable trend of vibration above the transplanting robot compared to the Y-axis. In conclusion, when comparing the modal vibration power spectral densities of the transplanting machinery in various operational situations, it is evident that the amplitude in the Z-axis direction experiences a notable rise specifically during the medium-speed transplanting of 3000 plants per hour in working condition three. The amplitude in the X-axis direction is higher than the other two directions within the 0–80 Hz low-frequency range. In such circumstances, the transplant efficiency can be upheld at a high degree while ensuring that the vibration signal in the XYZ-axis above the transplant robot remains mild and appropriate for the transplantation process.
There are certain limitations to the application of this method in agricultural production. Firstly, it is suitable for controlled agricultural production environments to ensure the stability of sensor data collection and transmission. Secondly, it is applicable to highly automated agricultural production equipment to ensure consistency between virtual entities and physical entities. Thirdly, there is a need for an adequate number of sensor nodes or the integration of image recognition algorithms to establish a virtual mapping with sufficient accuracy. At the same time, it is undeniable that this technology holds potential for promotion and application in various industrial sectors. For instance, it can find practical applications in areas such as 3D logistics management, vehicles, power plants, aircraft, complex electromechanical equipment, 3D warehouses, healthcare, manufacturing workshops, and smart cities, where there is a demand for its implementation. The application ideas and strategies proposed in this research can also serve as a reference for the implementation of digital twin concepts and technologies in related fields.
Author Contributions
Conceptualization, K.C.; data curation, L.Z.; formal analysis, K.C. and Y.Y.; funding acquisition, Y.Z. (Yongjun Zheng); investigation, Y.Y. and B.Z.; methodology, K.C., K.N. and X.J.; project administration, L.Z.; resources, K.C., Y.Z. (Yanli Zhang) and B.X.; software, K.C.; validation, K.C., B.Z., X.J. and Y.Z. (Yongjun Zheng); visualization, B.X.; writing—original draft, K.C.; writing—review and editing, Y.Z. (Yanli Zhang). All authors have read and agreed to the published version of the manuscript.
Funding
The National Key Research and Development Program of China Sub-project grant number 2021YFD2000705.
Institutional Review Board Statement
Not applicable.
Informed Consent Statement
Not applicable.
Data Availability Statement
Data are contained within the article.
Conflicts of Interest
The authors declare no conflict of interest. The funders had no role in the design of the study; in the collection, analyses, or interpretation of data; in the writing of the manuscript; or in the decision to publish the results.
References
- Zhang, L.; Yang, X.; Li, T.; Gan, R.; Wang, Z.; Peng, J.; Hu, J.; Guo, J.; Zhang, Y.; Li, Q.; et al. Plant factory technology lights up urban horticulture in the post-coronavirus world. Hortic. Res. 2022, 9, uhac018. [Google Scholar] [CrossRef] [PubMed]
- Verdouw, C.; Tekinerdogan, B.; Beulens, A.; Wolfert, S. Digital twins in smart farming. Agric. Syst. 2021, 189, 103046. [Google Scholar] [CrossRef]
- Liu, Y.; Mousavi, S.; Pang, Z.; Ni, Z.; Karlsson, M.; Gong, S. Plant Factory: A New Playground of Industrial Communication and Computing. Sensors 2022, 22, 147. [Google Scholar] [CrossRef]
- Ebrahimi, A. Challenges of developing a digital twin model of renewable energy. In Proceedings of the 28th IEEE International Symposium on Industrial Electronics (IEEE-ISIE), Vancouver, BC, Canada, 2–14 June 2019. [Google Scholar]
- Pylianidis, C.; Osinga, S.; Athanasiadis, I.N. Introducing digital twins to agriculture. Comput. Electron. Agric. 2021, 184, 105942. [Google Scholar] [CrossRef]
- Tao, F.; Zhang, M.; Cheng, J.; Qi, Q. Digital twin workshop: A new paradigm for future workshops. Comput. Integr. Manuf. Syst. 2017, 23, 1–9. [Google Scholar]
- Riveros, L.F.R.; Bernal Tristancho, V.H.B.; Sanabria, J.E.S.; Vasquez Amado, H.D.V. Digital Twins, Didactic Strategy for Teaching Industrial Automation. In Proceedings of the 15th International Conference of Technology, Learning and Teaching of Electronics (TAEE), Málaga, Spain, 29 June–1 July 2022. [Google Scholar]
- Ritto, T.G.; Rochinha, F.A. Digital twin, physics-based model, and machine learning applied to damage detection in structures. Mech. Syst. Signal Process. 2021, 155, 107614. [Google Scholar] [CrossRef]
- Luo, W.; Hu, T.; Zhu, W.; Tao, F. Digital Twin modeling method for CNC machine tool. In Proceedings of the 15th IEEE International Conference on Networking, Sensing and Control (ICNSC), Zhuhai, China, 27–29 March 2018. [Google Scholar]
- Fang, X.; Wang, H.; Liu, G.; Tian, X.; Ding, G.; Zhang, H. Industry application of digital twin: From concept to implementation. Int. J. Adv. Manuf. Technol. 2022, 121, 4289–4312. [Google Scholar] [CrossRef]
- Rong, K.; Ding, H.; Kong, X.; Huang, R.; Tang, J. Digital twin modeling for loaded contact pattern-based grinding of spiral bevel gears. Adv. Eng. Inform. 2021, 49, 101305. [Google Scholar] [CrossRef]
- Yun, J.; Liu, Y.; Liu, X. Model Construction of Multi-target Grasping Robot Based on Digital Twin. In Smart Robotics for Society, Proceeding of the 15th International Conference on Intelligent Robotics and Applications (ICIRA), Hangzhou, China, 5–7 July 2022; Liu, H., Yin, Z., Liu, L., Jiang, L., Gu, G., Wu, X., Ren, W., Eds.; ICIRA: Hangzhou, China, 2023; Volume 13456, Part II; pp. 88–97. [Google Scholar]
- Liu, S.; Bao, J.; Lu, Y.; Li, J.; Lu, S.; Sun, X. Digital twin modeling method based on biomimicry for machining aerospace components. J. Manuf. Syst. 2021, 58, 180–195. [Google Scholar] [CrossRef]
- Smarsly, K.; Dragos, K.; Kolzer, T. Sensor-integrated digital twins for wireless structural health monitoring of civil infrastructure. Bautechnik 2022, 99, 471–476. [Google Scholar] [CrossRef]
- Luo, W.; Hu, T.; Zhang, C.; Wei, Y. Digital twin for CNC machine tool: Modeling and using strategy. J. Ambient Intell. Humaniz. Comput. 2019, 10, 1129–1140. [Google Scholar] [CrossRef]
- Kapteyn, M.G.; Willcox, K.E. Design of Digital Twin Sensing Strategies Via Predictive Modeling and Interpretable Machine Learning. J. Mech. Des. 2022, 144, 4054907. [Google Scholar] [CrossRef]
- Zhou, Y.; Wu, C.; Sun, J.; Liu, F.; Li, H. Functional model construction method based on digital twin for intelligent products. Comput. Integr. Manuf. Syst. 2019, 25, 1392–1404. [Google Scholar] [CrossRef]
- Liu, L.-Y.; Du, H.-X.; Wang, H.-F.; Liu, T.-Y. Construction and application of digital twin system for production process in workshop [Construction and application of digital twin system for production process in workshop. Comput. Integr. Manuf. Syst. 2019, 25, 1536–1545. [Google Scholar] [CrossRef]
- Zhang, Q. Research on Digital Twin Stamping Production Line Modeling Method Based on Physical Data. Master’s Thesis, Wuhan University of Technology, Wuhan, China, 2018. Available online: https://d.wanfangdata.com.cn/thesis/ChJUaGVzaXNOZXdTMjAyMzAxMTISCUQwMTY4MjY4MhoIYmN1MmR4a3o%3D (accessed on 18 January 2018).
- Huang, J.-S.; Shi, J.-H.; Yi, Y.; Xu, H.-X.; Yan, Y.-H.; Liu, J.-F.; Liu, X.-J. Digital twin synchronization method and system implementation for micro-assembly. Comput. Integr. Manuf. Syst. 2021, 27, 412–422. [Google Scholar] [CrossRef]
- Ren, J.; Zhou, T.; Rong, Y.; Ma, Y.; Ahmad, R. Feature-based modeling for industrial processes in the context of digital twins: A case study of HVOF process. Adv. Eng. Inform. 2022, 51, 101486. [Google Scholar] [CrossRef]
- Zhang, C.; Zhou, G.; He, J.; Li, Z.; Cheng, W. A data- and knowledge-driven framework for digital twin manufacturing cell. Procedia CIRP 2019, 83, 345–350. [Google Scholar] [CrossRef]
- Shabani, A.; Skamantzari, M.; Tapinaki, S.; Georgopoulos, A.; Plevris, V.; Kioumarsi, M. 3D simulation models for developing digital twins of heritage structures: Challenges and strategies. Procedia Struct. Integr. 2022, 37, 314–320. [Google Scholar] [CrossRef]
- Zhang, C.; Xu, W.; Liu, J.; Liu, Z.; Zhou, Z.; Truong, P.D. A Reconfigurable Modeling Approach for Digital Twin-based Manufacturing System. Procedia CIRP 2019, 83, 118–125. [Google Scholar] [CrossRef]
- Li, W.; Zhu, D.; Wang, Q.; Zeng, S. Research review on crop digital twin system for monitoring growth status and environmental response. J. Agric. Sci. Technol. 2022, 24, 90–105. [Google Scholar] [CrossRef]
- Greis, N.P.; Nogueira, M.L.; Rohde, W. Towards Learning-Enabled Digital Twin with Augmented Reality for Resilient Production Scheduling. In Proceedings of the 10th IFAC Triennial Conference on Manufacturing Modelling, Management and Control (MIM), Nantes, France, 22–24 June 2022; Volume 55, pp. 1912–1917. [Google Scholar]
- Moser, A.; Appl, C.; Bruening, S.; Hass, V.C. Mechanistic Mathematical Models as a Basis for Digital Twins. In Digital Twins; Herwig, C., Portner, R., Moller, J., Eds.; Springer: Berlin/Heidelberg, Germany, 2021; Volume 176, pp. 133–180. [Google Scholar] [CrossRef]
- Tao, F.; Cheng, J.; Qi, Q.; Zhang, M.; Zhang, H.; Sui, F. Digital twin-driven product design, manufacturing and service with big data. Int. J. Adv. Manuf. Technol. 2018, 94, 3563–3576. [Google Scholar] [CrossRef]
- Liu, Z.; Chen, W.; Zhang, C.; Yang, C.; Chu, H. Data Super-Network Fault Prediction Model and Maintenance Strategy for Mechanical Product Based on Digital Twin. IEEE Access 2019, 7, 177284–177296. [Google Scholar] [CrossRef]
- Zhou, S.; Guo, S.; Baigang, D.; Guo, J.; Li, Y.; Wang, L.; Zha, D.; Zhang, F.; Yu, L. Key technologies and application of integrated operation and maintenance platform for digital twin water treatment plant. Manuf. Syst. 2021, 27, 432–444. [Google Scholar]
- Taylor, C.; Pretzner, B.; Zahel, T.; Herwig, C. Architectural and Technological Improvements to Integrated Bioprocess Models towards Real-Time Applications. Bioengineering 2022, 9, 534. [Google Scholar] [CrossRef] [PubMed]
Disclaimer/Publisher’s Note: The statements, opinions and data contained in all publications are solely those of the individual author(s) and contributor(s) and not of MDPI and/or the editor(s). MDPI and/or the editor(s) disclaim responsibility for any injury to people or property resulting from any ideas, methods, instructions or products referred to in the content. |
© 2023 by the authors. Licensee MDPI, Basel, Switzerland. This article is an open access article distributed under the terms and conditions of the Creative Commons Attribution (CC BY) license (https://creativecommons.org/licenses/by/4.0/).