Article

Advancing Financial Forecasts: A Deep Dive into Memory Attention and Long-Distance Loss in Stock Price Predictions

1
China Agricultural University, Beijing 100083, China
2
School of Business and Management, Jilin University, Jilin 130015, China
3
School of Government, Nanjing University, Nanjing 210008, China
*
Author to whom correspondence should be addressed.
These authors contributed equally to this work.
Appl. Sci. 2023, 13(22), 12160; https://doi.org/10.3390/app132212160
Submission received: 9 October 2023 / Revised: 3 November 2023 / Accepted: 3 November 2023 / Published: 9 November 2023

Abstract

:
In the context of the rapid evolution of financial markets, the precise prediction of stock prices has become increasingly complex and challenging, influenced by a myriad of factors including macroeconomic indicators, company financial conditions, and market sentiment. A model integrating modern machine learning techniques has been introduced in this study, aimed at enhancing the accuracy of stock price prediction. To more effectively capture long-term dependencies in time series data, a novel memory attention module has been innovatively integrated and a unique long-distance loss function has been designed. Through a series of experimental validations, the effectiveness and superiority of this model in the realm of stock price prediction have been demonstrated, especially evident in the R 2 evaluation metric, where an impressive score of 0.97 has been achieved. Furthermore, the purpose, methodology, data sources, and key results of this research have been elaborately detailed, aiming to provide fresh perspectives and tools for the field of stock price prediction and lay a solid foundation for future related studies. Overall, this research has not only enhanced the accuracy of stock price prediction but also made innovative contributions in terms of methodology and practical applications, bringing new thoughts and possibilities to the domain of financial analysis and prediction.

1. Introduction

In global financial markets, the prediction of stock prices has been consistently at the forefront of research and commercial applications. Stock prices are influenced by a myriad of intricate factors, including macroeconomic indicators, corporate financial reports, political events, and market sentiment. An accurate and timely prediction of stock prices holds significant importance for investors, fund managers, and financial institutions, as it aids in formulating investment strategies, risk management, and maximizing investment returns.
Due to the uncertainty and complexity of stock markets, conventional prediction methods, such as time series analysis and linear regression, might fall short in providing highly accurate forecasts in certain scenarios. For instance, it was found by Liu et al. [1] that the Fuzzy Time Series (FTS) prediction method, which relies solely on historical features, fails to accurately forecast stock prices owing to the influence of public opinion and supply chains. To address this, a feature extraction method based on the industry chain network FTS was proposed for the time series prediction of multiple stocks. The outcomes indicated an effective enhancement in accuracy using this method. Behera, Jyotirmayee et al. [2] conducted a comparison using Random Forest, XGBoost, AdaBoost, Support Vector Regression (SVR), K Nearest Neighbor (KNN), and other machine learning algorithms, revealing that the performance of conventional predictive methods for stock regression was subpar.
With the advancement of big data and machine learning technologies in recent years [3,4,5,6], an increasing number of researchers have embarked on exploiting these sophisticated technologies for analyzing and forecasting the stock market [7,8,9,10]. For instance, a deep transfer learning model with attention mechanism, called IDTLA, was introduced by He et al. [11] to address the challenge deep learning models face when predicting companies newly launched in the stock market. The superiority of their model was demonstrated on three datasets. A hybrid deep learning model named CEEMDAN-DAE-LSTM was proposed by Lv et al. [12], which leveraged the LSTM network to predict the stock returns of the next trading day. While the model showcased better performance for noisy stock predictions, it was based on a rather singular dataset with limited feature diversity.
Deep learning, particularly the application of the Transformer [13,14,15,16] structure and attention mechanisms, has showcased performance surpassing traditional techniques across various tasks. In the financial domain, Wang et al. [17] harnessed the Transformer for predicting stock market indices, outperforming other conventional deep learning models. Zeng et al. [18] combined CNN with Transformer to establish a time series model (CTTS) capturing both short-term patterns and long-term dependencies. Xu et al. [19] introduced a novel Transformer model for financial time series prediction, simplifying the Transformer and integrating the attention mechanism.
Nevertheless, the financial sector poses its unique challenges, distinct from other domains. Financial data are typically characterized by high noise levels, non-linearity, and non-stationarity. In this study, a high-precision stock price prediction method based on the Transformer is presented. The self-attention mechanism of the Transformer is utilized to capture long-distance dependencies in stock data. Moreover, a novel memory attention module has been incorporated to enhance the model’s memory capacity, facilitating better handling of intricate patterns in financial data. A new loss function, termed the long-distance loss, has also been designed to further enhance the predictive precision of the model. This study aims to offer a novel, more accurate, and reliable tool for stock price prediction.

2. Literature Review

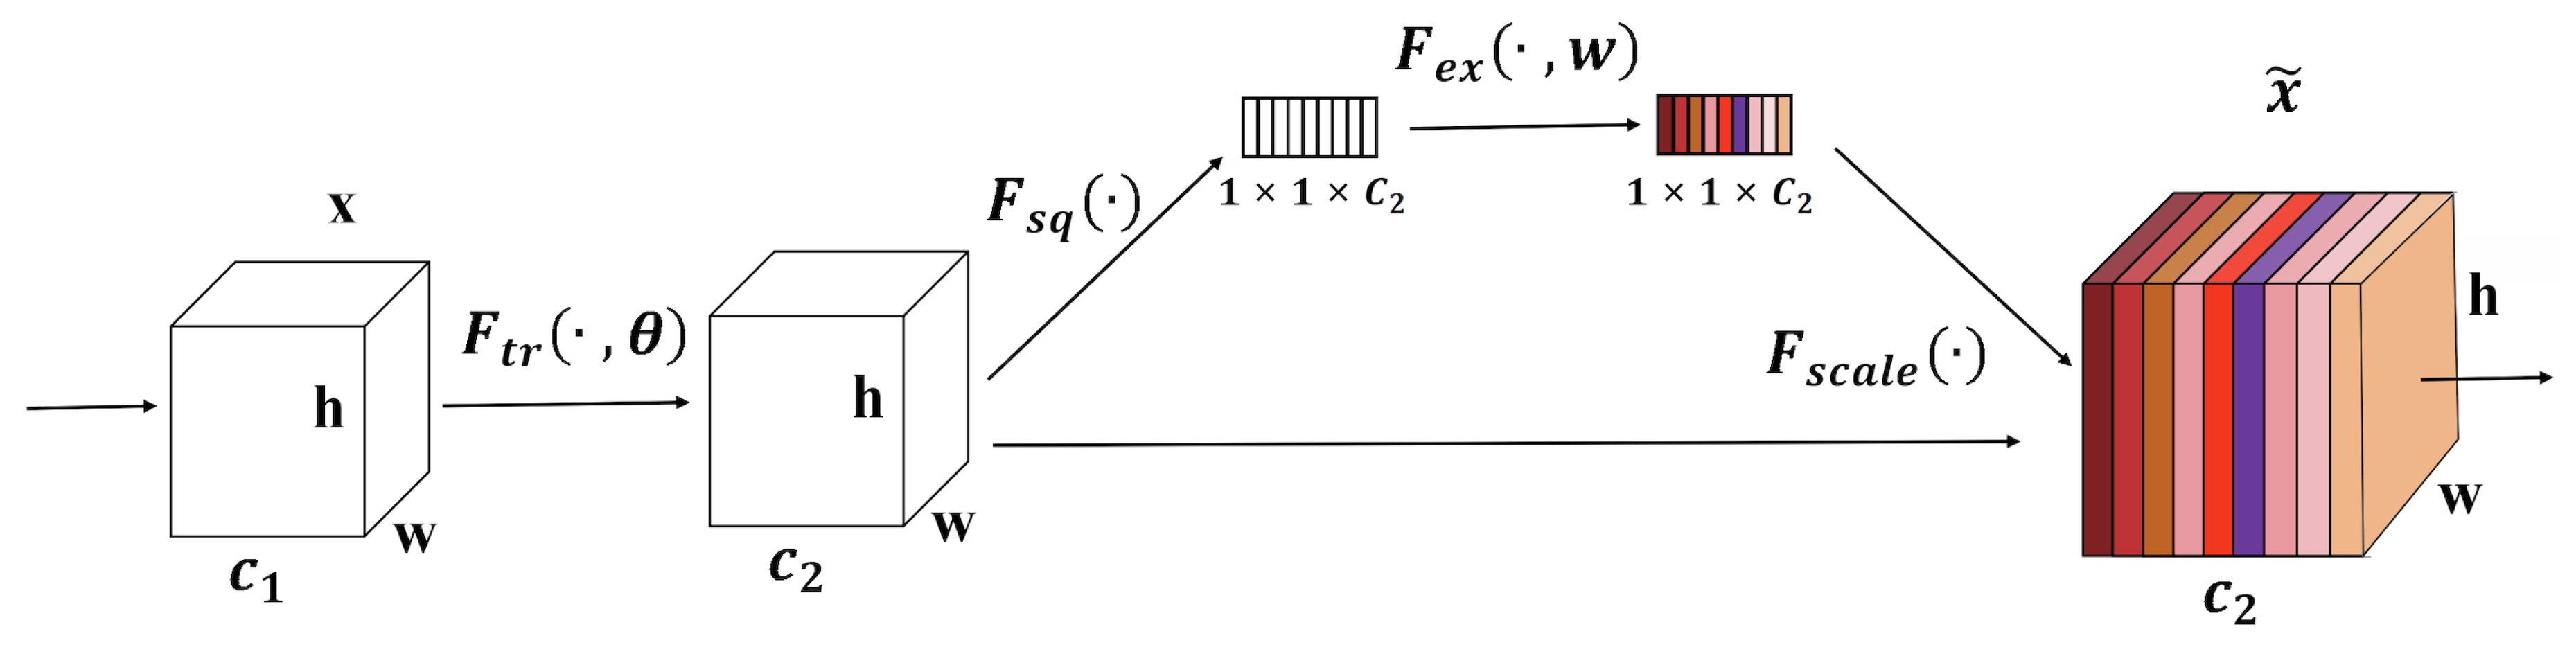
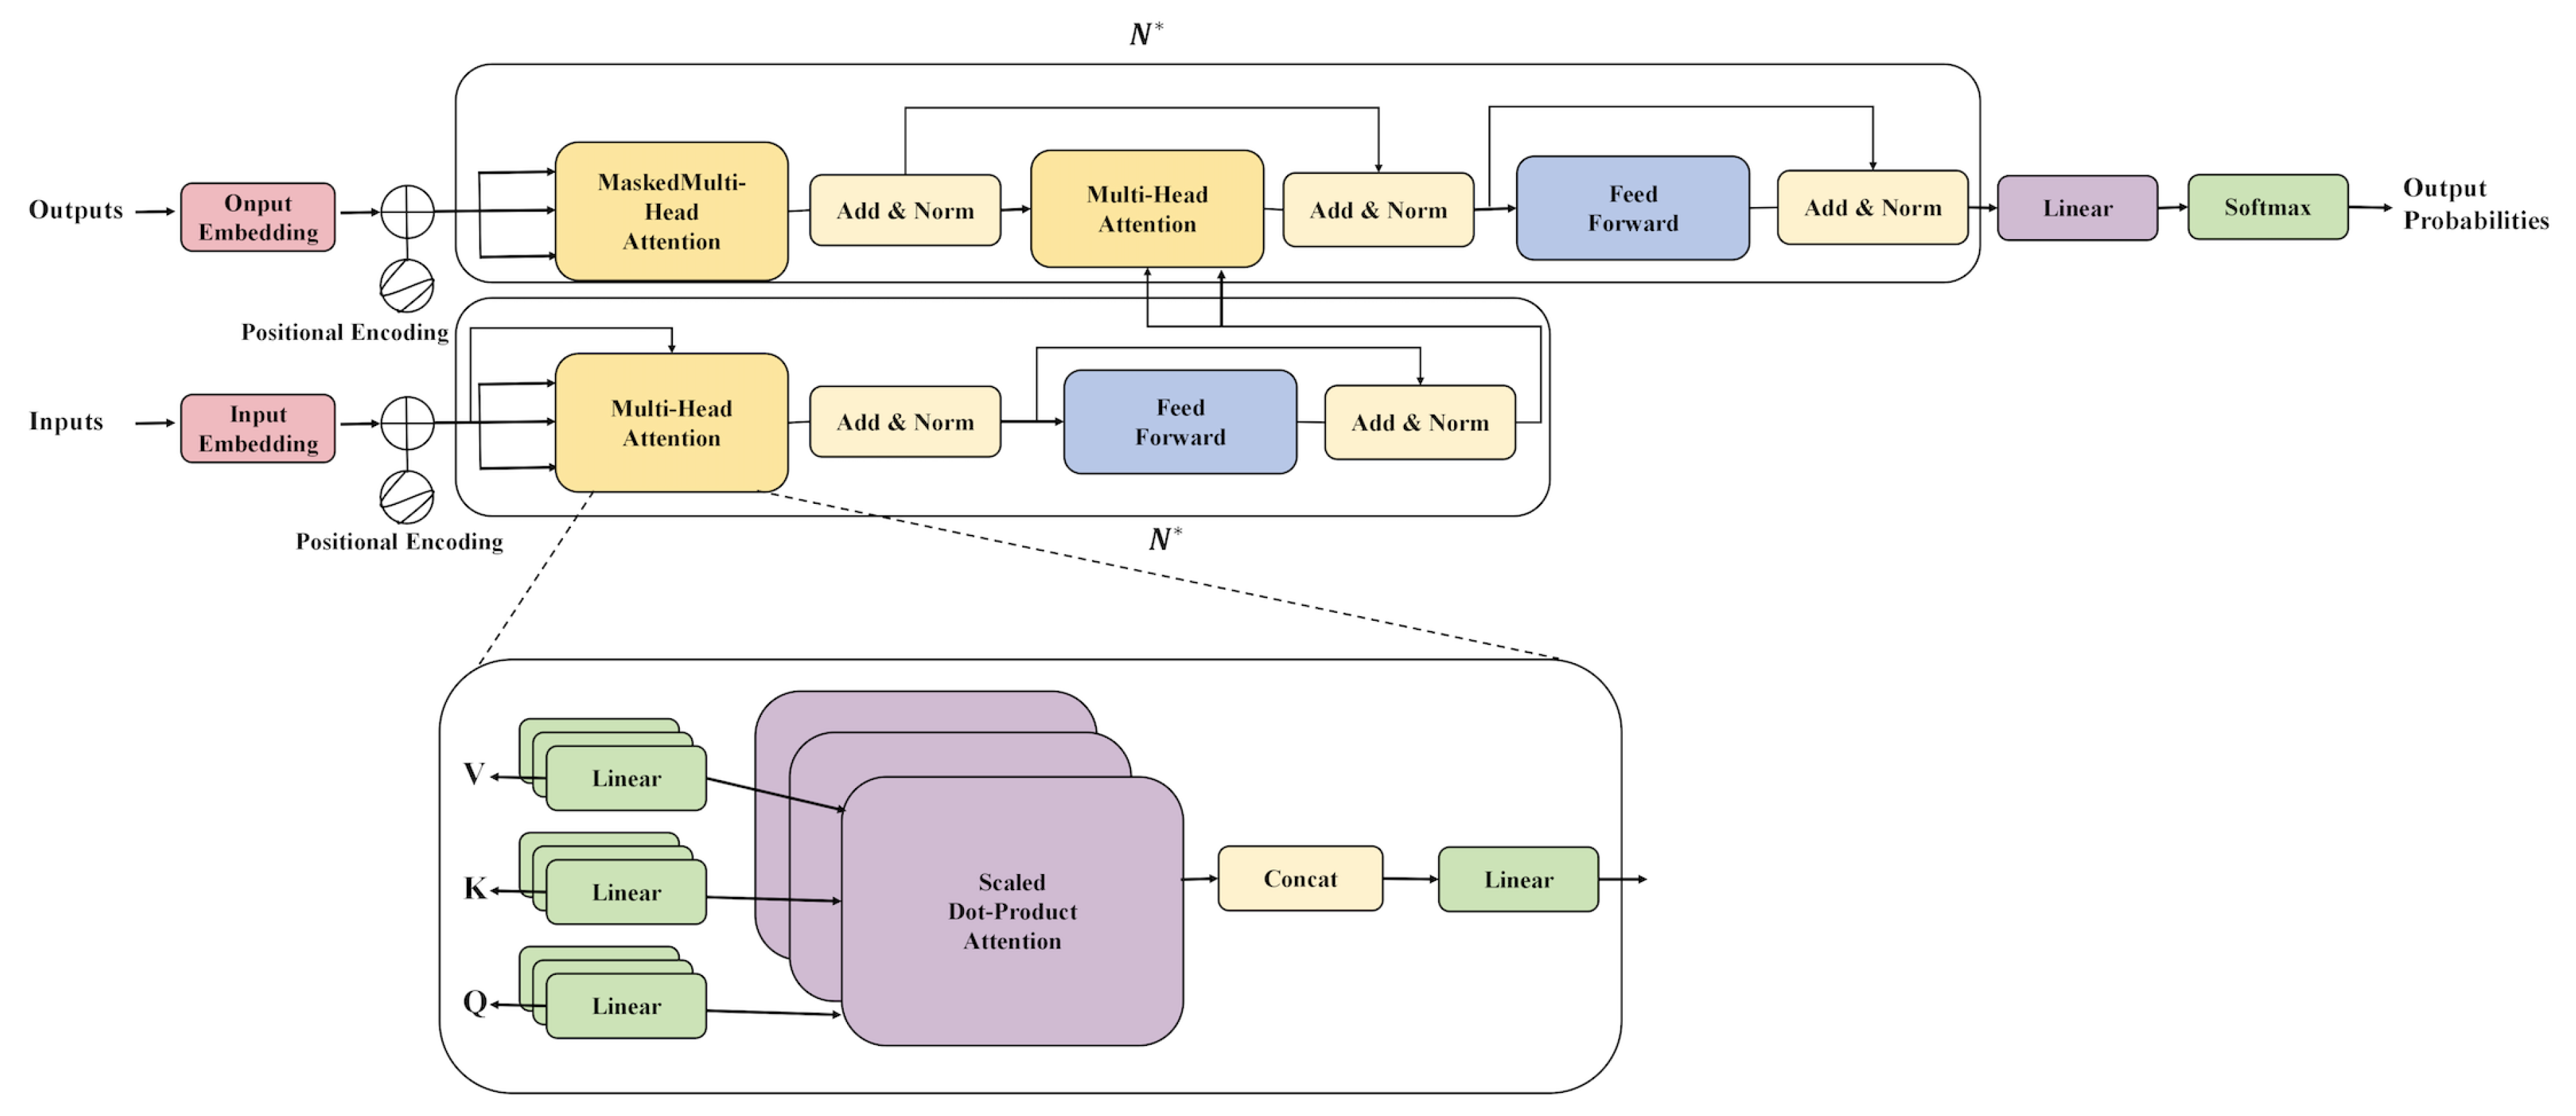
2.1. Attention Mechanism

The attention mechanism has emerged as a significant technique in the domain of deep learning in recent years [13,20,21]. Its primary objective is to allocate different attention weights to various portions of the input data, enabling models to focus more on information that is vital for specific tasks. The crux of the attention mechanism lies in computing a weight distribution, subsequently utilizing this distribution to conduct a weighted summation of the input data, culminating in a weighted representation. This representation captures pivotal information in the input data pertinent to the current task.
Within the realm of computer vision, a quintessential application of the attention mechanism is the Squeeze-and-Excitation Network (SENet) [20], as shown in Figure 1.
The SENet attains a global feature descriptor by globally pooling the feature map. Following this, a transformation is conducted via two fully connected layers, resulting in a weight distribution. This distribution is employed to modify the significance of each channel in the original feature map. Specifically, for a feature map X R H × W × C , the SENet first calculates a channel descriptor:
z = GlobalPooling ( X )
Subsequently, a weight distribution is derived through two fully connected layers:
α = σ ( W 2 ReLU ( W 1 z ) )
Here, σ represents the sigmoid activation function, and W 1 and W 2 are the weights of the fully connected layers. Lastly, the original feature map is weighted using the weight distribution α :
X = α X
In this context, ⊙ signifies element-wise multiplication.
In tasks related to natural language processing, the attention mechanism was initially employed for sequence-to-sequence models in machine translation [13], as shown in Figure 2. In such models, the encoder first encodes the source language sentence into a fixed-length vector. The decoder then exploits this vector to generate the sentence in the target language. The attention mechanism facilitates the decoder in focusing on diverse portions of the source sentence during the generation of each word. Specifically, given the encoder’s output H R L × d , where L denotes the length of the source sentence and d is the feature dimension, the attention weight α t for the hidden state s t of the decoder at time t is computed as:
e t = tan h ( W h H T + W s s t )
α t = softmax ( e t )
Following this, the encoder’s output is weightedly summed using the attention weight α t , resulting in a context vector c t :
c t = α t · H
This context vector c t is then used in tandem with the decoder’s hidden state s t for output generation.
For time series prediction tasks, such as stock price prediction, as discussed in this work, the attention mechanism aids the model in emphasizing historical data that are most pertinent to the current prediction timestamp. Specifically, given the features of the past n timestamps X R n × d , for the current hidden state s, an attention weight distribution can be computed as:
e = tan h ( W x X T + W s s )
α = softmax ( e )
Subsequently, the past features are weightedly summed using the attention weight α , deriving a context vector:
c = α · X
This context vector c encapsulates information from past data most correlated with the current prediction timestamp, thus bolstering the model’s predictive accuracy.
In summation, regardless of the task being related to computer vision, natural language processing, or time series prediction, the attention mechanism equips models with a potent means to emphasize information that is highly relevant to the current task, thereby enhancing model performance.

2.2. Transformer-Based Method Application in Stock Price Prediction

The Transformer architecture, due to its remarkable performance in the domain of natural language processing, has garnered widespread acclaim [13,14]. In recent years, it has been incrementally applied to time series predictions, especially in financial contexts such as stock price forecasting [22]. In this section, the principles of time series prediction methods based on the Transformer will be elucidated, followed by a discussion of its application and advantages in the context of stock price prediction. Central to the Transformer is the self-attention mechanism, which allows the model to consider all positions in the input sequence when generating outputs, thus capturing long-range dependencies. For time series tasks such as stock price prediction, the ability to process these long-distance dependencies is pivotal, given that market shifts may be influenced by events from a distant past, as shown in Figure 3.
Assuming there is a time series of stock price data X = ( x 1 , x 2 , , x t ) , where x i denotes the stock features on the i t h day, the aim is to predict the stock price on day t + 1 . Within the Transformer, the self-attention mechanism initially computes a query vector q i , a key vector k i , and a value vector v i for every position in this sequence:
q i = W q x i
k i = W k x i
v i = W v x i
Here, W q , W k , and W v are weight matrices to be learned. Subsequently, for the query vector q i at each position, dot products are performed with all key vectors k j , which are then converted to weights via the softmax function:
α i j = softmax q i · k j T d k
In this equation, d k represents the dimension of the key vector. These weights, α i j , dictate the attention allocated to the j t h day input when generating the output for the i t h day. Through these weights, a context vector c i , which is a weighted representation of the entire input sequence, is derived:
c i = j α i j v j
This context vector c i provides a weighted representation concerning the entire input sequence, which is subsequently used for the prediction of the stock price on day t + 1 . In stock price prediction applications, the self-attention structure of the Transformer offers several principal advantages. Primarily, it captures the long-distance dependencies inherent in stock price data, a feat challenging for traditional architectures such as RNNs or LSTMs. Additionally, unlike RNNs, which process sequentially, the Transformer can handle the entire sequence in parallel, vastly enhancing computational efficiency. Moreover, the multi-head attention mechanism permits the model to discern patterns in the data from multiple perspectives, thereby bolstering its representational power. In conclusion, Transformer-based time series prediction methods present a potent and efficient tool for stock price forecasting. Through the self-attention mechanism, it adeptly captures intricate patterns and long-distance relationships within stock price data, culminating in more accurate predictions.

3. Data and Method

3.1. Data

This section elaborates on the methods employed for the collection and preprocessing of the S&P 500 tech stocks data over the past 30 years, along with the mathematical principles involved and the significance of preprocessing.

3.1.1. Data Retrieval

The stock data of the S&P 500 tech stocks primarily originate from multiple publicly accessible financial data websites and application programming interfaces [23], such as Yahoo Finance and Google Finance. Owing to the comprehensive and continuously updated stock trading data these platforms provide, they were chosen as the primary sources for data extraction. Utilizing Python web scraping libraries such as ‘requests’ and ‘BeautifulSoup’, the required stock data can be periodically retrieved from these websites.
Initially, hypertext transfer protocol requests are dispatched to the target websites using the ‘requests’ library, obtaining the page content. Subsequently, the retrieved hyperText markup language content is parsed using the ‘BeautifulSoup’ library to extract relevant stock trading data, including opening price, closing price, highest price, lowest price, and trading volume. Following this method, stock data for the S&P 500 tech stocks spanning nearly 30 years were consistently gathered.

3.1.2. Data Preprocessing

Preprocessing is a crucial step in machine learning and deep learning projects. In the context of stock data, raw data might exhibit missing values, noise, or other inconsistencies due to various factors. Consequently, preprocessing proves to be vital for the stock price prediction task. Addressing missing values ensures data integrity and continuity, offering the model a more stable input. Furthermore, data normalization and smoothing can eliminate noise and short-term fluctuations in the data, allowing the model to more effectively capture long-term trends. Additionally, normalized data stabilize gradient descent during model training, accelerating model convergence.
  • Missing Value Handling: Firstly, the presence of missing values in the data is examined. In the case of stock data, some trading days might be missing due to various reasons. Multiple strategies are available for addressing these missing values, such as deleting rows with missing values, filling gaps using the average value of preceding and succeeding days, or employing time series prediction models for estimation. In this study, gaps are filled using the average value of the previous and next days since this method maintains data continuity and is relatively straightforward.
  • Data Normalization: Considering the potential for a vast range of values in stock data, with trading volumes possibly reaching several millions while prices might range from tens to hundreds, it is customary to normalize data prior to model input, compressing all data between 0 and 1. This can be achieved using Min-Max normalization, expressed mathematically as:
    x norm = x x min x max x min
    where x denotes the raw data and x min and x max represent the minimum and maximum values of the data, respectively.
  • Data Smoothing: Stock data might exhibit short-term fluctuations. To counteract these effects and better discern long-term trends, the moving average method can be employed for data smoothing. A window size, for instance, five days, is determined. Subsequently, the average stock data value within this window is computed to represent the value for the day. This method effectively smoothes the data, minimizing short-term fluctuations that might otherwise interfere with the model.

3.2. Proposed Method

A time series prediction model based on the Transformer structure was designed in this study, and two core innovations were introduced: the integration of the memory Attention mechanism to enhance the model’s ability to recall trends within a specific interval and the implementation of the long-distance loss function to further strengthen the model’s grasp of long-term trends.
Initially, a time series prediction model was developed based on the Transformer structure. The inherent self-attention mechanism of the Transformer allows the model, when generating outputs, to consider all positions within the input sequence, thereby capturing long-distance dependencies. This provides a potent tool for time series data, especially for stock price prediction. The model’s input consists of stock features from historical periods, such as opening price, closing price, highest price, lowest price, and trading volume. In contrast, the output predicts stock prices for a future time frame. Furthermore, although the Transformer’s self-attention mechanism already possesses the capability to handle long-distance dependencies, for actual stock prediction tasks, there is a need for the model to have a more robust memory capacity for past trends. Consequently, the memory Attention mechanism was proposed. The central premise behind this mechanism is introducing a memory unit to the model, allowing it to store and recall vital past information. During the self-attention computation process, in addition to the current query, key, and value, information from the memory unit is also taken into account. This ensures that when the model determines attention weights, it considers not just the current input but also pivotal past information, thereby enhancing its recall ability for trends within a specific interval. Finally, to further strengthen the model’s grasp of long-term trends, a long-distance loss function was designed. Traditional loss functions, such as the mean squared error, primarily focus on the model’s prediction error for each time point but overlook the relationships between different time points. In contrast, the long-distance loss function recognizes this relationship, particularly concerning long-term trends. Specifically, this loss function not only takes into account the model’s prediction error for each time point but also incorporates a penalty term for trend relationships between distant time points. This ensures that the model, during the training process, places greater emphasis on long-term trends rather than just focusing on short-term prediction accuracy.
By integrating the aforementioned innovations, a comprehensive stock price prediction model was designed. At the model’s input end, historical stock feature data are incorporated, as shown in Figure 4. After processing through the Transformer structure, data are encoded into an intermediate representation. This representation captures short-term information, and due to the memory Attention mechanism and the long-distance loss function, it also seizes long-term trends. Ultimately, the model’s output end provides a prediction for stock prices over a future period. Theoretically, the memory Attention mechanism grants the model the ability to recall long-term trends, while the long-distance loss function ensures these trends are captured during training. These two innovations complement each other, allowing the model to excel in the stock price prediction task.

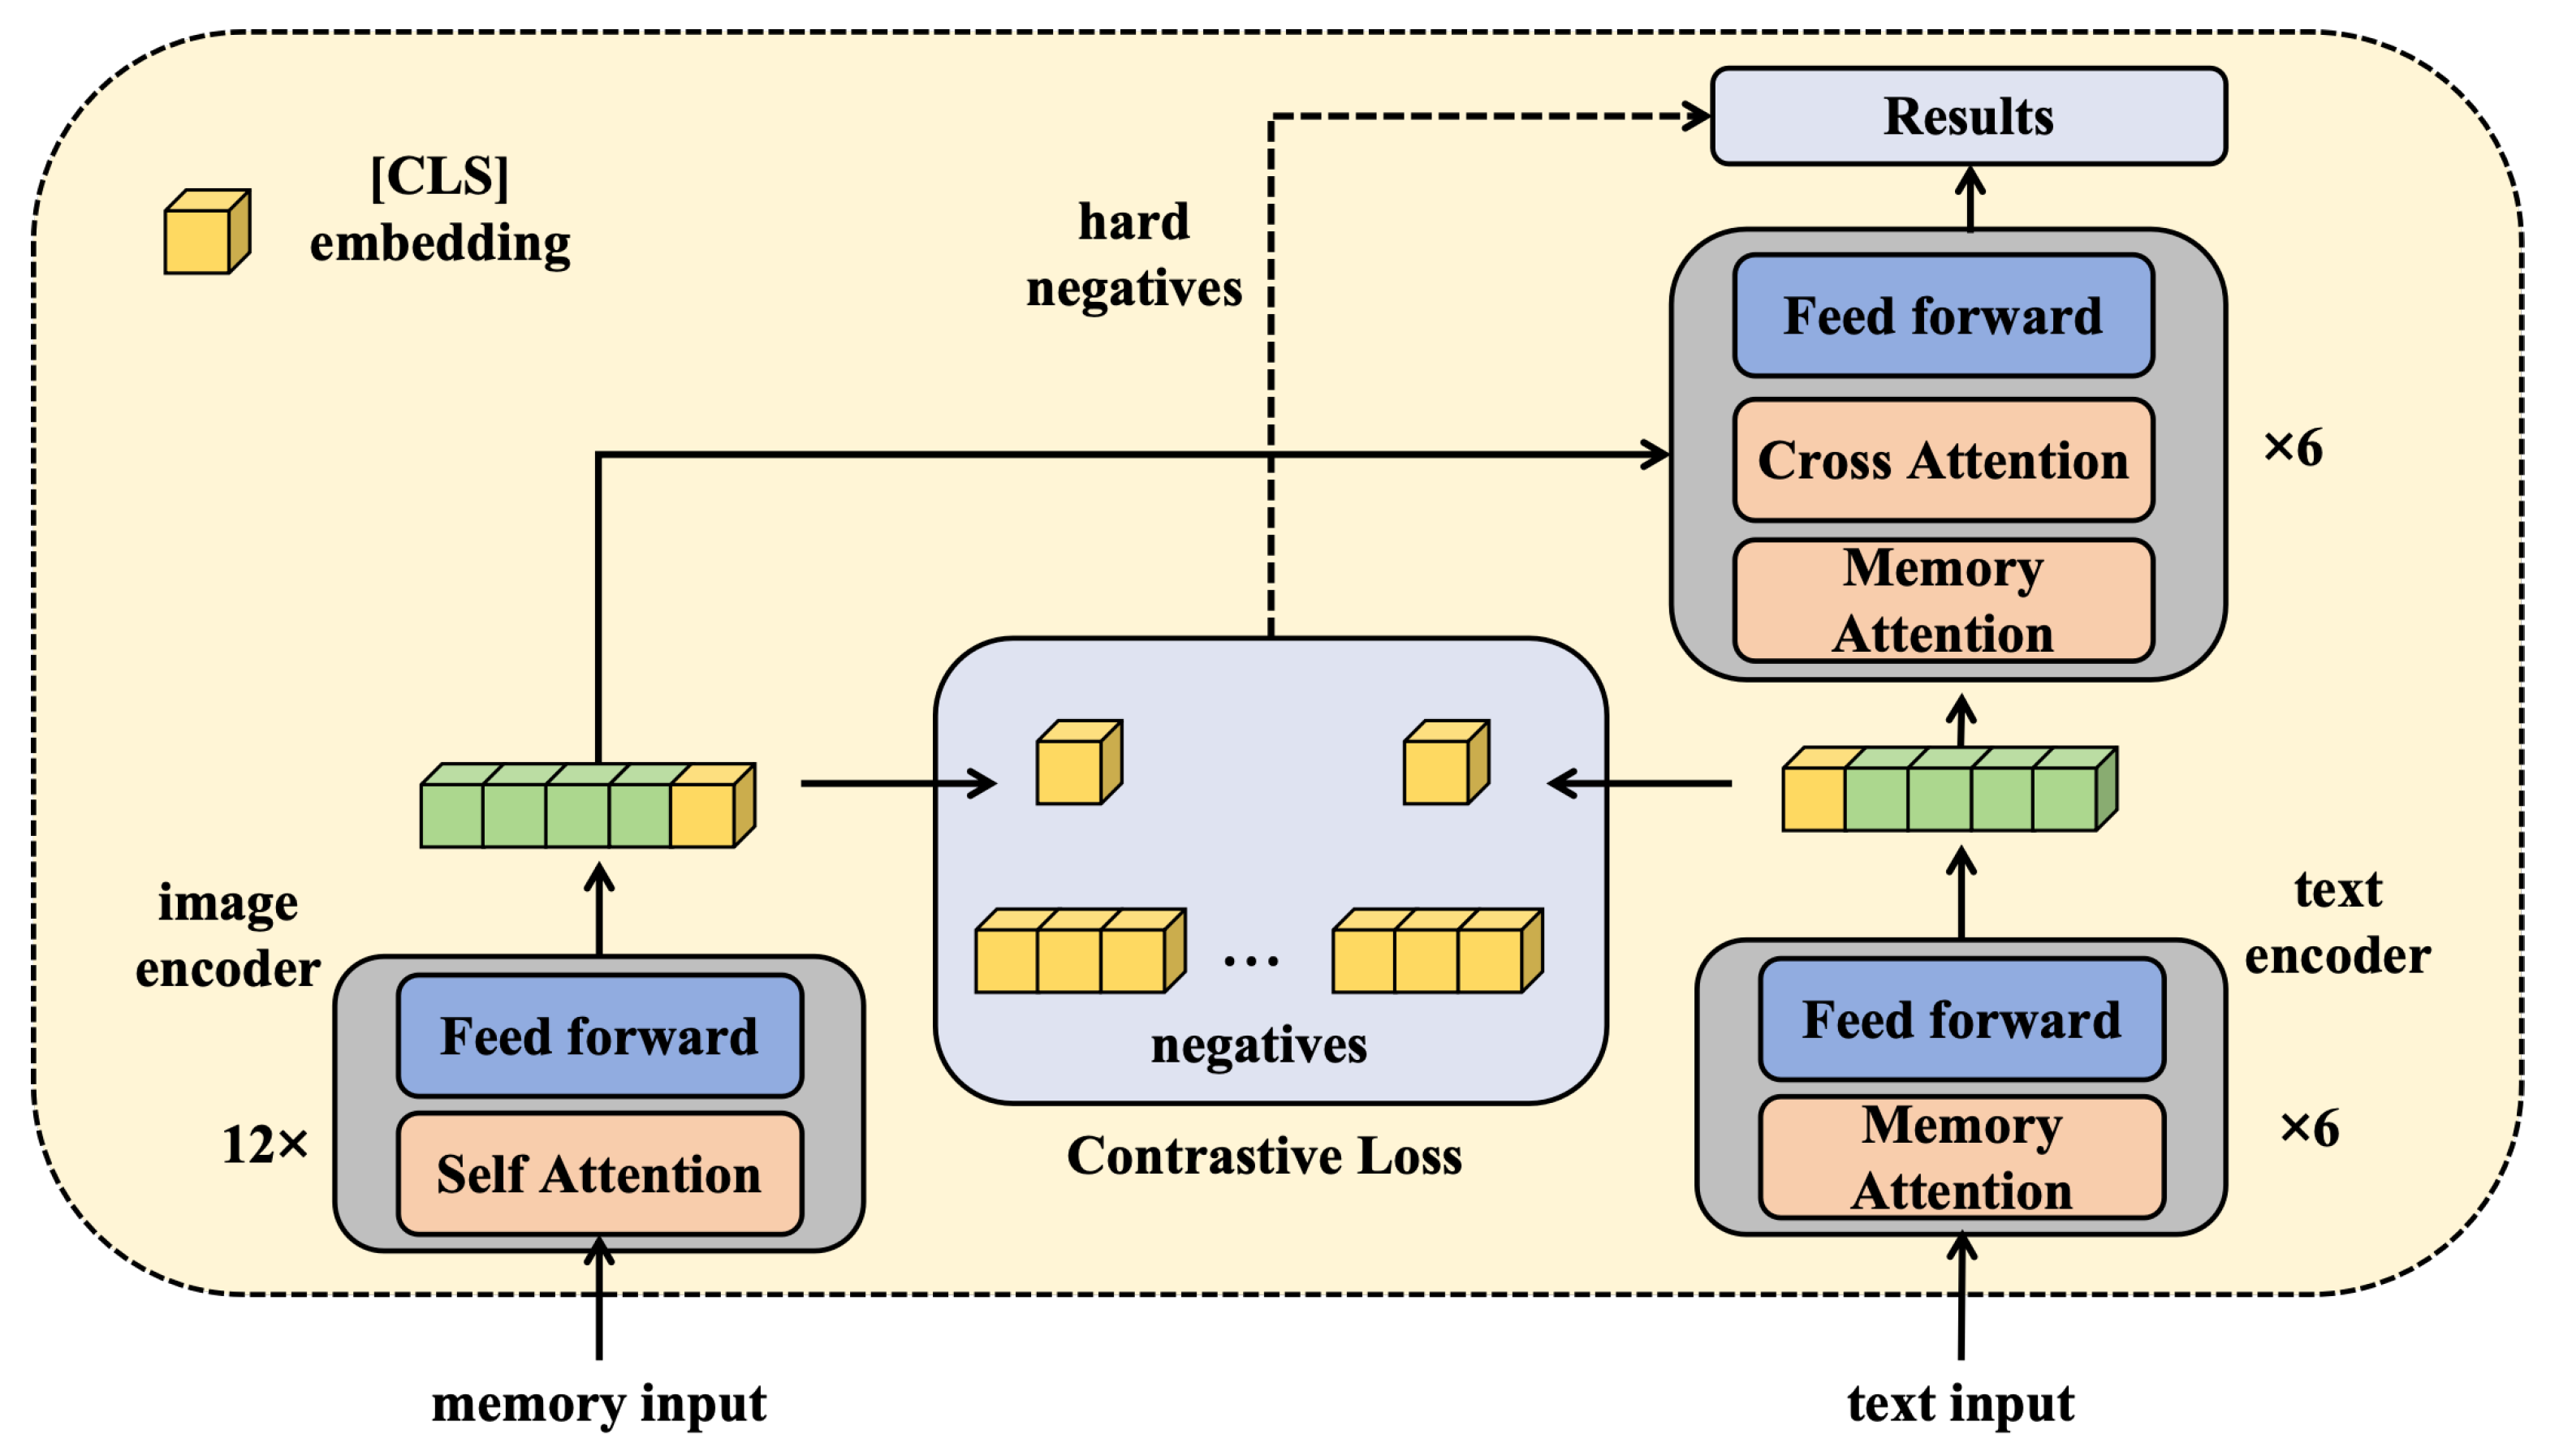
3.2.1. Memory-Transformer

With the rapid advancements in deep learning techniques, the Transformer model has demonstrated superior performance across various domains, particularly in the realm of natural language processing. However, for time series data, especially in the context of stock price prediction, relying solely on the Transformer might be insufficient. In response to this challenge, this research introduces the Memory-Transformer model. Distinct from the conventional Transformer, the pivotal innovation of the Memory-Transformer is the incorporation of a memory unit. The primary intention behind this memory unit is to facilitate the model’s capability to retain and recall historical data over extended periods. In the financial market, prolonged historical data often encapsulate invaluable insights, which are crucial for predicting future stock trends, as illustrated in Figure 5.
Mathematically, we utilize a time series of stock data X = ( x 1 , x 2 , , x t ) , where x i denotes the stock features of the i-th day. In the standard Transformer model, for every time point, a query vector q i , a key vector k i , and a value vector v i are computed. In contrast, the Memory-Transformer introduces an additional memory vector m i derived from the memory unit:
m i = f ( M , x i )
Here, M represents the entire memory unit and f is a function designed to extract memory associated with the current time point x i . When computing self-attention weights, the Memory-Transformer considers not only the query, key, and value information from the current input but also integrates the memory vector m i . Specifically, the attention weight computation is given by:
α i j = softmax q i · ( k j + m j ) T d k
Noticeably, the key vector k j is augmented here, amalgamated with the memory vector m j . This ensures that when determining attention weights, the model not only contemplates the current input but also prior pivotal information. This design is profoundly significant. In the stock market, current prices are often influenced by pivotal past events. Such events might not only pertain to recent occurrences but could date back significantly. By integrating the memory unit, the Memory-Transformer captures these long-standing historical trends, leading to more accurate predictions. Furthermore, introducing the memory unit not only amplifies the model’s long-term memory capacity but also expedites its convergence rate. The model no longer necessitates learning all historical information from scratch, instead leveraging information already retained in the memory unit.
For tasks such as stock price prediction, the Memory-Transformer exhibits distinct advantages over the standard Transformer. Primarily, it excels at capturing long-term historical trends, an aspect where conventional RNNs or LSTM structures might falter. Additionally, by processing the entire sequence in parallel, it retains the computational efficiency intrinsic to the Transformer. Lastly, in conjunction with the memory unit and long-distance loss function, it places enhanced focus on long-term trends during training, aiming for precise predictions. In summary, the Memory-Transformer, with its memory unit incorporation, not only amplifies the model’s long-term memory prowess but also upholds the Transformer’s computational efficiency and representational strengths, positioning it as an ideal choice for stock price prediction tasks.

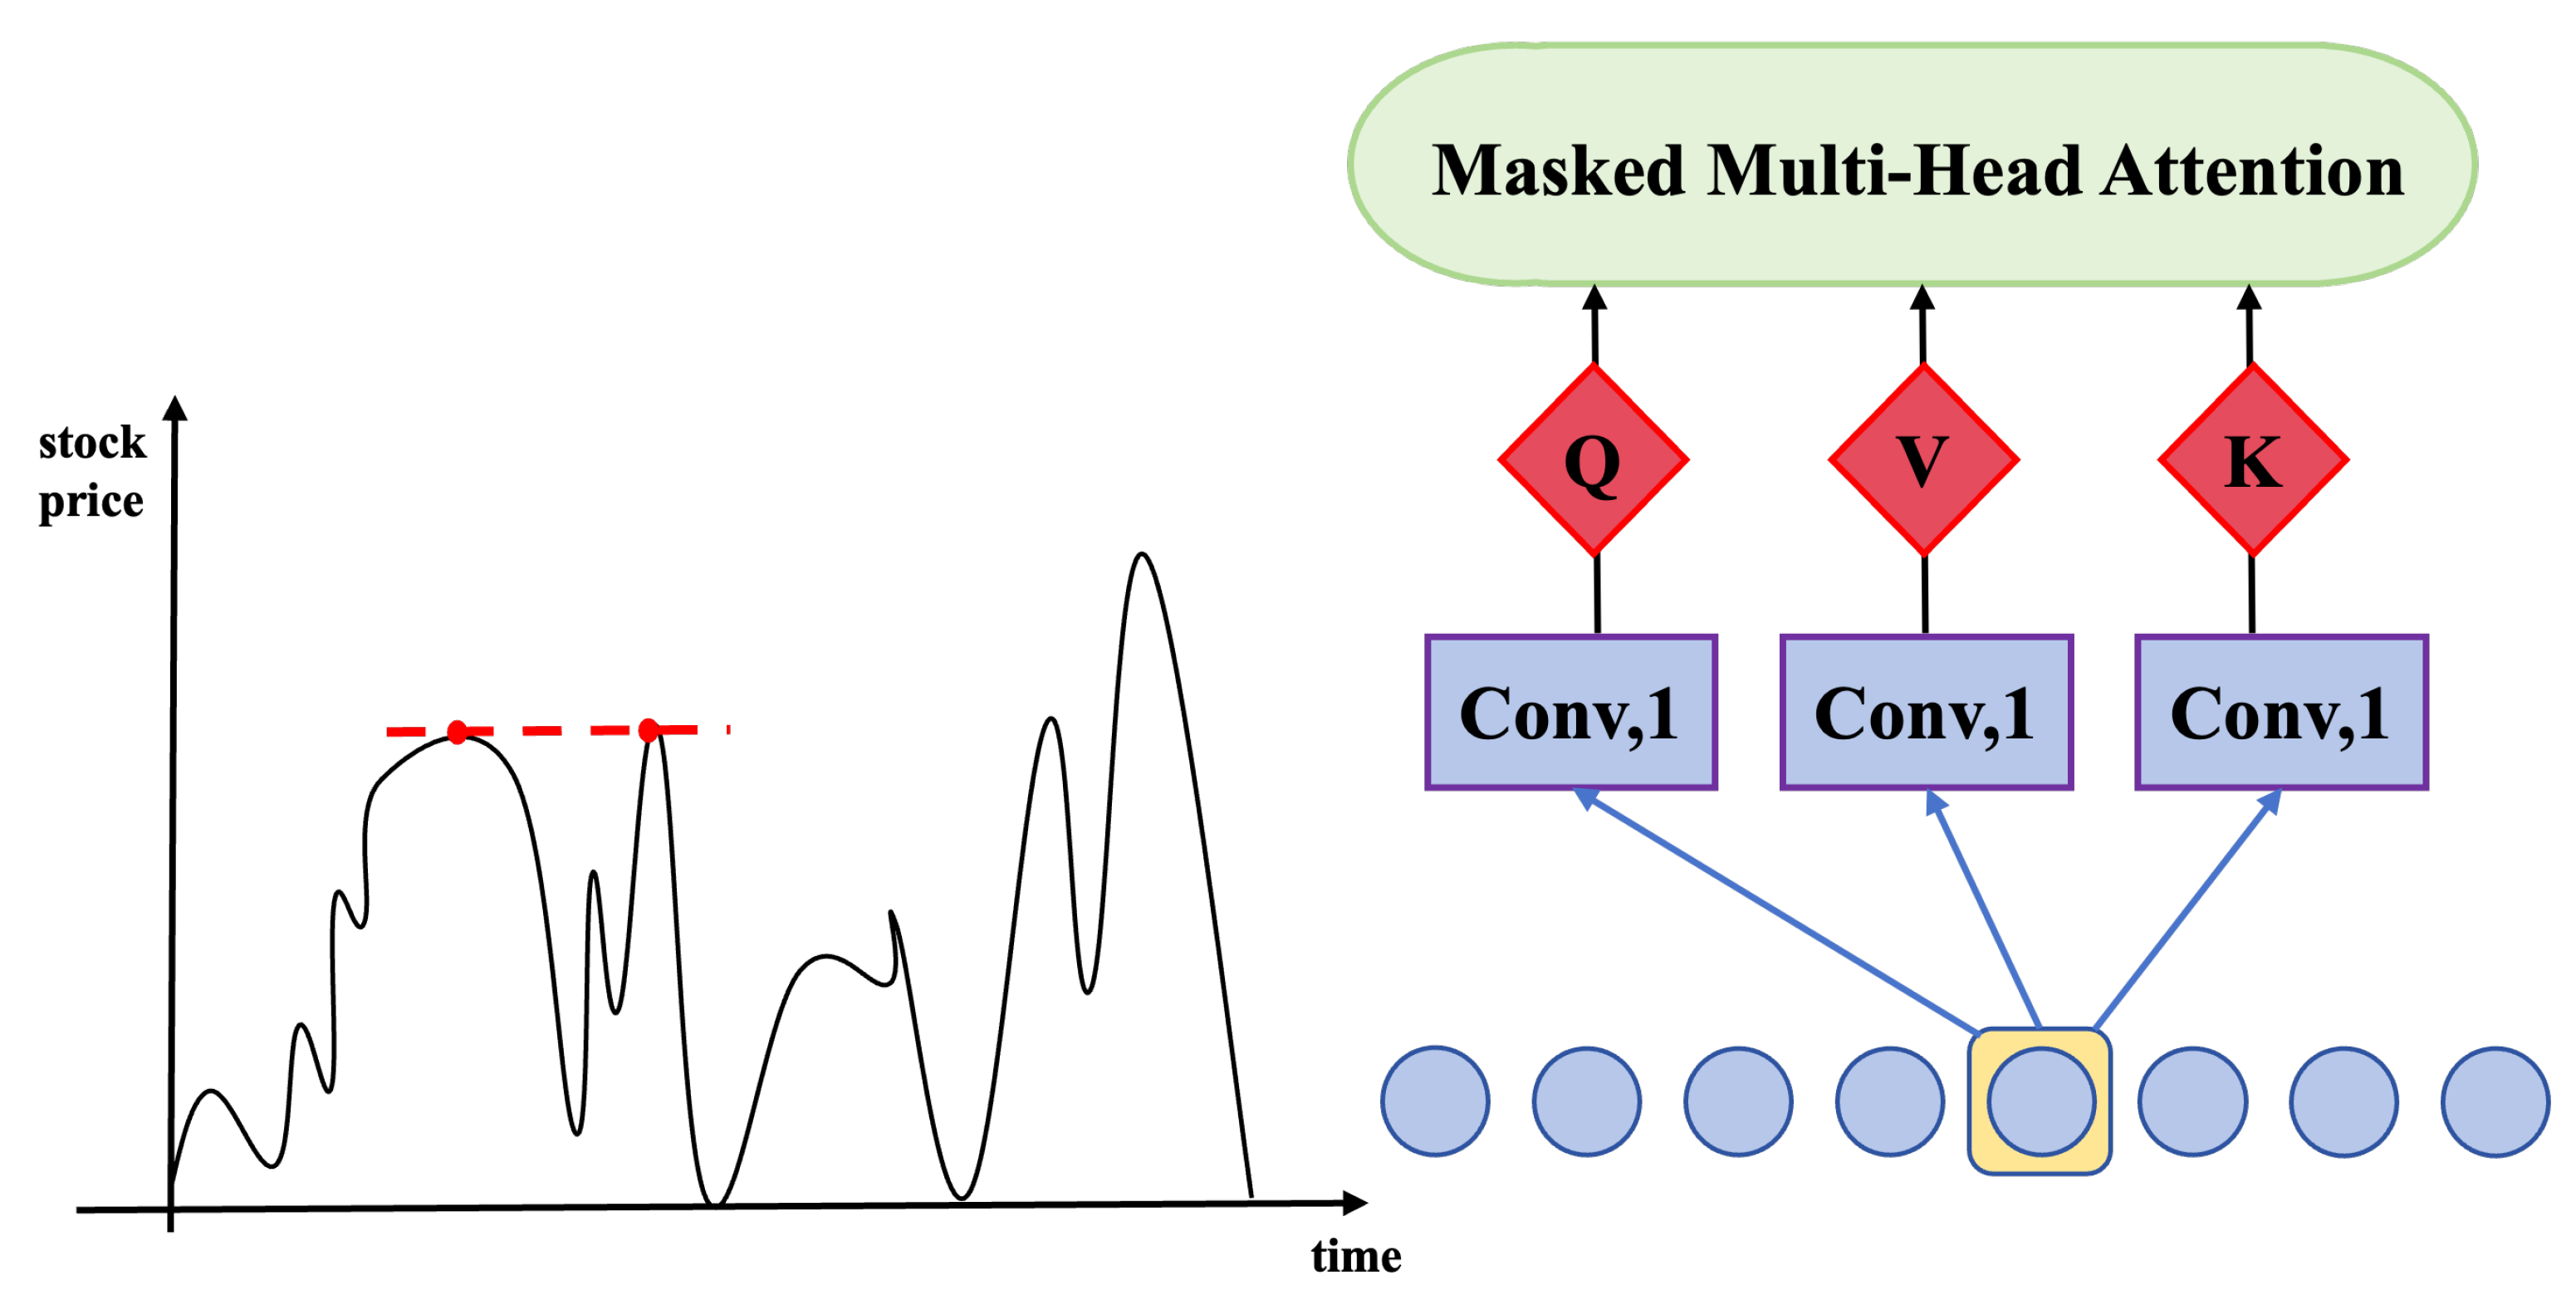
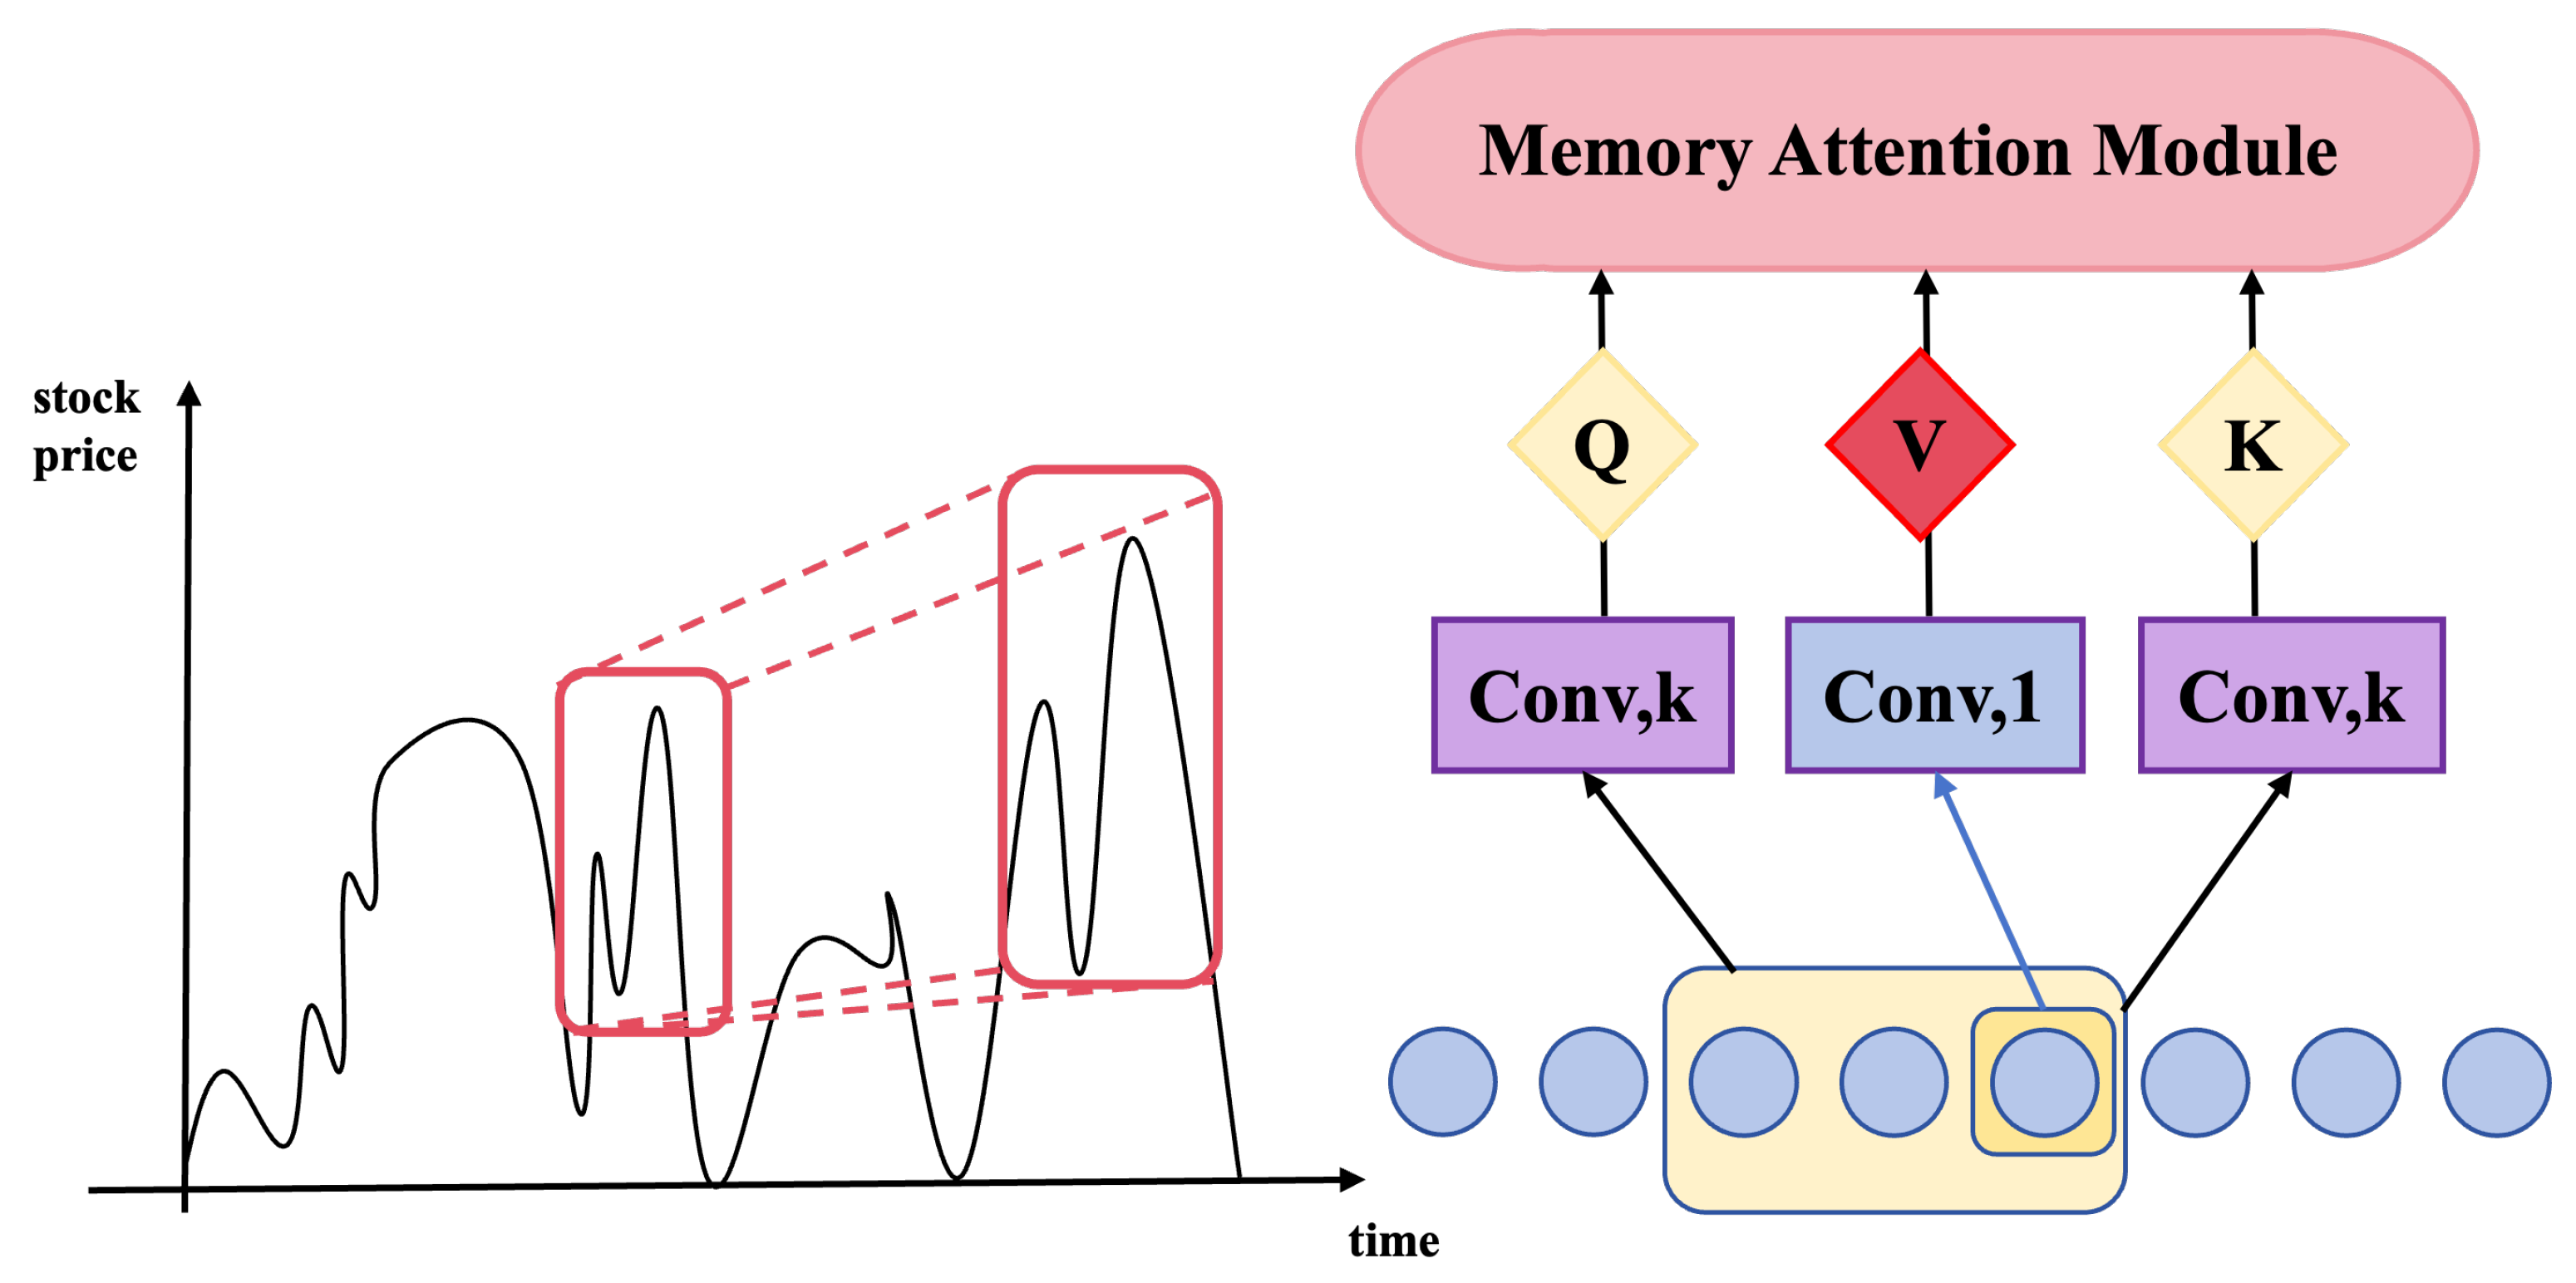
3.2.2. Memory Attention Module

The Memory Attention module stands as a pivotal component within the Memory-Transformer model. This module was innovatively conceived to facilitate the model’s capability to capture and retain long-term dependencies inherent in time series data. To achieve this end, a distinctive memory unit has been introduced. When integrated with the conventional self-attention mechanism, as shown in Figure 6, they collectively enable the capture of enduring trends.
Diving deeper into the architecture, the memory unit is conceptualized as a matrix M R d × n , where d represents the dimensionality of each memory item and n indicates the total number of memory items the unit can store. Every memory item, denoted by m i R d , corresponds to data information at a specific time point t i . At each time step, an update to the memory unit is executed. Specifically, given the current input x t and its associated hidden state h t (originating from the Transformer’s encoder), the memory unit’s update can be expressed as:
M new = Update ( M , h t , x t )
In the above, Update serves as a function tasked with selectively updating certain memory items in the memory unit based on the current input and hidden state. Such a design ensures that the model retains pivotal information beneficial for prediction while discarding inconsequential or redundant data. Moving forward, the process of leveraging this memory unit within the self-attention mechanism is elaborated. Contrasting with the traditional self-attention mechanism, the primary distinction of the Memory Attention mechanism is its consideration of the memory unit’s information when calculating attention weights. Specifically, for every query vector q i , dot-product operations are conducted not just with all key vectors k j of the current time step but also with all memory items within the memory unit. Hence, the formula for the attention weight computation is:
α i j = softmax q i · ( k j + M j ) T d k
Here, M j designates the j-th memory item within the memory unit. By adopting such an approach, the model, when determining attention weights, takes into account not only the current input information but also incorporates pivotal information from the past.
The mathematical rationale behind this design is its empowerment of the model to effectively capture long-term dependencies. As the model processes data at a specific time point, it integrates both current information and crucial details from previous instances. This integration aids the model in comprehending the contextual backdrop of the current data, leading to enhanced predictive accuracy. Moreover, from an application perspective, this design showcases significant advantages in the domain of stock price prediction. In the realm of stock markets, current prices are often influenced by critical past events, which could be scattered across an extended timeline. By introducing a memory unit, the Memory Attention module aids the model in pinpointing these dispersed pivotal events, thereby offering a more comprehensive understanding of the current market scenario and yielding more accurate predictions.

3.2.3. Long-Distance Loss

In deep learning models, the loss function plays a pivotal role, serving as an optimization target and influencing the learning process of the model. For time series prediction tasks, such as stock price forecasting, capturing long-term trends and dependencies is crucial. However, the loss function utilized in standard Transformer models, such as Mean Squared Error (MSE), predominantly focuses on the prediction error at each time point and might not adequately capture long-term trend information. To address this challenge, this study introduces a novel loss function termed “Long-Distance Loss”. This loss function not only considers the prediction error at each time point but also integrates long-term trend information, thereby effectively capturing long-term dependencies in time series data. Specifically, assuming the model’s predicted value at time point t is y ^ t and the actual value is y t , the loss based on MSE is computed as:
L MSE ( t ) = ( y ^ t y t ) 2
In the Long-Distance Loss, an error term associated with long-term trends is further incorporated. To compute this error term, a time window w is first defined. Then, for each time point t, the discrepancies between predicted and actual values from t w to t are considered to compute their cumulative error:
E t = i = t w t ( y ^ i y i )
Based on the aforementioned cumulative error E t , the loss for the long-term trend is defined as:
L LD ( t ) = λ × E t 2
Here, λ is a hyperparameter for balancing the MSE loss and long-term trend loss. Consequently, the final Long-Distance Loss is defined as:
L ( t ) = L MSE ( t ) + L LD ( t )
Such design holds profound mathematical and practical significance. Mathematically, by incorporating the long-term trend loss, the model is encouraged to focus not just on individual time point predictions but also on overall trends. This aids the model in better capturing long-term dependencies in the data, subsequently enhancing prediction accuracy. Practically, stock market prices often reflect long-term trends. For instance, a significant economic event might influence the stock market for several months or even years. Employing Long-Distance Loss allows the model to more effectively capture these long-lasting impacts, leading to more accurate predictions. Compared to the original loss function of the Transformer, Long-Distance Loss offers distinct advantages. Firstly, it amalgamates both short-term and long-term error information, presenting the model with a more comprehensive optimization objective. Secondly, by introducing the long-term trend loss, the model tends to place greater emphasis on long-term data dependencies during training, enhancing prediction accuracy. Lastly, this loss function also affords greater training stability for the model, as it reduces sensitivity to short-term noise. In summary, Long-Distance Loss, by combining short-term and long-term error information, offers the model a more comprehensive and stable optimization target, resulting in improved prediction accuracy in stock price forecasting tasks.

3.3. Experimental Settings

3.3.1. Experiment Design

To validate the effectiveness of the proposed model, a series of experiments were designed. The following provides a detailed description of the experimental design, including dataset division, baseline model selection, optimizer choice, hyperparameter settings, and ablation studies.
The division of the dataset is of paramount importance, as proper partitioning ensures the model’s generalizability and effectiveness in real-world applications. The entire dataset was divided chronologically into training, validation, and test sets. Specifically, 70% of the dataset was chosen as the training set, followed by 15% as the validation set, and the remaining 15% as the test set. This method of division ensures the model’s predictive capability in real-world scenarios and prevents potential data leakage.
In all experiments, the Adam optimizer was employed for model optimization. The Adam optimizer, merging the advantages of Adagrad and RMSprop, can adaptively adjust the learning rate and has been demonstrated to perform well in deep learning models. Hyperparameter choices were based on performance on the validation set. The learning rate was initially set to 0.001 and reduced by 10% every 5 epochs based on validation loss. The batch size was set to 32. For Transformer models, an 8-head self-attention mechanism was implemented, with the hidden layer size set to 512. To prevent overfitting, a dropout rate of 0.1 was incorporated into the model.
Ablation studies were designed to further validate the effectiveness of various components of the proposed model. Specifically, the memory attention module and long-distance loss function were removed separately to observe how these modifications impact model performance. Such experiments offer insights into the contributions of different model components to the final performance, providing guidance for future improvements. In summary, through meticulously designed experiments, this research aims to comprehensively and deeply evaluate the performance of the proposed model. These experiments reveal the model’s performance in real-world scenarios and its comparison with current mainstream techniques.

3.3.2. Testbed

For a fair assessment of the proposed model, several models of varying types were chosen as baseline models for comparison. These include the following. Random Forest [24]: an ensemble learning method that combines the outputs of multiple decision trees, offering high accuracy and robustness. Support Vector Machine (SVM) [25]: the Support Vector Machine is a powerful model widely used for classification and regression problems. Time-series Neural Network [26]: a Transformer-based time series analysis model that employs the self-attention mechanism to capture long-term dependencies. Temporal Transformer [27]: designed specifically for time series data, this Transformer model integrates traditional time series analysis techniques. Seq2Seq Transformer [28]: a model utilizing the Transformer architecture for sequence-to-sequence prediction.
These baseline models were selected for comparison because they represent the current mainstream techniques in time series prediction. Random Forest and SVM stand as classical machine learning models, while the Transformer-based models represent the latest deep learning methods. Such a selection ensures the fairness and comprehensiveness of the experimental results.

3.3.3. Experimental Methodology

In this paper, the focus is placed upon technology stocks within the S&P 500, with a chosen study period spanning from 1 January 1990 to 31 December 2020, accounting for a total of 21 years of historical data. The frequency of predictions is set on a daily basis, implying that forecasts regarding stock prices or return rates are made for each trading day. The objective of this paper is to predict the daily return rate of stocks, for which the formula is given by:
R t = P t P t 1 P t 1
Here, R t represents the daily return rate of the stock at time point t, P t denotes the closing price of the stock at time point t, and P t 1 stands for the closing price of the stock at time point t 1 (i.e., the previous trading day). By employing such a research design, precise predictions regarding the daily return rates of technology stocks can be achieved, subsequently providing investors with valuable references for making informed investment decisions.

3.3.4. Evaluation Metric

In quantifying and evaluating the prediction performance of the model, the following four common metrics are employed: Precision, Recall, Accuracy, and R 2 .
  • Precision quantifies the proportion of correctly predicted positive instances out of all instances predicted as positive. In the context of stock price prediction, a correct prediction implies that an upward price movement was anticipated and the price did indeed rise. The formula for Precision is:
    Precision = True Positives ( TP ) True Positives ( TP ) + False Positives ( FP )
    Here, True Positives (TP) represents the number of correctly predicted positive instances, while False Positives (FP) denotes the number of instances incorrectly predicted as positive.
  • Recall measures the proportion of actual positive instances that were correctly predicted as positive. Its formula is:
    Recall = True Positives ( TP ) True Positives ( TP ) + False Negatives ( FN )
    In this case, False Negatives (FN) are the instances that were incorrectly predicted as negative.
  • Accuracy offers insight into the overall proportion of instances that were correctly predicted, regardless of being positive or negative. Its formula is expressed as:
    Accuracy = True Positives ( TP ) + True Negatives ( TN ) Total Number of Samples
    Here, True Negatives (TN) are the instances correctly predicted as negative.
  • R 2 , also known as the coefficient of determination, is a statistical measure reflecting the correlation between the actual and predicted values. Its formula is:
    R 2 = 1 ( y i y ^ i ) 2 ( y i y ¯ ) 2
    where y i is the actual value, y ^ i is the predicted value, and y ¯ is the mean of the actual values.
  • In order to rectify for degrees of freedom, the adjusted R 2 was utilized, taking into consideration the number of predictive variables within the model:
    Adjusted R 2 = 1 ( 1 R 2 ) n 1 n k 1
    Herein, n denotes the quantity of observations while k represents the number of predictive variables. By employing the adjusted R 2 , a more equitable comparison of models incorporating varying quantities of predictive variables is facilitated. The adjusted R 2 undertakes a correction for degrees of freedom, ensuring an increase in the R 2 value only when the addition of new variables genuinely enhances the predictive capability of the model.

4. Results and Discussion

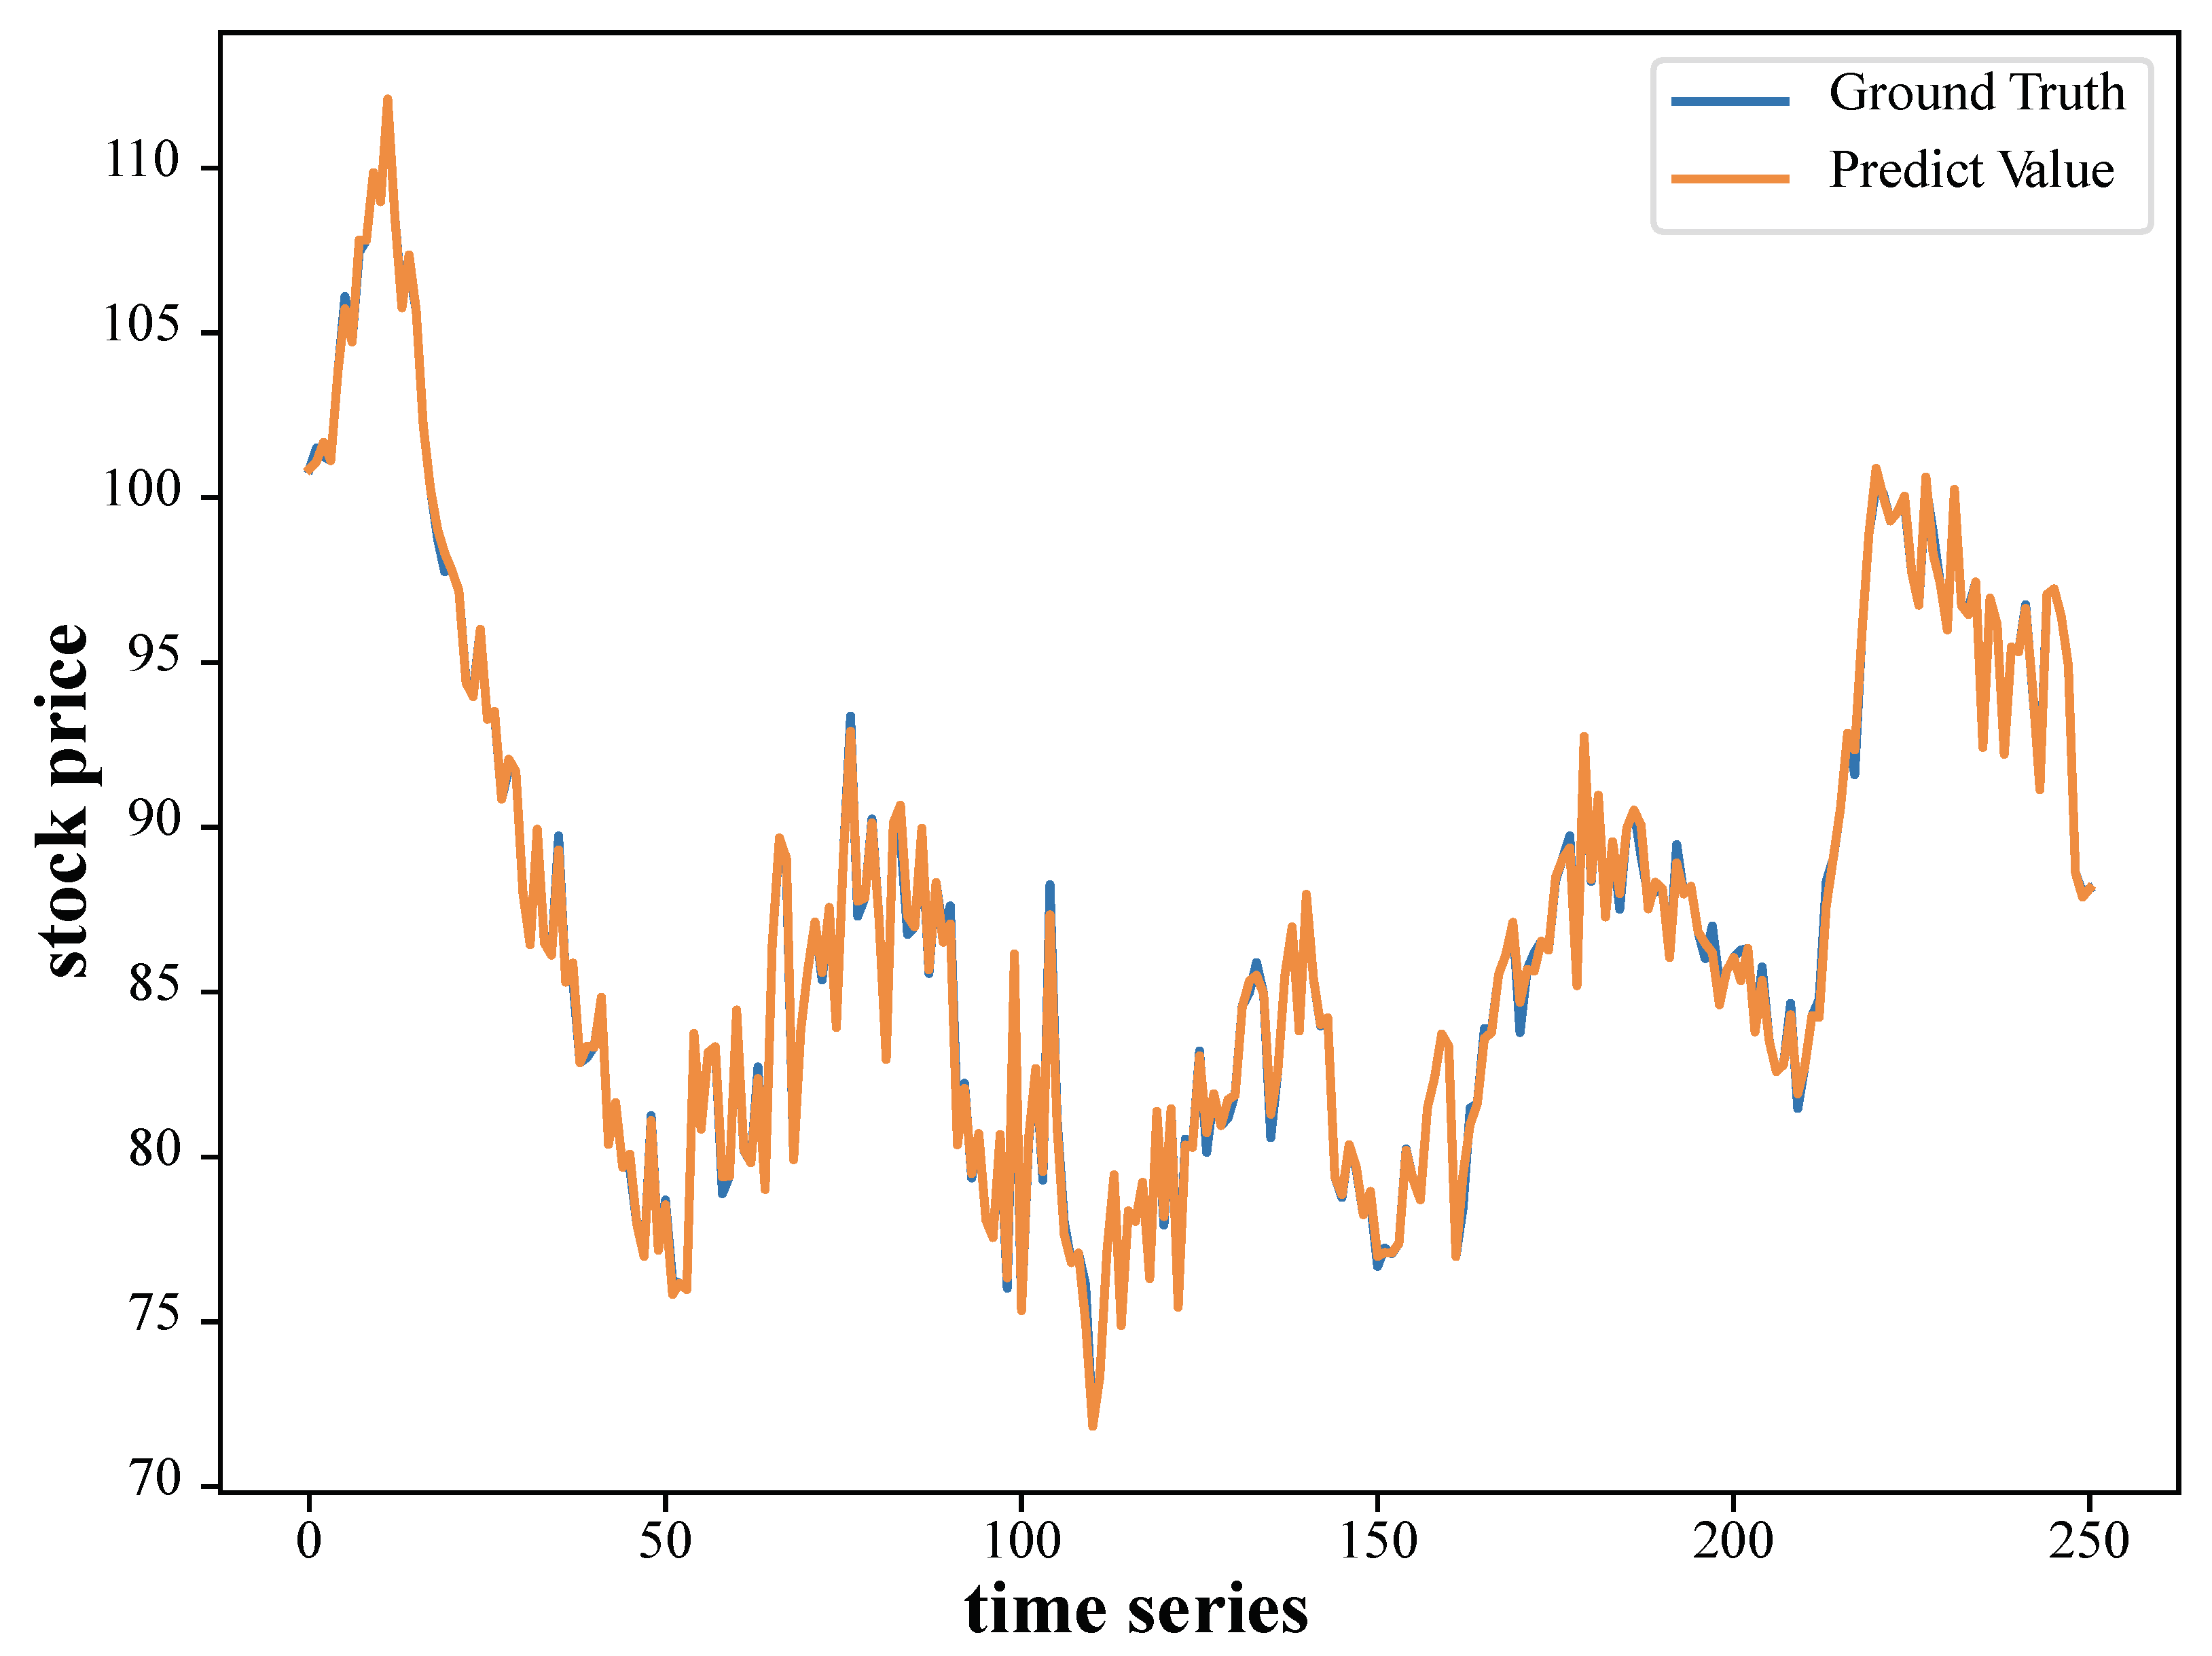
4.1. Stock Price Prediction Results

The primary objective of the experimental design in this study was to validate the effectiveness of the proposed model in the task of stock price prediction and to compare it with other popular models currently in use. By comparing the performance of different models on four evaluation metrics, namely Precision, Recall, Accuracy, and R 2 , the intent was to comprehensively assess the predictive capability of each model. Precision and Recall evaluate the model’s ability to predict positive instances accurately, Accuracy assesses the model’s overall predictive accuracy, and R 2 serves to describe the correlation between the model’s predicted values and the actual values. The experimental results are presented in Table 1.
From Table 1, it is evident that the Random Forest exhibits the lowest performance across all metrics. Random Forest primarily relies on an ensemble learning approach, aggregating outputs from multiple decision trees for predictions. Although it has shown commendable performance in many tasks, its capabilities might be limited in intricate time series prediction tasks due to potential difficulties in effectively capturing long-term dependencies. SVM, while outstanding for classification tasks, might not be the best fit for predicting stock prices, a continuous value prediction task. Although its performance in the table is slightly better than the Random Forest, it still lags significantly behind the deep learning-based models. The Temporal Transformer, designed specifically for time series data and integrating traditional time series analysis techniques, outperforms the aforementioned two models. However, it still falls behind other deep learning approaches, possibly due to its inherent constraints in capturing intricate long-term dependencies. The Time-series Neural Network, a neural network-based time series analysis model, elevates its performance across all metrics, attributed to the potent representation capabilities of deep learning. The multi-layered structure of neural networks enables them to decipher complex patterns within time series data more proficiently. The Seq2Seq Transformer, leveraging the Transformer architecture for sequence-to-sequence prediction, shows a marginally superior performance over the Time-series Neural Network, attributed to the Transformer’s self-attention mechanism, which adeptly captures long-range dependencies. The model introduced in this study consistently excels in performance across all metrics, not only validating its efficacy but also underscoring its superiority in the task of stock price prediction. The Memory Attention module and the Long-Distance Loss function embedded within the model are likely the pivotal factors for its stellar performance, as illustrated in Figure 7.
Mathematically, models based on the Transformer architecture, especially the proposed model, possess a self-attention mechanism, enabling the model to establish dependencies across varying time steps and to capture long-term trends. Concurrently, the incorporated memory module allows the model to retain and utilize pivotal past information, which is especially pertinent in stock price prediction tasks that are acutely sensitive to past data. The inferior performance of the Random Forest and SVM might be attributed to their inability to capture long-term dependencies in time series data effectively. Deep learning models, especially those based on the Transformer architecture, due to their layered structure and self-attention mechanisms, can decipher complex patterns in time series data more adeptly. In summary, the results signify that for intricate time series prediction tasks such as stock price prediction, deep learning methodologies, particularly those based on Transformer, offer distinct advantages. The proposed model, amalgamating multiple techniques such as the Memory module and Long-Distance Loss, demonstrates an especially commendable performance in this task.

4.2. Ablation Test on Memory Attention Module

The primary objective of this ablation study is to assess the impact of various attention mechanisms on the model’s performance in stock price prediction tasks. Specifically, it is aimed to verify whether the Memory Attention module can bring significant performance improvements to the model and to compare it with other prevalent attention mechanisms. Through this design, a deeper understanding of how the Memory Attention Module enhances the model’s predictive capabilities can be obtained, revealing its underlying mathematical principles.
By examining the data in Table 2, it can be observed that various attention mechanisms have commendable performance in stock price prediction tasks, but there is a disparity in their performances. SENet [20], a channel attention mechanism, emphasizes the channel relationship of features. Its performance in this experiment is relatively commendable, indicating that channel relationships are beneficial for time series prediction. However, since it primarily focuses on channel relationships rather than long-term time series dependencies, its performance is slightly inferior to other mechanisms. CBAM [21] combines spatial attention with channel attention. Although its performance is slightly less stellar than SENet, it suggests that relying solely on spatial and channel relationships might not capture all the information in complex time series tasks. Multi-head attention [13], a core component of the Transformer structure, allows the model to capture information across different subspaces. Its performance surpasses both SENet and CBAM, illustrating the advantage of multi-head attention in capturing long-term dependencies in time series data. The Memory Attention, which is central to this research, considers not only the current input features but also past essential information. It exhibits the best performance across all evaluation metrics, validating the efficacy of the Memory module in enhancing the model’s capability to capture long-term dependencies.
Different attention mechanisms possess distinct mathematical characteristics. SENet and CBAM primarily focus on local or inter-channel relationships in feature maps rather than the long-term dependencies in time series data. Hence, when faced with intricate time series prediction tasks, they might not fully capture all patterns in the data. Multi-head attention, by parallel processing across various subspaces, can more effectively capture long-term dependencies. Nevertheless, it might still fail to store and utilize key information over extended periods. From a mathematical perspective, the Memory Attention module provides the model with a mechanism to “recall” and harness past critical information. This memory capability, especially in tasks such as stock price prediction, can assist the model in better understanding and predicting future trends. In summary, this ablation study underscores the significance of attention mechanisms in intricate time series prediction tasks. Particularly, the introduced Memory Attention module, by integrating current input features with past essential information, significantly boosts the model’s predictive performance. This affirms the pivotal role of deeply considering long-term dependencies in time series data when crafting effective predictive models.

4.3. Ablation Test on Long-Distance Loss Function

The objective of this ablation experiment is to assess the influence of different loss functions on the model’s performance in stock price prediction tasks. Specifically, the experiment aims to ascertain if the proposed Long-Distance Loss function could significantly enhance the performance of the model in comparison to other prevalent loss functions. Through this design, a deeper understanding of how the Long-Distance Loss function bolsters the model’s predictive capability can be achieved, shedding light on the underlying mathematical principles.
Observations from Table 3 indicate that while various loss functions exhibit certain levels of performance in stock price prediction tasks, there are disparities in their results. The Mean Square Error Loss Function, a standard loss function in regression problems, demonstrates consistent performance. It directly measures the average discrepancy between predicted and actual values but may be overly sensitive to outliers. The Huber loss function combines attributes of both Mean Square Error and Absolute Error. When the error is below a certain threshold, it behaves similar to the Mean Square Error, and above that, it mirrors the Absolute Error. This renders it more robust in handling outliers compared to the Mean Square Error. However, the results suggest its performance is slightly inferior to the Mean Square Error, possibly because handling outliers is not the primary challenge in stock price prediction tasks. The Log Cosh loss function, a smoother variant of the Mean Square Error, is especially adept at handling large error values, offering more robustness and smoothness than the Mean Square Error. This superior performance implies that in stock price prediction tasks, smooth handling of substantial errors can be advantageous. The Long-Distance Loss function, a core contribution of this study, not only takes into account the current prediction error but also considers past prediction errors, thereby effectively capturing the long-term dependencies in time series data. As demonstrated in the table, its performance is optimal across all evaluation metrics, confirming the efficacy of the Long-Distance Loss function in enhancing the model’s ability to capture long-term dependencies.
Mathematically speaking, the Mean Square Error, Huber loss, and Log Cosh loss functions optimize based on the discrepancies between current predictions and actual values. In contrast, the Long-Distance Loss function contemplates a broader span of time steps, enabling the model to retain and utilize long-term information. This capacity for recollection is pivotal, especially in tasks such as stock price prediction where prices are influenced by a myriad of long- and short-term factors. By considering an extended time span, the model can more adeptly discern these influences and make more accurate predictions. In conclusion, this ablation experiment underscores the significance of loss functions in time series prediction tasks. The Long-Distance Loss function, by integrating current prediction errors with those from the past, markedly elevates the predictive performance of the model. This further substantiates the notion that in intricate time series prediction tasks, the selection and design of the loss function are paramount.

4.4. Limitations and Feature Works

In this study, while the effectiveness of the model for stock price prediction was validated through various methods and experiments, several limitations remain and directions for further research exist. Firstly, concerning model selection, although the adopted models demonstrated commendable performance in stock price prediction, there may be other potential models or algorithms that could be suitable for this task or might outperform the current ones. For instance, Random Forest and Support Vector Machines could exhibit superior performance in certain time series forecasting tasks. Furthermore, regarding attention mechanisms, although various mechanisms were incorporated into the model and their effectiveness was verified through ablation studies, other attention patterns or variations might confer greater advantages to the model. In terms of the loss function, the long-distance loss function indeed showcased promising results in experiments; however, there might be other loss functions or combinations that could provide more benefits for this task. Additionally, although an attempt was made to partition the dataset based on the sequence of the time series, other partitioning strategies might have a more profound impact on the model’s generalization capabilities. From a mathematical perspective, even though mathematical theoretical support was provided for various methods and models, other mathematical or statistical principles might better elucidate the performance of the models. Such potential principles could guide further improvements in the model.
For future endeavors, further exploration and optimization of these models or other contemporary machine learning models for stock price prediction tasks can be considered. Especially for time series forecasting tasks, a deeper investigation into other attention patterns or their variations is warranted. Contemplating further research and refinement of the Long-Distance Loss function or exploring other potential loss function combinations also present a promising avenue. Moreover, employing more advanced data augmentation techniques, such as adversarial training or semi-supervised learning, could further enhance the generalization and robustness of the model. In conclusion, although progress was achieved in stock price prediction tasks in this research, ample exploration space remains in model selection, attention mechanisms, and loss function design. It is hoped that future research can further advance the field, offering more insights and innovative methodologies for time series forecasting.

5. Conclusions

In the context of the burgeoning complexity of financial markets, the prediction of stock prices has been established as a critical research domain within the finance sector. The attainment of accuracy in forecasting stock prices proves imperative for enabling investors to make sagacious investment decisions and concurrently plays a pivotal role in sustaining market stability and alleviating financial risks. Nevertheless, the endeavor to precisely predict stock price trends presents an intimidating challenge, attributed to the influence of a plethora of factors encompassing macroeconomic indicators, corporate financial statements, and market sentiment. In response to this, a model encapsulating contemporary machine learning techniques has been introduced within this research and its efficacy substantiated through an extensive series of experimental validations.
Upon scrutiny of the experimental results, it has been discerned that the model introduced herein consistently outstripped alternative benchmark models across various metrics, including Precision, Recall, Accuracy, and the R 2 metric, notably achieving an impressive score of 0.97 in the latter. These outcomes robustly affirm the effectiveness and superiority of the proposed model in the realm of stock price prediction tasks. In summation, the quintessential contribution of this research is encapsulated in the introduction of a stock price prediction model that synergistically integrates a memory attention module with a Long-Distance Loss function, the efficacy and superiority of which have been comprehensively validated through experimentation. Concurrently, the conducted ablation studies have furnished compelling evidence, enriching the understanding of the influences exerted by diverse attention mechanisms and loss functions on the performance of the model. It is anticipated that the insights gleaned from this research will prove invaluable for future endeavors in stock price prediction whilst equipping investors and market analysts with more precise forecasting tools.

Author Contributions

Conceptualization, S.Y. and J.R.; Methodology, S.Y., Y.D., B.X., X.B., Y.G. (Yunxuan Gao) and W.W.; Software, Y.D., B.X. and Y.G. (Yunxuan Gao); Validation, S.Y.; Formal analysis, Y.G. (Yingyi Guo), X.B. and J.Q.; Investigation, Y.G. (Yingyi Guo) and Y.G. (Yunxuan Gao); Resources, J.Q.; Data curation, Y.D., X.B. and W.W.; Writing—original draft, S.Y., Y.D., B.X., Y.G. (Yingyi Guo), X.B., J.Q., Y.G. (Yunxuan Gao), W.W. and J.R.; Writing—review and editing, B.X. and J.R.; Visualization, Y.G. (Yingyi Guo) and W.W.; Supervision, J.R.; Project administration, J.R.; Funding acquisition, J.R. All authors have read and agreed to the published version of the manuscript.

Funding

This research received no external funding.

Data Availability Statement

Data is contained within the article.

Conflicts of Interest

The authors declare no conflict of interest.

References

  1. Liu, Z.; Li, Y.; Liu, H. Fuzzy time-series prediction model based on text features and network features. Neural Comput. Appl. 2023, 35, 3639–3649. [Google Scholar] [CrossRef]
  2. Behera, J.; Pasayat, A.K.; Behera, H.; Kumar, P. Prediction based mean-value-at-risk portfolio optimization using machine learning regression algorithms for multi-national stock markets. Eng. Appl. Artif. Intell. 2023, 120, 105843. [Google Scholar] [CrossRef]
  3. Zhang, Y.; Liu, X.; Wa, S.; Liu, Y.; Kang, J.; Lv, C. GenU-Net++: An Automatic Intracranial Brain Tumors Segmentation Algorithm on 3D Image Series with High Performance. Symmetry 2021, 13, 2395. [Google Scholar] [CrossRef]
  4. Lin, X.; Wa, S.; Zhang, Y.; Ma, Q. A dilated segmentation network with the morphological correction method in farming area image Series. Remote. Sens. 2022, 14, 1771. [Google Scholar] [CrossRef]
  5. Li, Q.; Ren, J.; Zhang, Y.; Song, C.; Liao, Y.; Zhang, Y. Privacy-Preserving DNN Training with Prefetched Meta-Keys on Heterogeneous Neural Network Accelerators. In Proceedings of the 2023 60th ACM/IEEE Design Automation Conference (DAC), San Francisco, CA, USA, 9–13 July 2023; IEEE: Piscataway, NI, USA, 2023; pp. 1–6. [Google Scholar]
  6. Zhang, Y.; He, S.; Wa, S.; Zong, Z.; Lin, J.; Fan, D.; Fu, J.; Lv, C. Symmetry GAN Detection Network: An Automatic One-Stage High-Accuracy Detection Network for Various Types of Lesions on CT Images. Symmetry 2022, 14, 234. [Google Scholar] [CrossRef]
  7. Rekha, K.S.; Sabu, M.K. A cooperative deep learning model for stock market prediction using deep autoencoder and sentiment analysis. PEERJ Comput. Sci. 2022, 8, e1158. [Google Scholar] [CrossRef] [PubMed]
  8. Jiang, J.; Wu, L.; Zhao, H.; Zhu, H.; Zhang, W. Forecasting movements of stock time series based on hidden state guided deep learning approach. Inf. Process. Manag. 2023, 60, 103328. [Google Scholar] [CrossRef]
  9. Eachempati, P.; Srivastava, P.R. Prediction of the Stock Market From Linguistic Phrases: A Deep Neural Network Approach. J. Database Manag. 2023, 34, 1–22. [Google Scholar] [CrossRef]
  10. Yadav, K.; Yadav, M.; Saini, S. Stock values predictions using deep learning based hybrid models. CAAI Trans. Intell. Technol. 2022, 7, 107–116. [Google Scholar] [CrossRef]
  11. He, Q.Q.; Siu, S.W.I.; Si, Y.W. Instance-based deep transfer learning with attention for stock movement prediction. Appl. Intell. 2023, 53, 6887–6908. [Google Scholar] [CrossRef]
  12. Lv, P.; Shu, Y.; Xu, J.; Wu, Q. Modal decomposition-based hybrid model for stock index prediction. Expert Syst. Appl. 2022, 202, 117252. [Google Scholar] [CrossRef]
  13. Vaswani, A.; Shazeer, N.; Parmar, N.; Uszkoreit, J.; Jones, L.; Gomez, A.N.; Kaiser, Ł.; Polosukhin, I. Attention is all you need. Adv. Neural Inf. Process. Syst. 2017, 30–37. [Google Scholar]
  14. Devlin, J.; Chang, M.W.; Lee, K.; Toutanova, K. Bert: Pre-training of deep bidirectional transformers for language understanding. arXiv 2018, arXiv:1810.04805. [Google Scholar]
  15. Haryono, A.T.; Sarno, R.; Sungkono, K.R. Transformer-Gated Recurrent Unit Method for Predicting Stock Price Based on News Sentiments and Technical Indicators. IEEE Access 2023, 11, 77132–77146. [Google Scholar] [CrossRef]
  16. Li, C.; Qian, G. Stock Price Prediction Using a Frequency Decomposition Based GRU Transformer Neural Network. Appl. Sci. 2023, 13, 222. [Google Scholar] [CrossRef]
  17. Wang, C.; Chen, Y.; Zhang, S.; Zhang, Q. Stock market index prediction using deep Transformer model. Expert Syst. Appl. 2022, 208, 118128. [Google Scholar] [CrossRef]
  18. Zeng, Z.; Kaur, R.; Siddagangappa, S.; Rahimi, S.; Balch, T.H.; Veloso, M. Financial Time Series Forecasting using CNN and Transformer. arXiv 2023, arXiv:2304.04912. [Google Scholar]
  19. Xu, C.; Li, J.; Feng, B.; Lu, B. A Financial Time-Series Prediction Model Based on Multiplex Attention and Linear Transformer Structure. Appl. Sci. 2023, 13, 5175. [Google Scholar] [CrossRef]
  20. Hu, J.; Shen, L.; Sun, G. Squeeze-and-excitation networks. In Proceedings of the IEEE Conference on Computer Vision and Pattern Recognition, Salt Lake City, UT, USA, 18–23 June 2018; pp. 7132–7141. [Google Scholar]
  21. Woo, S.; Park, J.; Lee, J.Y.; Kweon, I.S. Cbam: Convolutional block attention module. In Proceedings of the European Conference on Computer Vision (ECCV), Munich, Germany, 8–14 September 2018; pp. 3–19. [Google Scholar]
  22. Huang, Y.; Liu, J.; Lv, C. Chains-BERT: A High-Performance Semi-Supervised and Contrastive Learning-Based Automatic Question-and-Answering Model for Agricultural Scenarios. Appl. Sci. 2023, 13, 2924. [Google Scholar] [CrossRef]
  23. yfinance. PYPI. Available online: https://pypi.org/project/yfinance/ (accessed on 2 November 2023).
  24. Sadorsky, P. A random forests approach to predicting clean energy stock prices. J. Risk Financ. Manag. 2021, 14, 48. [Google Scholar] [CrossRef]
  25. Xiao, C.; Xia, W.; Jiang, J. Stock price forecast based on combined model of ARI-MA-LS-SVM. Neural Comput. Appl. 2020, 32, 5379–5388. [Google Scholar] [CrossRef]
  26. Zhang, L.; Wang, R.; Li, Z.; Li, J.; Ge, Y.; Wa, S.; Huang, S.; Lv, C. Time-Series Neural Network: A High-Accuracy Time-Series Forecasting Method Based on Kernel Filter and Time Attention. Information 2023, 14, 500. [Google Scholar] [CrossRef]
  27. Lohit, S.; Wang, Q.; Turaga, P. Temporal transformer networks: Joint learning of invariant and discriminative time warping. In Proceedings of the IEEE/CVF Conference on Computer Vision and Pattern Recognition, Long Beach, CA, USA, 15–20 June 2019; pp. 12426–12435. [Google Scholar]
  28. Lu, Y.; Rai, H.; Chang, J.; Knyazev, B.; Yu, G.; Shekhar, S.; Taylor, G.W.; Volkovs, M. Context-aware scene graph generation with seq2seq transformers. In Proceedings of the IEEE/CVF International Conference on Computer Vision, Montreal, BC, Canada, 11–17 October 2021; pp. 15931–15941. [Google Scholar]
  29. Zhou, J.; Li, X.; Ding, T.; You, C.; Qu, Q.; Zhu, Z. On the optimization landscape of neural collapse under mse loss: Global optimality with unconstrained features. In Proceedings of the International Conference on Machine Learning. PMLR, Baltimore, ML, USA, 17–23 July 2022; pp. 27179–27202. [Google Scholar]
  30. Meyer, G.P. An alternative probabilistic interpretation of the huber loss. In Proceedings of the IEEE/CVF Conference on Computer Vision and Pattern Recognition, Nashville, TN, USA, 20–25 June 2021; pp. 5261–5269. [Google Scholar]
  31. Saleh, R.A.; Saleh, A. Statistical properties of the log-cosh loss function used in machine learning. arXiv 2022, arXiv:2208.04564. [Google Scholar]
Figure 1. Illustration of the attention mechanism in SENet [20].
Applsci 13 12160 g001
Figure 2. Illustration of the attention mechanism in Transformer [13].
Applsci 13 12160 g002
Figure 3. Application of Transformer used in series data.
Applsci 13 12160 g003
Figure 4. Illustration of the whole method proposed in this paper.
Applsci 13 12160 g004
Figure 5. Illustration of the Memory-Transformer architecture.
Applsci 13 12160 g005
Figure 6. Illustration of the Memory Attention module.
Applsci 13 12160 g006
Figure 7. Ground truth and the predicted values by proposed method.
Applsci 13 12160 g007
Table 1. Performance comparison of different models on the evaluation metrics.
ModelPrecisionRecallAccuracy R 2 Adjusted R 2
Random Forest [24]0.830.810.840.730.73
SVM [25]0.860.840.860.770.77
Temporal Transformer [27]0.870.850.870.790.79
Time-series Neural Network [26]0.900.880.890.880.88
Seq2Seq Transformer [28]0.920.900.910.900.90
Proposed Method0.950.910.940.970.97
Table 2. Performance comparison of different attention mechanisms on the evaluation metrics.
Attention MechanismPrecisionRecallAccuracy R 2 Adjusted R 2
SENet [20]0.900.890.900.920.92
CBAM [21]0.860.880.880.870.87
Multi-head Attention [13]0.910.880.890.880.88
Memory Attention0.950.910.940.970.97
Table 3. Performance comparison of different loss functions on the evaluation metrics.
Loss FunctionPrecisionRecallAccuracy R 2 Adjusted R 2
Mean Square Error Loss [29]0.890.870.890.910.91
Huber Loss [30]0.820.790.810.830.83
Log Cosh Loss [31]0.920.910.910.930.93
Long-Distance Loss0.950.910.940.970.97
Disclaimer/Publisher’s Note: The statements, opinions and data contained in all publications are solely those of the individual author(s) and contributor(s) and not of MDPI and/or the editor(s). MDPI and/or the editor(s) disclaim responsibility for any injury to people or property resulting from any ideas, methods, instructions or products referred to in the content.

