Article

The Surface Free Energy of Resin-Based Composite in Context of Wetting Ability of Dental Adhesives

1
Department of Biomaterials and Prosthetic Dentistry, Faculty of Dentistry, University of Debrecen, H-4032 Debrecen, Hungary
2
Department of Operative Dentistry and Endodontics, Faculty of Dentistry, University of Debrecen, H-4032 Debrecen, Hungary
3
HUN-REN Institute for Nuclear Research (ATOMKI), H-4026 Debrecen, Hungary
4
Coordination Center for Research in Social Sciences, Faculty of Economics and Business, University of Debrecen, H-4032 Debrecen, Hungary
*
Author to whom correspondence should be addressed.
Appl. Sci. 2023, 13(21), 12061; https://doi.org/10.3390/app132112061
Submission received: 29 September 2023 / Revised: 31 October 2023 / Accepted: 3 November 2023 / Published: 5 November 2023
(This article belongs to the Special Issue Treatment and Materials of Dental Restorations)

Abstract

:
The surface roughness, surface free energy (SFE) of composites, and composite wettability by dental adhesives are determining factors in achieving a strong and durable adhesion (e.g., composite repair, luting adhesively bonded indirect restorations). In this study, the SFE of one nanohydrid and two bulk-fill composites was investigated in relation to the wetting ability of five different dental adhesives. The profilometry and scanning electron microscopy (SEM) measurement justified that the sandblasting produced a significantly rough surface in which the different filler amounts, filler distribution, and resin-filler ratio participated. The SFE of the tested composite was between 45.65 and 49.07 mJ/m2 regardless of surface treatment. Despite the similarity in SFE, the adhesives wet the surface of the composites in different ways that were between 16.01° and 35.10°. The contact angle of solvent-free dental adhesive was lower due to sandblasting supporting the micromechanical retention. Based on our results, it was found that sandblasting, the most frequently recommended surface treatment, does not change the surface energy but causes a change in the contact angle, which can be explained by the different surface tension of the dental adhesives. It was concluded that the dental adhesive parameters have a more important role in wettability.

1. Introduction

Resin-based composites (RBCs) are the most frequently used dental materials in dental treatments, thanks to their versatile use. Microhybrid and nanohybrid composites gained popularity due to their clinical performance [1], and bulk-fill composites provide simplified techniques to overcome layering technique disadvantages [2]. The resin composition and the type, shape, size, and distribution of the fillers of resin-based composite (RBC) affect both physical and chemical properties. Despite their improved mechanical characteristic, their lifespan is limited in an oral environment. In modern dentistry, the minimally invasive concept provides an option to save healthy tissues and possibilities for repair. Great efforts are undertaken to understand and improve the repair process, but there are still uncertainties remaining regarding the definite protocols [3]. Three possible mechanisms occur in the joining of old and new composite. First is the micromechanical interlocking through the resin penetration into the surface irregularities, the second is the chemical bond formation between the monomers, and the third is the chemical bonding to filler particles [3]. The chemical composition and characteristics of two composites, such as surface roughness, conditioning procedure, and wetting ability of polymerized surface play an important role in the adhesion strength between the old and new composite [4]. The mechanical surface treatment methods consist of roughening of the surface by sandblasting. This process increases the effective area for bonding; however, the excess roughness can deteriorate the bonding capacity because of increasing void formation. Research revealed that sandblasting creates the best environment for micro retention for the adhesive system. Therefore, sandblasting is suggested as a mechanical treatment method for composite repair [5,6]. The surface roughening followed by the application of dental adhesives has a positive effect on repair bond strength [7,8,9] due to the penetration into the surface irregularities. Certain promoter molecules in dental adhesives can enhance the quality of adhesion. The most frequently applied promoter, as a component of most universal adhesives [10], is 10-methacryloyloxydecyl dihydrogen phosphate (10-MDP) because of the formation of a better water-stable interface in contrast to silane molecule [11]. The surface tension and viscosity of adhesives and the wettability of adhesive on polymerized composite are influencing factors in dental adhesive penetration into irregularities of sandblasted RBCs. The viscosity of the liquid has an effect only on spreading kinetics, not on wettability [12]. No consistent correlation was found by researchers between the surface roughness profile and bond strengths [8,13]. However, the surface roughness strongly affects the adhesive’s wettability on the cured composite surface.
The wettability of a liquid on a solid surface is numerically expressed with contact angle (CA). Additionally, the contact angle is the most definitive way to determine the hydrophobicity of the material surface. The spreading of liquid depends on three interfacial energies: the surface energy of the substrate, the surface tension of the liquid, and the solid–liquid interfacial energy [12,14]. The real surfaces are not ideal (surface roughness < 0.5 µm, chemically homogenous, and contact angle is given by Young’s equation) because of their roughness and heterogeneous to some extent. The measurable value is the apparent contact angle that can differ from the ideal contact angle [15]. The apparent contact angle is related to the contact angle of the ideal surface if the drop of liquid is sufficiently large compared with the roughness scale and the liquid completely penetrates the surface irregularities [15].
Luting towards the aged composite surface, the surface behavior of the adhesive should be explained, such as the mechanism of adhesion and surface energies of RBCs and how well the adhesive wet the cured composite surface [12].
Researchers found that the contact angle and surface free energy (SFE) can be used to demonstrate differences in the surface properties of dental materials [16]. For surface characterization, different techniques are available (X-ray diffraction, photoelectron spectroscopy, Fourier transformation infrared spectroscopy, atomic force microscopy, and scanning electron microscopy) that are relatively expensive methods that require skilled technicians and refined techniques to interpret data. The SFE gives a good understanding of surface properties with a relatively simple approach and is measurable from contact angle measurements. These two physical properties are closely related to each other. The SFE can be determined indirectly through a theoretical formula using a contact angle of test liquids to the solids. One of the most frequently used SFE calculation methods is the Owens, Wendt, Rabel, and Kaelble (OWRK) model, which requires well-known polar and apolar liquid contact angle measurements to the surface [17]. The SFE gives information about the sum of intermolecular forces between different molecules at the surface. The wetting is favorable if the substrate has higher surface energy than the surface tension of the liquid equipped with low interfacial surface free energy.
The surface quality of RBCs is influenced by filler particle characteristics (type, hardness, size, morphology), filler loading, quality of silane coupling agent, resin matrix content and formulation, and degree of conversion [18,19]. At a certain finishing and polishing procedure on a given RBC surface, the hardness differences between the cured resin matrix and inorganic filler and hardness differences between the filler and abrasive particles determine the formed surface topography [18]. The filler particle size does not affect the sandblasting procedure. To evaluate the surface quality, the profilometry measurement is a frequently used method that gives information about the surface roughness and quantitative data for surface irregularities. The scanning electron microscopy (SEM) analysis of the surface of the composite reveals further information about shape and morphology that can be undetectable for the stylus tip of the profilometer. The surface free energy is a physical property of the surface of the material that determines how the adhesive makes intimate contact and provides a bond.
In certain clinical situations like direct composite restoration repair or luting indirect overlays, veneers, or crowns, the wetting ability of RBCs by dental adhesives has an important role in achieving strong and durable adhesion between the old and new resin-based composite. In this study, the surface quality of one nanohybrid and two bulk-fill RBCs was analyzed with profilometry, SEM, and SFE measurements by measuring the apparent contact angle of water and diiodomethane. Dental adhesives are complex systems and play an important role in the adhesion mechanism of composite repair. The apparent contact angle of five different dental adhesives (one solvent-free, one-step self-etch, and three universal 10-MDP containing) was measured on polished and sandblasted RBC surfaces. The basis of the selection of RBCs and dental adhesives was our previous study, in which these materials were analyzed and used [20,21,22] in composite repair. The aim of this study was to investigate the SFE of RBCs regarding surface roughness and wetting ability of dental adhesives.

2. Materials and Methods

2.1. Tested Materials

The tested RBC composites are presented in Table 1, containing the code and full names, manufacturer’s information, LOT numbers, and their compositions. The SDR was a flowable bulk-fill composite due to the lesser amount of filler particles that require a covering layer with a traditional composite. The TECBF was a full-body type bulk-fill composite that is highly filled and viscous. TEC was a nanohybrid composite from the Ivoclar Vivadent (Shaan, Lichtenstein) manufacturer.
The applied adhesives are summarized in Table 2, containing the code and full names, manufacturer’s information, LOT numbers, and their compositions. The Heliobond was a mixture of Bis-GMA and TEGDMA without any functional monomers and solvents. HB could be considered a hydrophobic photocurable resin mixture. The TBF II, SU, CL, and GP contained functional monomers like 10-MDP and its derivate. TBF II and CL were HEMA hydrophilic monomers containing adhesives opposing SU and GP that were HEMA-free adhesives.

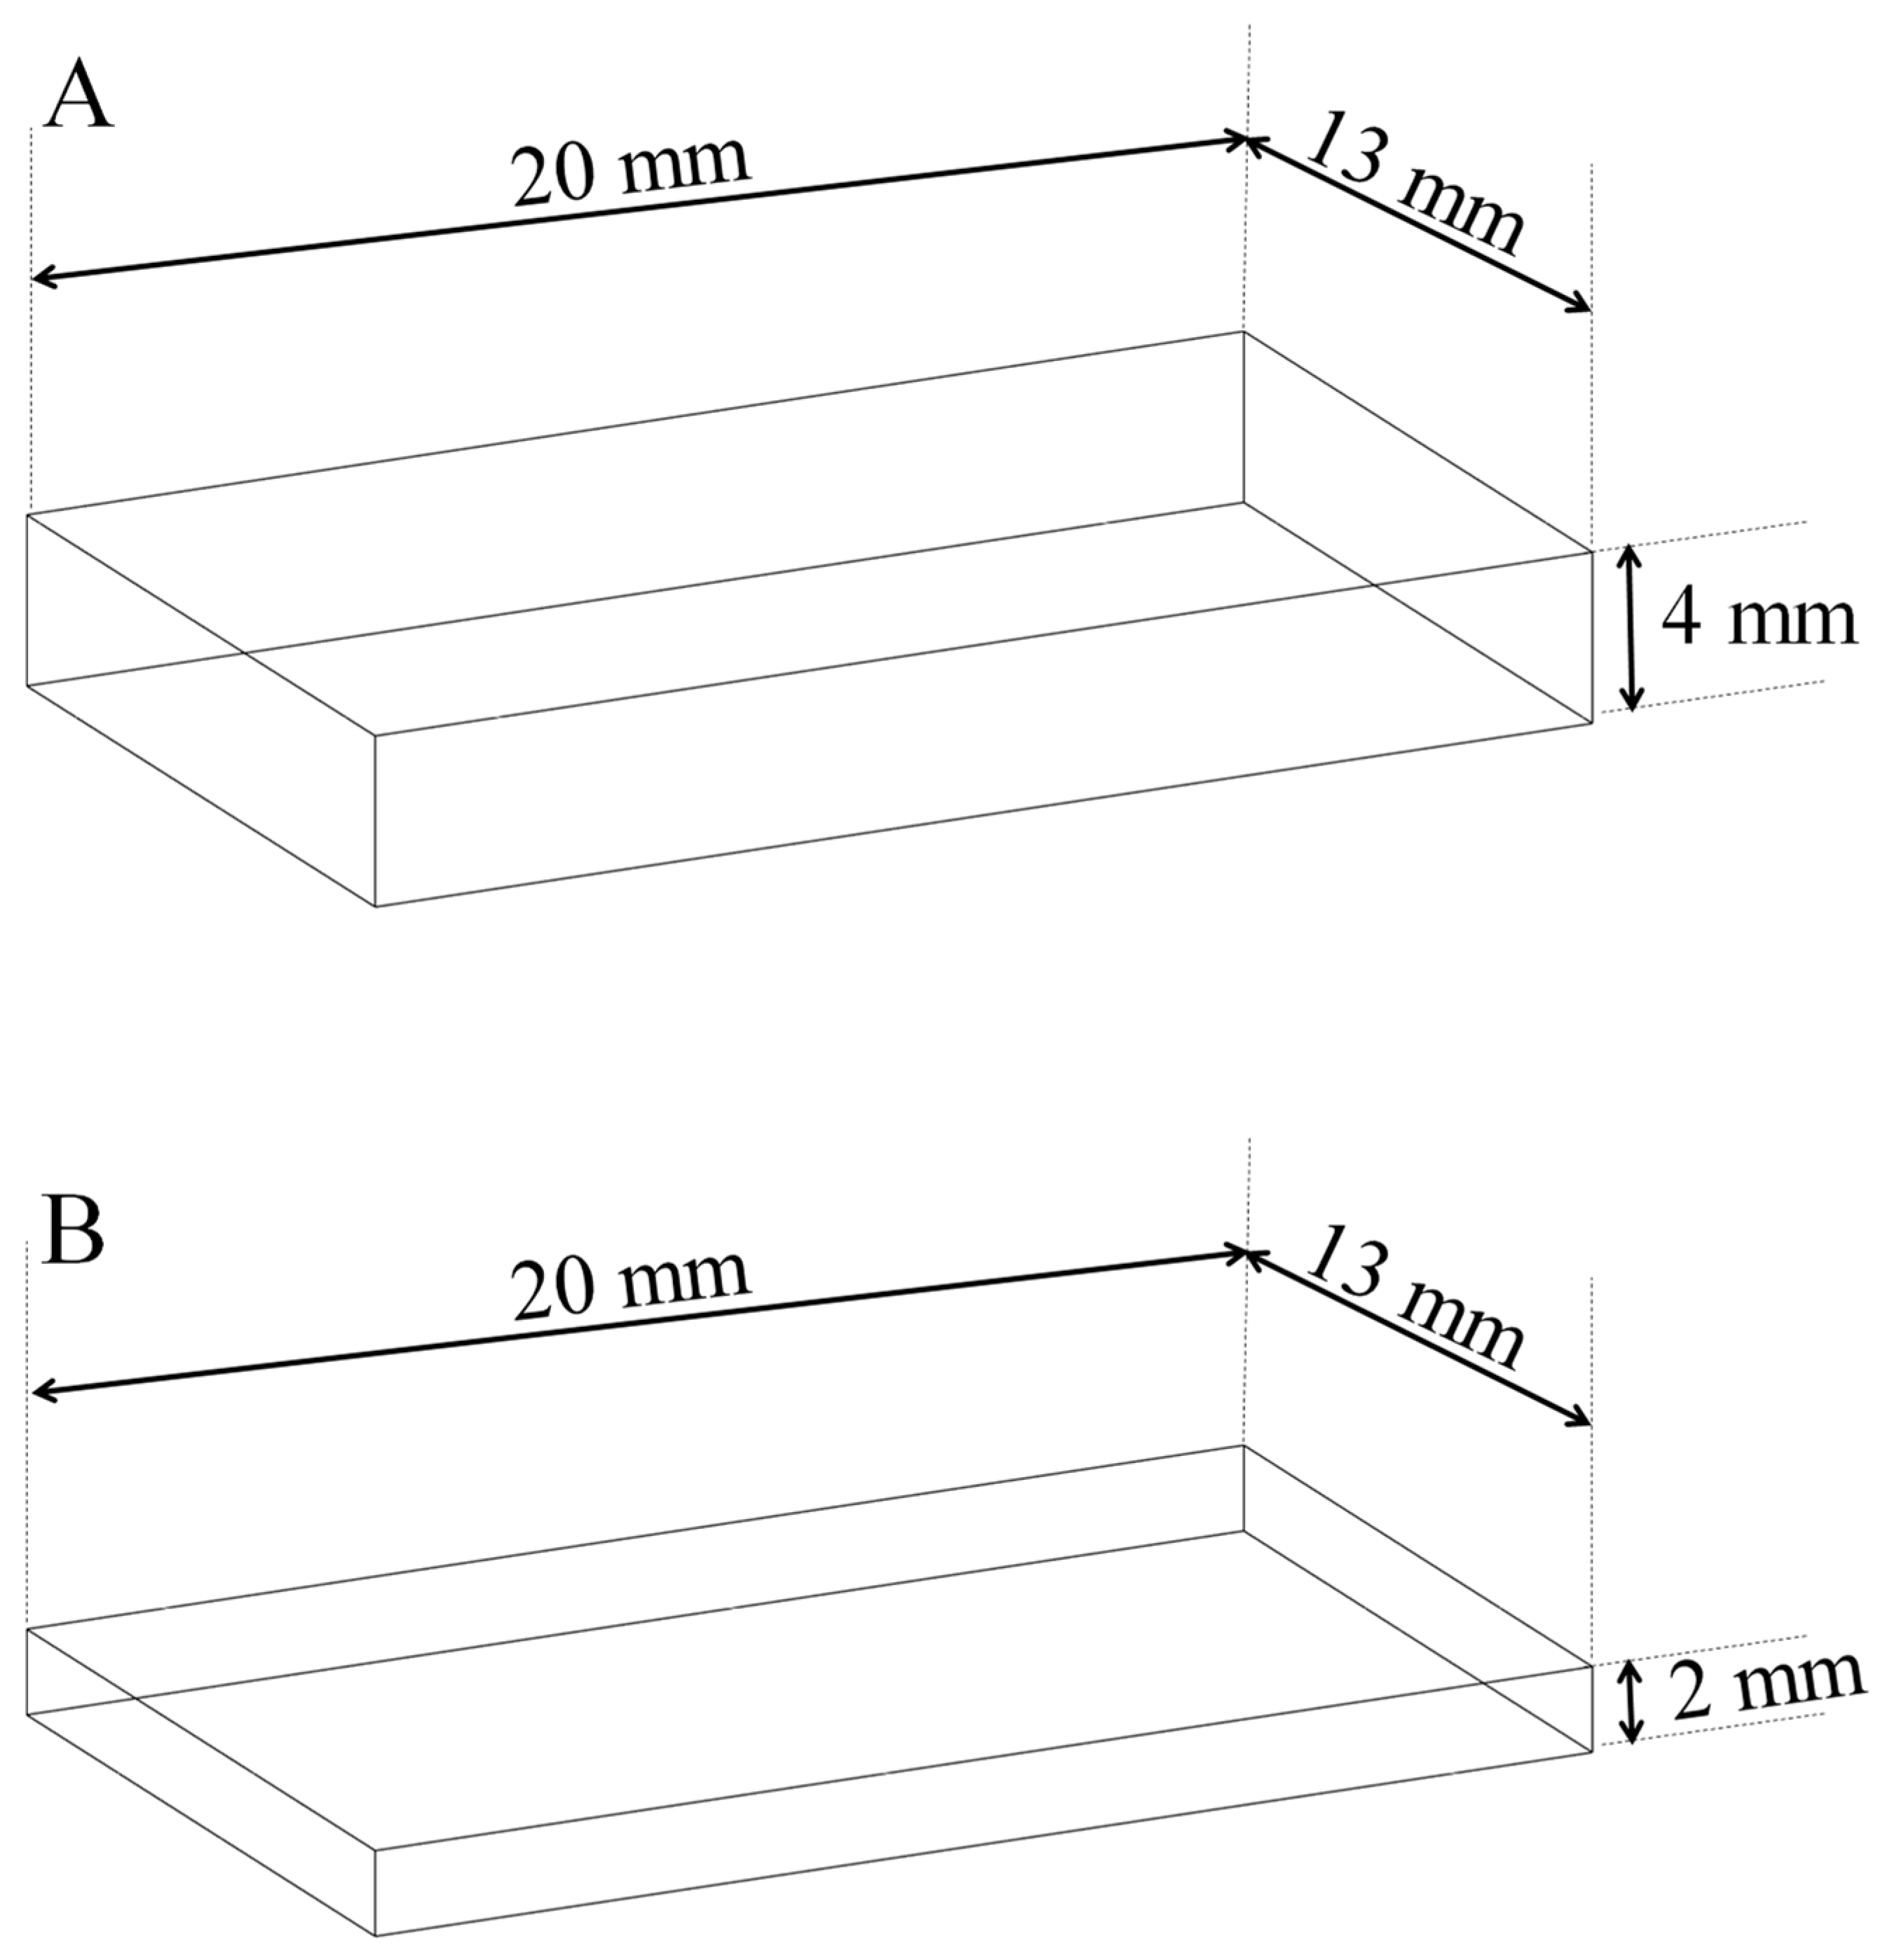
2.2. Preparation of Resin-Based Composite Specimens

The RBC was placed into a Teflon mold (Figure 1). The layering thickness was followed by the manufacturer’s recommendation. The applied layer thickness was 4 mm in the Teflon mold at two bulk-fill composites; at the nanohybrid TEC, it was 2 mm. The length of the specimens was 20 mm, and their width was 13 mm. The specimen surface was covered by a glass slide to prevent the formation of an oxygen inhibition layer. The photopolymerization of RBCs was performed in an LC-6 light chamber unit (Scheu Dental, Iserlohn, Germany) for 180 s. The operation wavelength of the polymerization unit is between 350 and 450 nm wavelengths, which is achieved by three blue-light and three UVA light sources. The aluminum inner cover reflector ensures the homogenous light distribution. The light intensity was 200 mW/cm2.
After the polymerization, both sides of the sample were polished using the Struers LaboPol-35 Grinding/polishing machine (Struers, Rodovre, Denmark) under water cooling. The used abrasive papers were 500, 1000, and 1200-grit silicon carbide discs at 300 rpm for 30 s. After both sample sides were polished, one side of the samples remained polished (PO), and the other side was sandblasted (SB) with 50 µm Al2O3 abrasive particles (Danville Engineering, San Ramon, CA, USA) using intraoral sandblaster (MicroEtcher II, Henry Schein, Melville, NY, USA) from a distance of 10 mm at a pressure of 2.5 bar for 10 s followed by ultrasonic bath washing with Elmasonic S 40 H (Singen, Germany) ultrasonic cleaning unit for removing the abrasive particles. The cleaning step was repeated three times in distilled water for 5 min. After oil-free air drying, the contact angle measurements were performed immediately [23].

2.3. Surface Profilometry Measurements

The surface roughness of polished and sandblasted composite surfaces (specimen parameters were in Figure 1) was analyzed with three-dimensional high-resolution profilometry (Ambios Technology XP-1, Santa Cruz, CA, USA). The stylus tip radius was 2.0 μm and was traveling at 0.5 mm/s tracking speed on a composite surface, applying a stylus force of 1 mg. During the measurements, the arithmetical mean deviation of the profile (Ra) parameter was recorded and determined. The number of measurements was five (n = 5), which resulted in the average data of parameters of profilometry analysis.

2.4. Surface Analysis with Scanning Electron Microscopy (SEM)

A scanning electron microscope has been applied to study in more detail the morphology of the samples. A dual beam microscope type Thermo Fisher Scientific-Scios 2 (FIB-SEM, Waltham, MA, USA) was used to examine the samples. Since the samples were electrically insulating, the microscope was operated at low voltage, and a short working distance (2 mm) was applied. To detect signals with such a small working distance, special detector strategies are required. The microscope used is equipped with a so-called in-lens detection system that can separate and collect secondary electrons, backscattered electrons, or a mixture of both types of signals. The advantage of using a low accelerating voltage (1–2 keV) is that the secondary electrons generated near the surface can easily escape, and in this way, we can increase its yield. The increased yield increases the probability of collecting the electrons needed for imaging, thereby providing the opportunity to examine insulating samples without the application of gold coating, which may modify the surface morphology [24].

2.5. Contact Angle (CA) Measurements and Surface Free Energy (SFE) Calculation

The contact angle of a drop on a solid surface measurement was performed by using Drop Shape Analyzer 30 (DSA 30, Krüss, Hamburg, Germany) at room temperature (25 ± 0.5 °C). In the first part of the measurements, the water (HPLC water, VWR International Ltd., Debrecen, Hungary) and diiodomethane (DIM; VWR International Ltd., Debrecen, Hungary) apparent contact angles were determined on clean and dry RBC surfaces. The drops of water and then DIM (5 µL) were deposited on the polished and sandblasted RBCs with the help of an automatic dosing system (0.5 mm diameter needle). The contact angle measurements and evaluation were performed by the same experienced researcher. The baseline was set where the liquid contacted the solid. For image analysis and contact angle calculation, the time frame of 50 s for each measurement was recorded and evaluated. The Advance software (DSA3, version 1.0.3-08, Krüss, Hamburg, Germany) calculated the surface free energy (SFE) of RBCs based on the Owens, Wendt, Rabel, and Kaelble (OWRK) model, which requires polar (water) and non-polar (DIM) liquids with known surface tension. The surface tension of water and DIM were 72.8 mJ/m2 and 50.8 mJ/m2 at 25 °C, respectively. This calculation was the most frequently used method. The mathematical formula of the OWRK model was the following:
γ s l = γ s v + γ l v 2 γ s v d γ l v d + γ s v p γ l v p
where γsvd and γlvd were dispersive components, and γsvp and γlvp were polar components of solid and liquid surface energies, respectively. After Young’s equation combination (γsv = γsl + γlv cosθγ, where γsv was solid surface free energy, γsl was solid/liquid interfacial free energy, γlv was the liquid/vapor interfacial tension (liquid surface tension), and θγ is the contact angle) the OWRK equation was the following:
γ l v 1 + c o s θ γ = 2 γ s v d γ l v d + γ s v p γ l v p
where γsvd and γsvp were the two unknowns that were polar and dispersed parts of SFE.
The sample sizes ensured enough large surfaces to implement contact angle measurements with many drop depositions. For the median contact angle calculation, ten individual sessile drop measurements (n = 10) were performed. The liquid drops were deposited on the surface, and the contact angle was calculated based on the drop shape by a connected camera. In the second part of the measurements, the apparent contact angle of dental adhesives was determined. The drops of adhesives (5 µL) were deposited (n = 10) on the polished and sandblasted composite surface with a manual dosing system holding a 1 mL syringe (0.5 mm diameter needle). In all cases, the ellipse contact angle fitting model was used on polished and sandblasted composite surfaces.

2.6. Statistical Analysis

Since most of the data did not follow a normal distribution—which was tested by the Shapiro–Wilk test—and due to relatively small sample sizes, non-parametric tests were used. For matched data, Wilcoxon signed-rank tests were used, and for unmatched data, Mann–Whitney U tests were performed as pairwise analysis. Furthermore, non-parametric multiple pairwise comparisons were made with Kruskal–Wallis post-hoc tests, which is why Dunn tests with Bonferroni corrections were executed to reduce the familywise error rate.
Data analysis was executed with Stata Statistical Software (version 13.0, Stata Corp, College Station, TX, USA), and p < 0.05 was considered significant. Data were described by medians and interquartile ranges and presented by boxplots.

3. Results

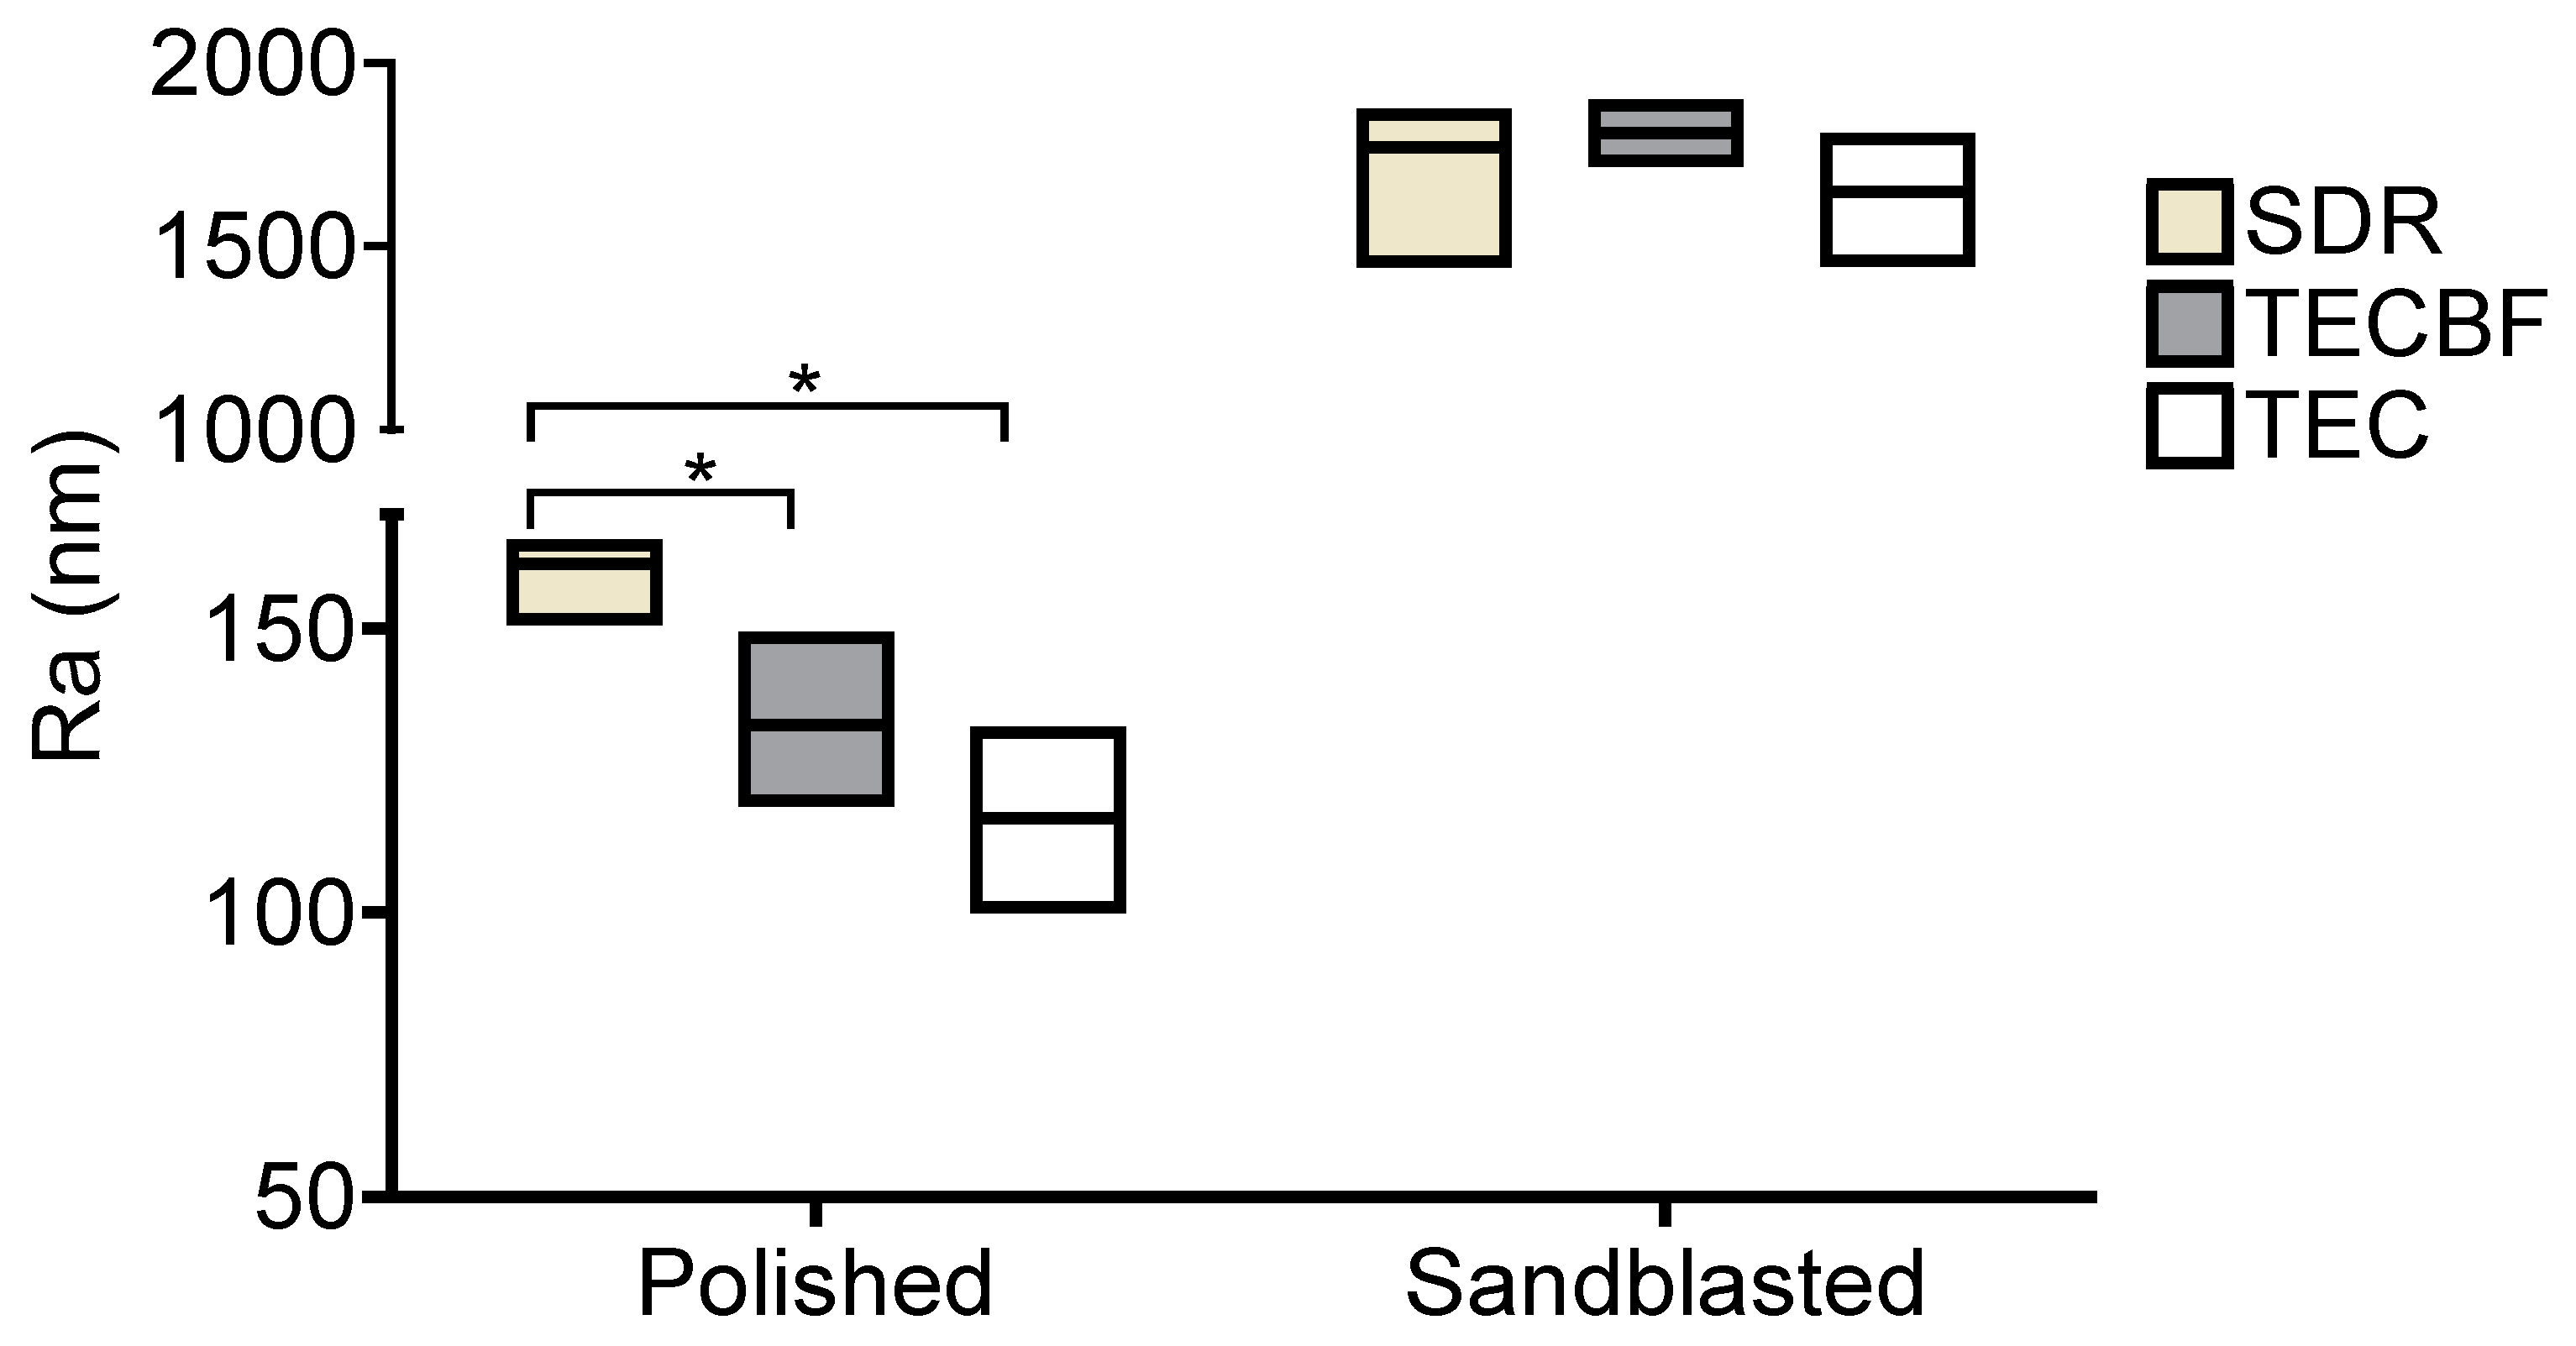
3.1. Results of Profilometry Measurements

The Ra in nm, the root mean square deviation of the profile, is the most frequently used data for roughness characterization. The median data with a range of Ra are summarized in Figure 2.
The Ra median data were 161.38 nm, 128.83 nm, and 119.35 nm on polished SDR, TECBF, and TEC surfaces, respectively. On sandblasted surfaces, Ra median data were 1770.4 nm, 1807.6 nm, and 1645.4 nm on SDR, TECBF, and TEC composites, respectively. The statistical analysis showed that the SDR composite differs significantly from TECBF and TEC composite on the polished surface (p < 0.05). The TECBF and TEC did not differ significantly on polished surfaces. On sandblasted surfaces, the three composites were considered similar in terms of Ra (p ˃ 0.05). The Ra data were significantly higher on sandblasted surfaces than on polished surfaces (p < 0.05). The profilometry measurements revealed that the sandblasting procedure created a significantly rougher surface on RBCs.

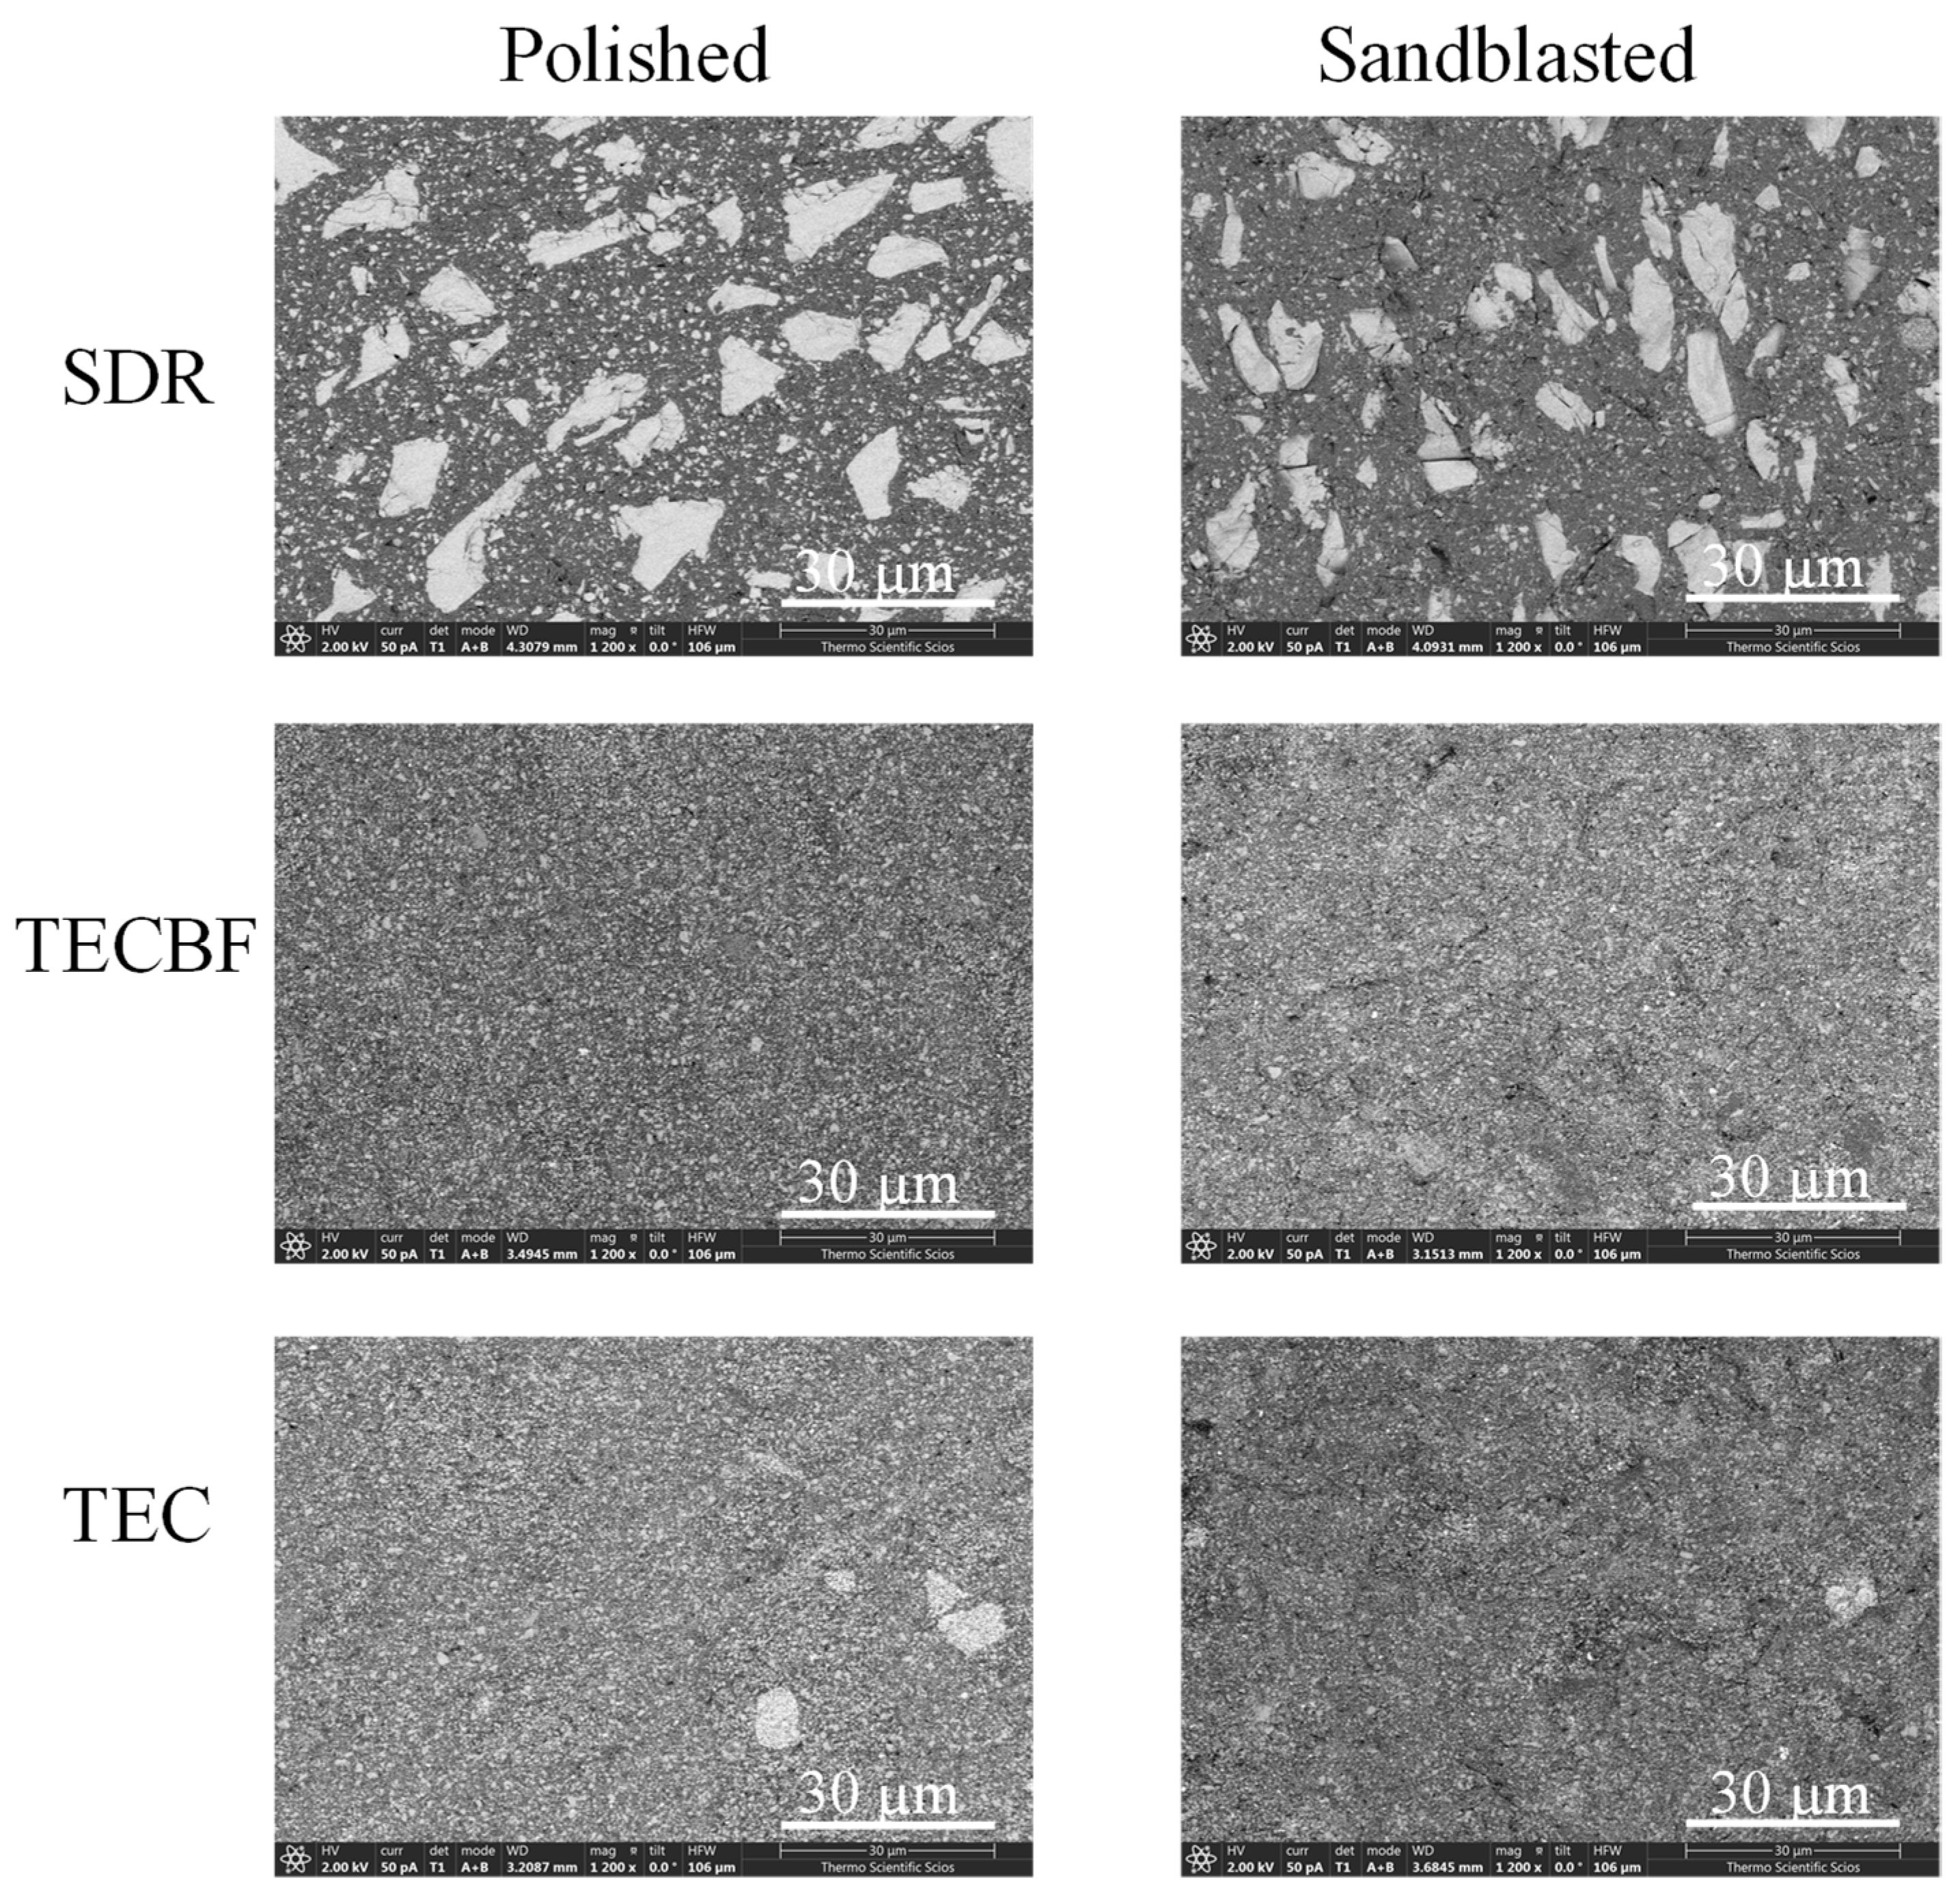
3.2. Results of Scanning Electron Microscopy Analysis

The SEM micrographs from polished and sandblasted SDR, TECBF, and TEC composite surfaces are summarized in Figure 3. The SEM analysis revealed the differences between the composite. The SEM micrographs of SDR showed large filler particles with a wide particle size distribution until filler size distributions of TECBF and TEC were more homogenous. The topography of TECBF and TEC were very similar at a given surface treatment. For sandblasting, the surface of three composites became segmented compared to the polished surface. In addition, the falling out of filler can be observed by leaving behind smaller depressions. Small cracks can be observed on all sandblasted surfaces; especially at SDR, it was more obvious, frequently around the filler contour, resulting in protruding filler particles.

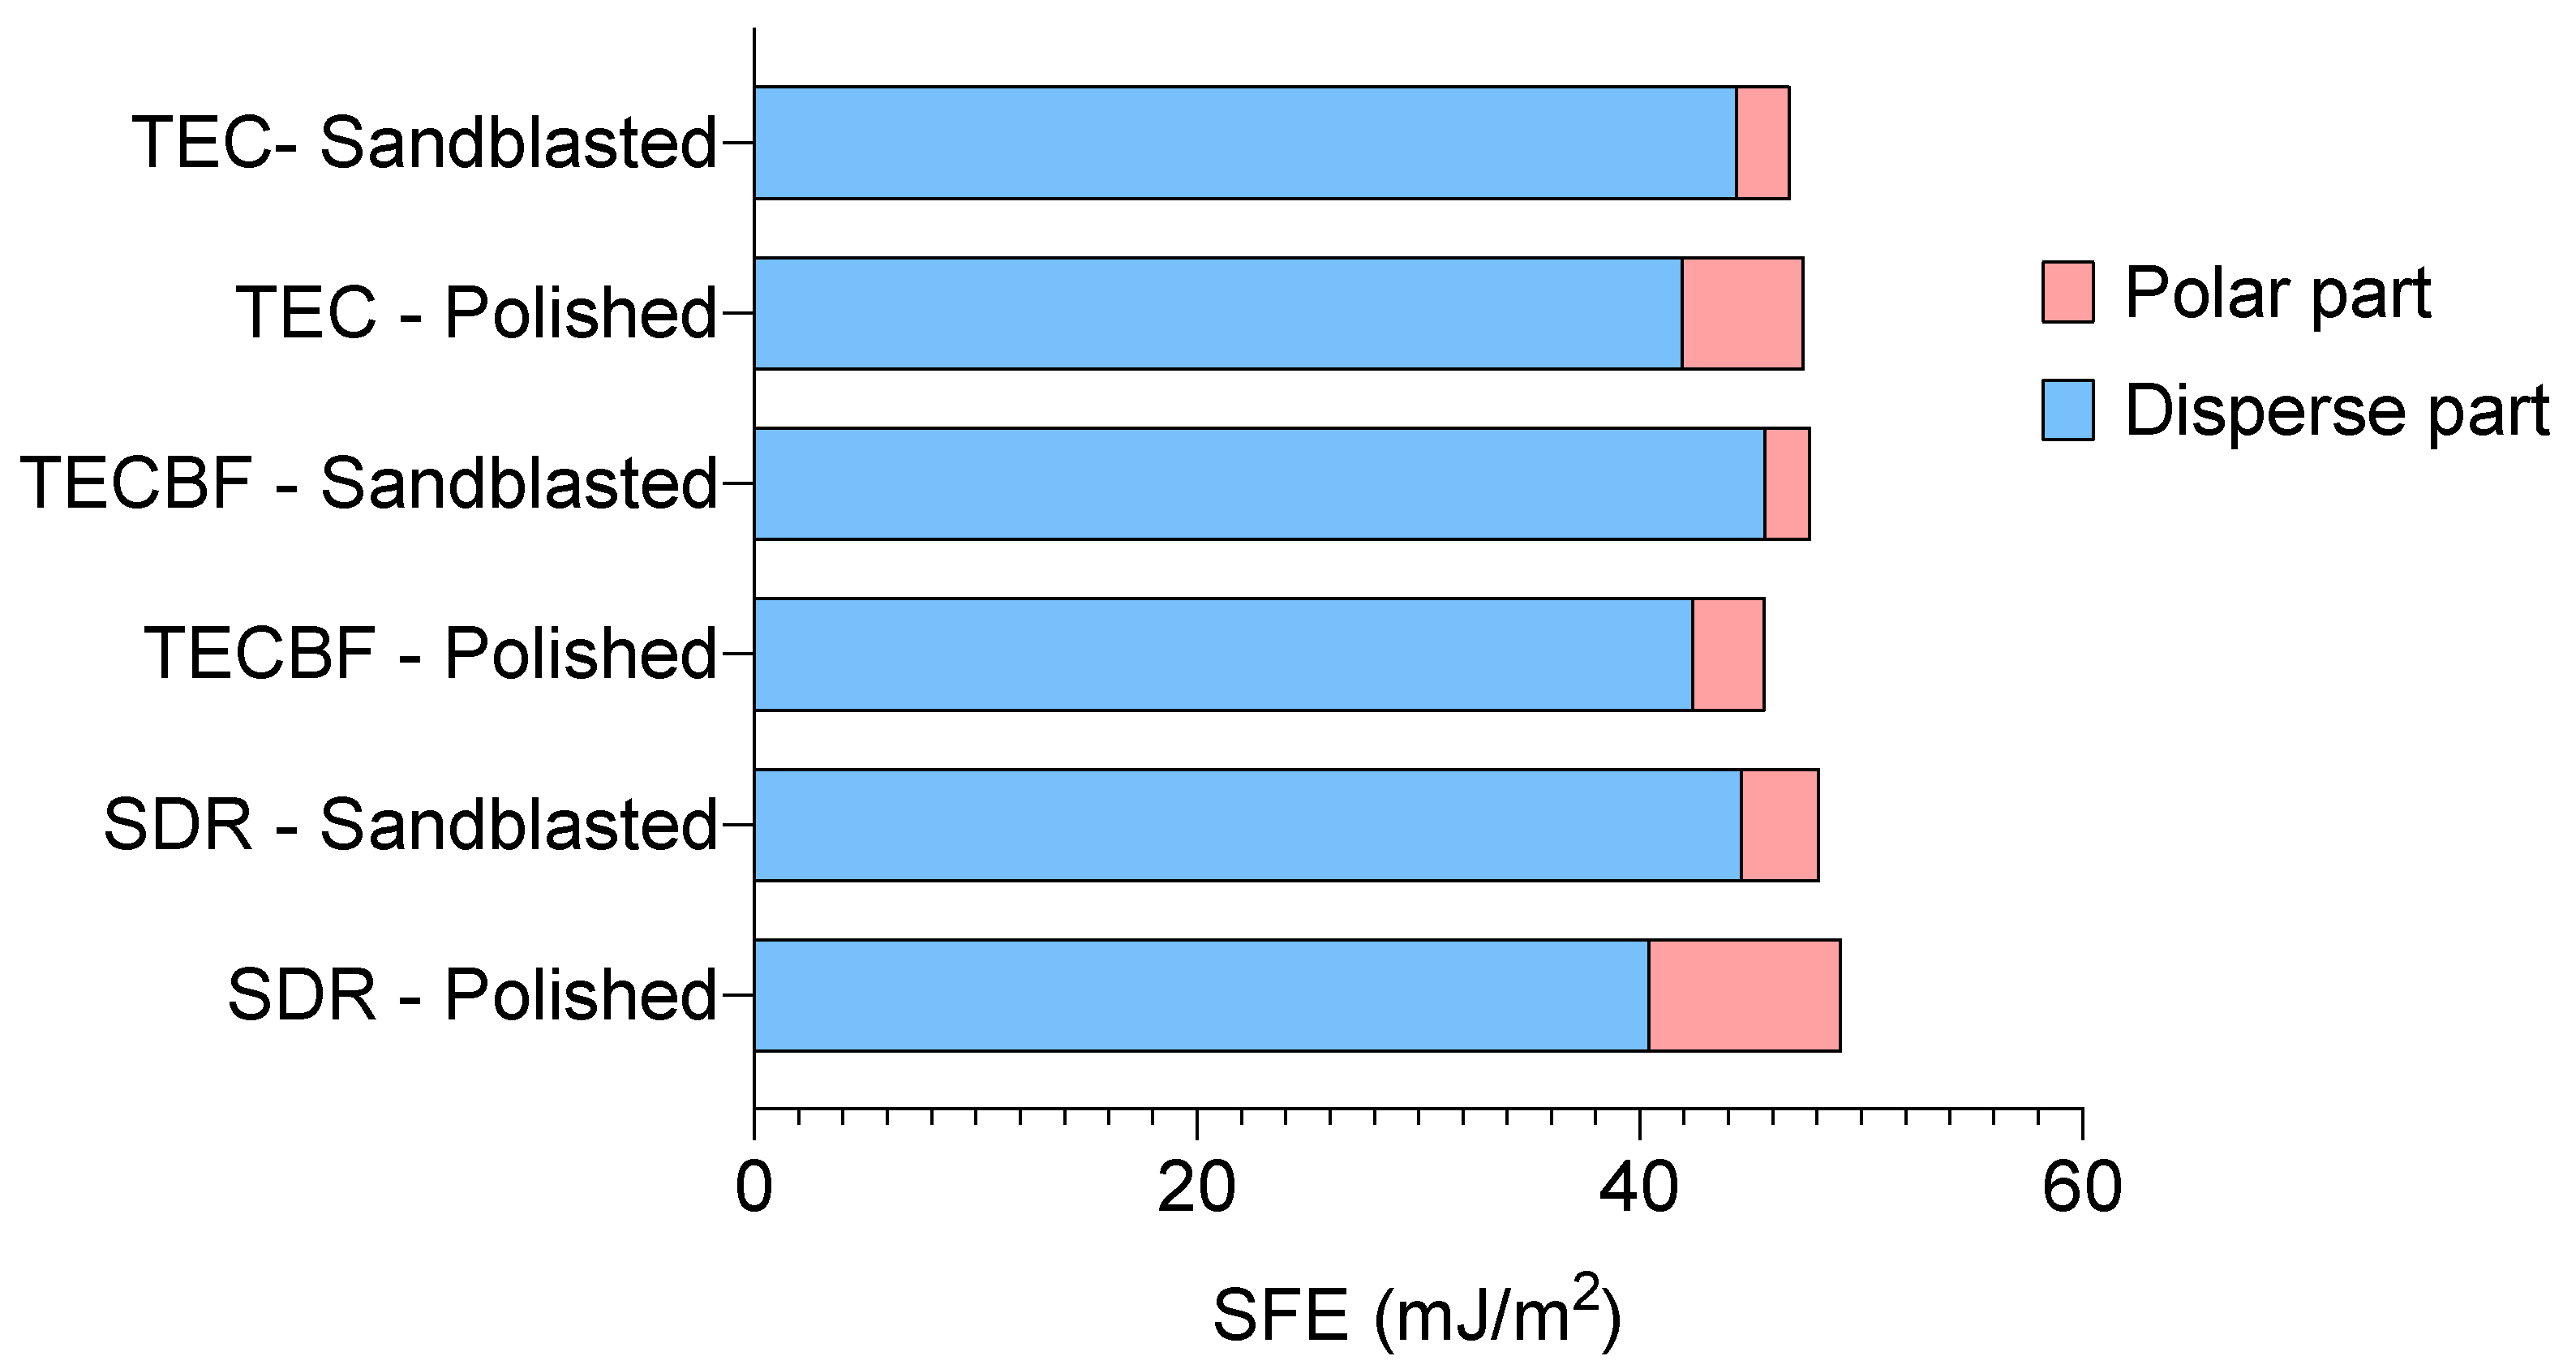
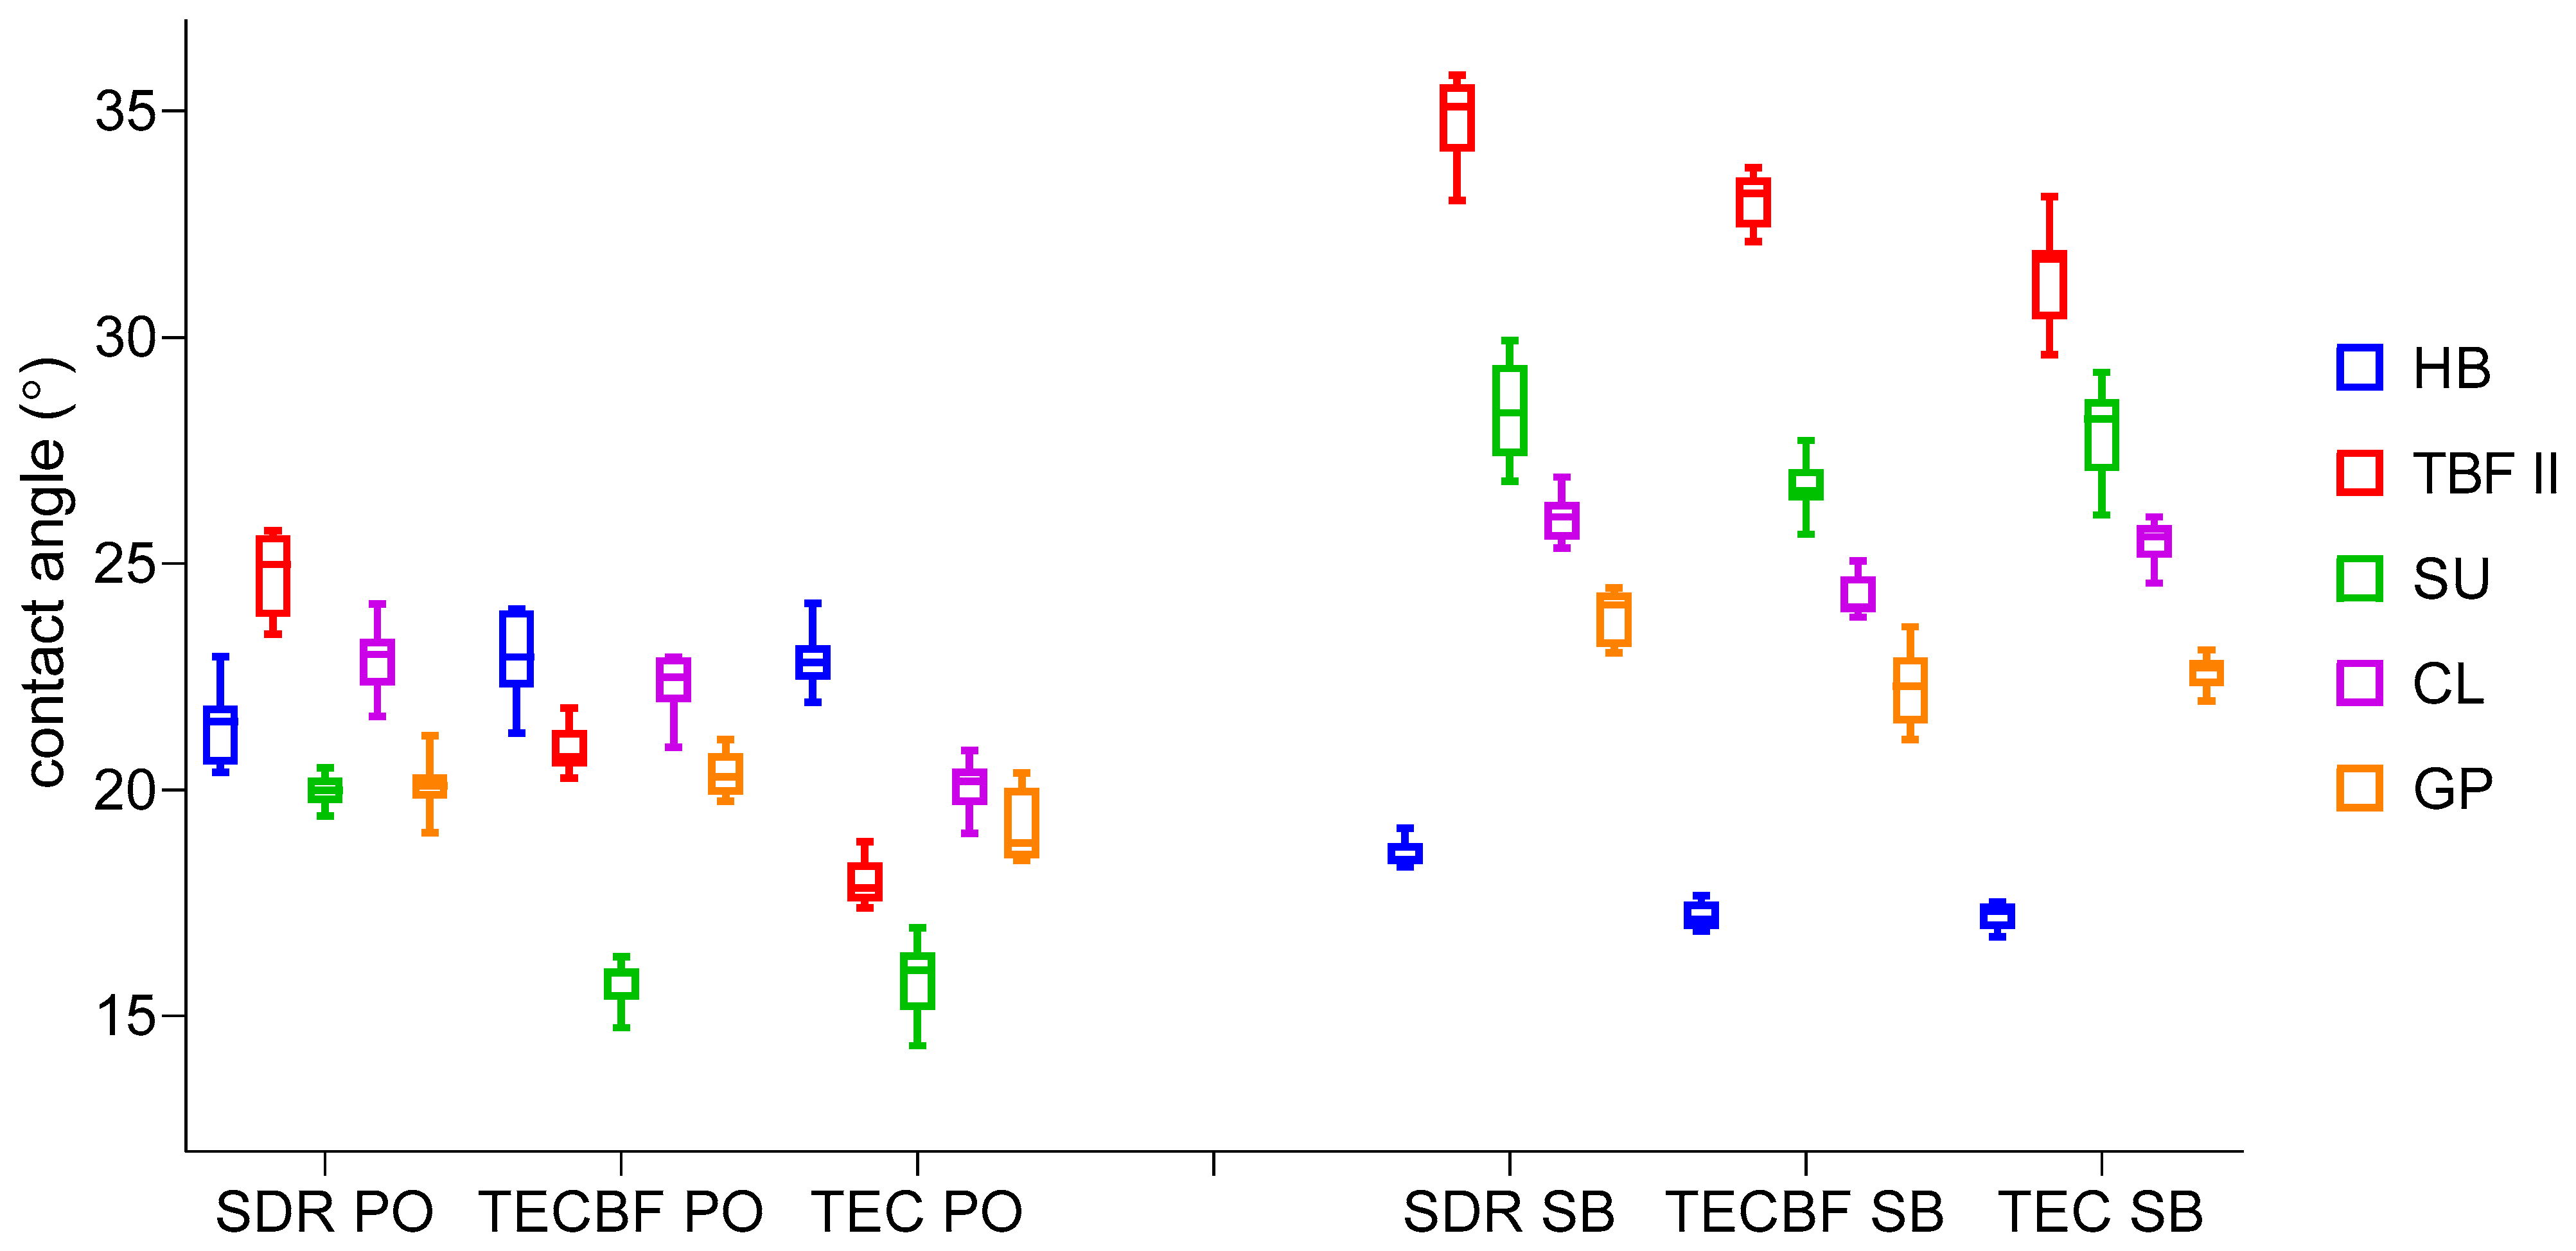
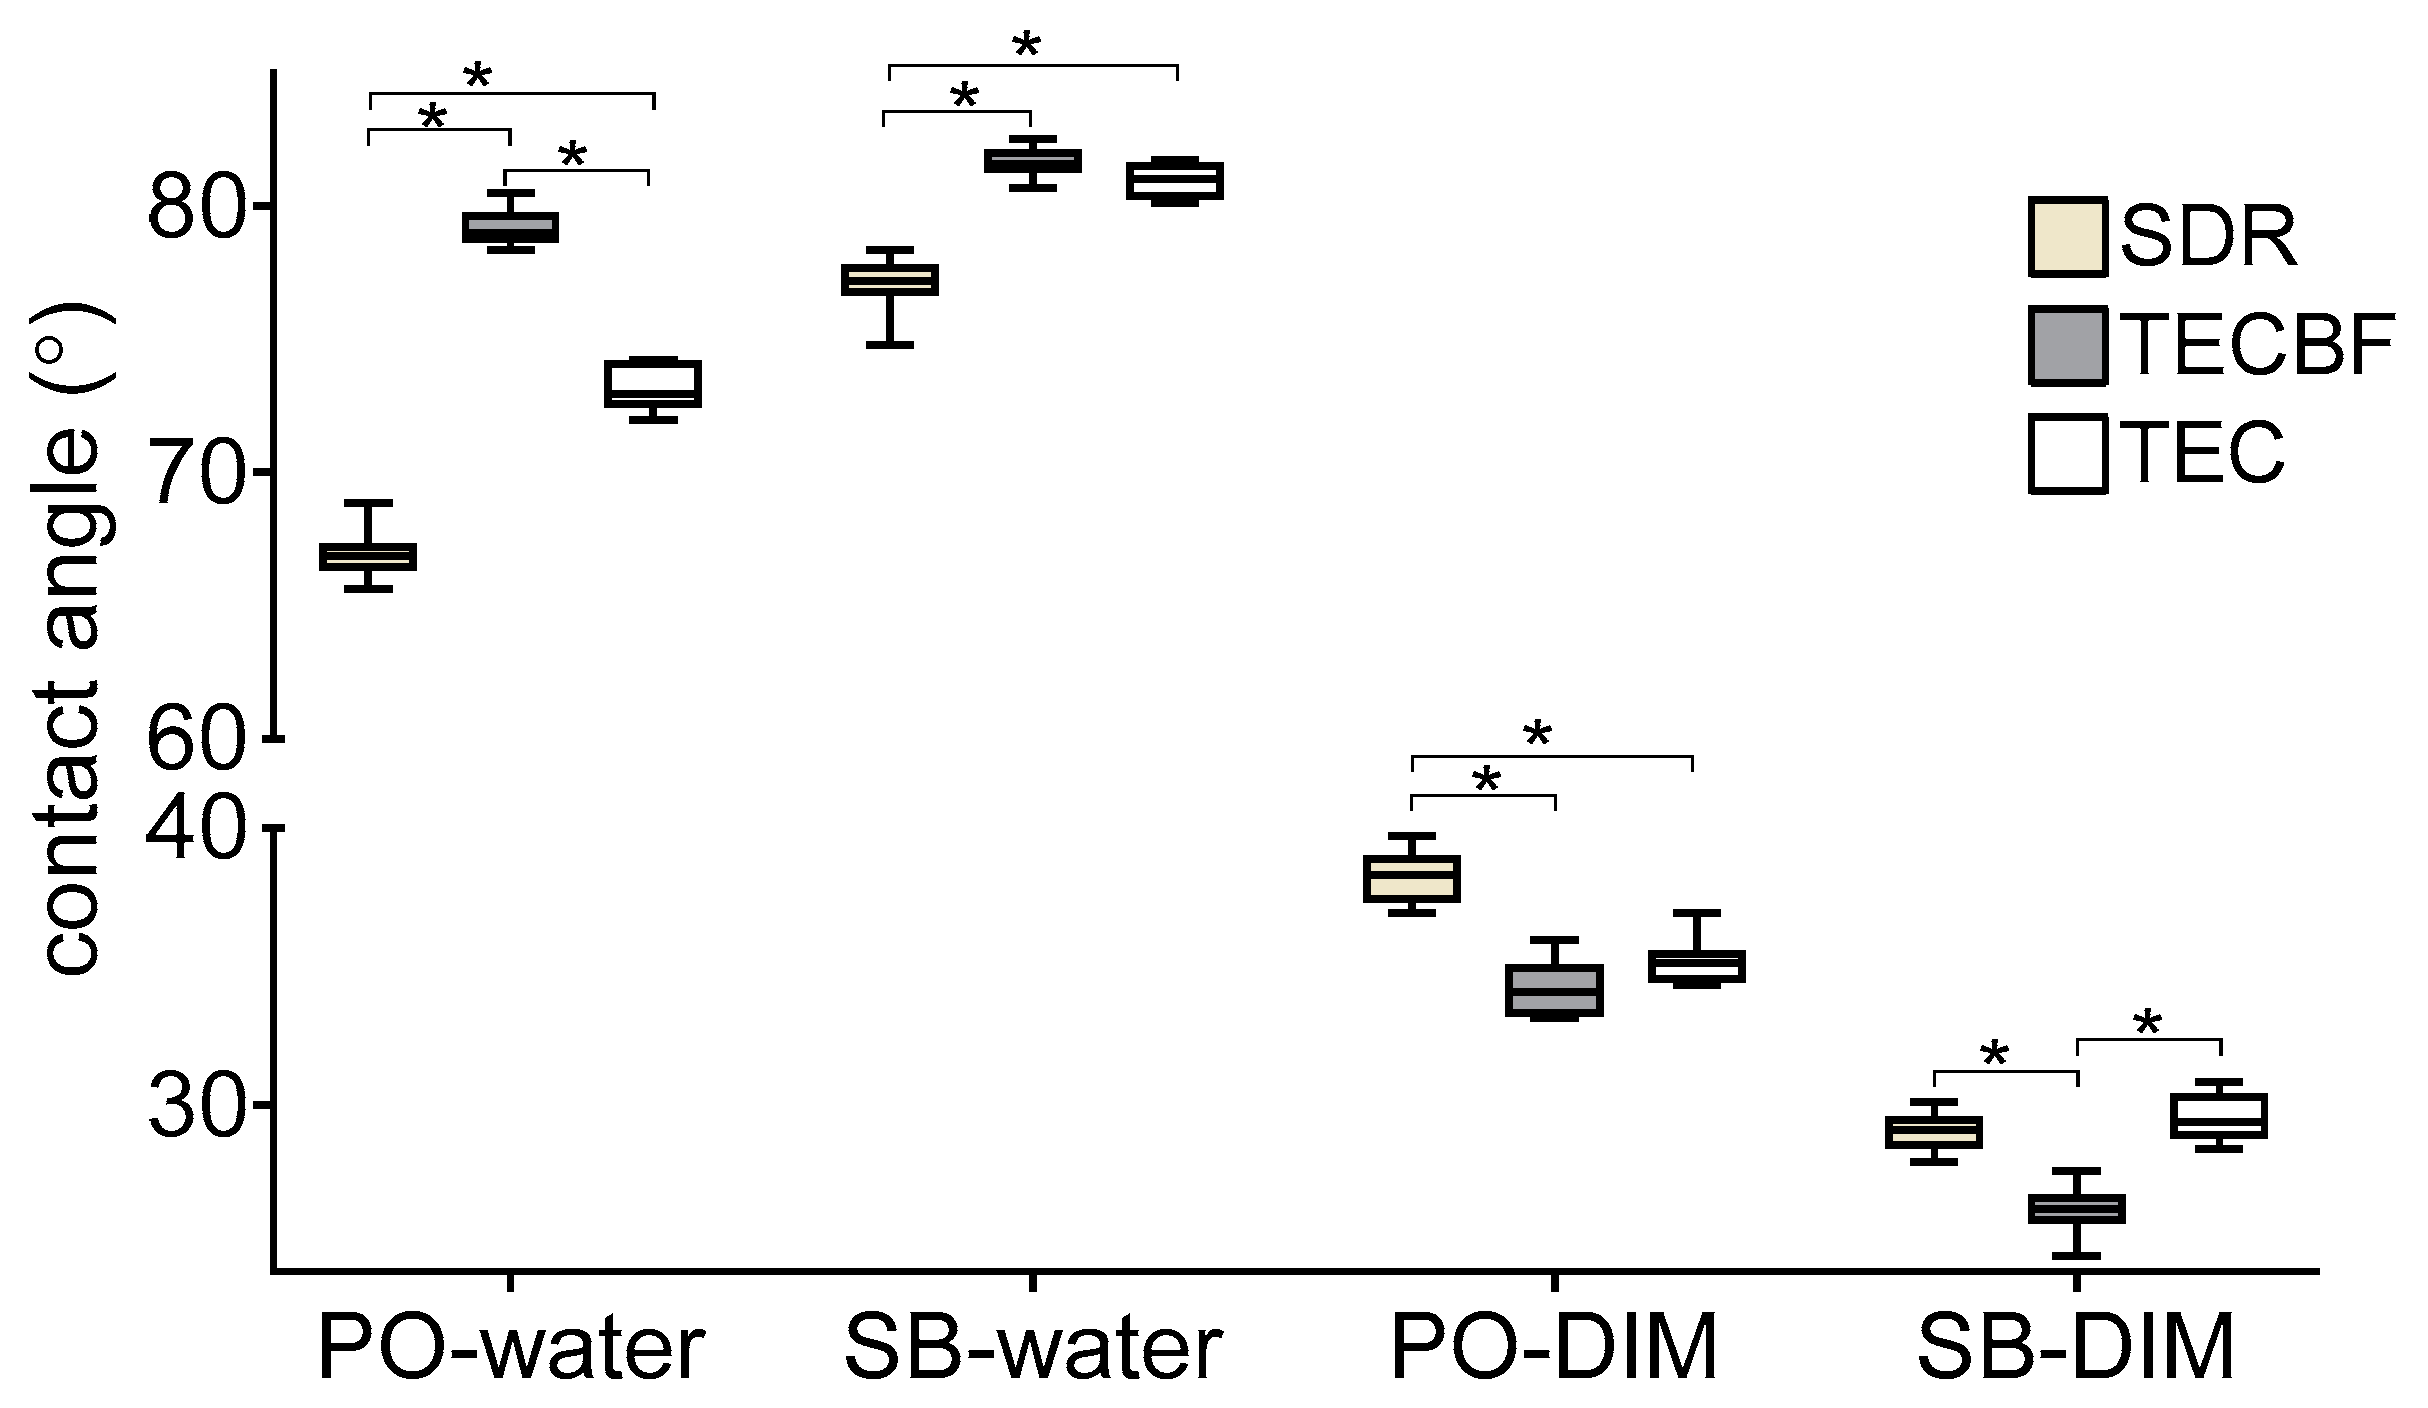
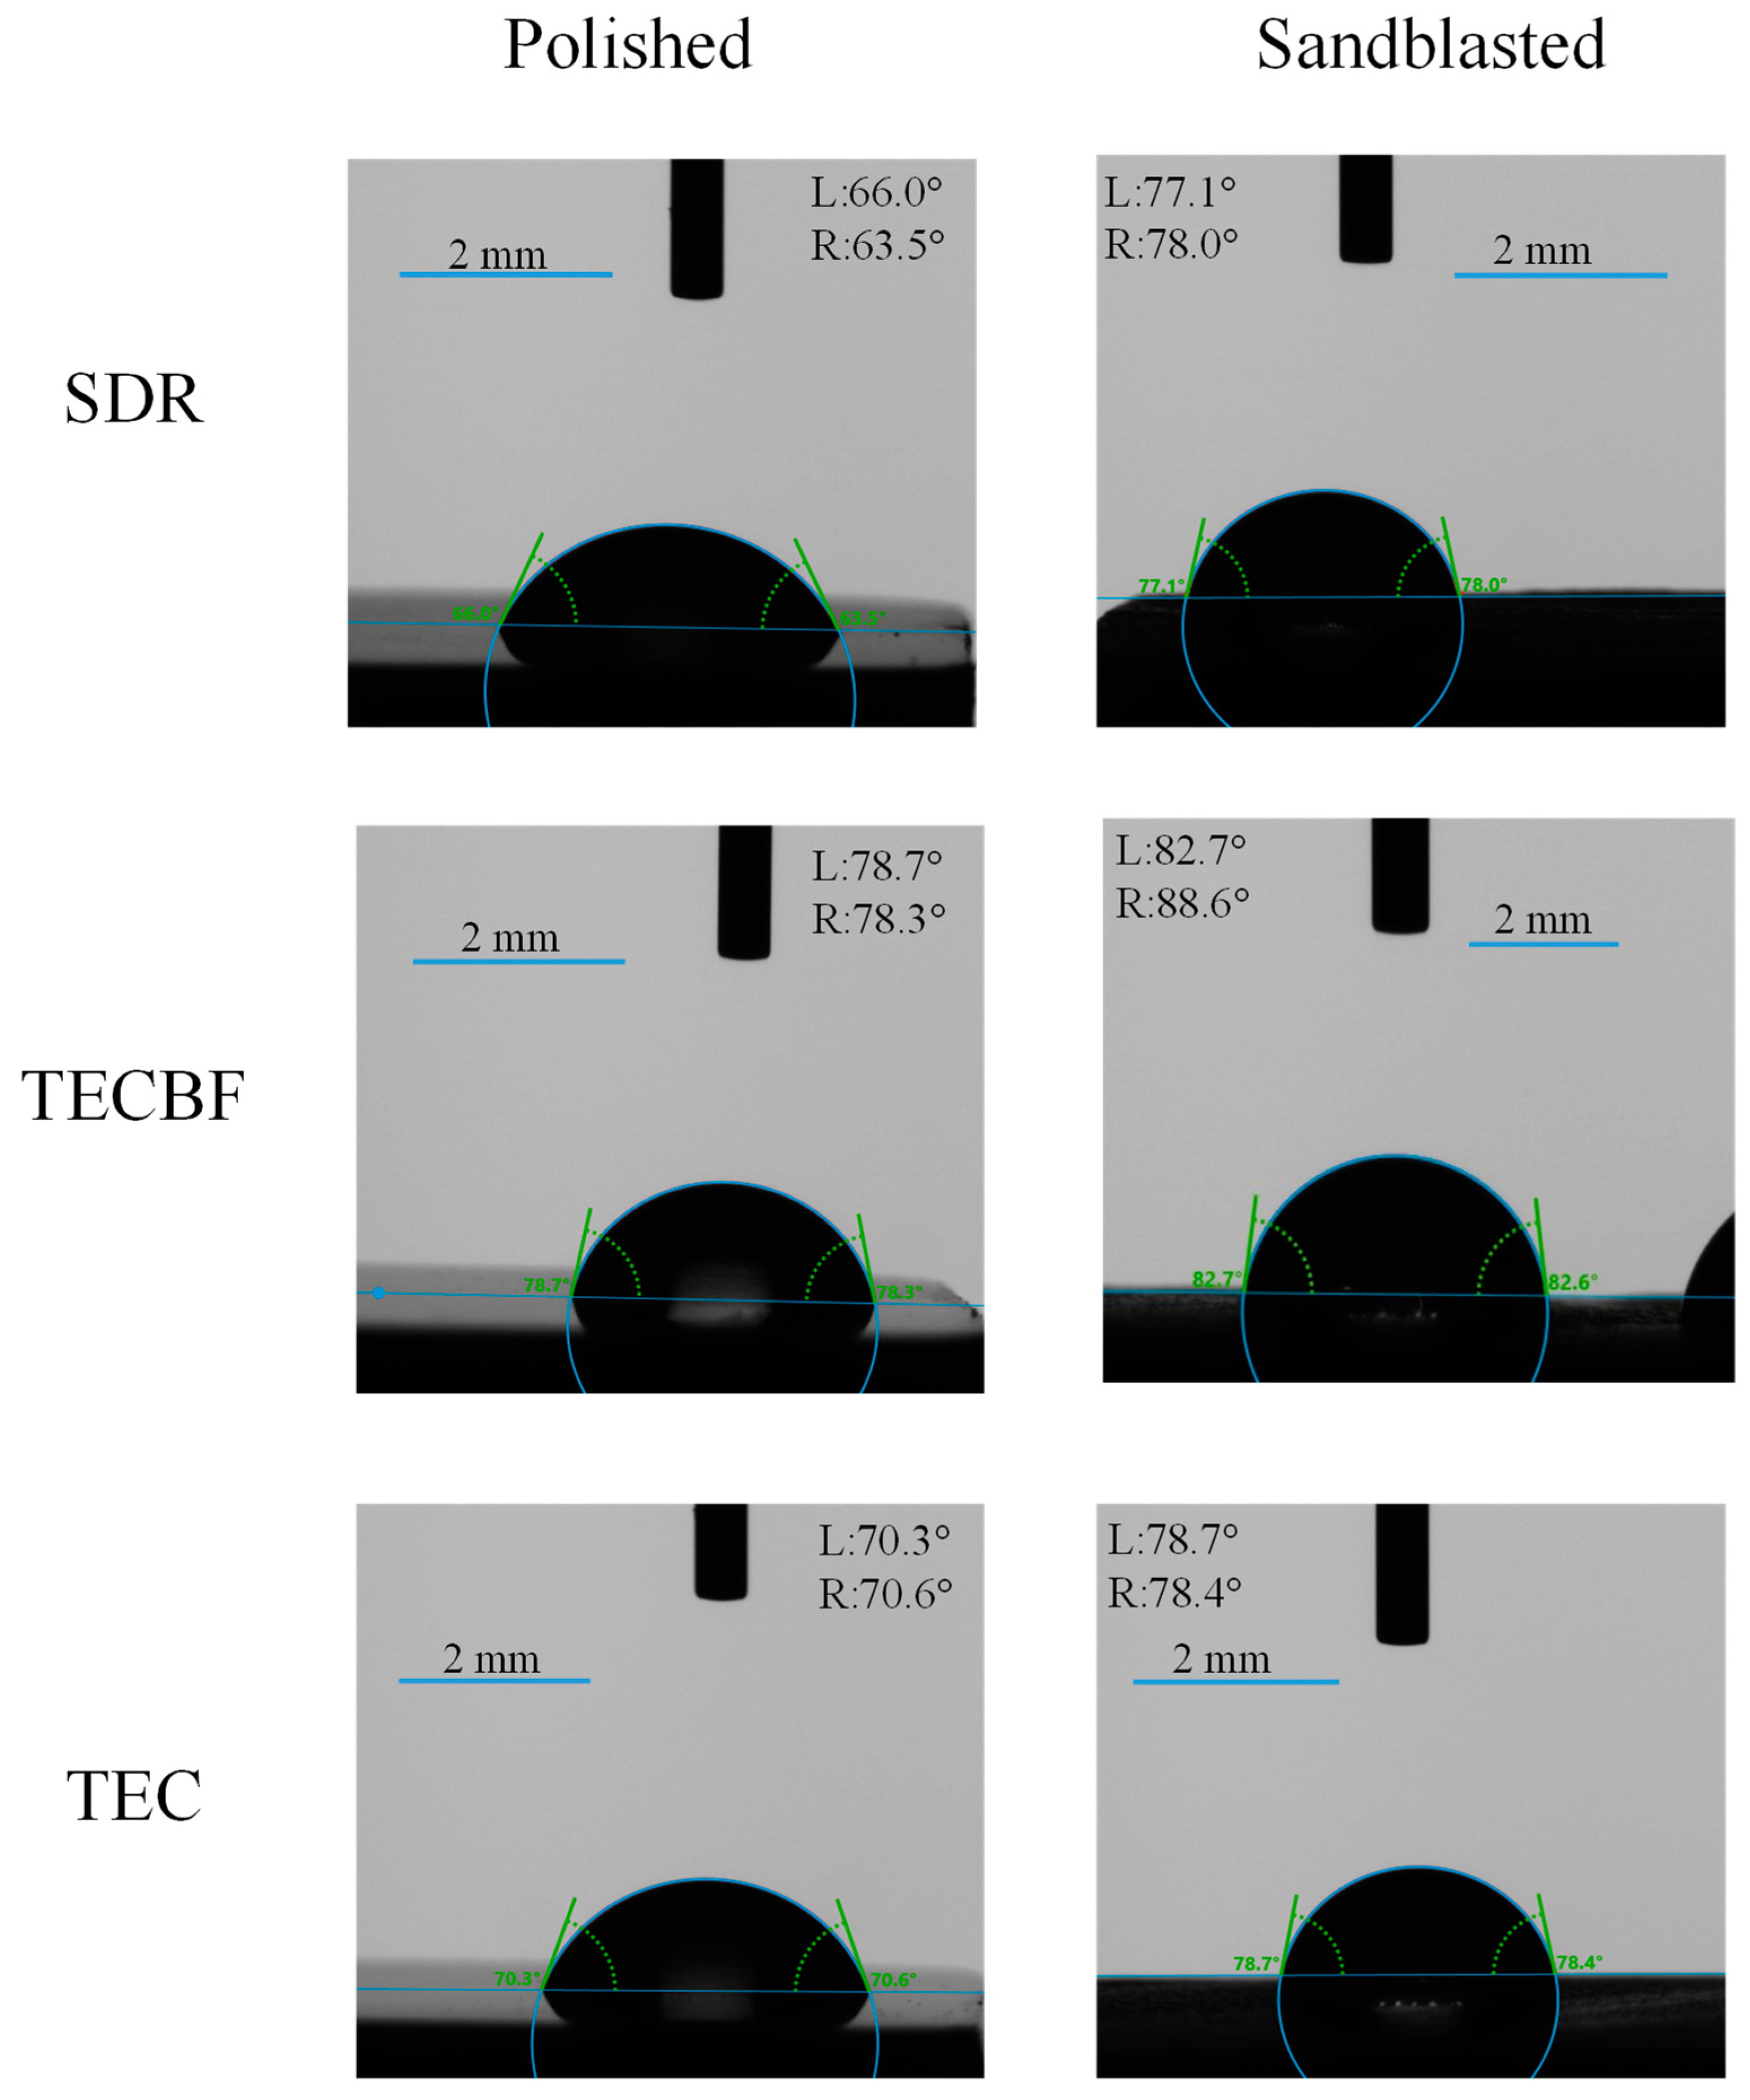
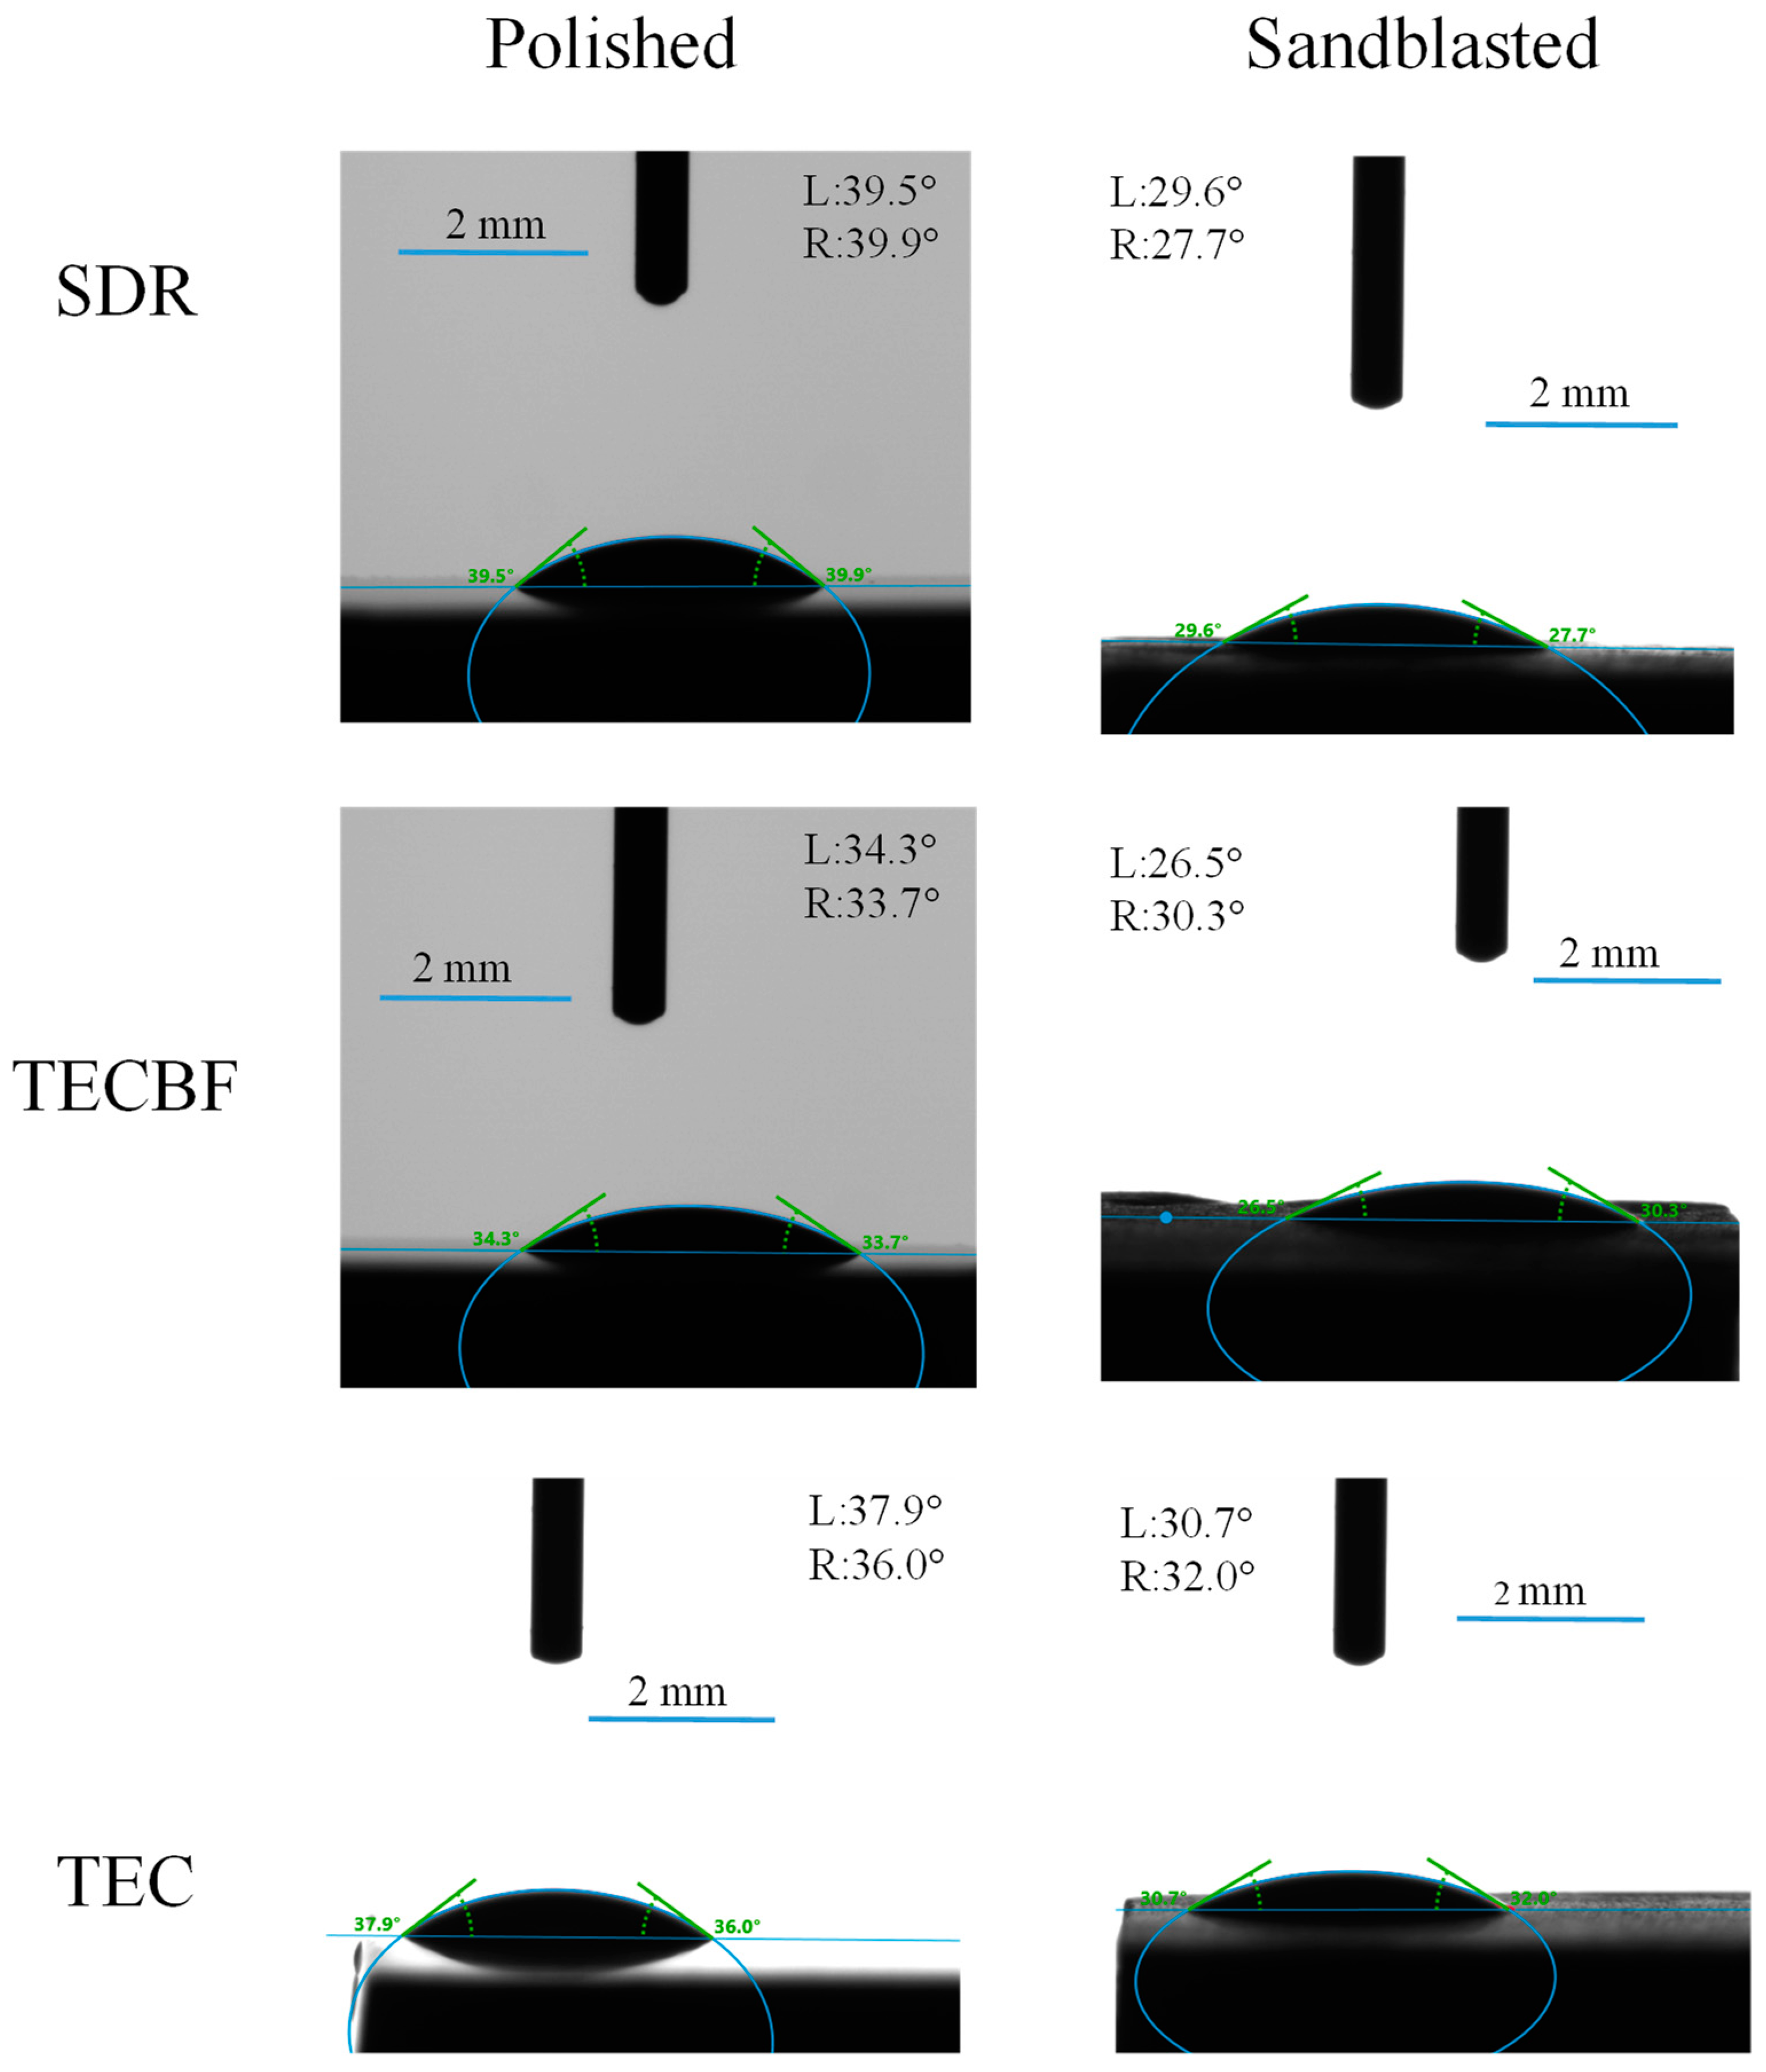
3.3. Results of Contact Angle Measurements and Surface Free Energy Calculation

The median data of water and diidomethane (DIM) test liquids’ contact angles with range on polished and sandblasted SDR, TECBF, and TEC surfaces are summarized in Figure 4.
The water contact angles were 66.88°, 79.01°, and 72.93° for polished SDR, TECBF, and TEC, respectively. On the sandblasted composite surface, the water contact angles were 77.17°, 81.59°, and 81.04° for SDR, TECBF, and TEC, respectively. The representative water contact angle pictures on polished and sandblasted SDR, TECBF, and TEC surfaces are shown in Figure 5.
Statistically, on the polished composite surface, the SDR significantly differed from TECBF and TEC (p < 0.05). Furthermore, the TECBF and TEC also significantly differed from each other in terms of water wettability. On sandblasted surfaces, the SDR repeatedly differed significantly from TECBF and TEC (p < 0.05), but the sandblasted TEC and TECBF presented similar wettability properties against water (p = 0.085).
The lowest water contact angle was shown at the SDR polished surface, and the highest one was at the TECBF sandblasted surface. This relatively high water contact angle indicated that the water behaved as a bad wetting liquid on the composite surface, resulting in rather hydrophobic surfaces of the tested composite.
The DIM contact angles were 38.32°, 34.09°, and 35.15° on polished SDR, TECBF, and TEC surfaces, respectively. The DIM contact angles were 29.11°, 26.27°, and 29.39° on sandblasted SRD, TECBF, and TEC surfaces, respectively. The representative DIM contact angle pictures on polished and sandblasted SDR, TECBF, and TEC surfaces are shown in Figure 6.
Statistical analysis revealed that the SDR differed significantly from TECBF and TEC (p < 0.05) on polished surfaces. On the sandblasted surface, the SDR significantly differed from TECBF, and TECBF significantly differed from TEC in terms of DIM contact angle. The TECBF presented the lowest DIM contact angle both on polished and sandblasted surfaces. The low DIM contact angle indicated that the non-polar DIM test liquid behaved as a good wetting liquid on composite surfaces.
To examine the effect of surface treatment, it was found that the water contact angle significantly increased, and the DIM contact angle significantly decreased due to the sandblasting at all three composites. Moreover, the DIM had significantly better wettability on composite surfaces than polar water liquid (p < 0.05)
Overall, the water and DIM contact angle analysis expressed that RBC surfaces had a hydrophobic nature because of the relatively high polar liquid and low apolar liquid contact angle measurements. The water drops behaved differently on SDR, and this bulk-fill composite was more wettable for water than TECBF and TEC. The DIM wettability also showed differences between the composite. Its wettability was lower on the SDR surface than TECBF and TEC. For DIM, the TECBF and TEC surface was more wettable than SDR.
The calculated surface free energy from contact angle measurements of water and DIM test liquids and polar and dispersed parts of SFE are presented in Figure 7.
The SFE was 49.07 ± 0.89 mJ/m2, 45.65 ± 0.66 mJ/m2, and 47.42 ± 0.71 mJ/m2 on polished SDR, TECBF, and TEC composite surfaces, respectively. On the sandblasted surface, the SFE was 48.10 ± 0.6 mJ/m2, 47.70 ± 0.46 mJ/m2, and 46.76 ± 0.53 mJ/m2 on SDR, TECBF, and TEC, respectively.
The dispersed parts of SFE were 40.46 ± 0.45 mJ/m2, 42.42 ± 0.44 mJ/m2, and 41.94 ± 0.37 mJ/m2 for polished SDR, TECBF, and TEC, respectively. For sandblasted surface, the dispersed parts of SFE were 44.61 ± 0.27 mJ/m2 at SDR, 45.69 ± 0.31 mJ/m2 at TECBF, and 44.40 ± 0.36 mJ/m2 at TEC. The polar parts of SFE on polished SDR, TECBF, and TEC surfaces were 8.62 ± 0.44 mJ/m2, 3.23 ± 0.22 mJ/m2, and 5.48 ± 0.34 mJ/m2, respectively. The polar parts of SFE on sandblasted SDR, TECBF, and TEC surfaces were 3.49 ± 0.33 mJ/m2, 2.01 ± 0.15 mJ/m2, and 2.37 ± 0.18 mJ/m2, respectively. At every RBC, the dispersed part represented higher fractions of SFE than the polar parts of it. Due to the sandblasting, the dispersed parts increased, opposing the polar parts.
The adhesive contact angle on polished and sandblasted composite surfaces is presented in Figure 8. These measured data can investigate from many aspects regarding the type of adhesive (self-etch, universal), functional molecules content of adhesive, and HEMA content of adhesives. In this study, we focused on the relationship between surface treatment and the best wettability of dental adhesive on the tested composite surface.
The contact angle of adhesives was lower on polished composite surfaces than on sandblasted surfaces. The p-values of statistical analysis are summarized in Table 3. The statistical analysis of the dental adhesive contact angle revealed that on the polished surface, the SDR differs significantly from TECBF and TEC in terms of HB, TBF II, and SU. In terms of CL and GP, SDR only differs significantly from TEC and TECBF. The SU adhesive best wets all polished composite surfaces. On polished surfaces, the HB and SU displayed significantly lower contact angles on SDR than TECBF or TEC. The TBF II displayed a significantly higher contact angle on SDR than TECBF and TEC. The wettability of CL and GP on SRD and TECBF was similar, but TEC was more wettable by these two adhesives than SDR and TECBF.
On the sandblasted surface, the SDR differs significantly from TECBF and TEC in terms of HB, TBF II, and GP. At TBF II, the TECBF and TEC differ from each other on the sandblasted surface. At SU and CL, the SDR differs from TECBF and TECBF from TEC. The solvent-free HB adhesive presented less contact angle on all sandblasted composite surfaces than on polished composites, opposing other adhesives. The TBF II presented the highest contact angles, followed by SU, CL, and GP. This tendency was observed on all sandblasted composite surfaces regardless of the chemical differences of RBCs. The HB adhesive significantly spread better on TECBF and TEC surfaces than on SDR. Between the TECBF and TEC, there were no significant differences in terms of HB wettability. The TBF II displayed the highest contact angle among the adhesives. The sandblasted TEC surface was significantly more favorable for TBF II wetting than SDR and TECBF. In the case of SU, CL, and GP, the TECBF caused a lower contact angle than SDR and TEC.
Overall, the dental adhesives displayed significantly lower contact angles on polished composite surfaces than on sandblasted surfaces (p < 0.05). The median data of adhesive contact angles moved in a smaller rank (between 16.01° and 24.98°) on the polished surface than on the sandblasted surface (between 17.13° and 35.10°). It was found that the SU has the best wettability on polished composite surfaces, and HB has on sandblasted surfaces. Due to the sandblasting, the wettability of TBF II, SU, CL, and GP deteriorated until the wettability of HB improved.

4. Discussion

To achieve a strong and durable adhesion between the old and new composite surfaces, many factors play important roles, like the chemical composition of the interface, surface morphology, and, in association with these parameters, the wettability of polymerized composite surfaces by dental adhesive. The latter is influenced by the surface roughness, surface chemistry, and surface free energy of the composite. In this study, the surface free energy of one nanohybrid (TEC) and two bulk-fill resin-based composites (SDR and TECBF) was measured after the different surface treatments (polishing and sandblasting). The surface roughness measurements of all composite surfaces revealed that the sandblasting significantly increased the roughness (Ra). Among the polished composites, the SDR presented significantly higher Ra data compared to TECBF and TEC (Figure 2). The explanation is the different filler size and their distribution in the SDR composite, which was confirmed by SEM micrographs (Figure 3). The larger filler particles in resin composite increased the inherent heterogeneity that resulted in increased roughness [25,26]. Large interfaces between particles enhance the tendency of debonding of the filler particles, and the resin matrix is exposed to a higher level of abrasion [27]. The TECBF and TEC contain closely packed smaller-sized (at nanometer scale) filler particles that prevent the resin matrix from abrasion, resulting in lower Ra data on polished surfaces [19,27]. On the sandblasted surface, the three composites did not show significant differences in terms of Ra. During the sandblasting, the high kinetic energy aluminum oxide particles hit the surface and create multiple walleyes according to the resistance of the material surface.
The water and DIM contact angles displayed significant differences on polished and sandblasted composite surfaces. The water as polar liquid presented higher contact angles on composite surfaces than DIM apolar liquid. The relatively high water contact angle and low DIM contact angle indicated that the resin composites had a hydrophobic nature. According to the previous publication, materials with contact angles above 65° can be considered highly hydrophobic, reflected in surface energy values above 30 mJ/m−2 [28]. The wettability of water and DIM displayed a change in the opposite direction as a result of surface roughening. The inherently bad wetting water did not spread well on rough surfaces until the good wetting DIM exhibited lower contact angles.
The changes in the water contact angle are partially compatible with previous findings, which stated that the water contact angle increased as the surface became rougher in the case of a hydrophobic surface [14]. The water contact angles were significantly lower on the SDR surface than on TECBF or TEC. In the aspect of water contact angle, the three composites behaved differently due to their different chemical composition. The small surface fraction that was contaminated by 5 µL the water drop contained a hydrophobic resin matrix and hydrophilic filler particles. The filler meant a better wettability for a water drop because of their higher surface free energy, which is the result of strong bonds in the bulk material. Until the resin was less wet by water because the polymer represents a small surface free energy material [27,29]. In the case of SDR, larger resin interfaces were found between the large filler particles. These two factors strongly influence the wetting ability of water on the SDR surface [27]. Large filler particles with high surface free energy and hydrophilic character were more wettable by water, resulting in a lower contact angle on SDR than TECBF and TEC. In the case of good wetting liquid, such as apolar DIM, the surface roughness decreased its contact angle. The rough surface has a larger total surface area to offer a larger wetting area, and the wettability of the surface will increase.
The SFE is important in that high SFE is desirable when adhesion is required. The SFE is calculated based on water and DIM contact angle measurements. Our SFE measured data were between 45.65 and 49.07 mJ/m2 regardless of surface treatment. The SFE of the tested composite were very close to each other and significantly did not differ from each other, which is in good agreement with the previous result [23,27,28]. The range of change was small among the composite and due to the surface treatment. Numerically, the resin-based composite can be considered a low SFE material [30]. Since the SFE is a calculated number from water and DIM contact angle measurements, it can be divided into two parts: the polar part that represents the behaviors of the surface against water and the dispersed part that has a relationship with DIM contact angles. The dispersed parts accounted for a larger part of SFE of all tested composites, similarly in good agreement with previous results. The high dispersive forces with low polar forces indicated the strong hydrophobicity of the tested composite meaning that polar liquids cannot uniformly spread and wet surfaces until the apolar liquid has good wetting ability on such surfaces [31]. In the aspect of surface free energy, the Ba-Al borosilicate and silicon dioxide filler particles are high surface energy particles; when they get close to the surface, they reduce the contact angle [29].
The wettability of dental adhesives was different on the polished and sandblasted composite surfaces. Generally, all tested dental adhesives wet the composite surfaces based on the measured low contact angles that were between 15° and 35°. The polished surfaces were more wettable for adhesives than the sandblasted surface. As previously mentioned, the sandblasting increases the Ra, which gives more opportunity for the formation of air bubbles and voids in the interface layer. These entrapped air bubbles unfavorably influenced the wetting ability and penetration of adhesives. The contact angle measurements revealed that the tested composite had a hydrophobic surface, and the surface roughening provided an increased surface area for dental adhesive. Therefore, HB, which is an apolar, solvent-free resin, spreads very well on the composite surface. The other adhesives contained different solvents, which have a more hydrophilic nature. These solvents are mostly water and alcohol, which are polar solvents, and acetone, which has an apolar character. Ethanol and water solvents can be found in TBF II, SU, and CL. The GP contained acetone next to water. Based on the contact angle of dental adhesives, it was found that the solvent-free adhesive spread better on the blasted surface than on the polished surface (Figure 8). Moreover, the solvent containing dental adhesives showed a higher contact angle due to the sandblasting, and the same pattern (TBF II > SU > CL > GP) was observed regardless of the different chemical compositions of tested RBCs. These differences can be explained by different chemical compositions of adhesives that influence their surface tension differently. Based on the measured data, solvent-free adhesives can be recommended for luting to sandblasted composite to improve micromechanical retention in the clinical situations of direct composite restoration repair and luting adhesively bonded indirect restorations. The bond strength can increase by the application of functional monomers (e.g., 10-MDP) that can form chemical bonds with components of RBCs. The other solvent-containing dental adhesives are constructed for dentin application that is a hydrophilic surface. Since the chemical bond provided by the functional molecules has a positive influencing effect, these solvent-based adhesives are used in composite repair that are designed for dentin surfaces. In this study, one drop of dental adhesive was placed on the surface without any active application (rubbing and air blowing), which provided information about the first contact between the dental adhesive and composite surface. The clinical application mode of dental adhesive could be a separate influencing factor due to the effect of improved infiltration, solvent evaporation, and chemical bond formation. The passive application mode may adversely affect the quality of the wetting and also the chemical reaction on the interface. The active rubbing, which increases the active contact surface parallel with the increased solvent evaporation and molecule approximation, may improve the quality of bonding. Not only the chemical composition but the application protocol may also deeply affect the efficacy of dental adhesives on the interface. The active rubbing parallel with the assisted evaporation of the solvent may improve both the infiltration mechanism and chemical bonding toward various substrate surfaces.
Based on the literature, sandblasting increases the surface free energy. However, our measured data showed that the mechanical treatment has no real effect on the surface free energy but increased the Ra. Despite different chemical compositions of composites, the SFE values were similar, but the dental adhesives behaved differently on polished and sandblasted composite surfaces. It follows that the surface is similar, but the adhesives wet it in a different way. This may be due to the different chemical compositions and surface tension of tested dental adhesives. The practical evaluation of this study can be that the surface and surface energy of the substrate are not always important, but the contact angles, surface tension, and chemical compositions of adhesives on the substrate surface are always important. These determine the energetic characteristics of the system, the consequence of which is the emerging bond strength.

5. Conclusions

The surface free energy calculation from the contact angle measurements is a hard task. These surfaces are always rough and heterogeneous. The applicability of the bond systems for luting to rough dental composite, the bonds with lower solvent content provide better wetting ability for micromechanical retention (e.g., composite repair). The application of functional molecules in dental adhesives can be improved by chemical interactions of the bond strengths between the different composites. The mechanical treatment increased the surface roughness, but the tested dental composites had similar SFE values. A possible explanation is the different chemical composition and surface tension of dental adhesives that may influence their wetting ability. Different properties of varying chemical components affect their ability to spread and bond to the composite surface. In practical terms, these findings suggest that dental adhesive parameters have a more important role in wettability.

Author Contributions

Conceptualization, M.S., R.M. and C.H.; methodology, M.S. and Z.S.; software, M.S.; validation, R.M., C.H. and G.J.S.; formal analysis, M.S. and R.M.; investigation, Z.S., M.S. and A.C.; resources, C.H.; data curation, C.H and G.J.S.; writing—original draft preparation, M.S.; writing—review and editing, R.M. and C.H.; visualization, M.S.; supervision, C.H.; project administration, C.H.; funding acquisition, C.H. All authors have read and agreed to the published version of the manuscript.

Funding

Project no. TKP2021-EGA-20 has been implemented with the support provided by the Ministry of Culture and Innovation of Hungary from the National Research, Development and Innovation Fund, financed under the TKP2021-EGA funding scheme.

Institutional Review Board Statement

Not applicable.

Informed Consent Statement

Not applicable.

Data Availability Statement

Data are contained within the article.

Conflicts of Interest

The authors declare no conflict of interest.

References

  1. Angerame, D.; De Biasi, M. Do Nanofilled/Nanohybrid Composites Allow for Better Clinical Performance of Direct Restorations Than Traditional Microhybrid Composites? A Systematic Review. Oper. Dent. 2018, 43, E191–E209. [Google Scholar] [CrossRef] [PubMed]
  2. Furness, A.; Tadros, M.Y.; Looney, S.W.; Rueggeberg, F.A. Effect of Bulk/Incremental Fill on Internal Gap Formation of Bulk-Fill Composites. J. Dent. 2014, 42, 439–449. [Google Scholar] [CrossRef] [PubMed]
  3. Loomans, B.A.C.; Vivan Cardoso, M.; Roeters, F.J.M.; Opdam, N.J.M.; De Munck, J.; Huysmans, M.C.D.N.J.M.; Van Meerbeek, B. Is There One Optimal Repair Technique for All Composites? Dent. Mater. 2011, 27, 701–709. [Google Scholar] [CrossRef]
  4. Özcan, M.; Pekkan, G. Effect of Different Adhesion Strategies on Bond Strength of Resin Composite to Composite-Dentin Complex. Oper. Dent. 2013, 38, 63–72. [Google Scholar] [CrossRef] [PubMed]
  5. Rudawska, A.; Danczak, I.; Müller, M.; Valasek, P. The Effect of Sandblasting on Surface Properties for Adhesion. Int. J. Adhes. Adhes. 2016, 70, 176–190. [Google Scholar] [CrossRef]
  6. Puleio, F.; Rizzo, G.; Nicita, F.; Lo Giudice, F.; Tamà, C.; Marenzi, G.; Centofanti, A.; Raffaele, M.; Santonocito, D.; Risitano, G. Chemical and Mechanical Roughening Treatments of a Supra-Nano Composite Resin Surface: SEM and Topographic Analysis. Appl. Sci. 2020, 10, 4457. [Google Scholar] [CrossRef]
  7. de Souza, M.O.; Leitune, V.C.B.; Rodrigues, S.B.; Samuel, S.M.W.; Collares, F.M. One-Year Aging Effects on Microtensile Bond Strengths of Composite and Repairs with Different Surface Treatments. Braz. Oral Res. 2017, 31, e4. [Google Scholar] [CrossRef]
  8. Rathke, A.; Tymina, Y.; Haller, B. Effect of Different Surface Treatments on the Composite-Composite Repair Bond Strength. Clin. Oral Investig. 2009, 13, 317–323. [Google Scholar] [CrossRef]
  9. Pilo, R.; Brosh, T.; Geron, V.; Levartovsky, S.; Eliades, G. Effect of Silane Reaction Time on the Repair of a Nanofilled Composite Using Tribochemical Treatment. J. Adhes. Dent. 2016, 18, 125–134. [Google Scholar] [CrossRef]
  10. Yoshida, Y.; Yoshihara, K.; Hayakawa, S.; Nagaoka, N.; Okihara, T.; Matsumoto, T.; Minagi, S.; Osaka, A.; Van Landuyt, K.; Van Meerbeek, B. HEMA Inhibits Interfacial Nano-Layering of the Functional Monomer MDP. J. Dent. Res. 2012, 91, 1060–1065. [Google Scholar] [CrossRef]
  11. Carrilho, E.; Cardoso, M.; Ferreira, M.M.; Marto, C.M.; Paula, A.; Coelho, A.S. 10-MDP Based Dental Adhesives: Adhesive Interface Characterization and Adhesive Stability-A Systematic Review. Material 2019, 12, 790. [Google Scholar] [CrossRef]
  12. Zhao, Z.; Wang, Q.; Zhao, J.; Zhao, B.; Ma, Z.; Zhang, C. Adhesion of Teeth. Front. Mater. 2021, 7, 615225. [Google Scholar] [CrossRef]
  13. da Costa, T.R.F.; Serrano, A.M.; Atman, A.P.F.; Loguercio, A.D.; Reis, A. Durability of Composite Repair Using Different Surface Treatments. J. Dent. 2012, 40, 513–521. [Google Scholar] [CrossRef] [PubMed]
  14. Namen, F.; Galan, J., Jr.; de Oliveira, J.F.; Cabreira, R.D.; Costa e Silva Filho, F.; Souza, A.B.; de Deus, G. Surface Properties of Dental Polymers: Measurements of Contact Angles, Roughness and Fluoride Release. Mater. Res. 2008, 11, 239–243. [Google Scholar] [CrossRef]
  15. Meiron, T.S.; Marmur, A.; Saguy, I.S. Contact Angle Measurement on Rough Surfaces. J. Colloid Interface Sci. 2004, 274, 637–644. [Google Scholar] [CrossRef] [PubMed]
  16. Liber-Kneć, A.; Łagan, S. Surface Testing of Dental Biomaterials—Determination of Contact Angle and Surface Free Energy. Materials 2021, 14, 2716. [Google Scholar] [CrossRef] [PubMed]
  17. Kaelble, D.H. Dispersion-Polar Surface Tension Properties of Organic Solids. J. Adhes. 2008, 2, 66–81. [Google Scholar] [CrossRef]
  18. St-Pierre, L.; Martel, C.; Crépeau, H.; Vargas, M. Influence of Polishing Systems on Surface Roughness of Composite Resins: Polishability of Composite Resins. Oper. Dent. 2019, 44, E122–E132. [Google Scholar] [CrossRef]
  19. Aytac, F.; Karaarslan, E.S.; Agaccioglu, M.; Tastan, E.; Buldur, M.; Kuyucu, E. Effects of Novel Finishing and Polishing Systems on Surface Roughness and Morphology of Nanocomposites. J. Esthet. Restor. Dent. 2016, 28, 247–261. [Google Scholar] [CrossRef]
  20. Martos, R.; Hegedüs, V.; Szalóki, M.; Blum, I.R.; Lynch, C.D.; Hegedüs, C. A Randomised Controlled Study on the Effects of Different Surface Treatments and Adhesive Self-Etch Functional Monomers on the Immediate Repair Bond Strength and Integrity of the Repaired Resin Composite Interface. J. Dent. 2019, 85, 57–63. [Google Scholar] [CrossRef]
  21. Martos, R.; Szalóki, M.; Gáll, J.; Csík, A.; Hegedűs, C. Comparative Analysis of Bond Strength Durability of 10-Methacryloyloxydecyl Dihydrogen Phosphate-Containing Adhesives on a Low-Viscosity Bulk-Fill Composite Surface. J. Adhes. Dent. 2022, 24, 427–434. [Google Scholar] [CrossRef]
  22. Blum, I.R.; Martos, R.; Szalóki, M.; Lynch, C.D.; Hegedűs, C. Effects of Different Surface Treatments and Adhesive Self-Etch Functional Monomers on the Repair of Bulk Fill Composites: A Randomised Controlled Study. J. Dent. 2021, 108, 103637. [Google Scholar] [CrossRef] [PubMed]
  23. Silikas, N.; Kavvadia, K.; Eliades, G.; Watts, D. Surface Characterization of Modern Resin Composites: A Multitechnique Approach. Am. J. Dent. 2005, 18, 95–100. [Google Scholar] [PubMed]
  24. Erdman, N.; Bell, D.C.; Reichelt, R. Scanning Electron Microscopy. In Springer Handbook of Microscopy; Springer Handbooks; Hawkes, P.W., Spence, J.C.H., Eds.; Springer: Cham, Switzerland, 2019; pp. 229–318. [Google Scholar] [CrossRef]
  25. Ryba, T.M.; Dunn, W.J.; Murchison, D.F. Surface Roughness of Various Packable Composites. Oper. Dent. 2002, 27, 243–247. [Google Scholar]
  26. Marghalani, H.Y. Effect of Filler Particles on Surface Roughness of Experimental Composite Series. J. Appl. Oral Sci. 2010, 18, 59–67. [Google Scholar] [CrossRef]
  27. Ishii, R.; Takamizawa, T.; Tsujimoto, A.; Suzuki, S.; Imai, A.; Barkmeier, W.W.; Latta, M.A.; Miyazaki, M. Effects of Finishing and Polishing Methods on the Surface Roughness and Surface Free Energy of Bulk-Fill Resin Composites. Oper. Dent. 2020, 45, E91–E104. [Google Scholar] [CrossRef]
  28. Tulumbaci, F.; Korkut, E.; Ozer, H.; Özcan, M. Evaluation of Wettability Characteristics and Adhesion of Resin Composite to Photo-Polymerized Pulp-Capping Materials with and without Bioactive Glass. Braz. Dent. Sci. 2019, 22, 335–343. [Google Scholar] [CrossRef]
  29. Namen, F.M.; Ferrandini, E.; Galan, J. Surface Energy and Wettability of Polymers Light-Cured by Two Different. J. Appl. Oral Sci. 2011, 19, 517. [Google Scholar] [CrossRef] [PubMed]
  30. Asmussen, E.; Peutzfeldt, A. Resin Composites: Strength of the Bond to Dentin versus Surface Energy Parameters. Dent. Mater. 2005, 21, 1039–1043. [Google Scholar] [CrossRef] [PubMed]
  31. Dos Santos, E.A.; Farina, M.; Soares, G.A.; Anselme, K. Surface Energy of Hydroxyapatite and Beta-Tricalcium Phosphate Ceramics Driving Serum Protein Adsorption and Osteoblast Adhesion. J. Mater. Sci. Mater. Med. 2008, 19, 2307–2316. [Google Scholar] [CrossRef] [PubMed]
Figure 1. Teflon mold scheme with dimensions for (A) bulk-fill composite samples (SDR and TECBF) and (B) nanohybrid (TEC) sample preparation.
Applsci 13 12061 g001
Figure 2. Box plot diagram of Ra (nm) data on polished and sandblasted SDR, TECBF, and TEC surfaces (* p < 0.05).
Applsci 13 12061 g002
Figure 3. Scanning electron microscopy (SEM) micrographs from polished and sandblasted SDR, TECBF, and TEC composite surfaces.
Applsci 13 12061 g003
Figure 4. Box plot diagram of water and diiodomethane (DIM) contact angles on polished (PO) and sandblasted (SB) SDR, TECBF, and TEC surfaces (* p < 0.05).
Applsci 13 12061 g004
Figure 5. Representative images of water drops on polished and sandblasted SDR, TECBF, and TEC surfaces indicating the left (L) and right (R) contact angles.
Applsci 13 12061 g005
Figure 6. Representative images of diidomethane (DIM) drops on polished and sandblasted SDR, TECBF, and TEC surfaces indicating the left (L) and right (R) contact angles.
Applsci 13 12061 g006
Figure 7. OWRK model-based calculated surface free energy (SFE) of SDR, TECBF, and TEC RBCs, indicating the disperse and polar fraction of SFE.
Applsci 13 12061 g007
Figure 8. Box plot diagram of Heliobond (HB), Tokuyama Bond Force II (TBF II), Scotchbond Universal (SU), Clearfil Universal Bond Quick (CL), and G-Premio Bond (GP) contact angles on polished (PO) and sandblasted (SB) SDR, TECBF, and TEC surfaces.
Applsci 13 12061 g008
Table 1. Composite materials used in this study (Bis-GMA: Bisphenol A-diglycidyl dimethacrylate), UDMA: Urethane dimethacrylate, Bis-EMA: Ethoxylated bisphenol A dimethacrylate, CQ: Camphorquinone, Lucirin TPO: 2,4,6-Trimethylbenzoyldiphenylphosphine oxide, BHT: butyl hydroxytoluene, YbF3: ytterbium trifluoride.
CodeSDRTECBFTEC
Full nameSmart Dentin ReplacementTetric EvoCeram Bulk-FillTetric EvoCeram
ManufacturerDentsply Sirona, Milford, DE, USAIvoclar Vivadent, Shaan, LichtensteinIvoclar Vivadent, Shaan, Lichtenstein
LOT number1806000584X25116LOT Y22007
CompositionSDR Patented UDMA, TEGDMA, Bis-EMA, CQ, BHT, UV stabilizer, titanium dioxide, and iron oxide pigments fluorescent agent fillers: nanoparticles 68 wt% 44 vol% Ba-Al-F-B-silicate glass, Sr-Al-F-silicate glass 4.2 μm agglomerate of 0.8 μm [22]Resin: 20–21 wt% dimethacrylates (Bis-GMA, UDMA, Bis-EMA),
Filler: Barium-alumino-fluoro-silica, YbF3, spherical mixed oxide, glass filler, prepolymer fillers, filler 80 wt% (17% prepolymer) 60 vol% 40–3000 nm, average: 550 nm
Additional contents are additives, catalysts, stabilizers, and pigments (<1.0% weight) [22]
Resin: 17–18% weight Bis-GMA, UDMA, Bis-
EMA and CQ + Lucirin TPO photoinitiators, stabilizers
Filler: 48.5 wt% Barium aluminum silicate glass fillers with size between 40–3000 nm mean particle size of 550 nm 34 wt% ground prepolymers with fillers, YbF3, mixed oxide (macro-filler dimension) [20]
Applied thickness4 mm4 mm2 mm
Table 2. Adhesive materials used in this study (Bis-GMA: Bisphenol A-diglycidyl dimethacrylate), TEGDMA: Triethylene glycol dimethacrylate, 3D-SR phosphate monomer: 3D self-reinforcing monomer (a modified MDP molecule), HEMA: 2-Hydroxylethyl methacrylate, 10-MDP: 10-methacryloyloxydecyl dihydrogen phosphate, DCDMA: 10-decamethylene dimethacrylate, EDMAB: ethyl-4-(dimethylamino)benzoate, MPTMS: γ-methacyloxypropyl trimethoxysilane, DMAEMA: 2-(dimethyl amino)ethyl methacrylate, VCP: Vitrebond copolymer (copolymer of acrylic and itaconic acid), NaF: sodium fluoride, 4-MET: 4-methacryloyloxy ethyl trimellitic acid, MDTP: methacryloyloxydecyl dihydrogen thiophosphate, CQ: Camphorquinone).
CodeHBTBF IISUCLGP
Full nameHeliobondTokuyama Bond Force IIScotchbond UniversalClearfil Universal Bond QuickG-Premio Bond
ManufacturerIvoclar Vivadent, Shaan, LichtensteinTokuyama Dental, Tokyo, Japan3M Oral Care, St Paul, MN, USAKuraray Noritake, Tokyo, JapanGC, Tokyo, Japan
LOT numberX1050809780409A3K02061906121012687
CompositionBis-GMA 59.5 wt%, TEGDMA 39.7 wt%, CQ, stabilizers and catalysts 0.8 wt% [21]3D-SR phosphate monomer, HEMA, Bis-GMA, TEGDMA, water, alcohol, CQ, catalyst [21]10-MDP, Bis-GMA, DCDMA, EDMAB, MPTMS, DMAEMA, VCP, HEMA, ethanol, water, CQ, treated silica
[21]
10-MDP, Bis-GMA, HEMA, hydrophilic amid methacrylate, MPTMS, colloidal silica, NaF, CQ, ethanol, and water [21]10-MDP, 4-MET, MDTP, methacrylic acid ester, silica, catalyst, photoinitiator, acetone, water [21]
Table 3. Statistical p-value for composite pair comparison at a given surface treatment and applied adhesive.
Surface Treatment
PolishedHBSDRTECBF
TECBF0.003
TEC0.0030.999
TBF IISDRTECBF
TECBF0.017
TEC˂0.0010.017
SUSDRTECBF
TECBF˂0.001
TEC0.0010.999
CLSDRTECBF
TECBF0.334
TEC˂0.0010.002
GPSDRTECBF
TECBF0.582
TEC0.0460.004
SandblastedHBSDRTECBF
TECBF˂0.001
TEC˂0.0010.999
TBF IISDRTECBF
TECBF0.031
TEC˂0.0010.021
SUSDRTECBF
TECBF0.001
TEC0.8130.009
CLSDRTECBF
TECBF˂0.001
TEC0.1560.008
GPSDRTECBF
TECBF˂0.001
TEC0.0010.813
Disclaimer/Publisher’s Note: The statements, opinions and data contained in all publications are solely those of the individual author(s) and contributor(s) and not of MDPI and/or the editor(s). MDPI and/or the editor(s) disclaim responsibility for any injury to people or property resulting from any ideas, methods, instructions or products referred to in the content.

