1. Introduction
Soil classification systems are very crucial to the description and identification of soils. The utilization of the same soil classification principles among engineers all over the world can help efforts to understand, define, and interpret material and results. A soil classification system aims to facilitate communication between different groups of engineers. Engineers use soil classification surveys to determine the potential behavior and limitations of soil. At present, the soil classification systems of different countries vary significantly according to sieve sets, the diameter sizes of particles, and their percentage of total mass. A series of soil classification systems have been proposed across the world on the basis of grain size distribution. The first classification system based on soil texture was proposed by Atterberg [
1,
2]. Casagrande [
3] developed a classification and identification system based on grain size distribution called the Airfield classification system for soils in the early 1940s. The Unified Soil Classification System is one of the most widely used systems in the world and is in accordance with the US standard ASTM D2487 [
4]. The AASHTO (American Association of State Highway and Transportation Officials) classification system [
5] is well-known in road works. Soil classification systems are based on the standards of the respective countries. As such, in India, there is the Indian Standard [
6]; in Australia, there is the Australian Standard [
7]; in the United Kingdom, there is the British Standard [
8]; in China, there is the Chinese Standard [
9]; in Japan, there is the Japanese Standard [
10]; and in Germany, there is DIN [
11], to name only a few. These standards are used in geotechnical investigations. Some have since been withdrawn, while some have had some changes to improve the description of the material.
Recently, there have been some studies using different methods to classify the soils. Quisenberry et al. [
12] developed a soil classification system for describing water and chemical transport in South Carolina. The system was based on surface texture, clay mineralogy, and the nature of the soil structure. Numerous field experiments were carried out to test the classification system. Cal [
13] tried to provide a quantitative soil classification based on plasticity index, liquid limit, and clay content using a neural network. The results show that neural networks can be used for the prediction of soil classification. Dundulis et al. [
14] assessed the similarities and differences between sand soils according to their grain size distribution using different classification systems. Kovačević and Jurić-Kaćunić [
15] proposed a soil classification system based on EN ISO 14688-1:2002 [
16] and EN ISO 14688-2:2004 [
17]. A different marking system was applied with this classification system according to these standards. In this method, the symbolization starts with a secondary fraction and with small letters. Park and Santamarina [
18] proposed a revised soil classification system for engineering applications. The study included data-based gravimetric and volumetric analyses to anticipate fines and sand fraction thresholds. The study focused on the physical properties of soil mixtures. Kovačević et al. [
19] proposed a soil classification system in 2014 and they developed it because of the novelties of identification and description in EN ISO 14688-1:2018 [
20] and EN ISO 14688-2:2018 [
21]. Moreno-Maroto et al. [
22] compared six different classification systems for fine-grained soils. After reviewing these classification systems, a chronological order was obtained. Pham et al. [
23] focused on a new model for the prediction of soil classification. To generate these models, tests were performed on 440 specimens in order to determine the type of soil. Clay content, moisture content, specific gravity, void ratio, plastic, and liquid limit were used for the construction of the model. An algorithm called AdaBoost was employed to classify the soil. The results show that only 11 samples were not correctly identified among the 88 total data.
After EN ISO 14688-2:2018 [
21] came into force, national classification systems (e.g., TS 1500 [
24]) were withdrawn in CEN countries and EN ISO 14688-2:2018 [
21] became practically unusable in countries without a compatible national standard. Therefore, there is no approach capable of providing a group name and group symbol to define soil in detail in geotechnical engineering applications in these countries. Thus, it is intended to make this standard practically usable. In this study, a practical and useful group symbol and group name marking approach is proposed. This approach is not a classification method or a standard. The objective of this study is to utilize EN ISO 14688-2:2018 [
21] in practical engineering applications. The method considers EN ISO 14688-2:2018 [
21] and it is supported by ASTM D2487-17e1 [
25]. EN ISO 14688-2:2018 [
21] gives a general identification for soils. To overcome this generalized identification for geotechnical engineering purposes, the study presented here proposes a novel approach. Because identifying and classifying soil is the first step in designing projects, EN ISO 14688-2:2018 [
21] and ASTM D2487-17e1 [
25] were assessed separately and used to develop this new marking method.
There are very limited studies in the literature [
15,
19] that include approaches the standards that cannot be used in practice. The study presented herein proposes an approach where the grain boundary values are clarified, and it is made clear what they are based on, as opposed to the general applicability allowed by EN ISO 14688-2:2018 [
21].
3. Practical Group Symbol and Group Name Approach (PSNA)
Identifying and classifying soil is the first step in designing engineering projects. In this study, a soil marking method called the Practical Group Symbol and Group Name Approach (PSNA) was proposed along the lines of EN ISO 14688-2:2018 [
21]. Not only did this method consider EN ISO 14688-2:2018, it was supported with ASTM D2487-17e1 [
25] for the logical principles of classification and symbolization. The idea of assigning names and symbols to soil particles based on two standards emerged due to the limitations of EN ISO 14688-2:2018, which provides a general classification of soil grains but lacks detailed group names and numbers. EN ISO 14688-2:2018 does not provide specific ratios and explanations to determine precise classifications in practical applications. Therefore, to overcome these obstacles, a novel, comprehensive, and practical group symbol and group name marking method was proposed in this study. A practical and effective naming and symbolizing method should provide the boundaries of the particles clearly by assessing the soil mass precisely. The EN ISO 14688-2:2018 standard offers a comprehensive overview of soil principles, focusing on the general characteristics of soils rather than providing specific group symbols and names for classification. In other words, it does not provide an exhaustive and detailed classification. To fill this technical and practical gap in the literature, PSNA was proposed. However, PSNA is not a classification system or a standard. Therefore, in order to accurately apply EN ISO 14688-2:2018, it is necessary to obtain precise percentages of grain size boundaries and identify soil particles. In this regard, the utilization of ASTM D2487-17e1 proved beneficial.
After EN ISO 14688-2:2018 came into force, national classification systems were withdrawn in CEN countries and EN ISO 14688-2:2018 became practically unusable in countries without a national standard compatible with EN ISO 14688-2:2018. The absence of national standards in numerous European countries rendered of EN ISO 14688-2:2018 inadequate to the task of providing a comprehensive classification of soil in geotechnical applications. The lack of a detailed definition and classification of soils presents a significant obstacle in accurately identifying and resolving soil-related issues in geotechnical applications. This situation places experts in a difficult position as they are unable to effectively and thoroughly address these problems. The more detailed the classification is, the more precise the data a project generates. In this study, C
u and C
c were used to describe coarse particles for five subgroups, and plasticity was employed to describe fine particles for four subgroups according to EN ISO 14688-2:2018. However, ASTM D2487-17e1 is based on only two subgroups such as “well and poorly graded” and “low and high”. If the detail for the classification increases, the geotechnical behavior of the material can be caught with greater ease. Soils are divided into two main categories, namely, cohesionless and cohesive. The behavior of cohesionless soils is different from that of cohesive soils and the distinction between these soils is not the same as that between fine-grained and coarse-grained soil made in the standards. For example, some coarse-grained soils according to ASTM D2487-17e1 such as SC (clayey sand) behave as cohesive soils because of their fine content, especially if the fine quality is derived from clay [
28,
29,
30,
31]. A similar assessment is valid for the liquefaction phenomenon. Sand-type soils are susceptible to liquefaction [
32]. However, parameters such as fine-grained percentages, the plasticity behavior of fines, and the grading shape of coarse material affect liquefaction potential [
33,
34,
35,
36,
37]. Therefore, each type of sand does not liquefy. Therefore, the approach presented here facilitates the description of the materials in detail. In geotechnical applications, providing a comprehensive account of soils contributes to the process of decision-making.
EN ISO 14688-2:2018 designates symbols for particles such as Cl for clay, Si for silt, Sa for sand, and Gr for gravel. These same symbols were used as the initial two letters of identification in this study but were insufficient to mark the soil mixtures properly. Soil particles were classified and marked with group symbols properly using EN ISO 14688-2:2018 and ASTM D2487-17e1 together, the idea being to develop an approach where EN ISO 14688-2:2018 can be used in practice. The study is based on EN ISO 14688-2:2018. In accordance with this line of reasoning, the utilization of EN ISO 14688-2:2018 was employed to establish precise delineations and definitions of grain particle boundaries. However, in cases where EN ISO 14688-2:2018 fails to adequately define soil grains or where the division of grains is not feasible, ASTM D2487-17e1 was employed. This is because the current state of EN ISO 14688-2:2018 does not allow for the detailed classification of grains.
According to EN ISO 14688-2:2018, a group symbol (ClL, SiM, etc.) can be assigned to fine-grained soils from the plasticity chart. Nevertheless, this standard does not include any specific details regarding the required percentages of fine grains that a sample must contain to be classified as fine-grained. According to
Table 1 of the EN ISO 14688-1 standard, which is also utilized by the EN ISO 14688-2:2018 standard, the group symbols Gr and Sa are designated for Gravel and Sand, respectively. However, the specific percentages of coarse grains necessary for soil to be classified as coarse-grained are not specified. Furthermore, while classifying the mixed materials, the percentage of the secondary fraction is not specified. Hence, it is not feasible to conduct a comprehensive classification using this particular standard. Hence, a novel approach was required to define the soil in detail and thus PSNA was developed.
According to EN ISO 14688-2:2018, the classification of very coarse material should be performed on that material alone. Additionally, it is asserted that coarse and fine material should be classified together. Therefore, coarse and fine materials were classified together in this study. According to PSNA, the soil was divided into coarse, fine, and organic particles.
In this study, the proposed method was used to explain coarse, fine, and organic materials in three sections. The first section includes the identification and final marking of coarse material (gravel and sand), the second section includes the identification and final marking of fine material (silt and clay), and the third section includes organic material. The determination of particle size boundaries for PSNA was conducted using the data provided in
Table 1.
Initially, a determination was made regarding the granular composition of the soil material, which was classified as either coarse or fine. According to EN ISO 14688-2:2018, there is a 0.063 mm (No. 230 sieve) boundary size between coarse and fine material. Nevertheless, the standard EN ISO 14688-2:2018 lacks a comprehensive explanation regarding the inclusion of percentage ratios and the specific criteria used to delineate the boundaries between coarse and fine materials. The application of the ASTM D2487-17e1 methodology involved the utilization of logical reasoning to initially separate the coarse and fine materials. For this purpose, if more than 50% of total soil particles were retained on 0.063 mm, a material was defined as coarse. Alternatively, if 50% and more than 50% of the total soil particles passed through a sieve opening of 0.063 mm (No. 230 sieve), the material was defined as fine. The boundary between coarse and fine materials, defined by EN ISO 14688-2:2018 at a size of 0.063 mm, was utilized in this study. This standard differs from the classification specified in ASTM D2487-17e1 which employs a No. 200 sieve to establish a 0.075 mm boundary between particles of coarse and fine sizes.
3.1. PSNA for Coarse Material
In this section, the process of categorizing and marking group symbols and group names of gravel and sand was conducted. The classification of coarse material primarily includes gravel and sand particles and secondarily fine particles such as silt and clay.
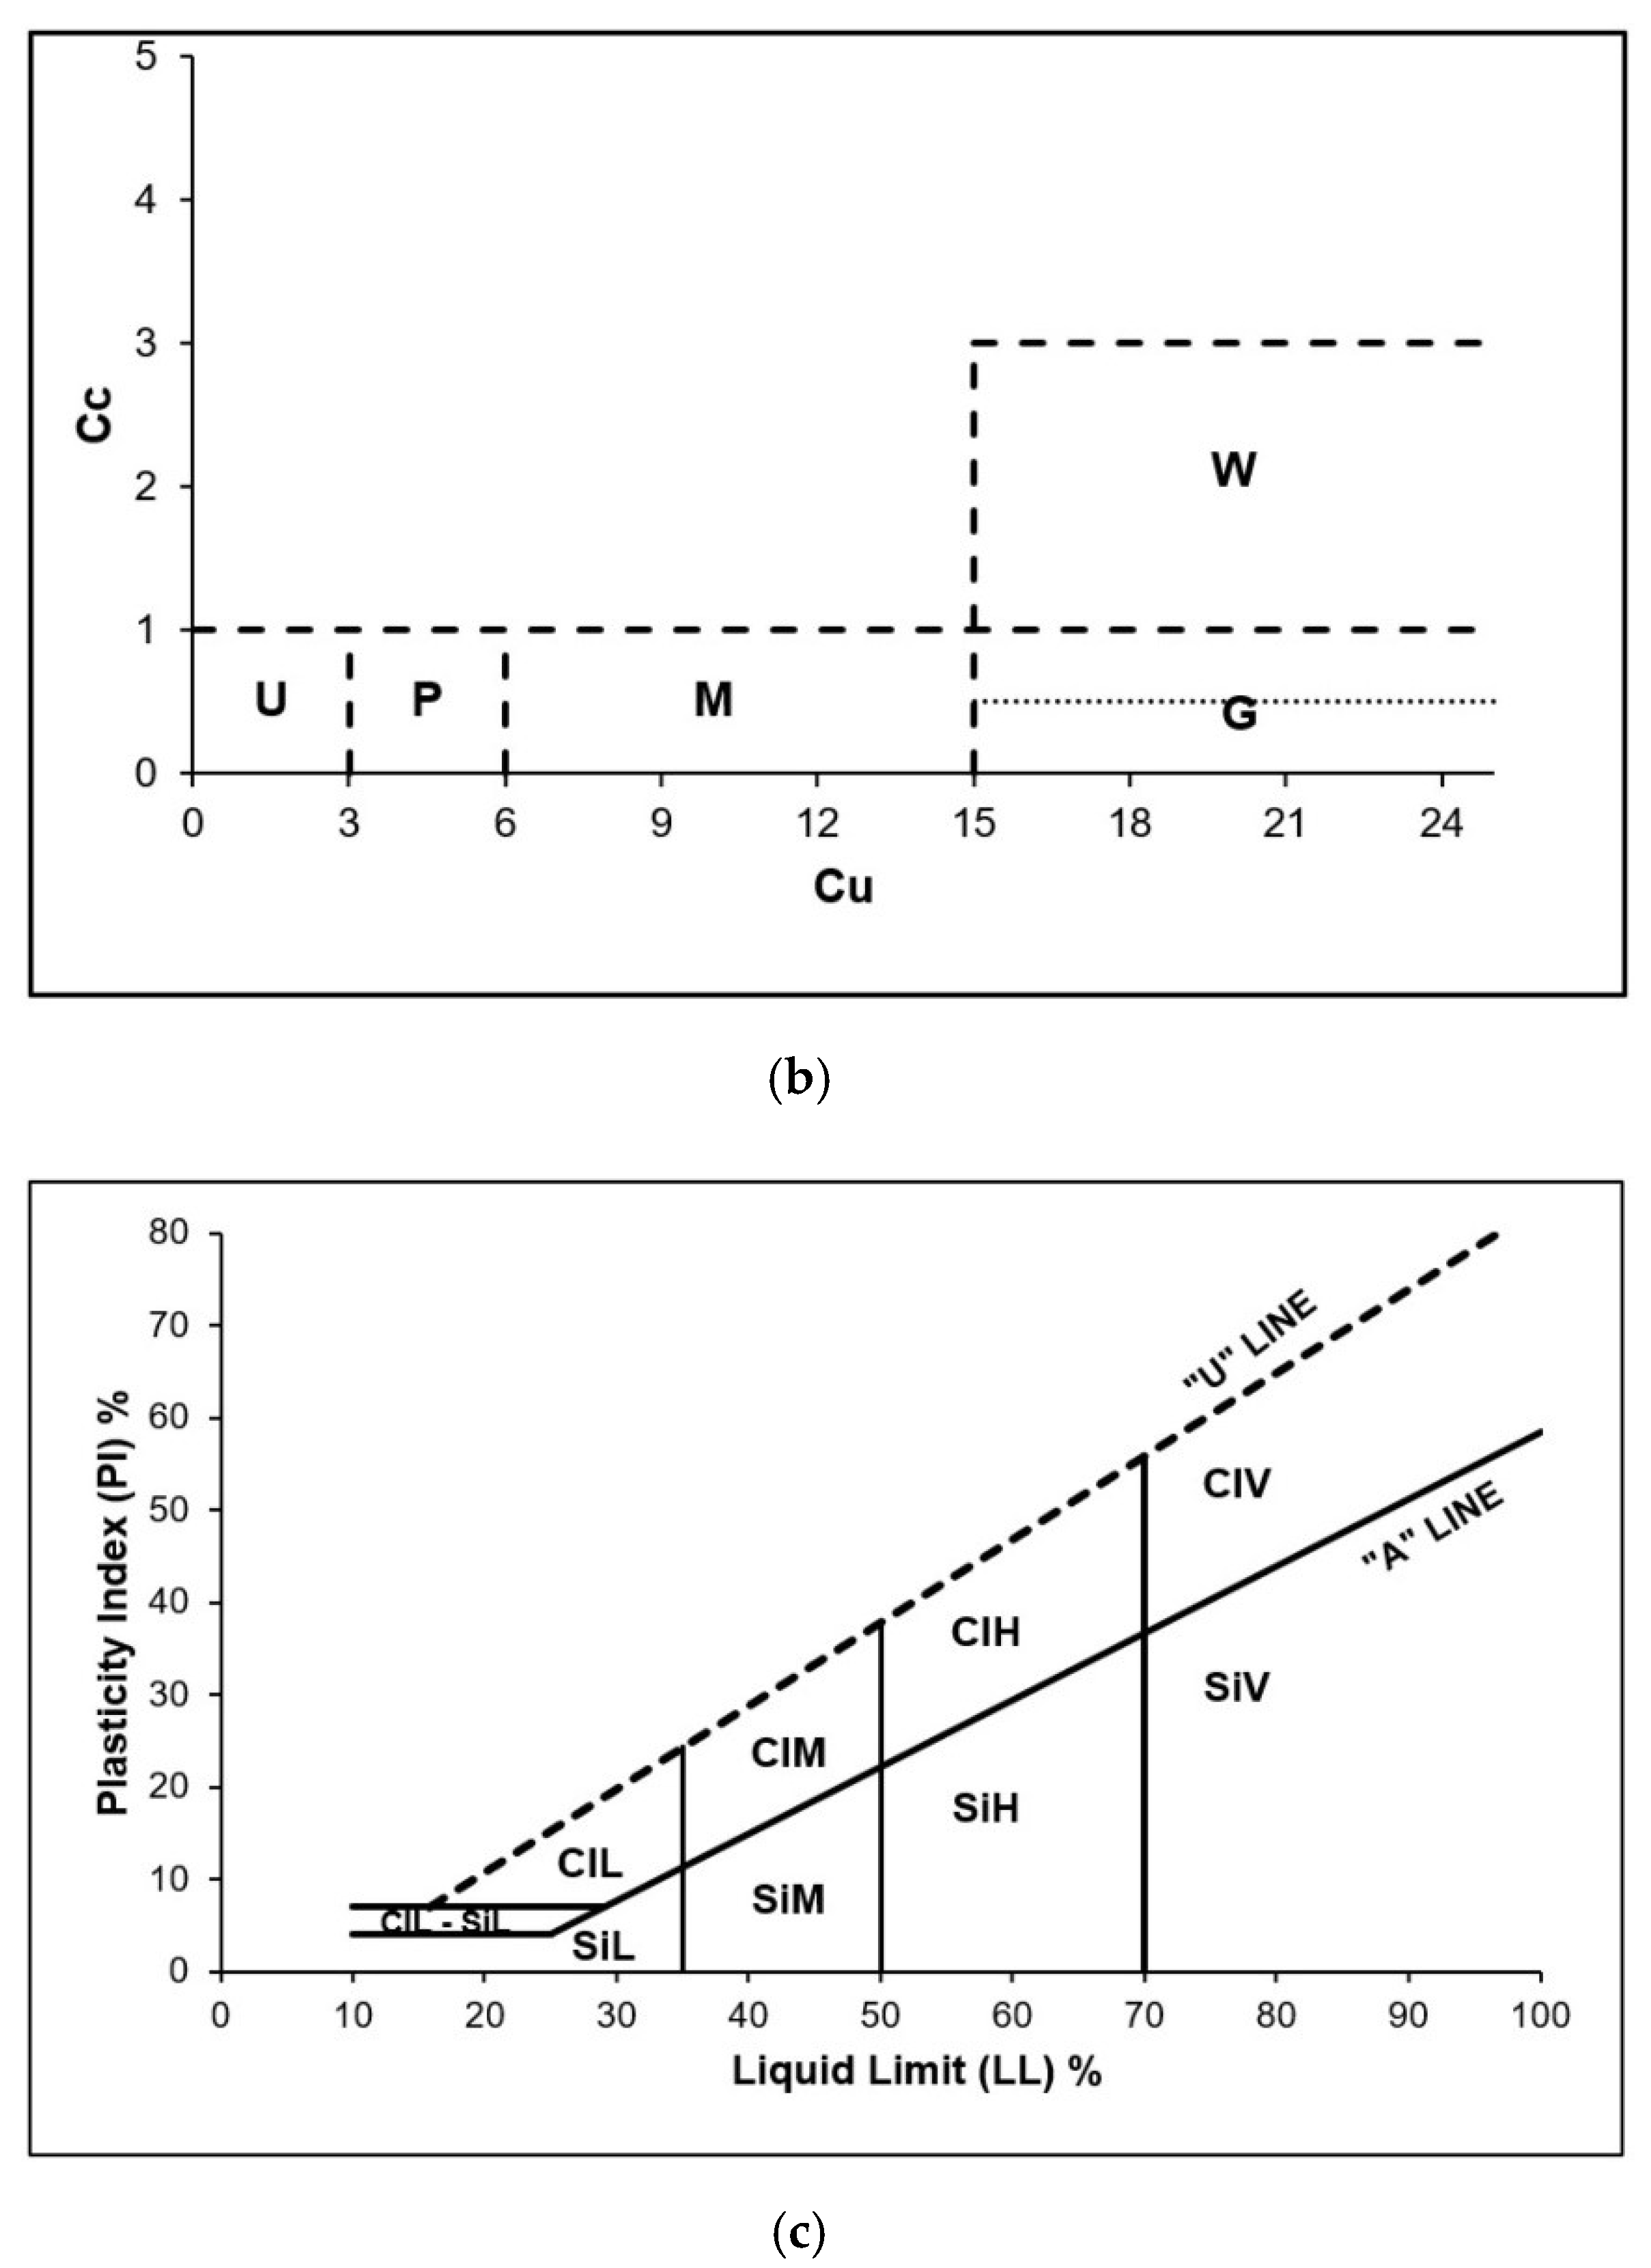
C
u and C
c were also employed for the grading of coarse material (
Table 2) and a plasticity chart was used to define fine particles in coarse material according to EN ISO 14688-2:2018 (
Figure 1 and
Table 3).
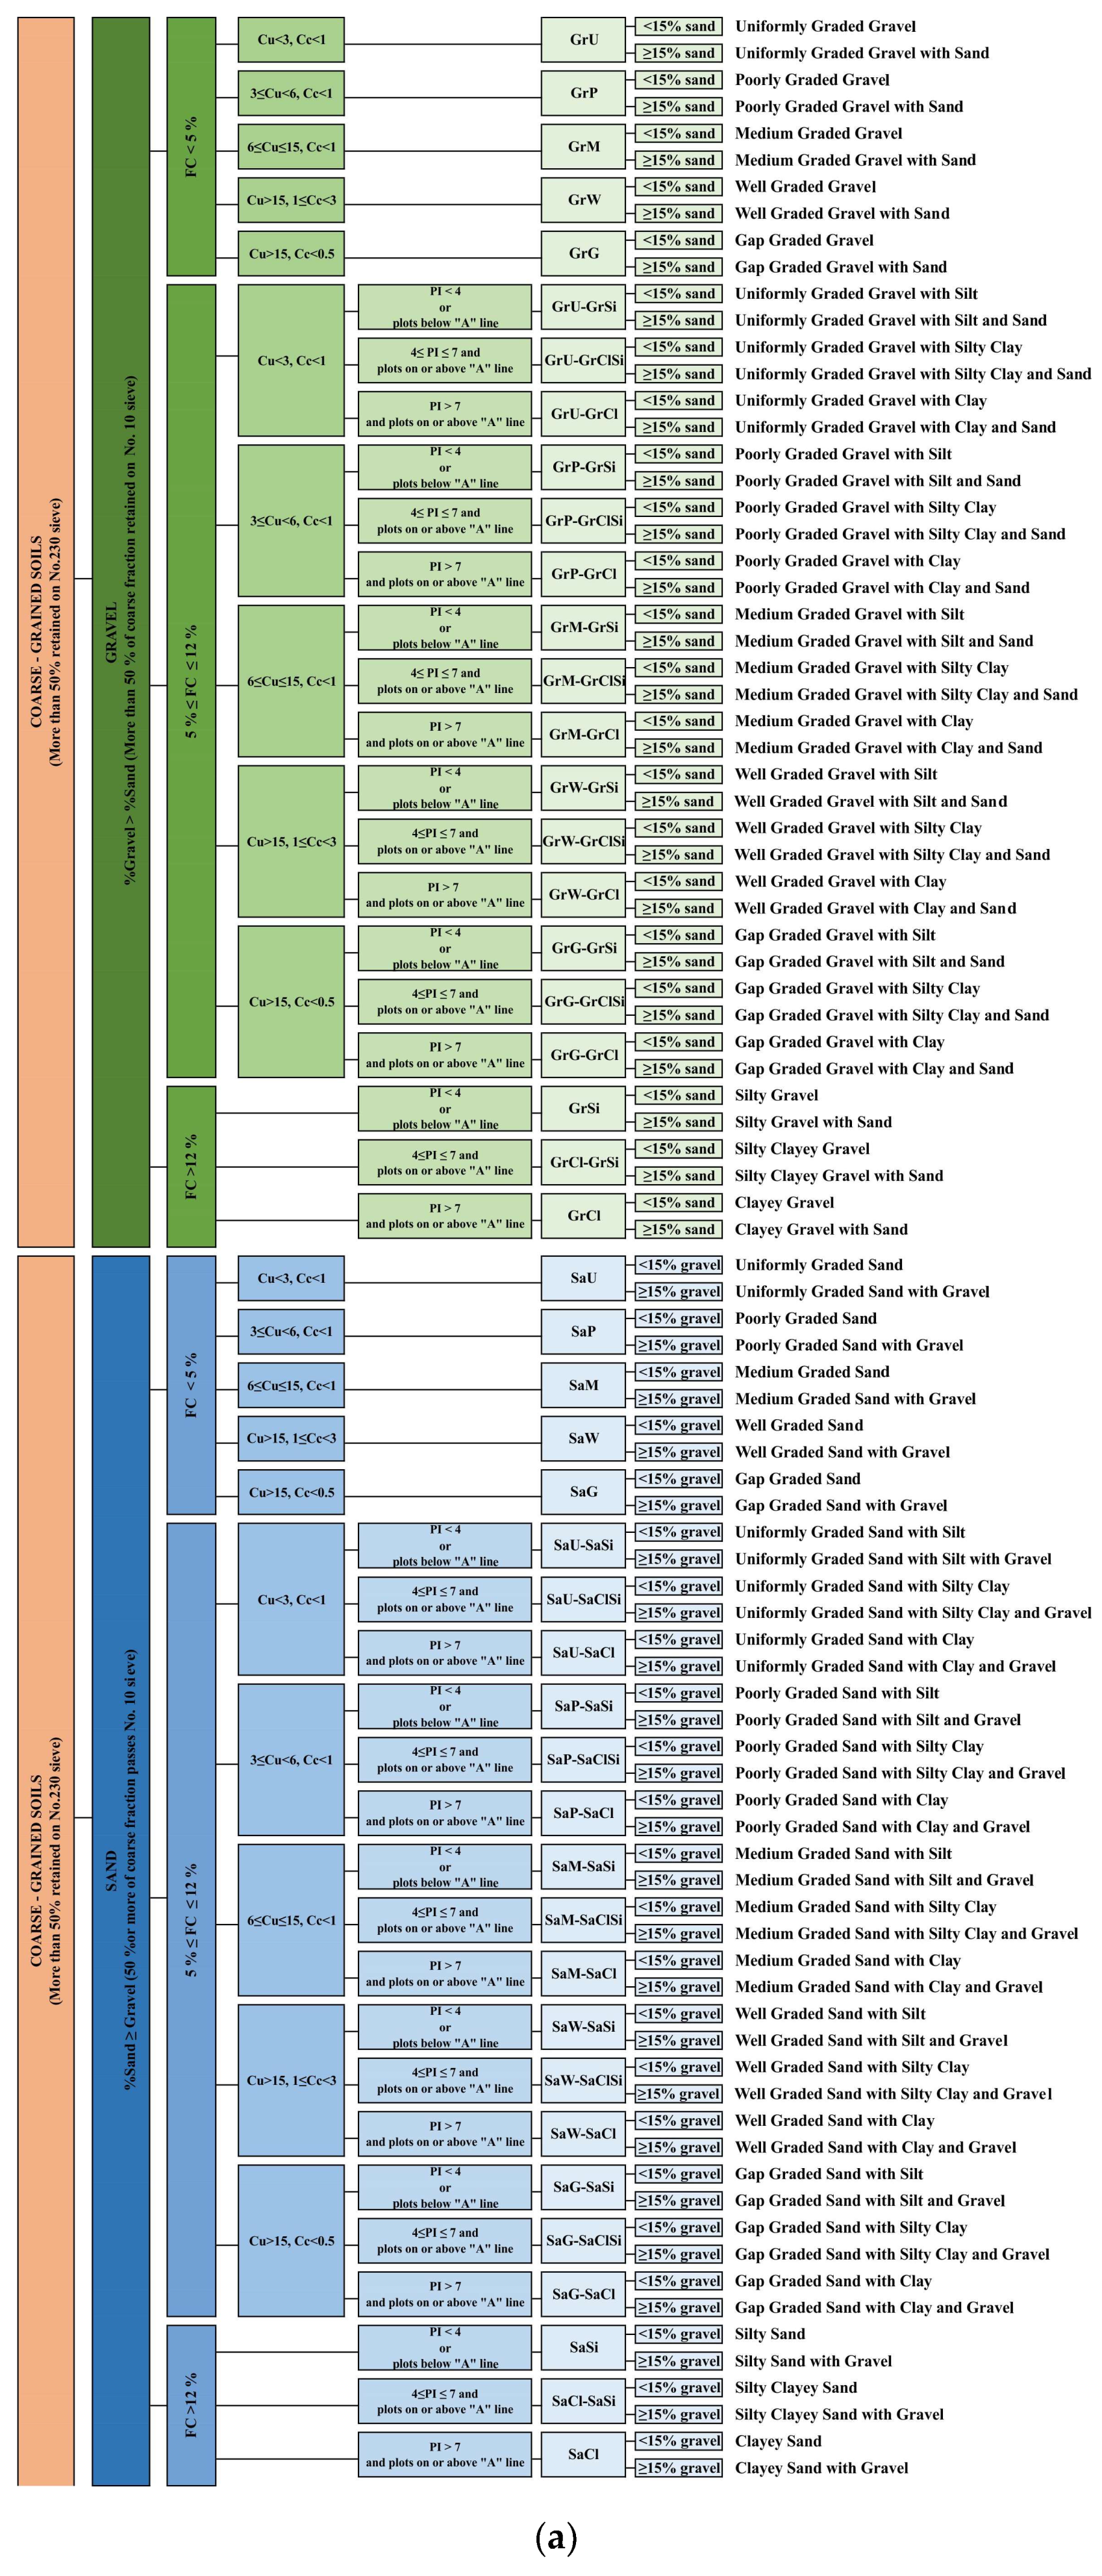
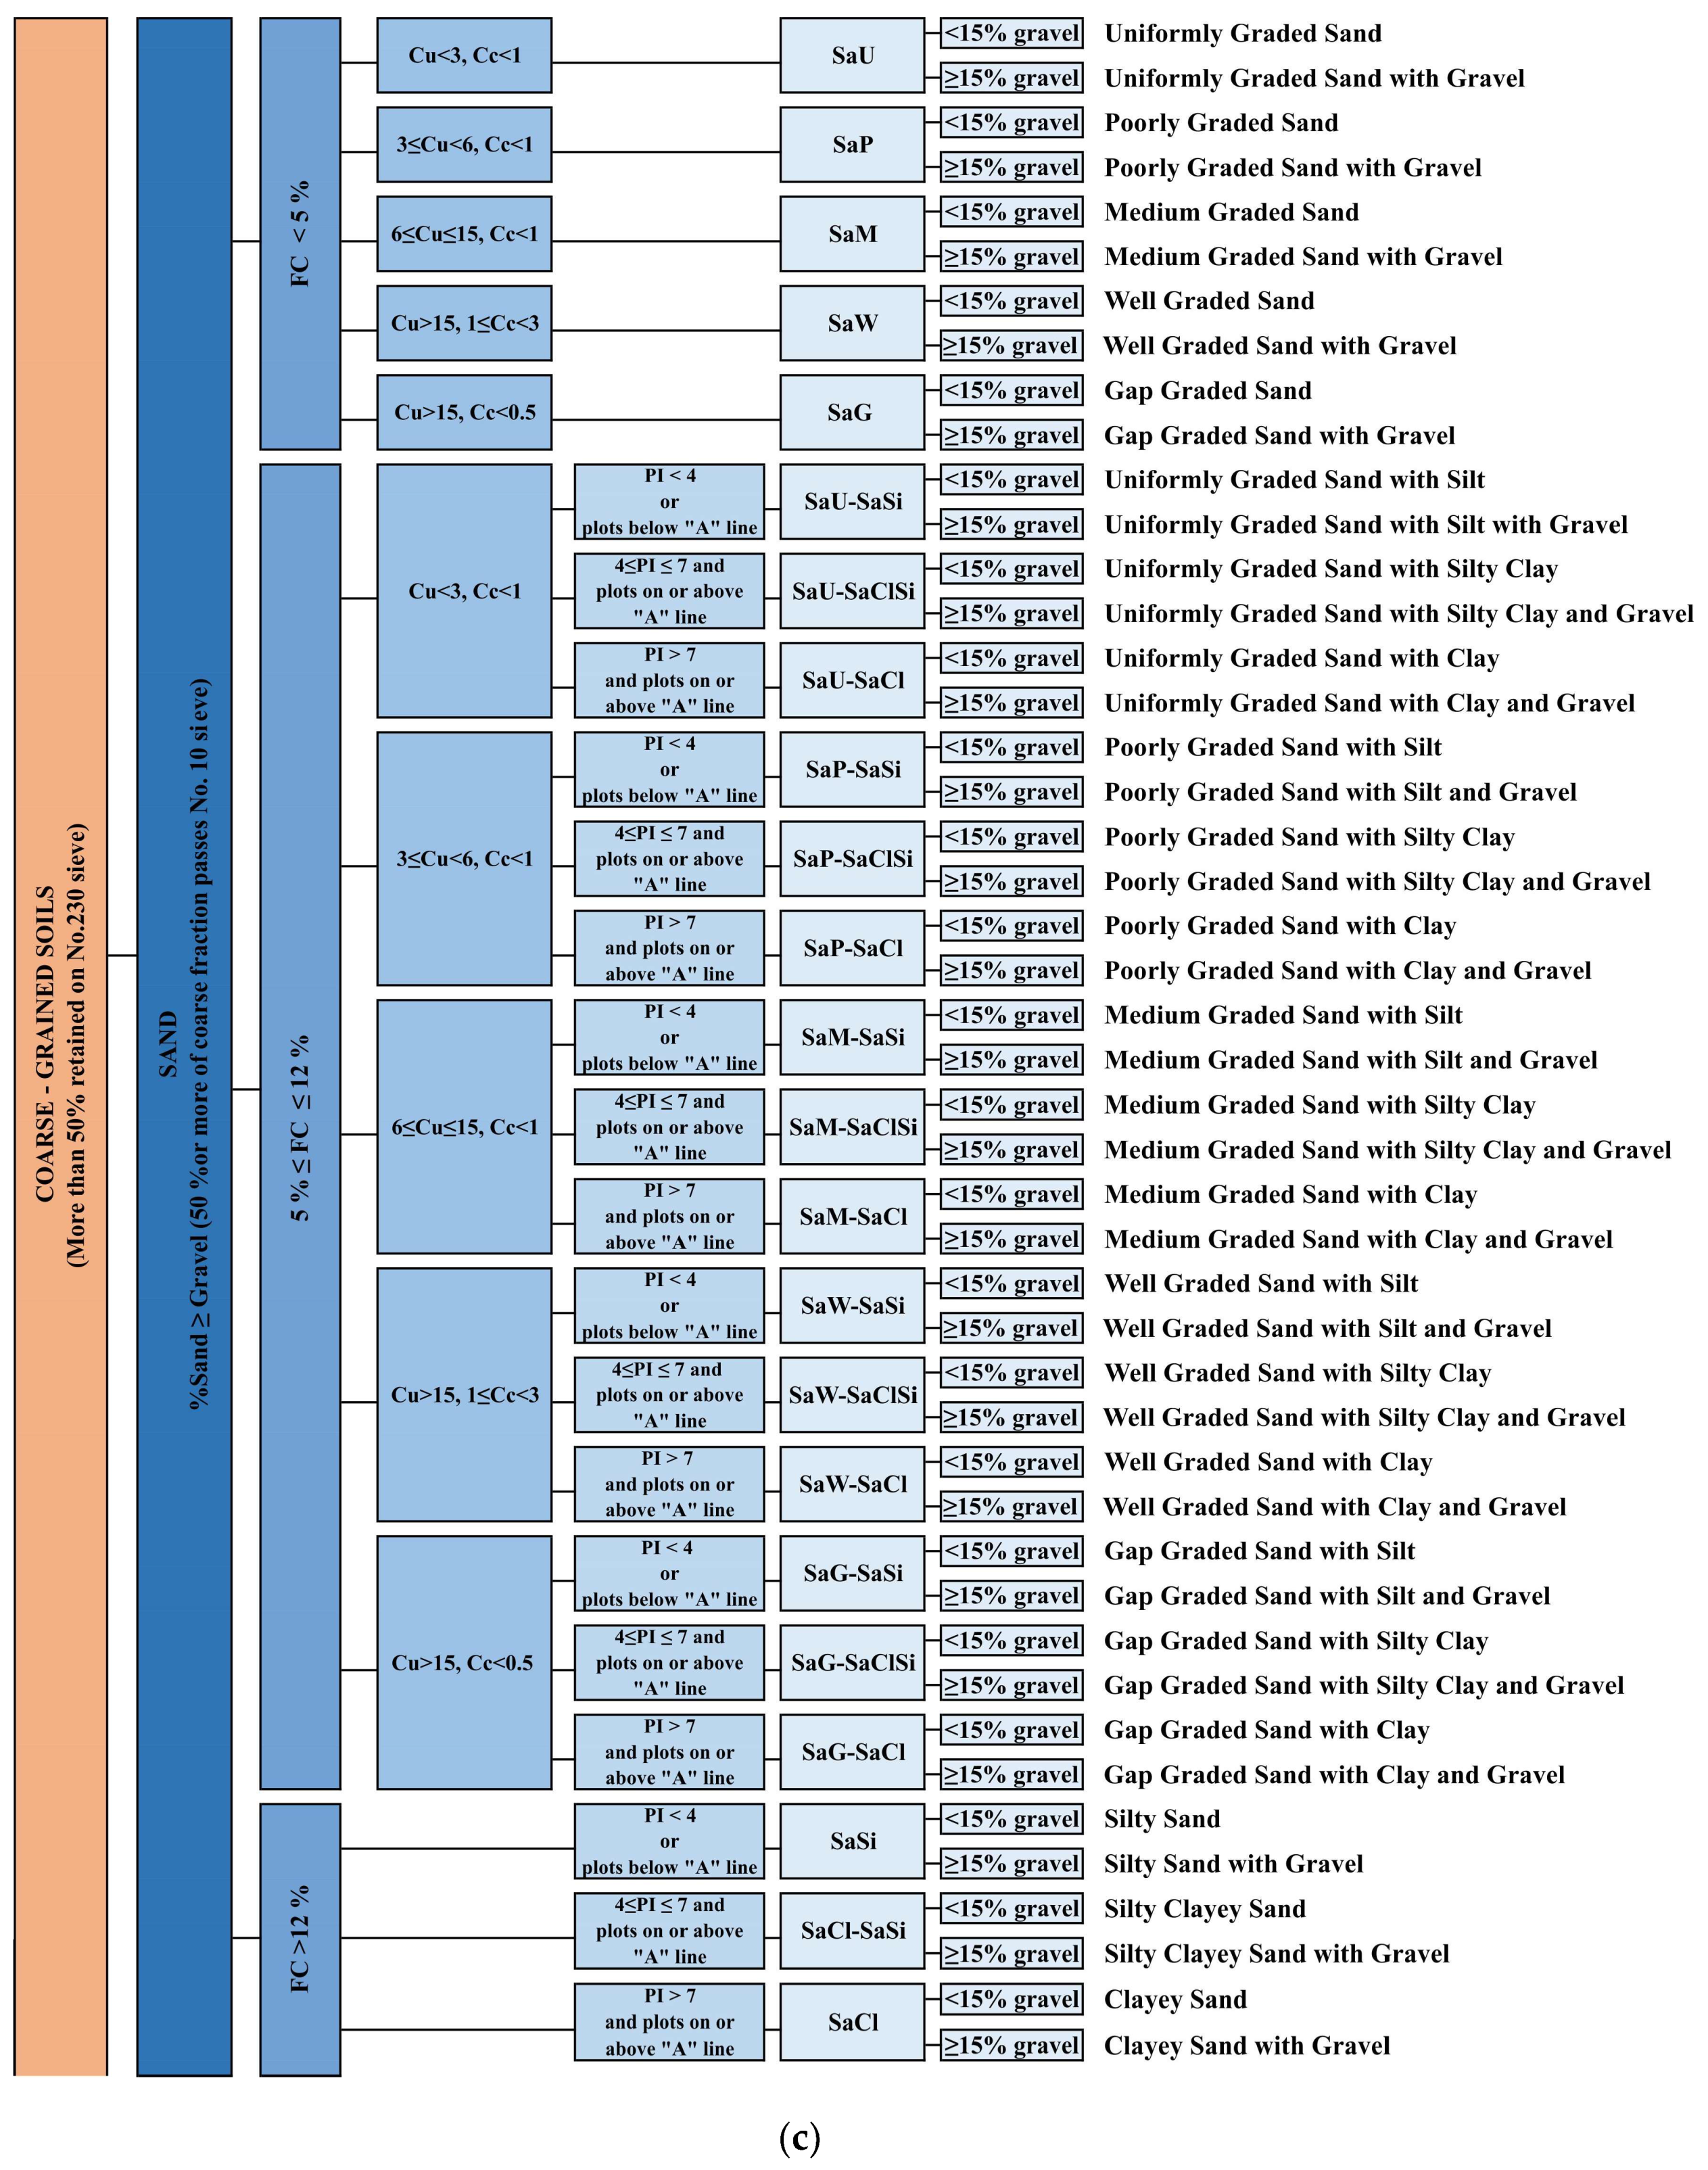
A flow chart was prepared for the categorization of coarse materials (
Figure 4).
Figure 4a illustrates the combination of coarse materials, specifically gravel and sand.
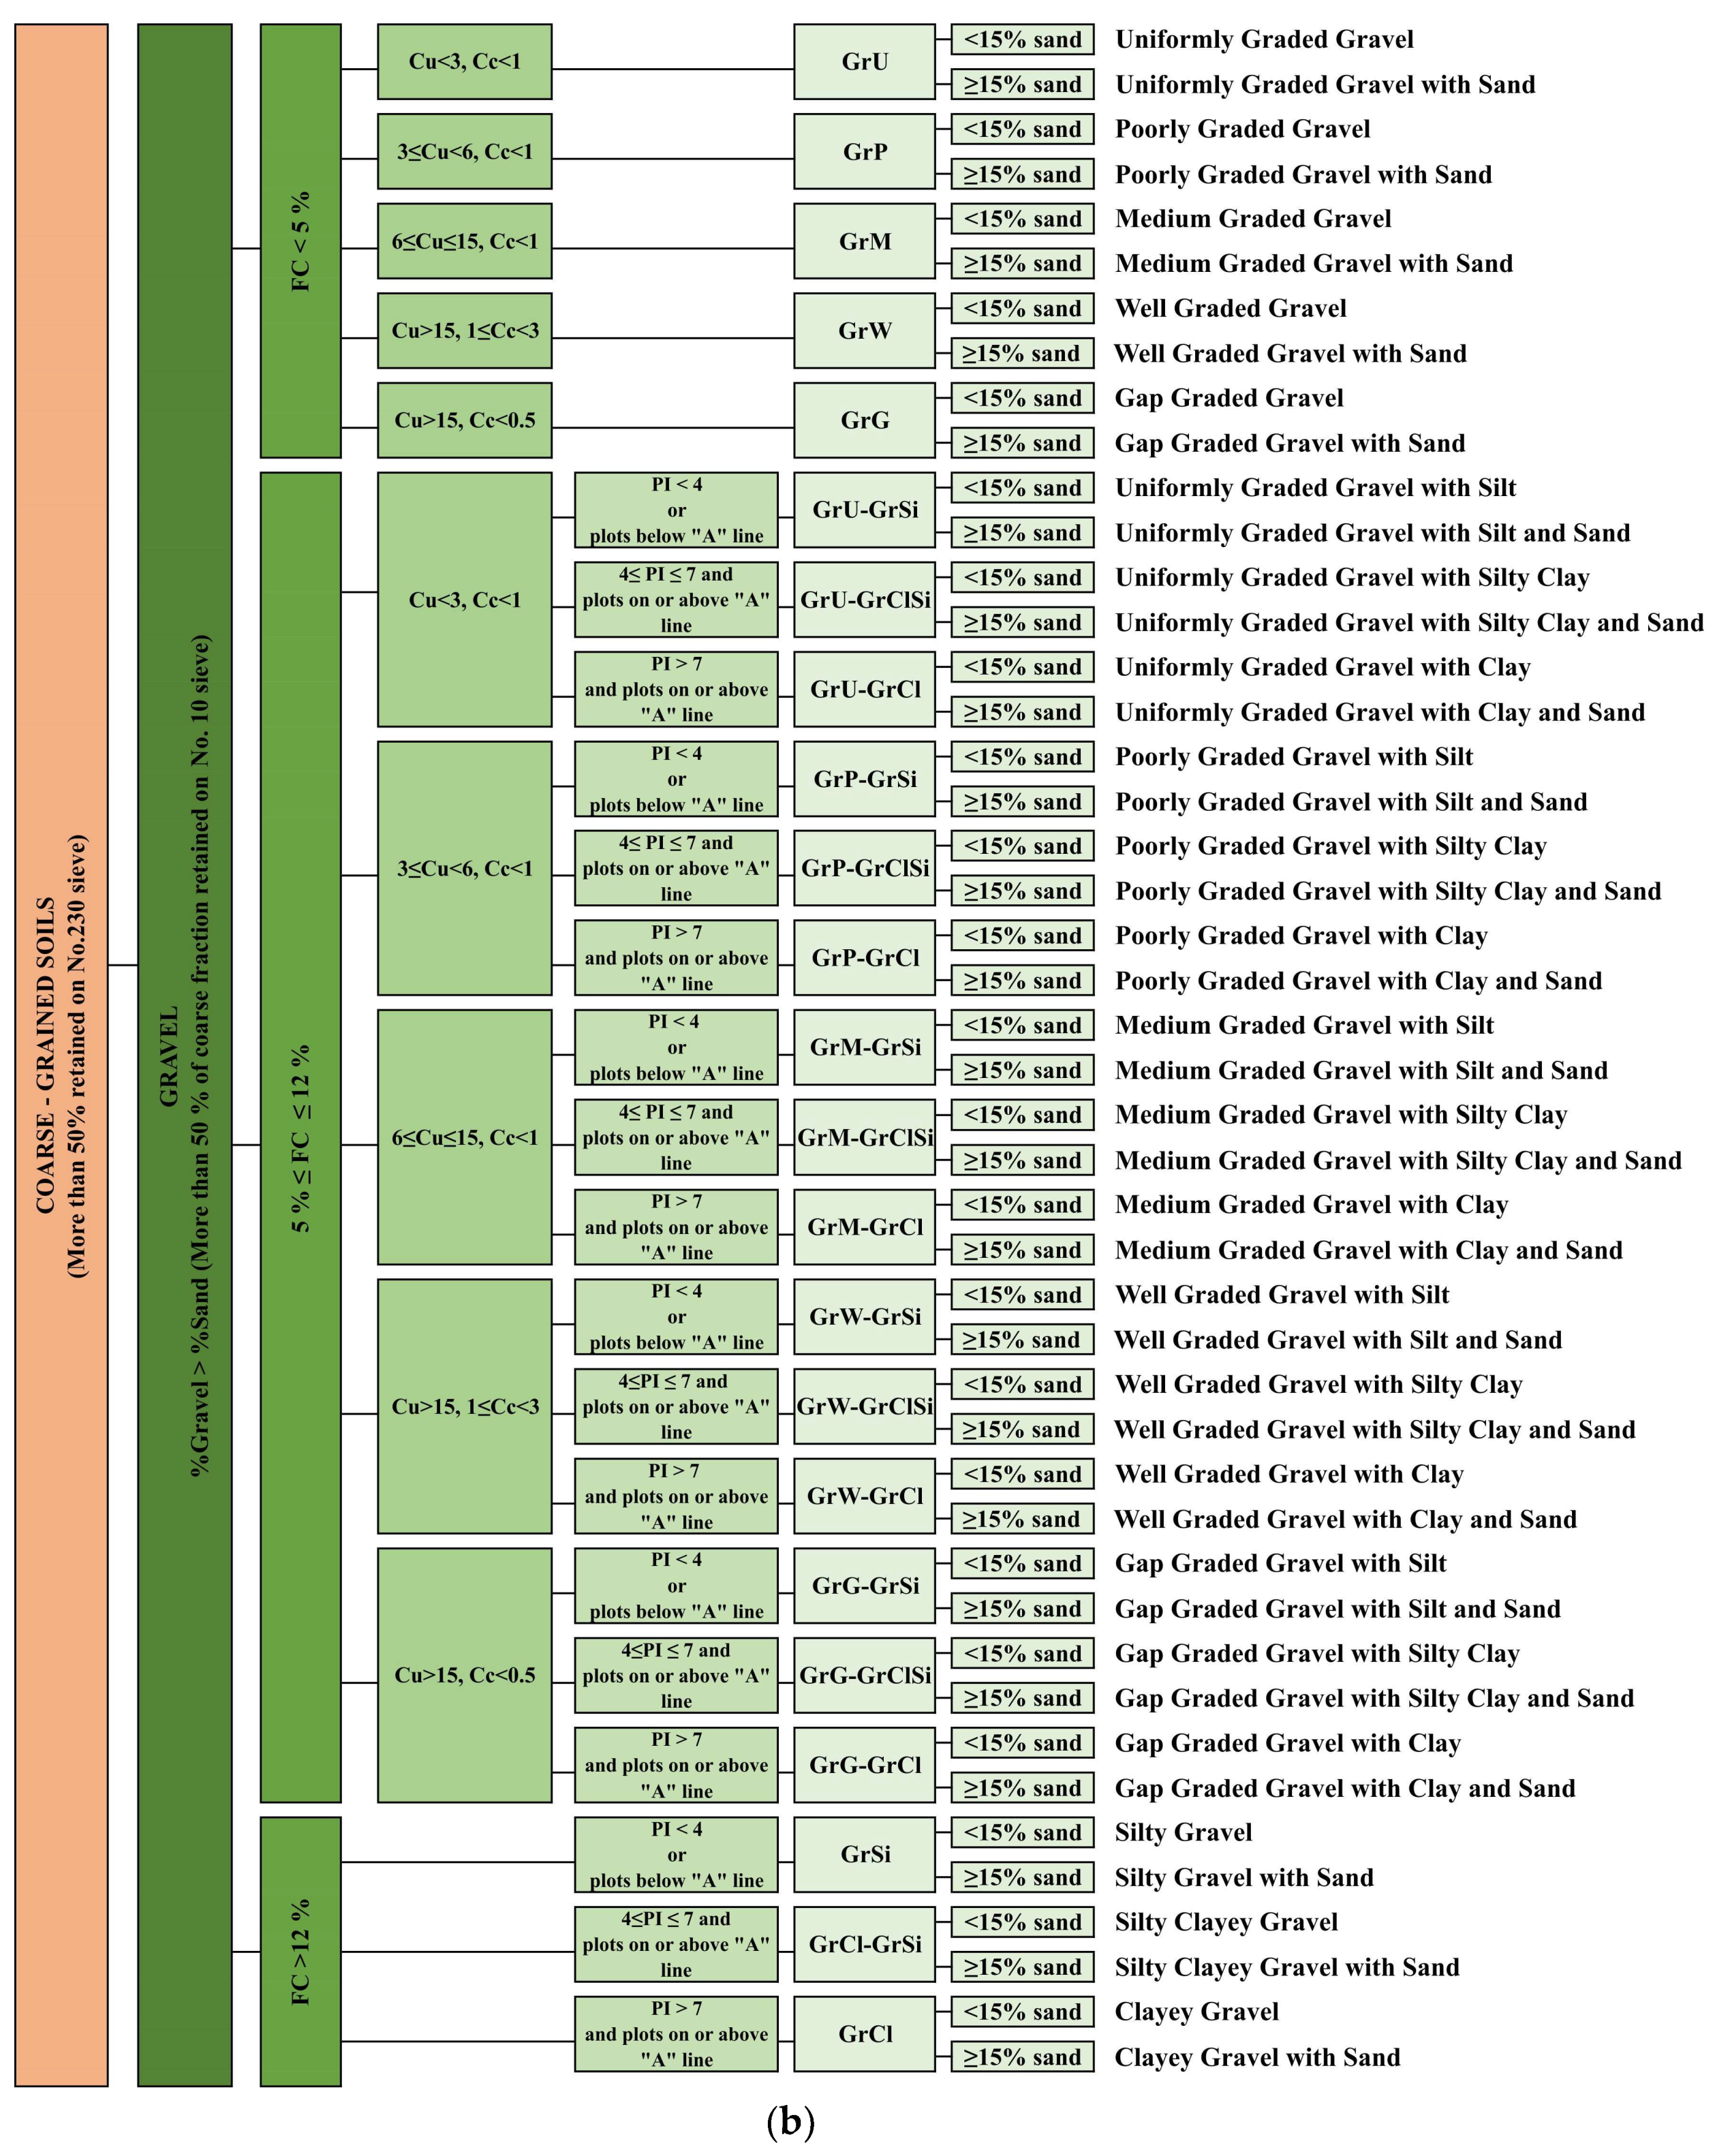
Figure 4b reveals a flow chart illustrating the process of gravel, while
Figure 4c presents a flow chart illustrating the process of sand.
For coarse particles, if more than 50% of particles by mass were retained on 2.00 mm (No. 10 sieve), and if these particles were less than 63 mm, the particles were defined as gravel. If 50% or more than 50% of particles by mass passed 2.00 mm (No. 10 sieve), and if these particles were more than 0.063 mm, the material was defined as sand.
Another step in the classification of coarse material involves explaining the proportions of fine-grained constituents within the coarse particles. The classification and marking of symbols should be applied to this composite material. The assessment of the secondary fraction ratio for composite materials is not addressed in EN ISO 14688-2:2018. Hence, the particle ratios were derived from the ASTM D2487-17e1 standard. The approach outlined in ASTM D2487-17e1 involves the division of fine grain percentages within coarse particles into three distinct subgroups, a practice that facilitates accurate classification. The fine grain percentages were used such as less than 5% fine content (FC), between 5–12% FC, and more than 12% FC. Also, the other important issue for the identification of coarse material is a secondary fraction of coarse materials. The ratio of these particles was also derived from ASTM D2487-17e1. The flow chart (
Figure 4) displays the grain percentages of coarse materials.
- (a)
Less than 5% fine content
Gravel or sand were described as clean if fine percentages were less than 5%. Therefore, the presence of fine content did not affect the symbol name of the soil classification. EN ISO 14688-2:2018 uses C
u and C
c to define group names and group symbols for coarse particles. The definitions of C
u and C
c were used for the particles that include less than 5% fine content. C
u and C
c were divided into five subgroups (
Table 2) according to EN ISO 14688-2:2018. The definitions of subgroups in EN ISO 14688-2:2018 provide a means for more precise categorization, although the accompanying explanations do not include group symbols. Hence, the initial capital letters of grading shape terms were employed as secondary letters of symbolization in the present study. For this purpose, “U” was used for “Uniformly” graded, “P” was used for “Poorly” graded, “M” was used for a “Medium” graded, “W” was used for a “Well” graded, and “G” was used for “Gap” graded (e.g., GrU: Uniformly Graded Gravel). In cases where grain size was absent, the gap-graded term was employed according to EN ISO 14688-2 (e.g., GrG: Gap Graded Gravel). The grading system outlined in ASTM D2487-17e1 is categorized into the following two distinct subgroups: well and poorly. In contrast, the definition of grading shape provided by EN ISO 14688-2:2018 is more comprehensive when compared to that of ASTM D2487-17e1.
- (b)
Between 5–12% fine content
If the fine percentages in coarse material were between 5–12%, the material was marked with the dual symbol, as can be seen in
Figure 4. In this section, the definitions of C
u and C
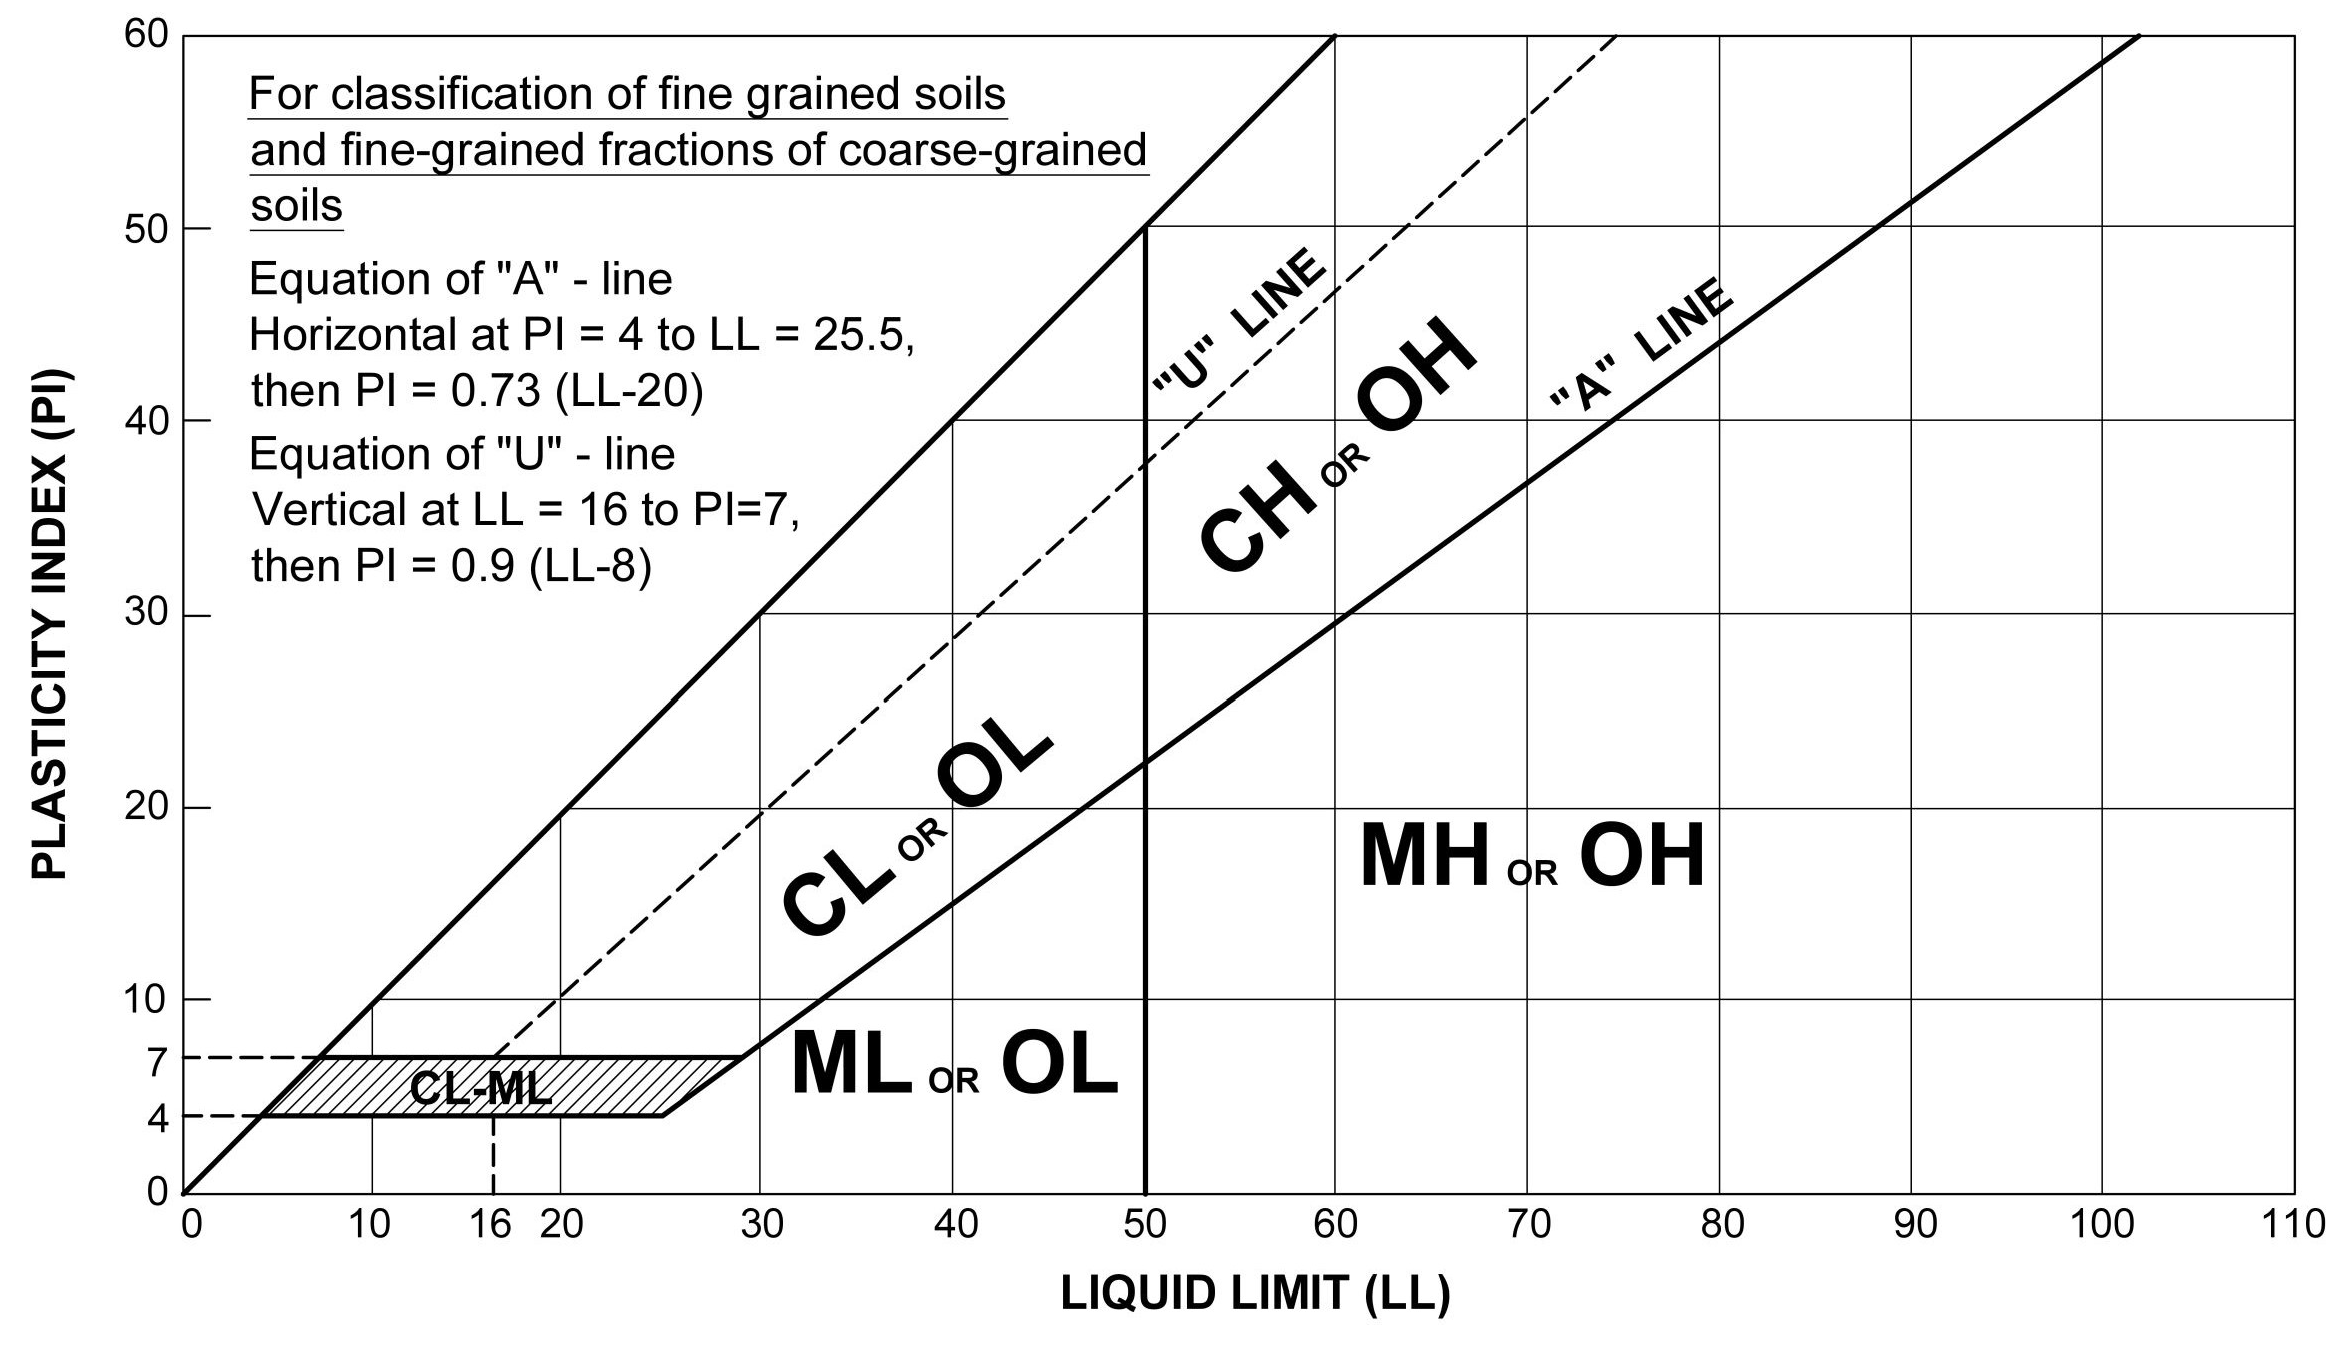
c were considered for the identification of particles. Also, it is necessary to utilize a plasticity chart in order to define fine materials such as clay, silt, or silty clay. The plasticity chart requires LL % and PI % parameters for fine material (
Figure 1). LL% and PL% laboratory tests were carried out according to ISO 17892-12 [
38]. Plasticity was not considered for coarse particles, and thus only the initial two letters of the plasticity symbol were utilized. If the location of the PI versus LL plot fell to PI < 4 or below the A-line, the soil was identified as Si. If the location of the PI versus LL plot fell to 4 ≤ PI ≤ 7 and on or above the A-line, the soil was identified as Cl-Si and so both symbols were used together. Therefore, the symbolization is longer than that of other group symbols, but only at this identification (e.g., SaW-SaClSi). If the location of the PI versus LL plot fell to PI > 7 and on or above the A-line, the soil was identified as Cl. The primary group symbol defined the dominant coarse particle and the shape of the grading curve. The secondary group symbol, denoting the presence of fine material within coarse particles was defined according to the plasticity chart (e.g., GrP-GrCl).
- (c)
More than 12% of fine content
If fine percentages in the coarse material were greater than 12%, the group name and group symbol were identified according to the plasticity chart. The plasticity chart was employed to define fine materials such as clay, silt, or silty clay. PI < 7, 4 ≤ PI ≤ 7, and PI > 7 were determined based on the definition and marking symbols. The initial two letters (the first letter is capitalized) defined primary coarse material and the secondary capital letter defined fine fractions in coarse material (e.g., SaSi, GrCl). If the location of LL versus PI fell to 4 ≤ PI ≤ 7 and plots on or above the A line, the particle was defined as ClL-SiL. In this situation, the group symbol was marked as “GrCl-GrSi” and “SaCl-SaSi”.
- (d)
Secondary coarse content
The final assessment of coarse material is for secondary coarse grain. If secondary coarse grain percentages are ≥15% in coarse material, the “with sand” or “with gravel” expression was added to the group name (
Figure 4). This assessment did not change the group symbol. The assessments and ratios mentioned here are not included in the EN ISO 14688-2:2018 standard. The ratios of assessments were determined using ASTM D2487-17e1.
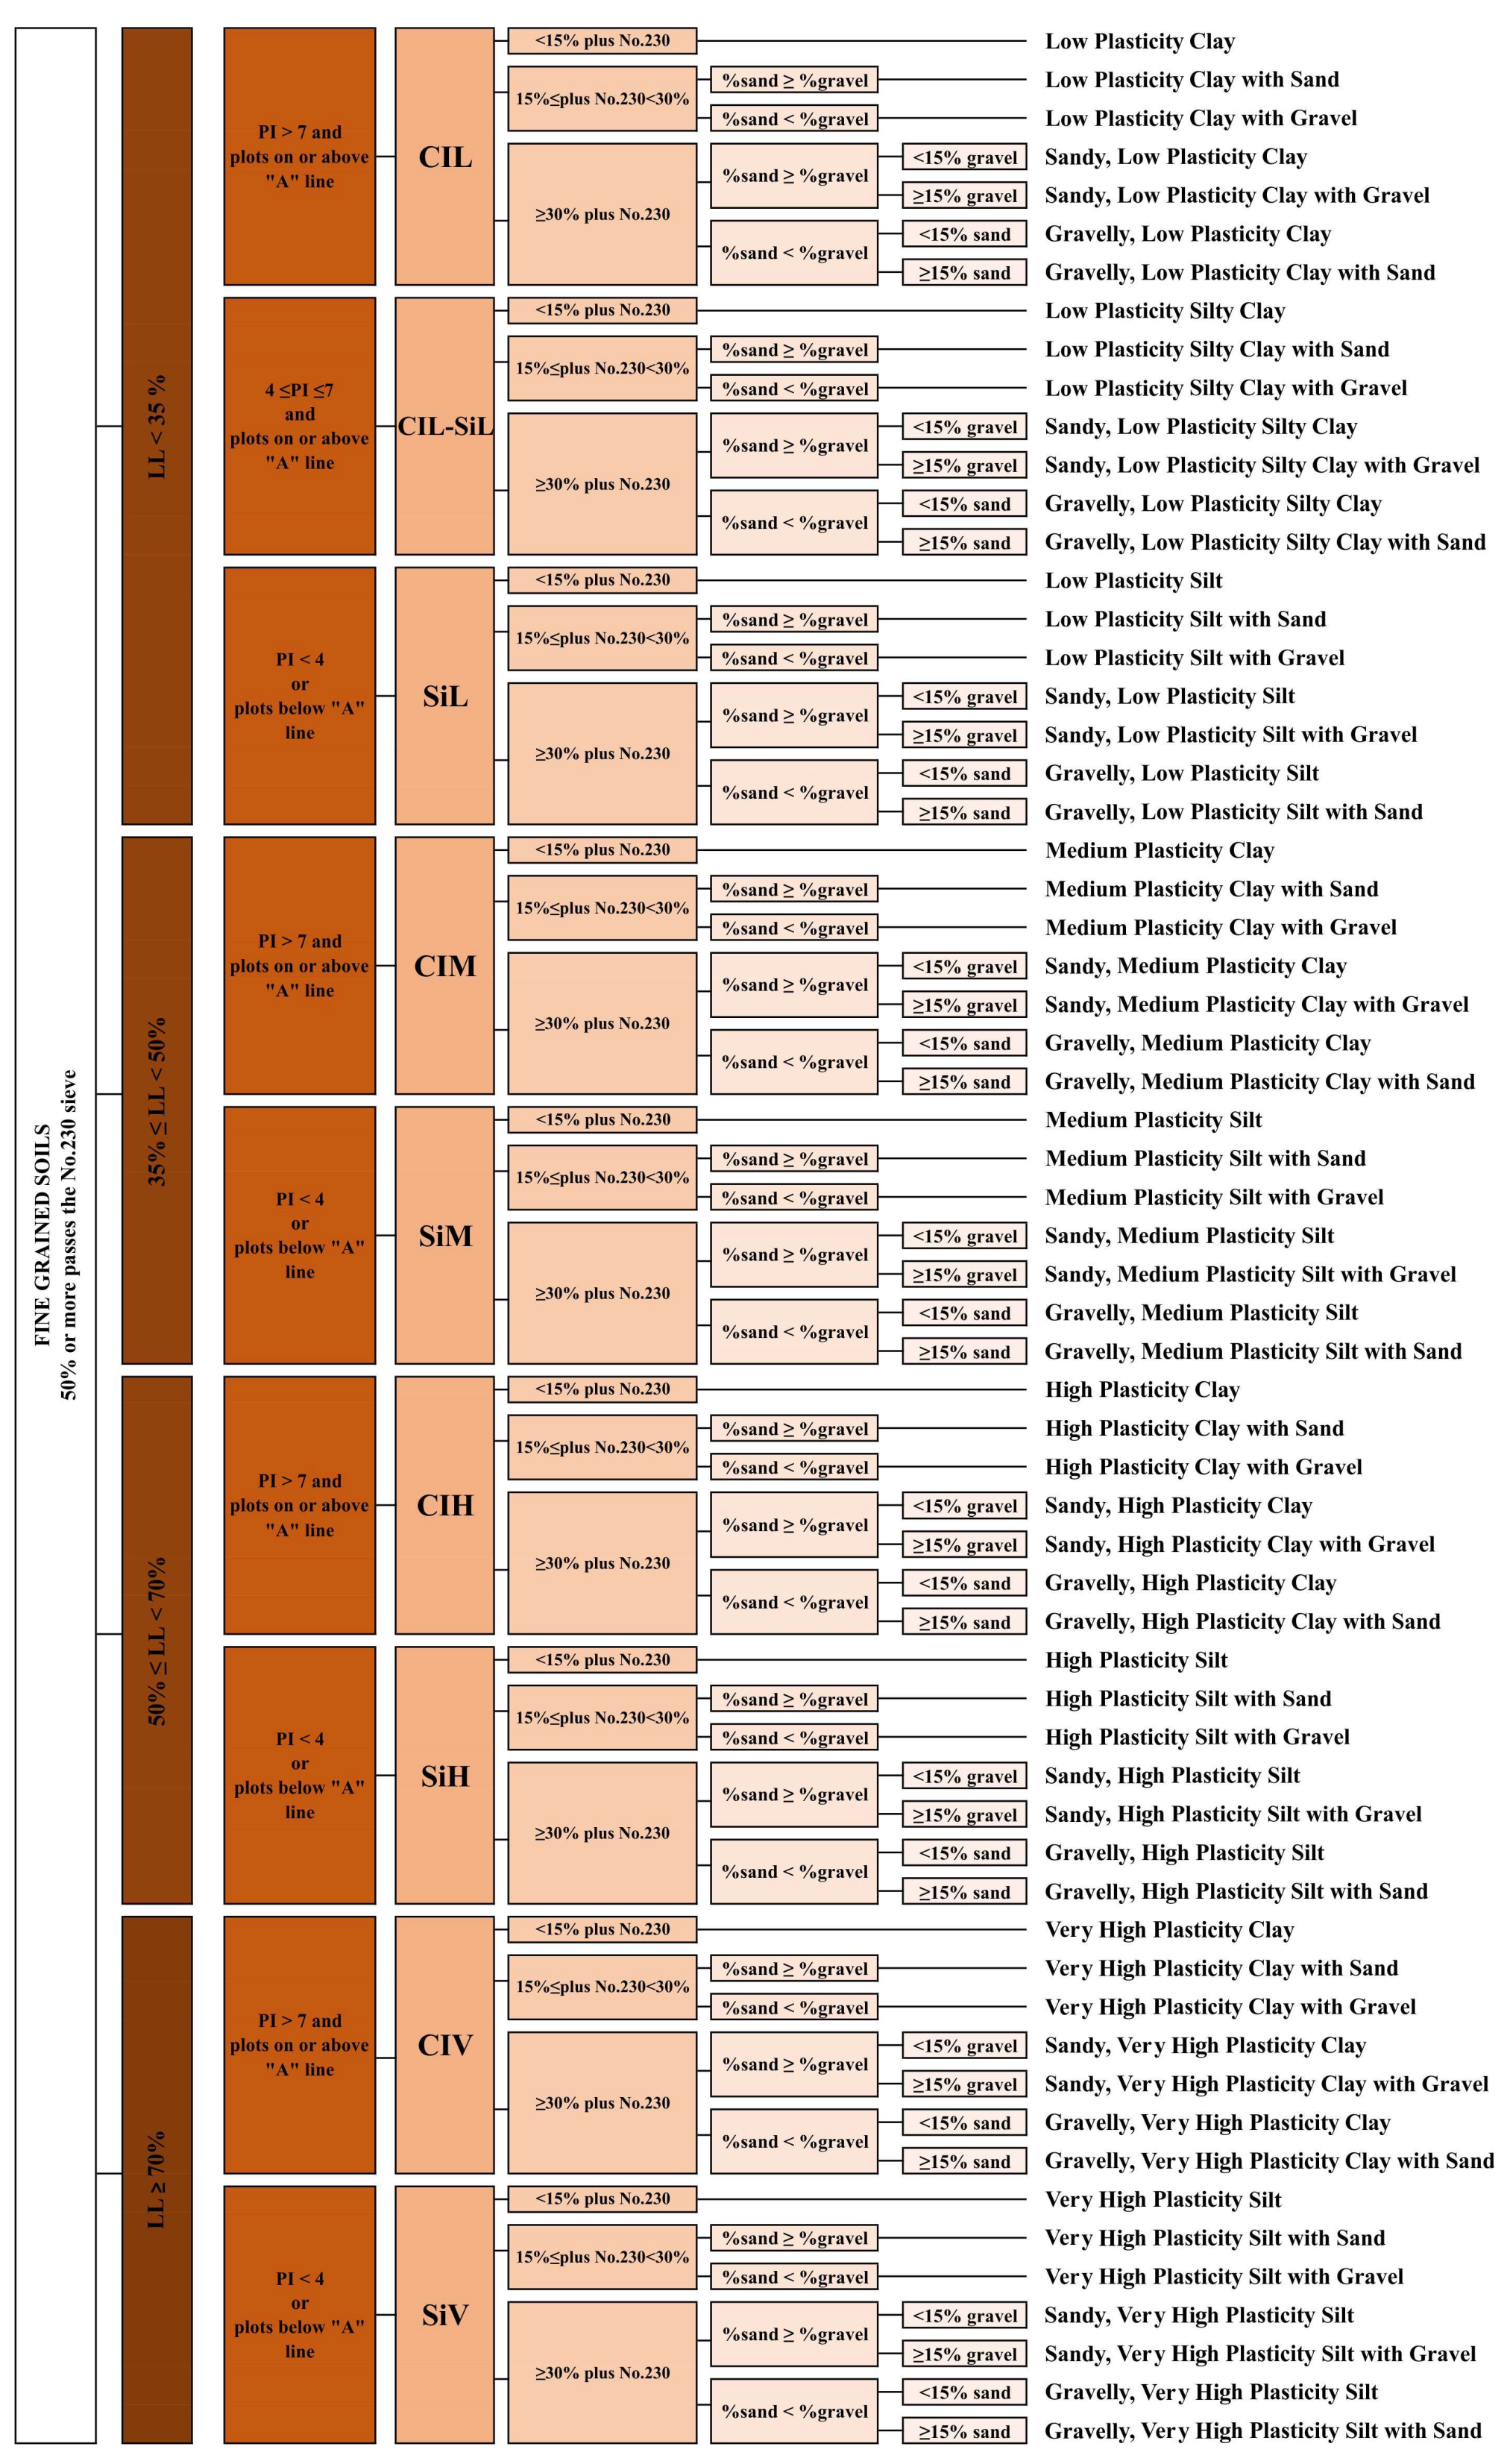
3.2. PSNA for Fine Material
The plasticity chart specified in the EN ISO 14688-2:2018 [
21] standard was utilized to determine the distribution of fine particles within a soil mass. A flow chart was prepared for the categorization of fine materials (
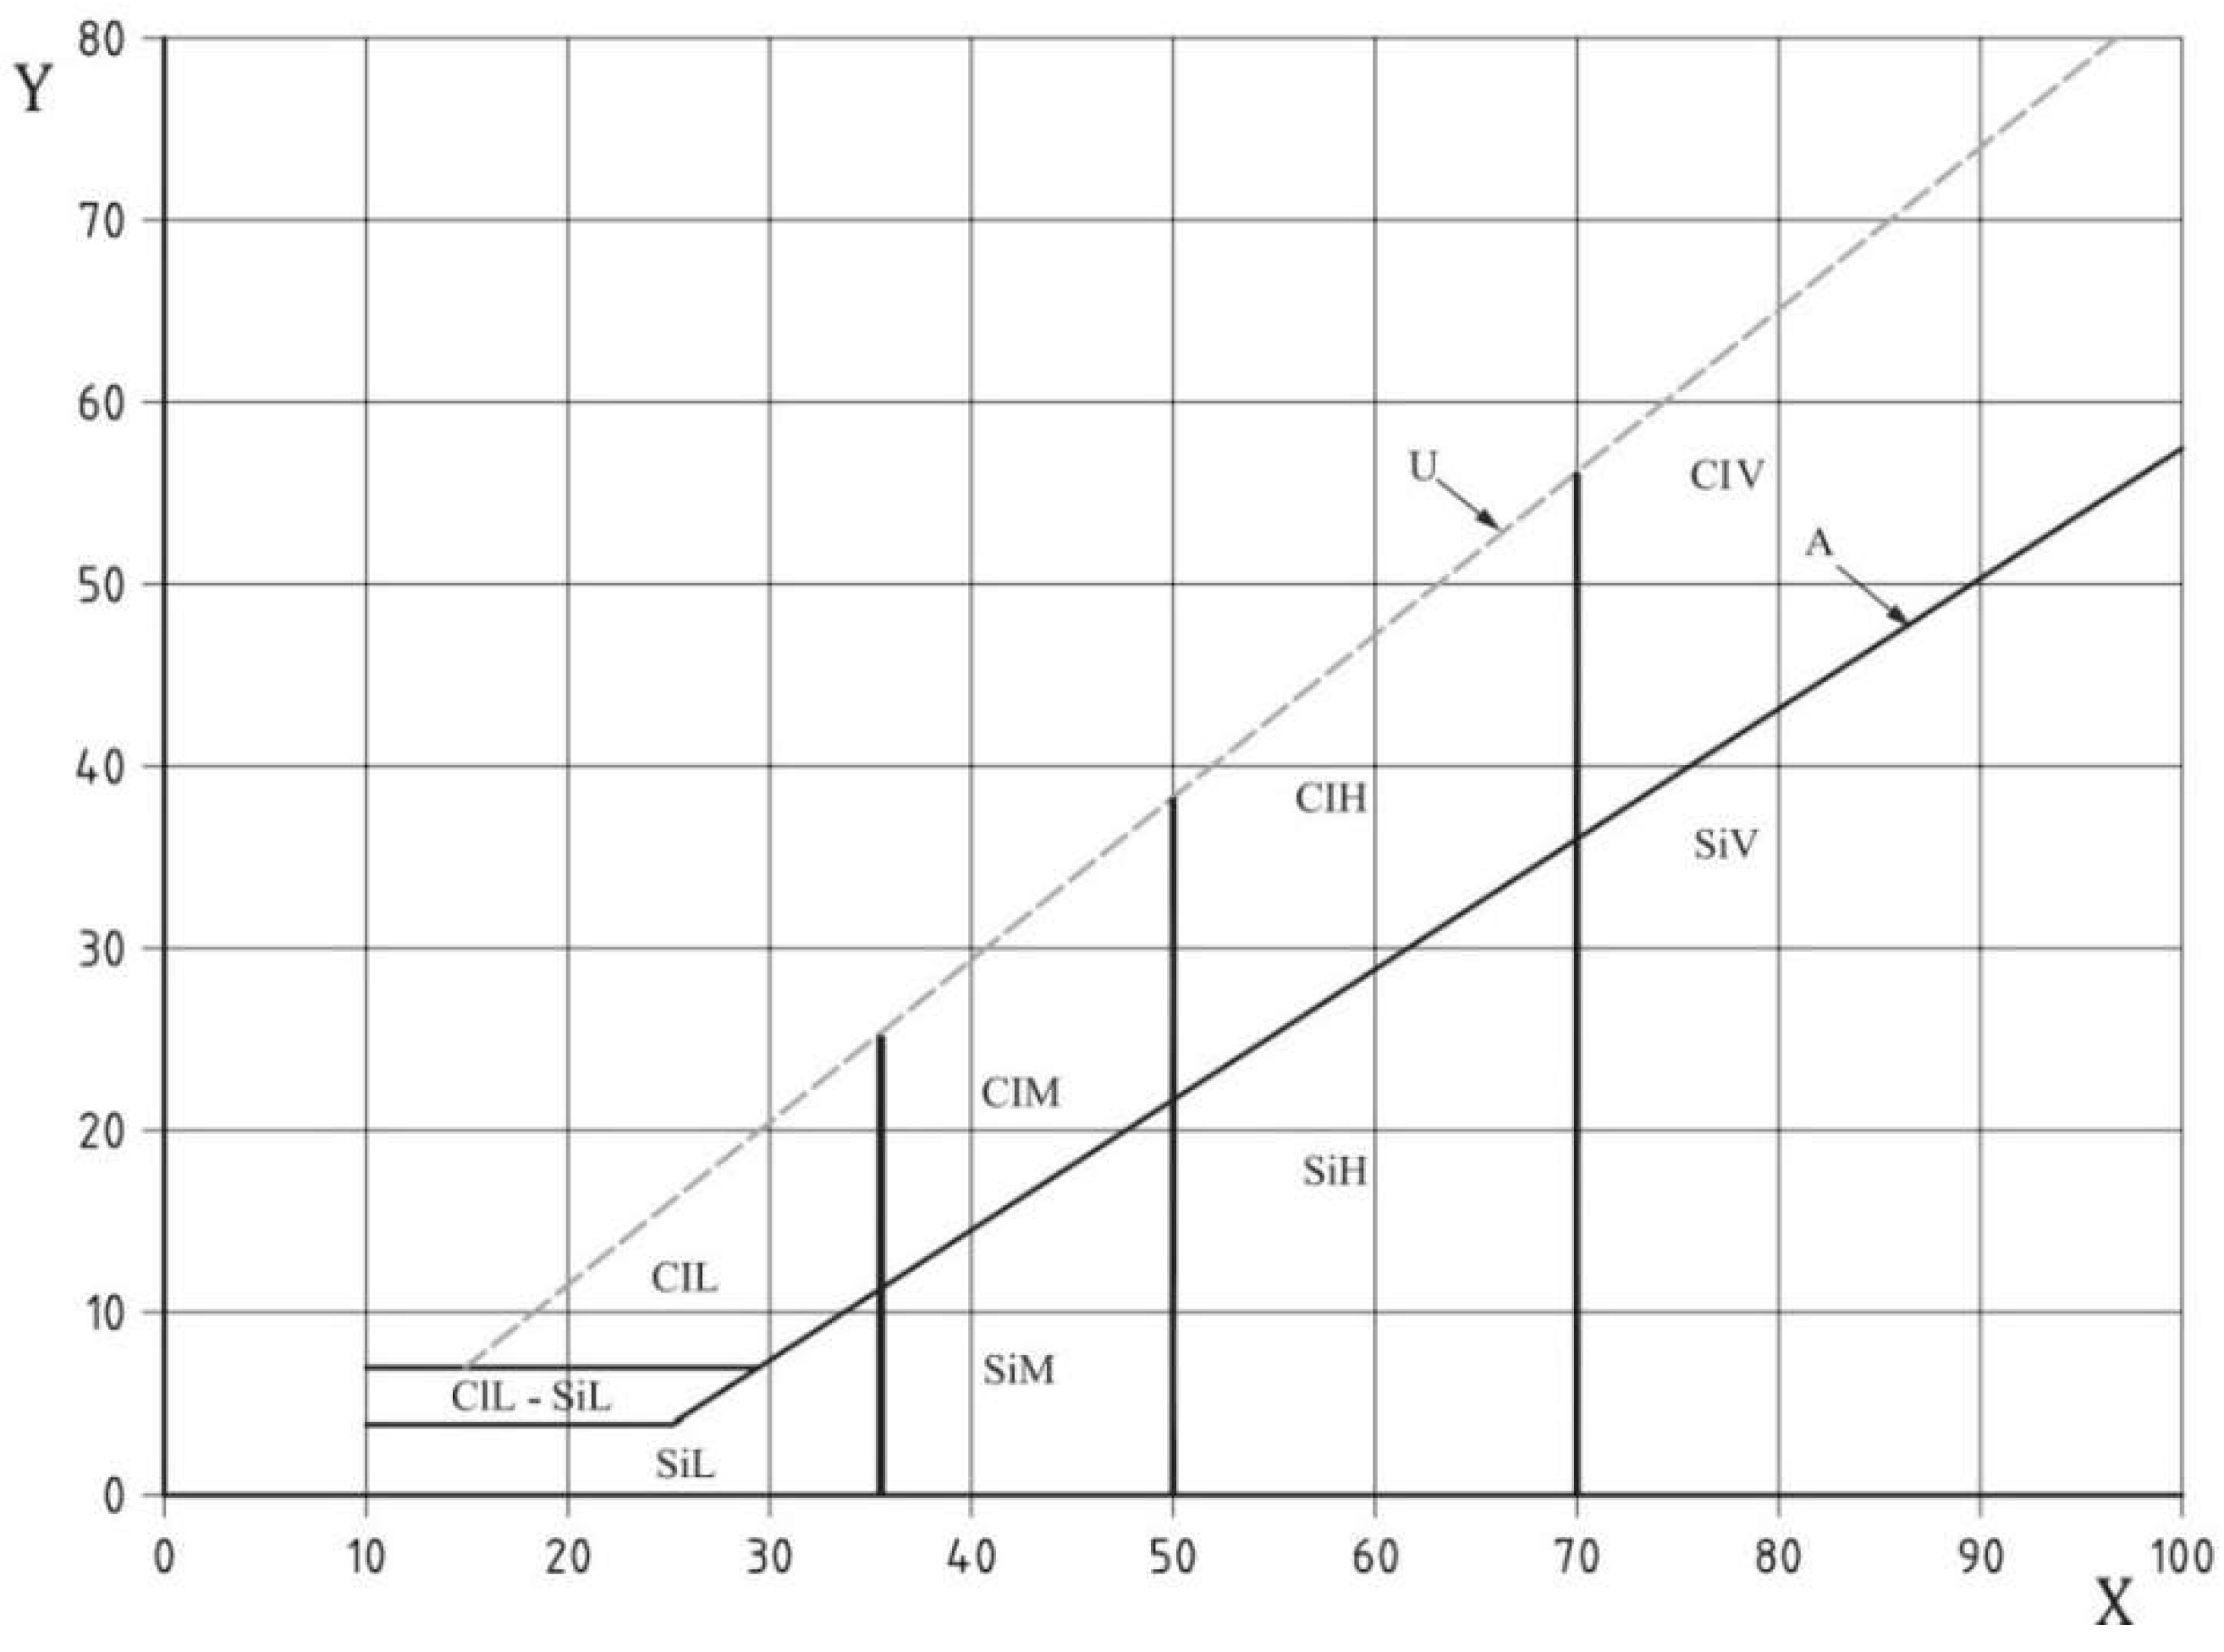
Figure 5). The location of fine particles on the PI versus LL plot determined the group symbol for the fine particles. The initial symbol defines the dominant fine particle, such as Cl or Si. The secondary capital letter provides information about the plasticity of fine material. The plasticity symbol was identified according to LL% values. The secondary symbols changed according to plasticity, such as low, medium, high, and very high (
Table 3). L, M, H, and V were employed for low, medium, high, and very high [
21], respectively in this study.
Initially, 50% or more than 50% of soil particles that passed sieve No. 230 were divided into four subgroups according to LL percentages and used in proper categorization according to their plasticity. For this purpose, if an LL% value is <35%, the plasticity of fine particle is categorized as “Low (L)”. If the LL% value is ≥35% to 50%, the plasticity of the fine particle is categorized as “Medium (M)”. Similarly, if the LL% value is ≥50% to 70%, the plasticity of fine particle is categorized as “High (H)”. Lastly, if an LL% value is ≥70, the plasticity of the fine particle is categorized as “Very High (V)”. The other assessment of fine particles is performed using the PI plot and A line. If the location of the PI versus LL plot fell to PI < 4 or below the A line, the soil was identified as “Si”. If the location of the PI versus LL plot fell to 4 ≤ PI ≤ 7 and on or above the A line, the soil was identified as “Cl-Si”. Lastly, if the location of the PI versus LL plot fell to PI > 7 and on or above the A line, the soil was identified as “Cl”.
The process of symbolization was executed by following these sequential steps. While fine particles can also contain coarse particles, EN ISO 14688-2:2018 does not explain this type of composite soil and so ASTM D2487-17e1 is employed. According to the ASTM D2487-17e1 standard, coarse particles in fine materials are not added to the symbol. However, the group name is determined according to the coarse percentages within them. The same method was used in this proposed approach as in ASTM D2487-17e1 (
Figure 5). The classification of soil should consist of both a group name and a group symbol. If only a symbol is used, it can be misleading.
For the definition of group name, three different percentages were used in this study according to ASTM D2487-17e1:
If the coarse particle in fine material retained on No. 230 sieve is less than 15%, no expression is not added to the group name (e.g., ClH: High Plasticity Clay).
If the coarse particle retained on the No. 230 sieve is between ≥15–30%, the dominant coarse particle name is added at the end of the group name such as “with gravel “or “with sand” (e.g., ClH: High Plasticity Clay with sand).
If the coarse particle retained on No. 230 sieve is more than ≥30%, the initially dominant coarse particle name was added such as “Gravelly” or “Sandy”. Then, secondary coarse material was assessed. If secondary coarse material percentages are less than 15%, secondary coarse material was not considered (e.g., ClH: Gravelly High Plasticity Clay). If this percentage is 15% or more than 15%, additionally “with gravel “or “with sand” was added to the end of the group name (e.g., ClH: Gravelly High Plasticity Clay with sand).
3.3. PSNA for Organic Material
In the present study, particle sizes ≤ 2 mm soils with organic constituents were also classified. For this purpose, EN ISO 14688-2:2018 [
21] was considered. The organic material was divided into four groups (
Table 5) according to EN ISO 14688-2:2018. Organic material was classified according to the percentage of organic material contained within fine particles. When soil mass contains a fine content of 5% or more, which also includes organic material, the plasticity chart is utilized. In this case, the group symbol was modified by adding the letter “O” at the end (e.g., ClHO-High Plasticity Clay (Organic)).
If the particle size is bigger than 2 mm, it is crucial to consider the type of organic matter, the genetic origin, and the degree of decomposition of the organic constituents of organic material [
21].
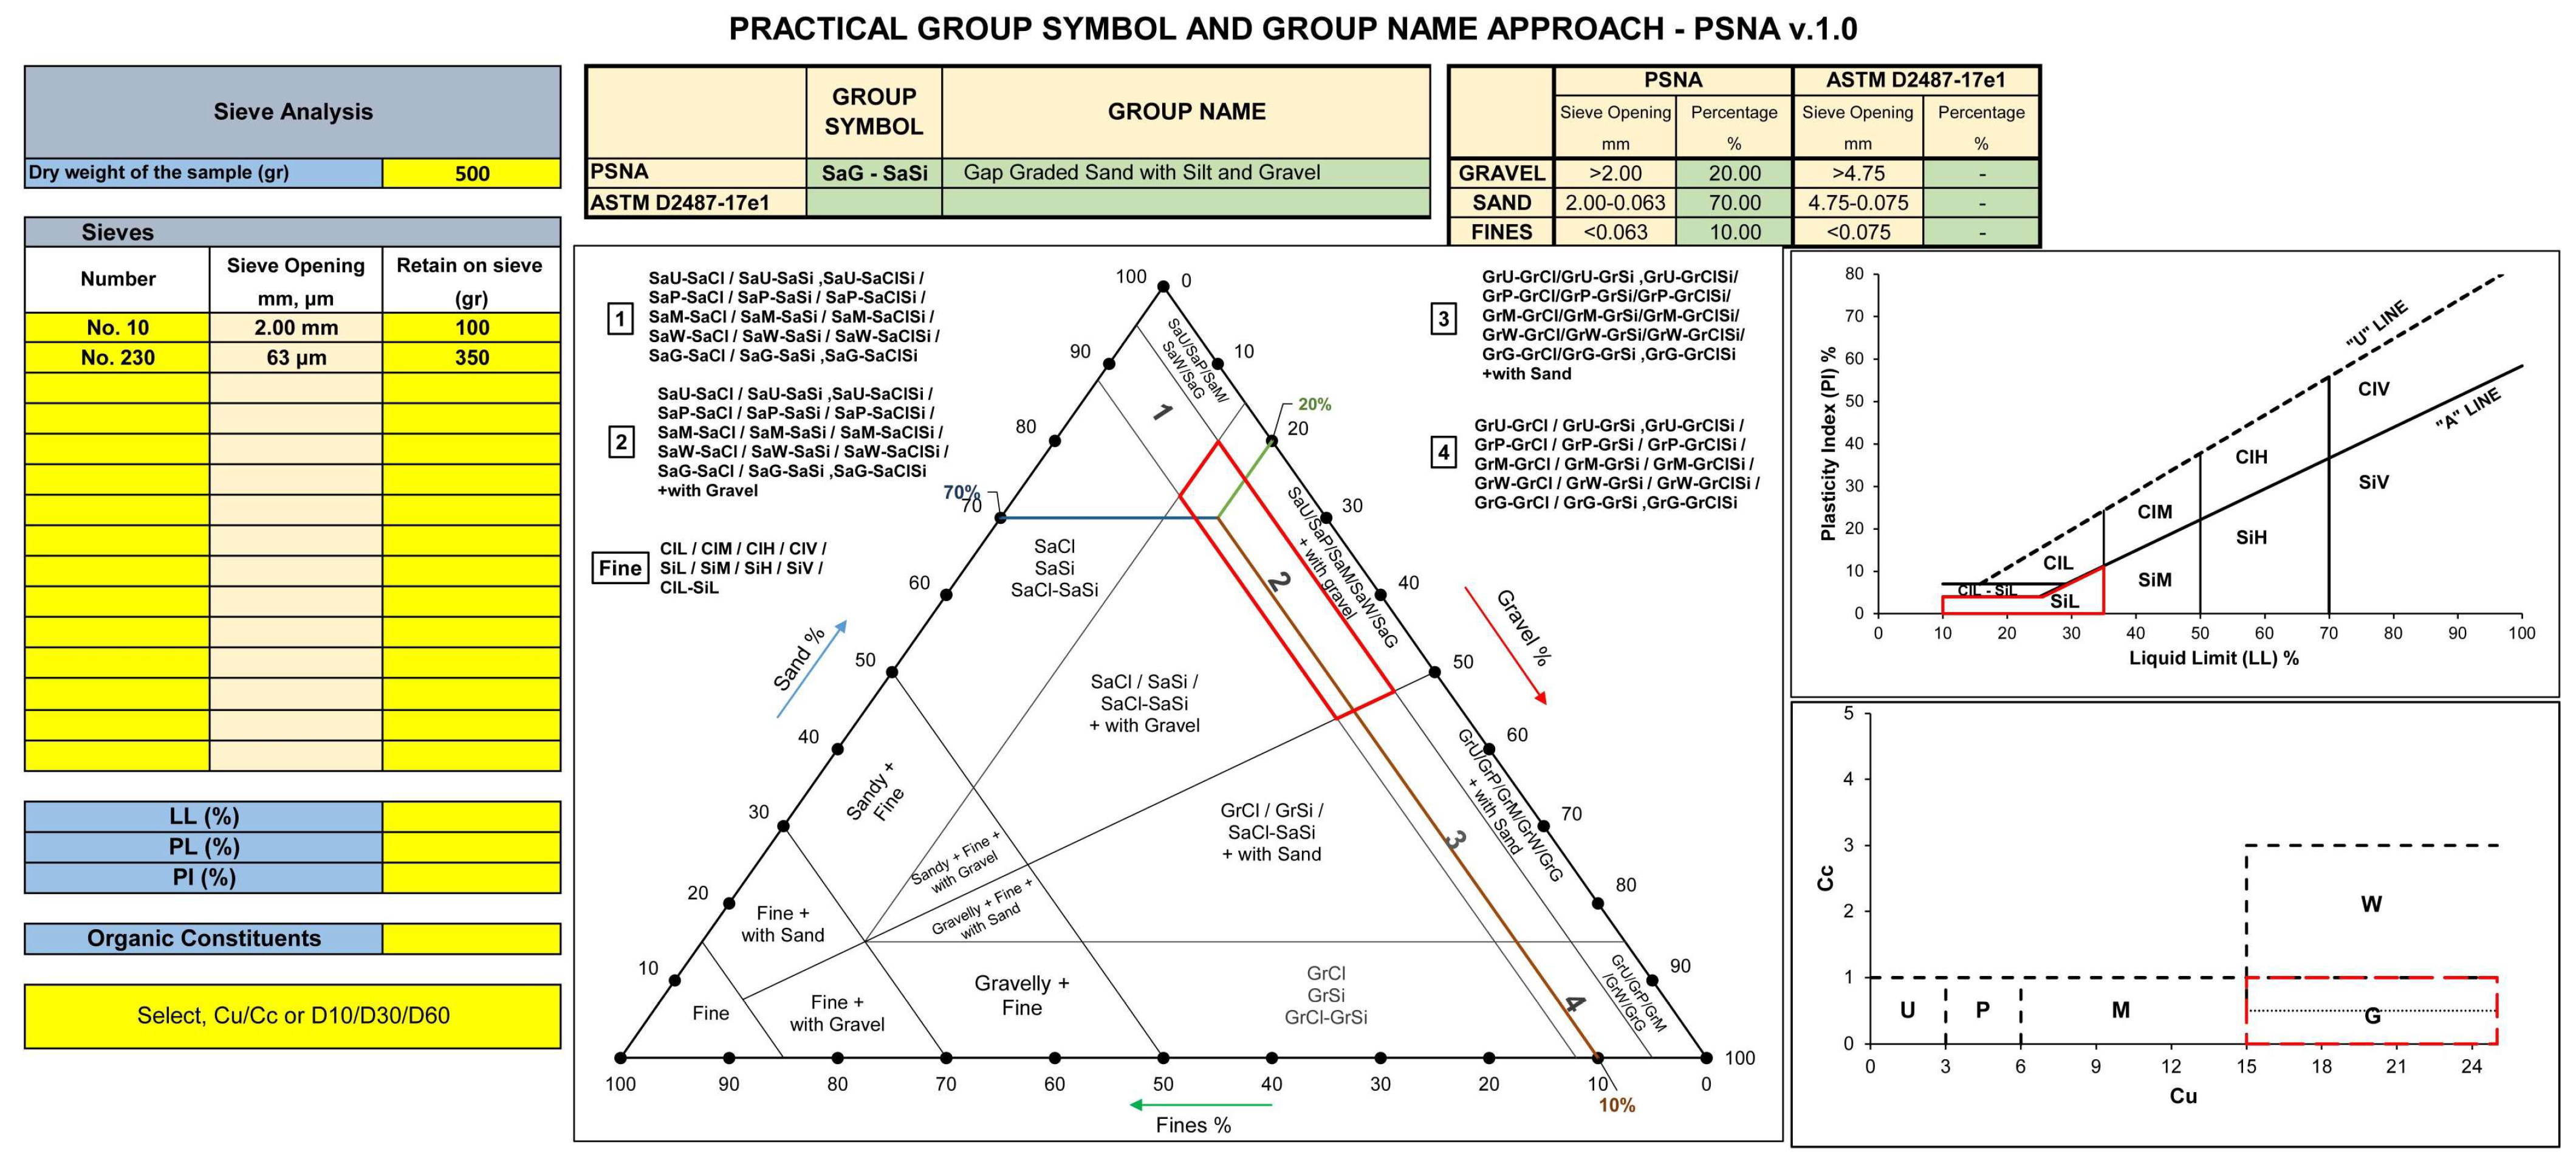
4. PSNA v.1.0 Excel Macro for Practical Soil Marking Approach
In the present study, a macro in Excel called PSNA v.1.0 was developed to mark soils according to PSNA. The macro was created within the Microsoft Excel 2019 software platform, utilizing the integrated programming language known as Visual Basic for Applications (VBA). This macro can be found in the
Supplementary Materials. The flow charts that were prepared for PSNA were based on developing PSNA v.1.0. A macro in Excel facilitates the efficient assignment of group symbols and names. For this purpose, sieve openings from ≥0.063 mm (sieve No. 230) to ≤75 mm of ASTM E11 sieves [
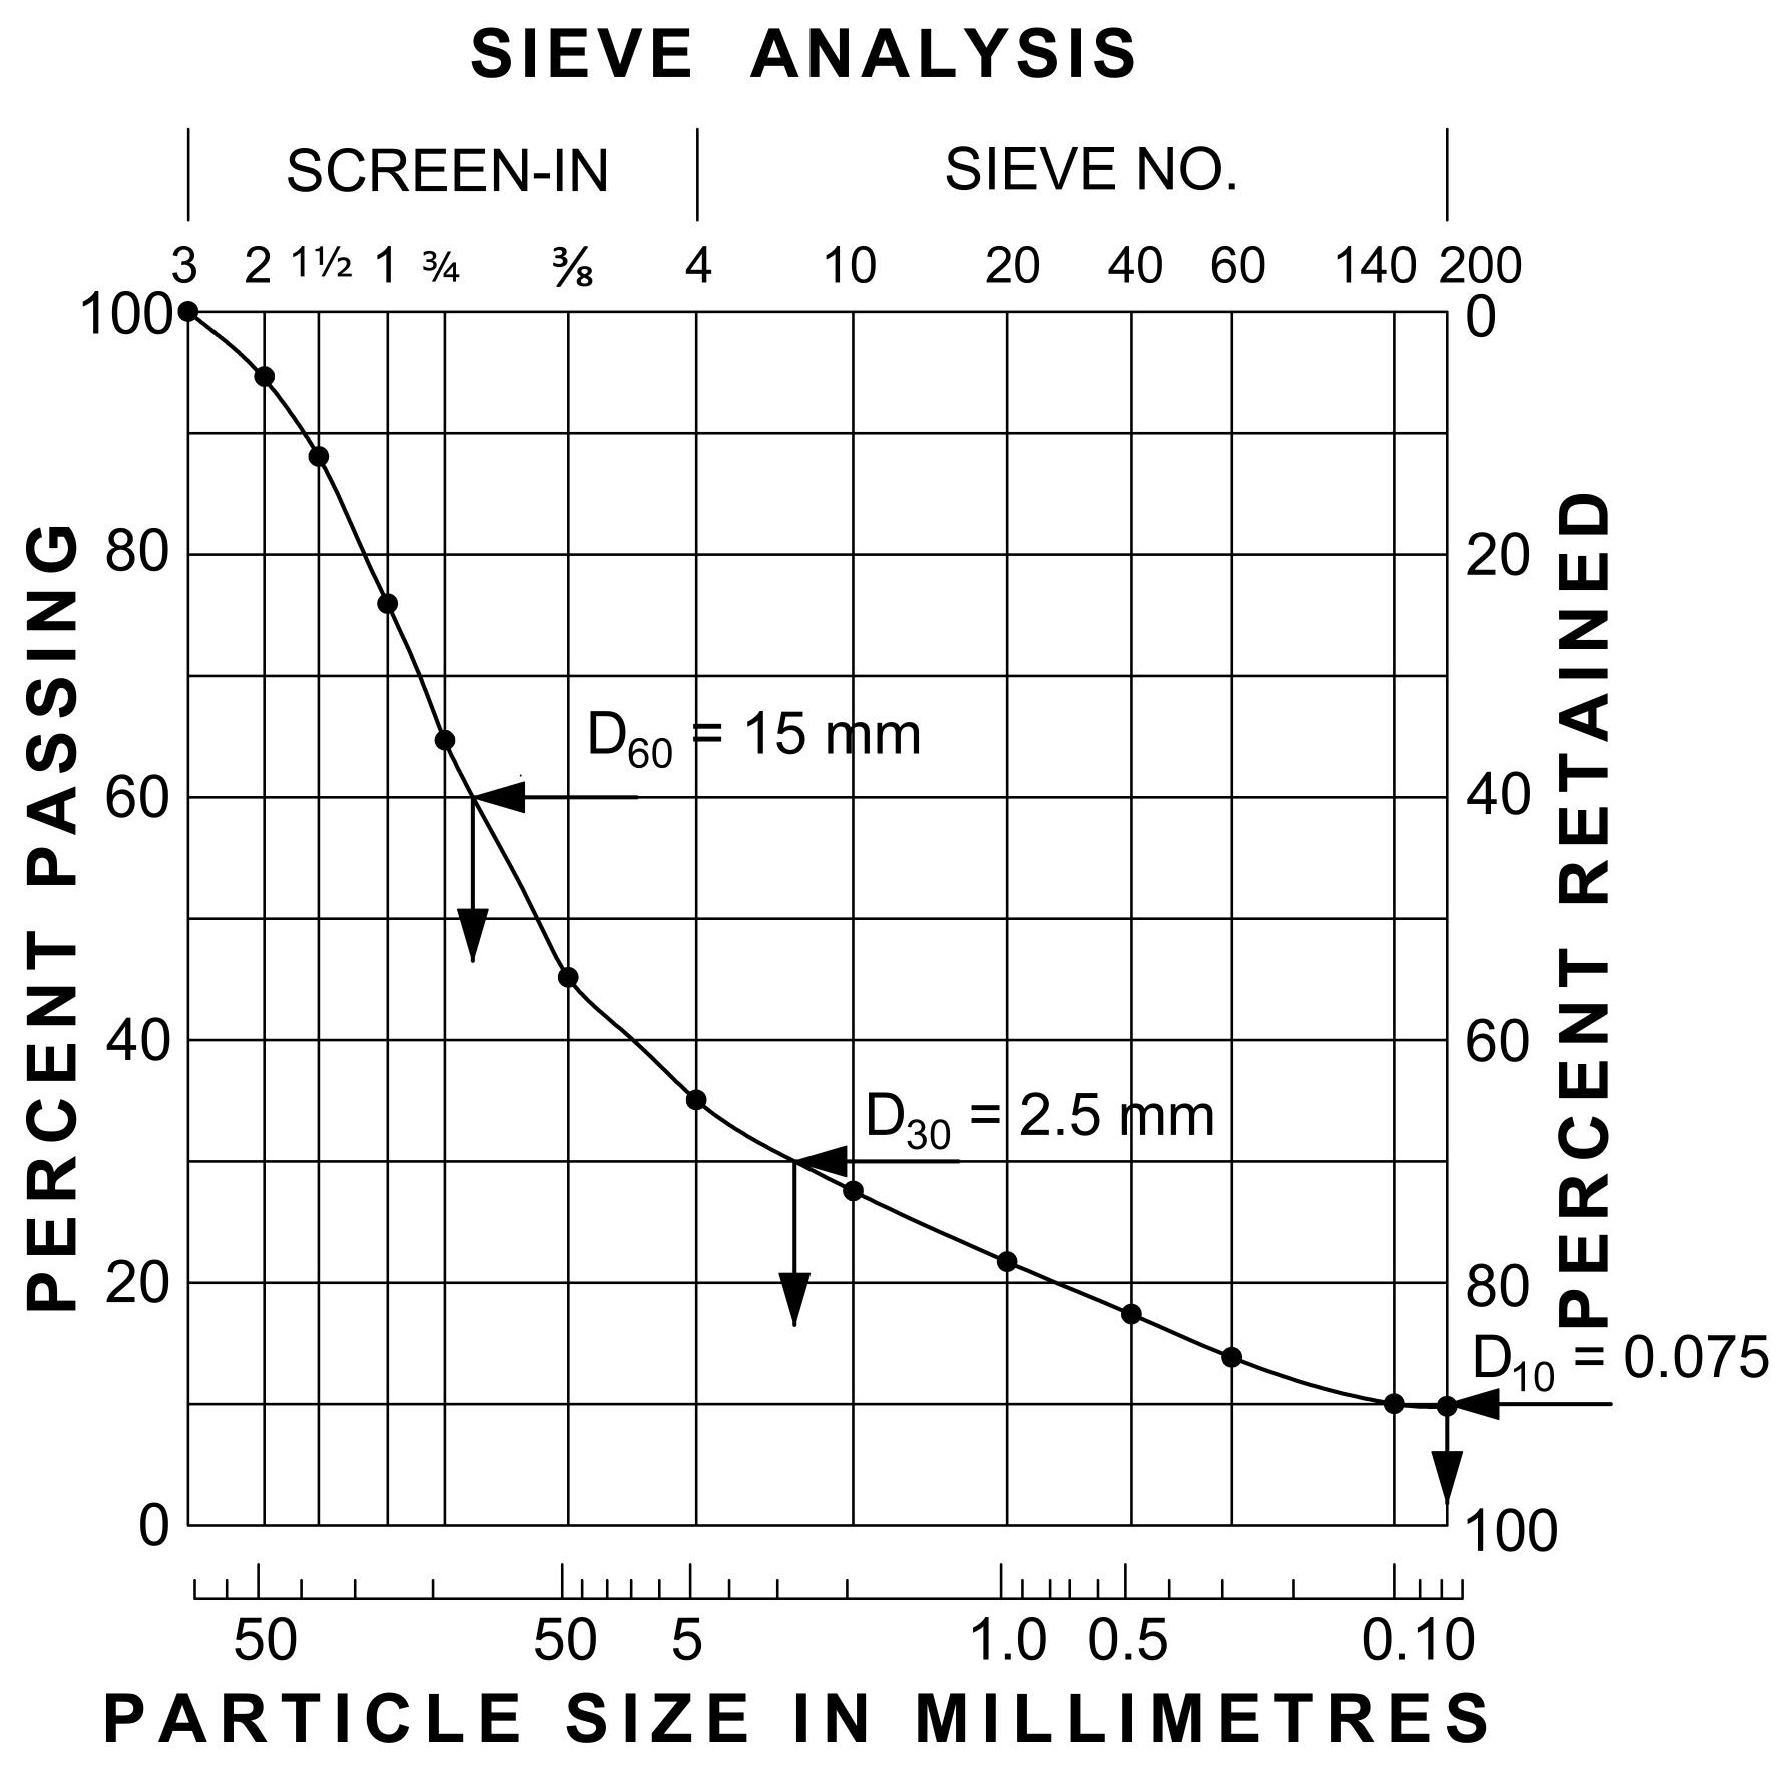
39] were employed in this Excel macro. According to the Excel macro, the user is provided with the option to select the desired sieve opening for implementation. Sieve sizes of 2.00 mm (No. 10) and 0.063 mm (sieve No. 230) are essential boundaries for the marking of soils according to PSNA. In order to conduct a comprehensive comparison between PSNA and ASTM D2487-17e1, it is essential to consider the inclusion of sieve sizes of 4.75 mm (sieve No. 4) and 0.075 mm (sieve No. 200) as mandatory thresholds for soil classification. Also, LL %, PL %, D
10, D
30, and D
60 values are necessary according to PSNA v.1.0. C
u and C
c parameters can be calculated automatically using typical grain diameters D
10, D
30, and D
60. If the user prefers, they have the option to input C
u and C
c values individually. The particles retained on the sieves should be recorded. Only yellow areas are entered into the macro. If there is no requirement between classification methods, sieve size 2.00 mm (sieve No. 10) and sieve size 0.063 mm (sieve No. 230) can be used. Following this procedure, the group symbol and group name are efficiently established within a matter of seconds using the Excel macro on the table.
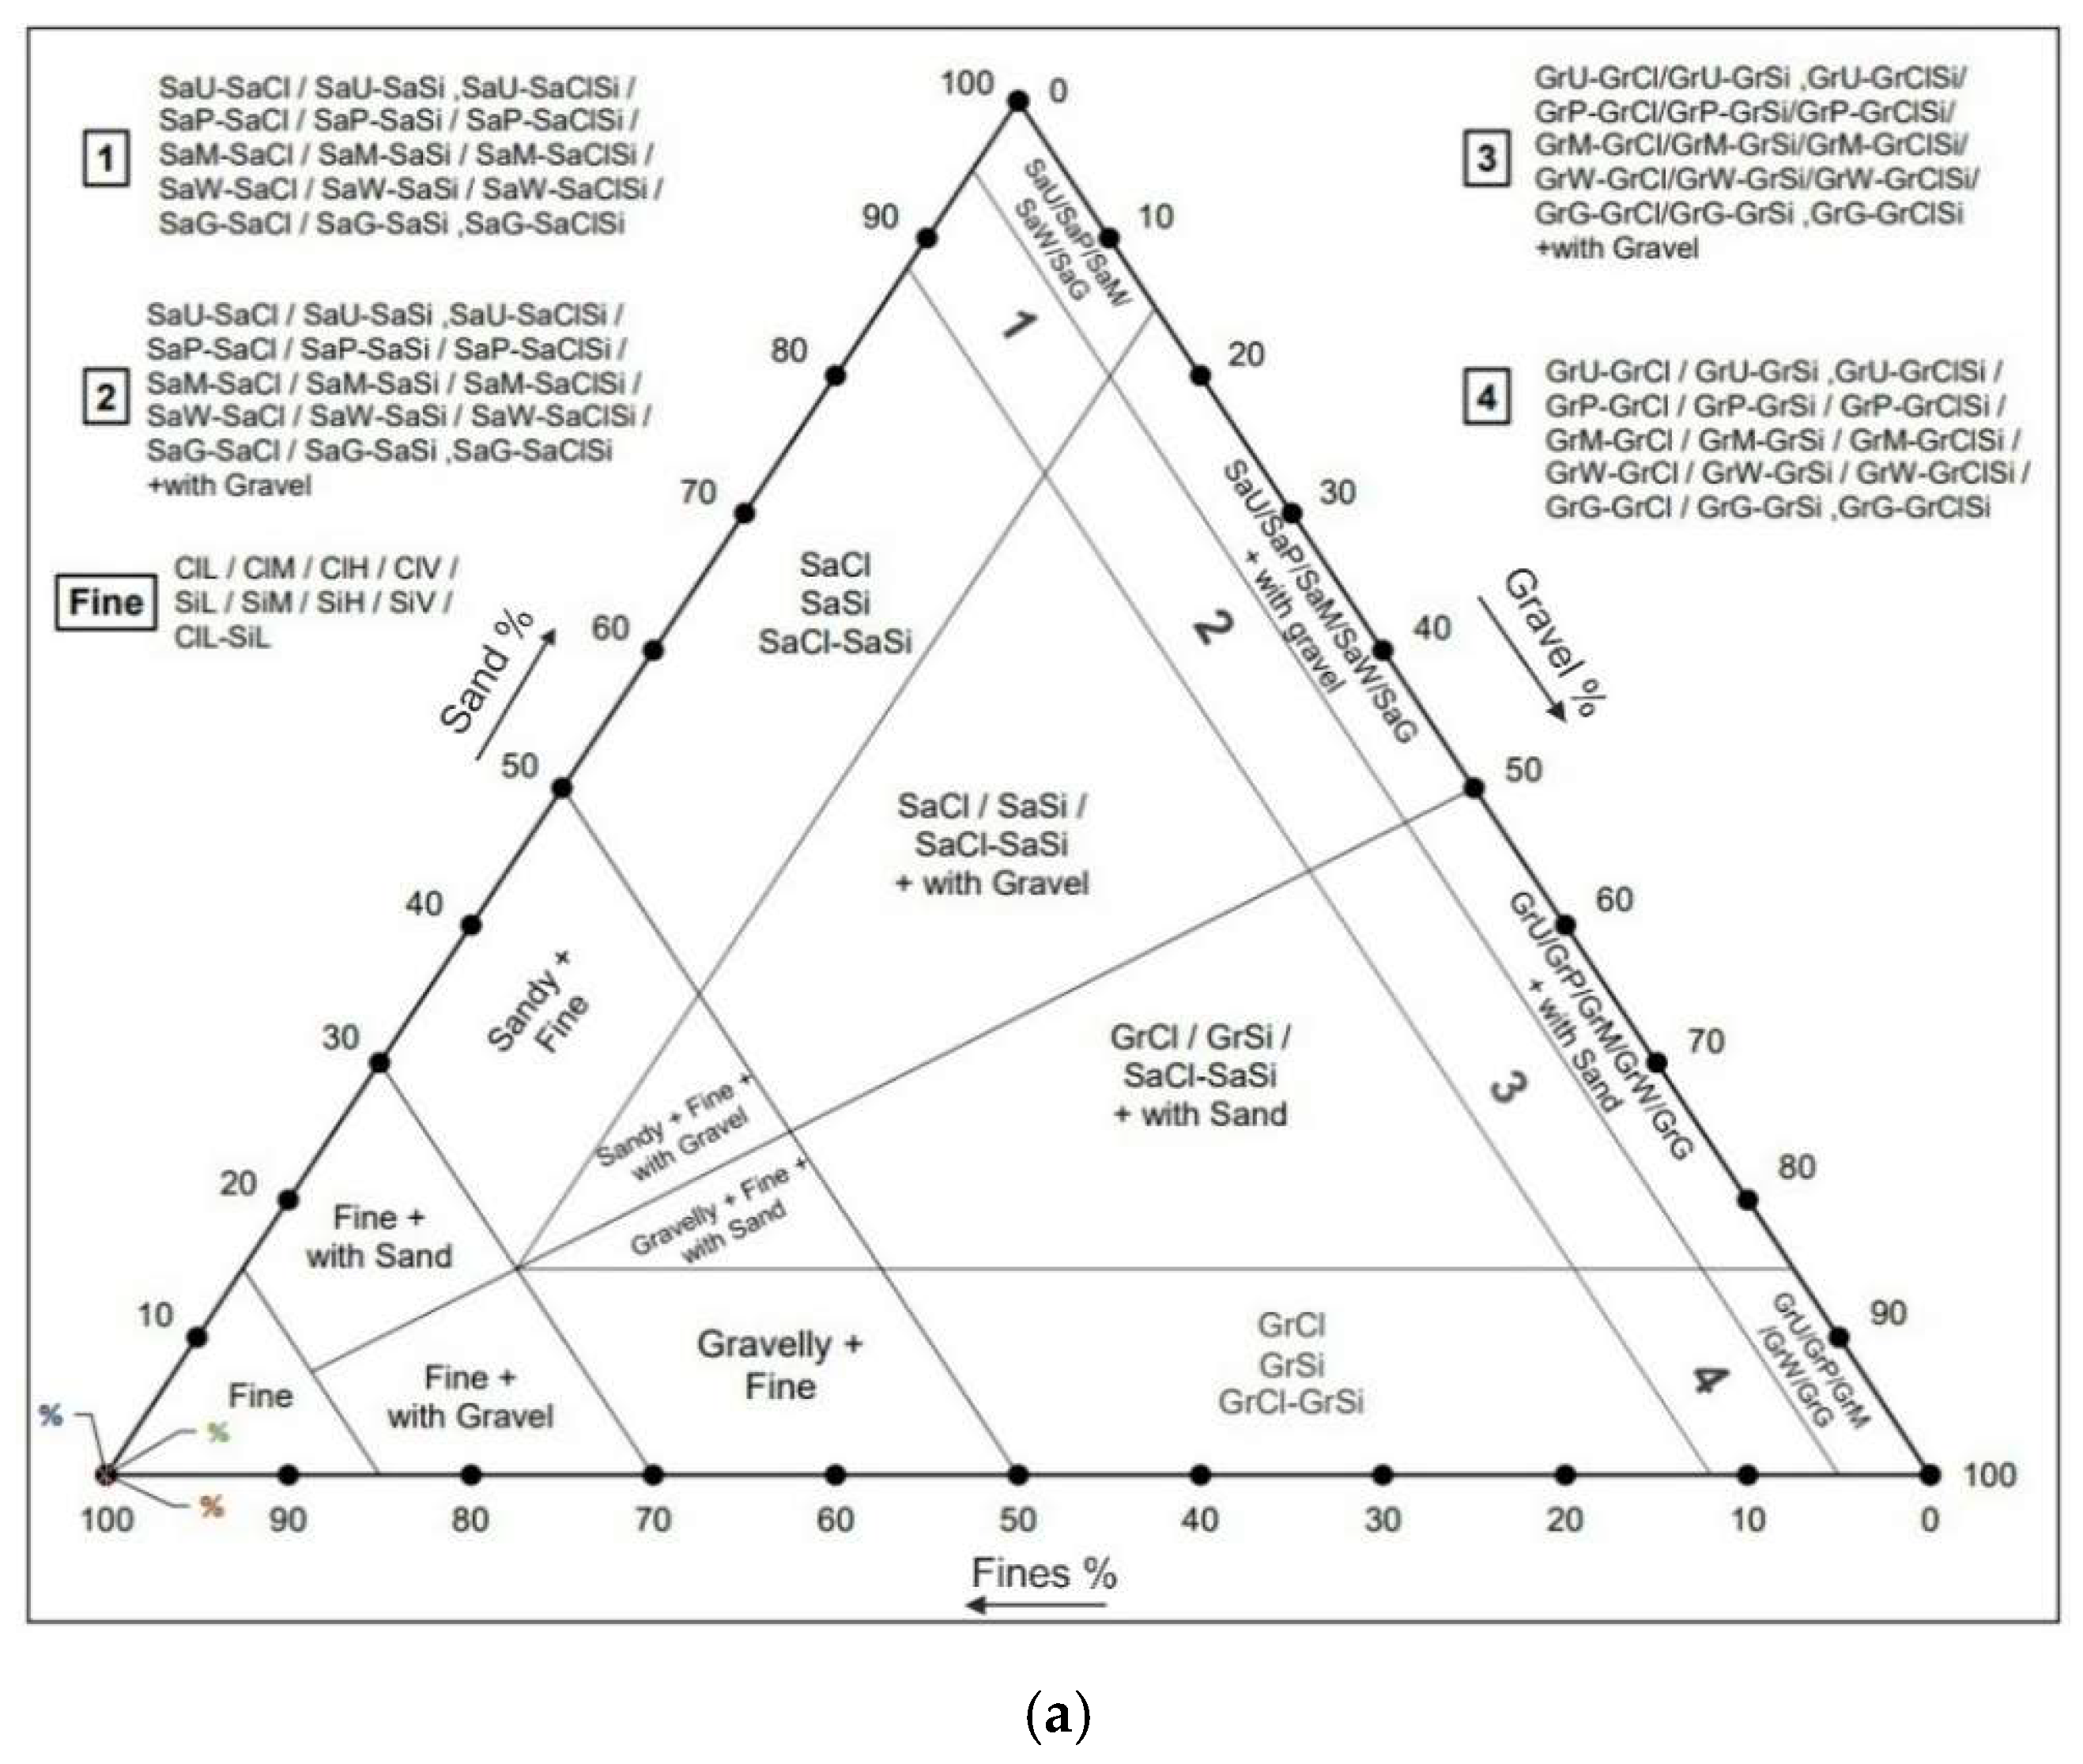
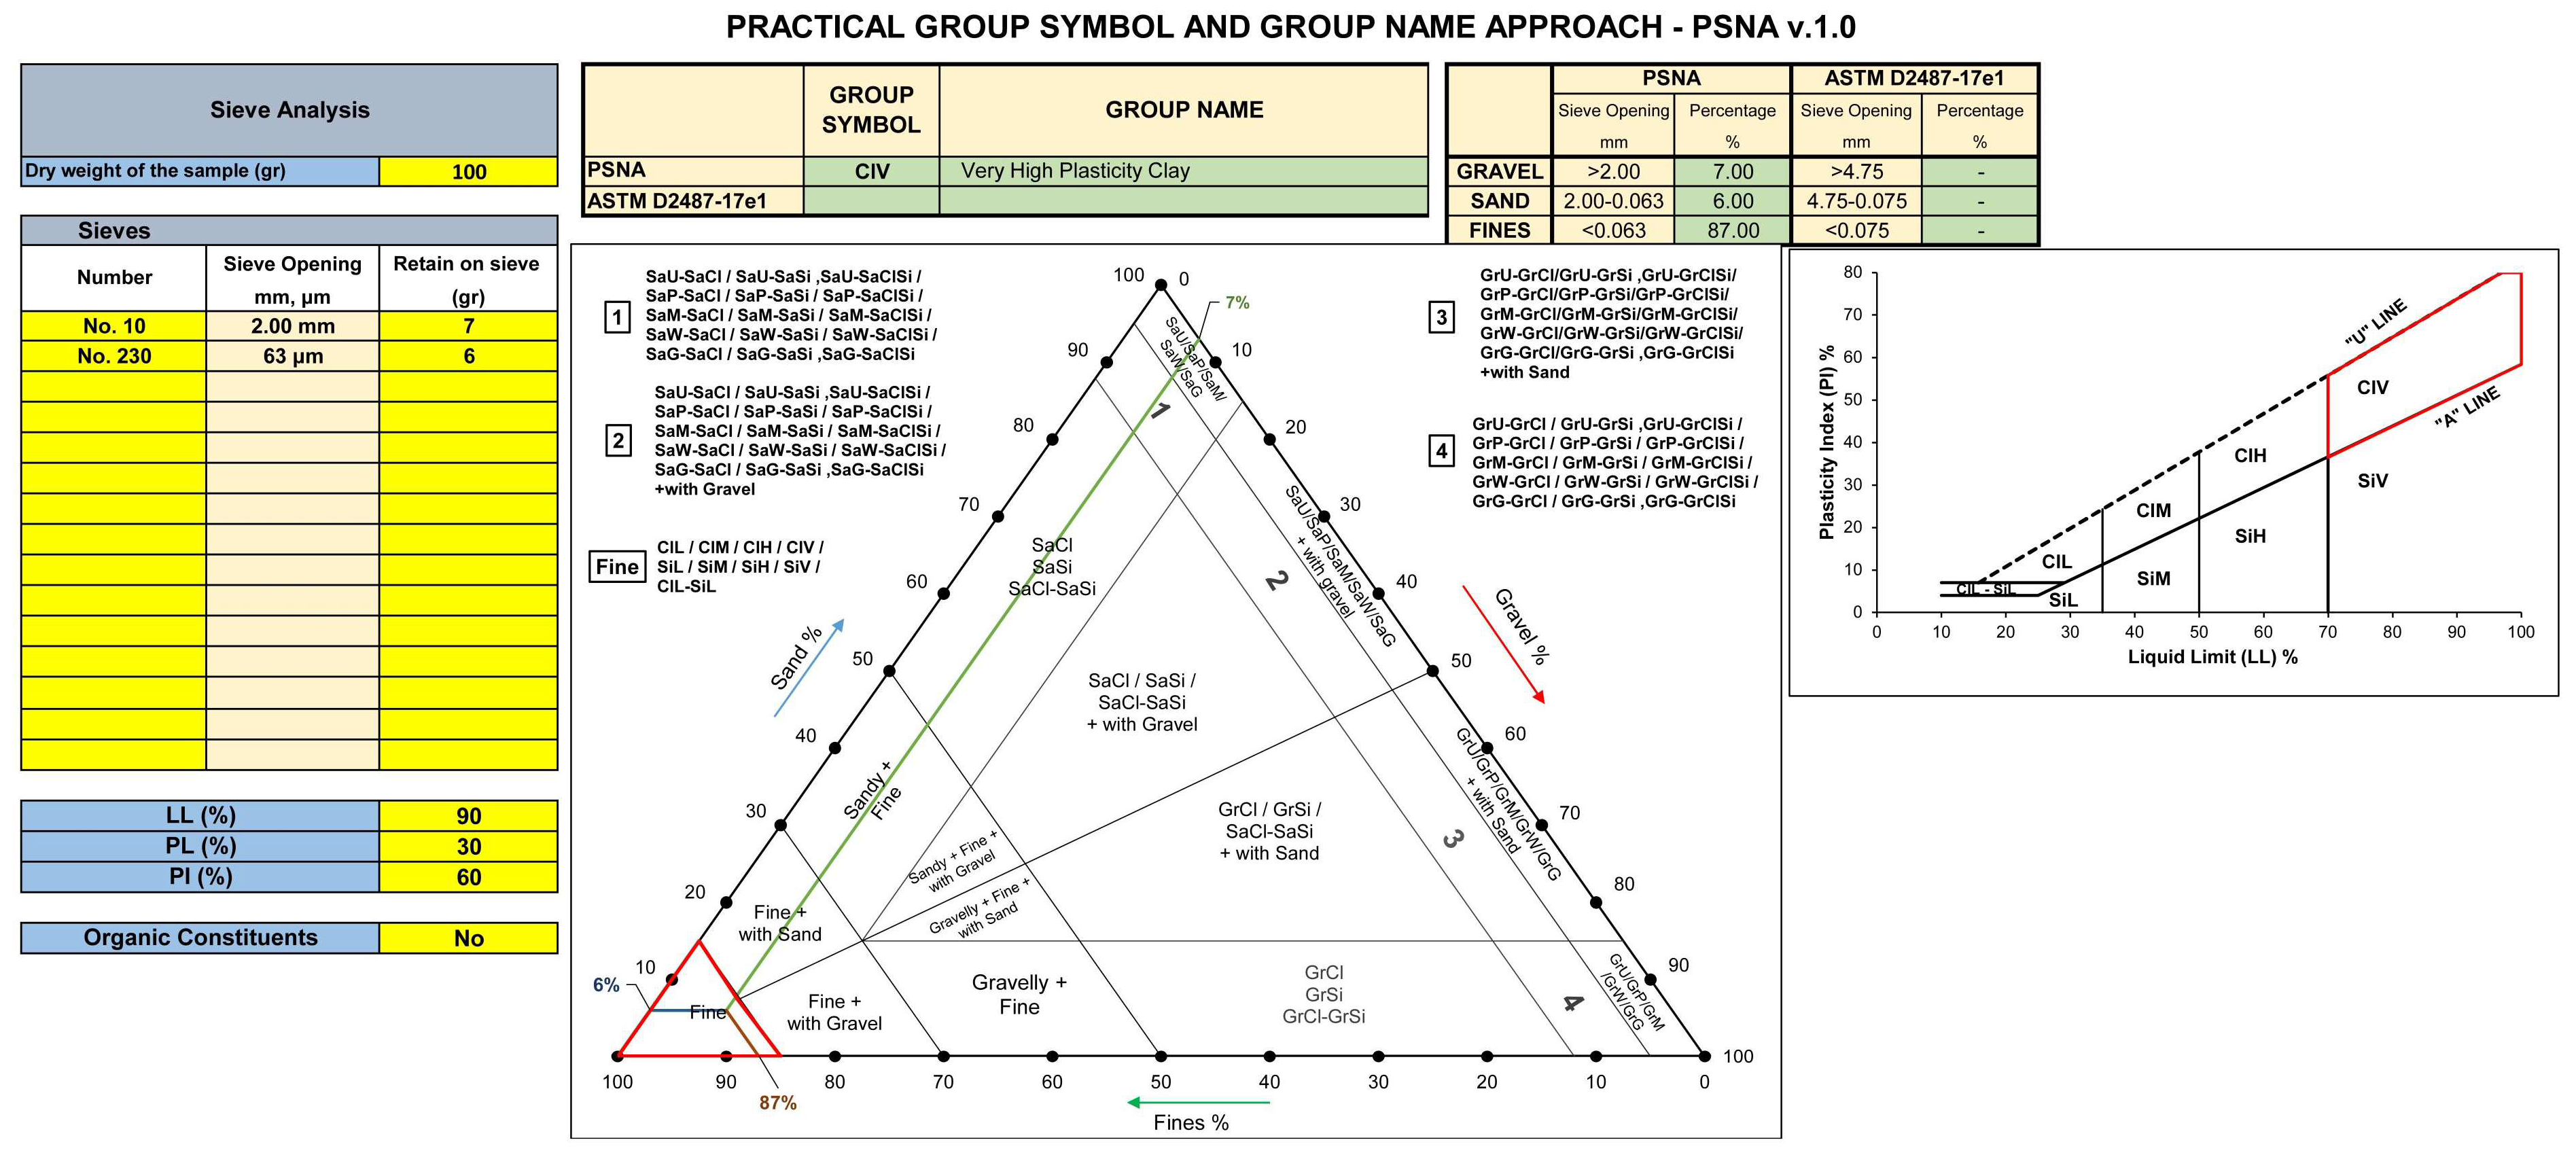
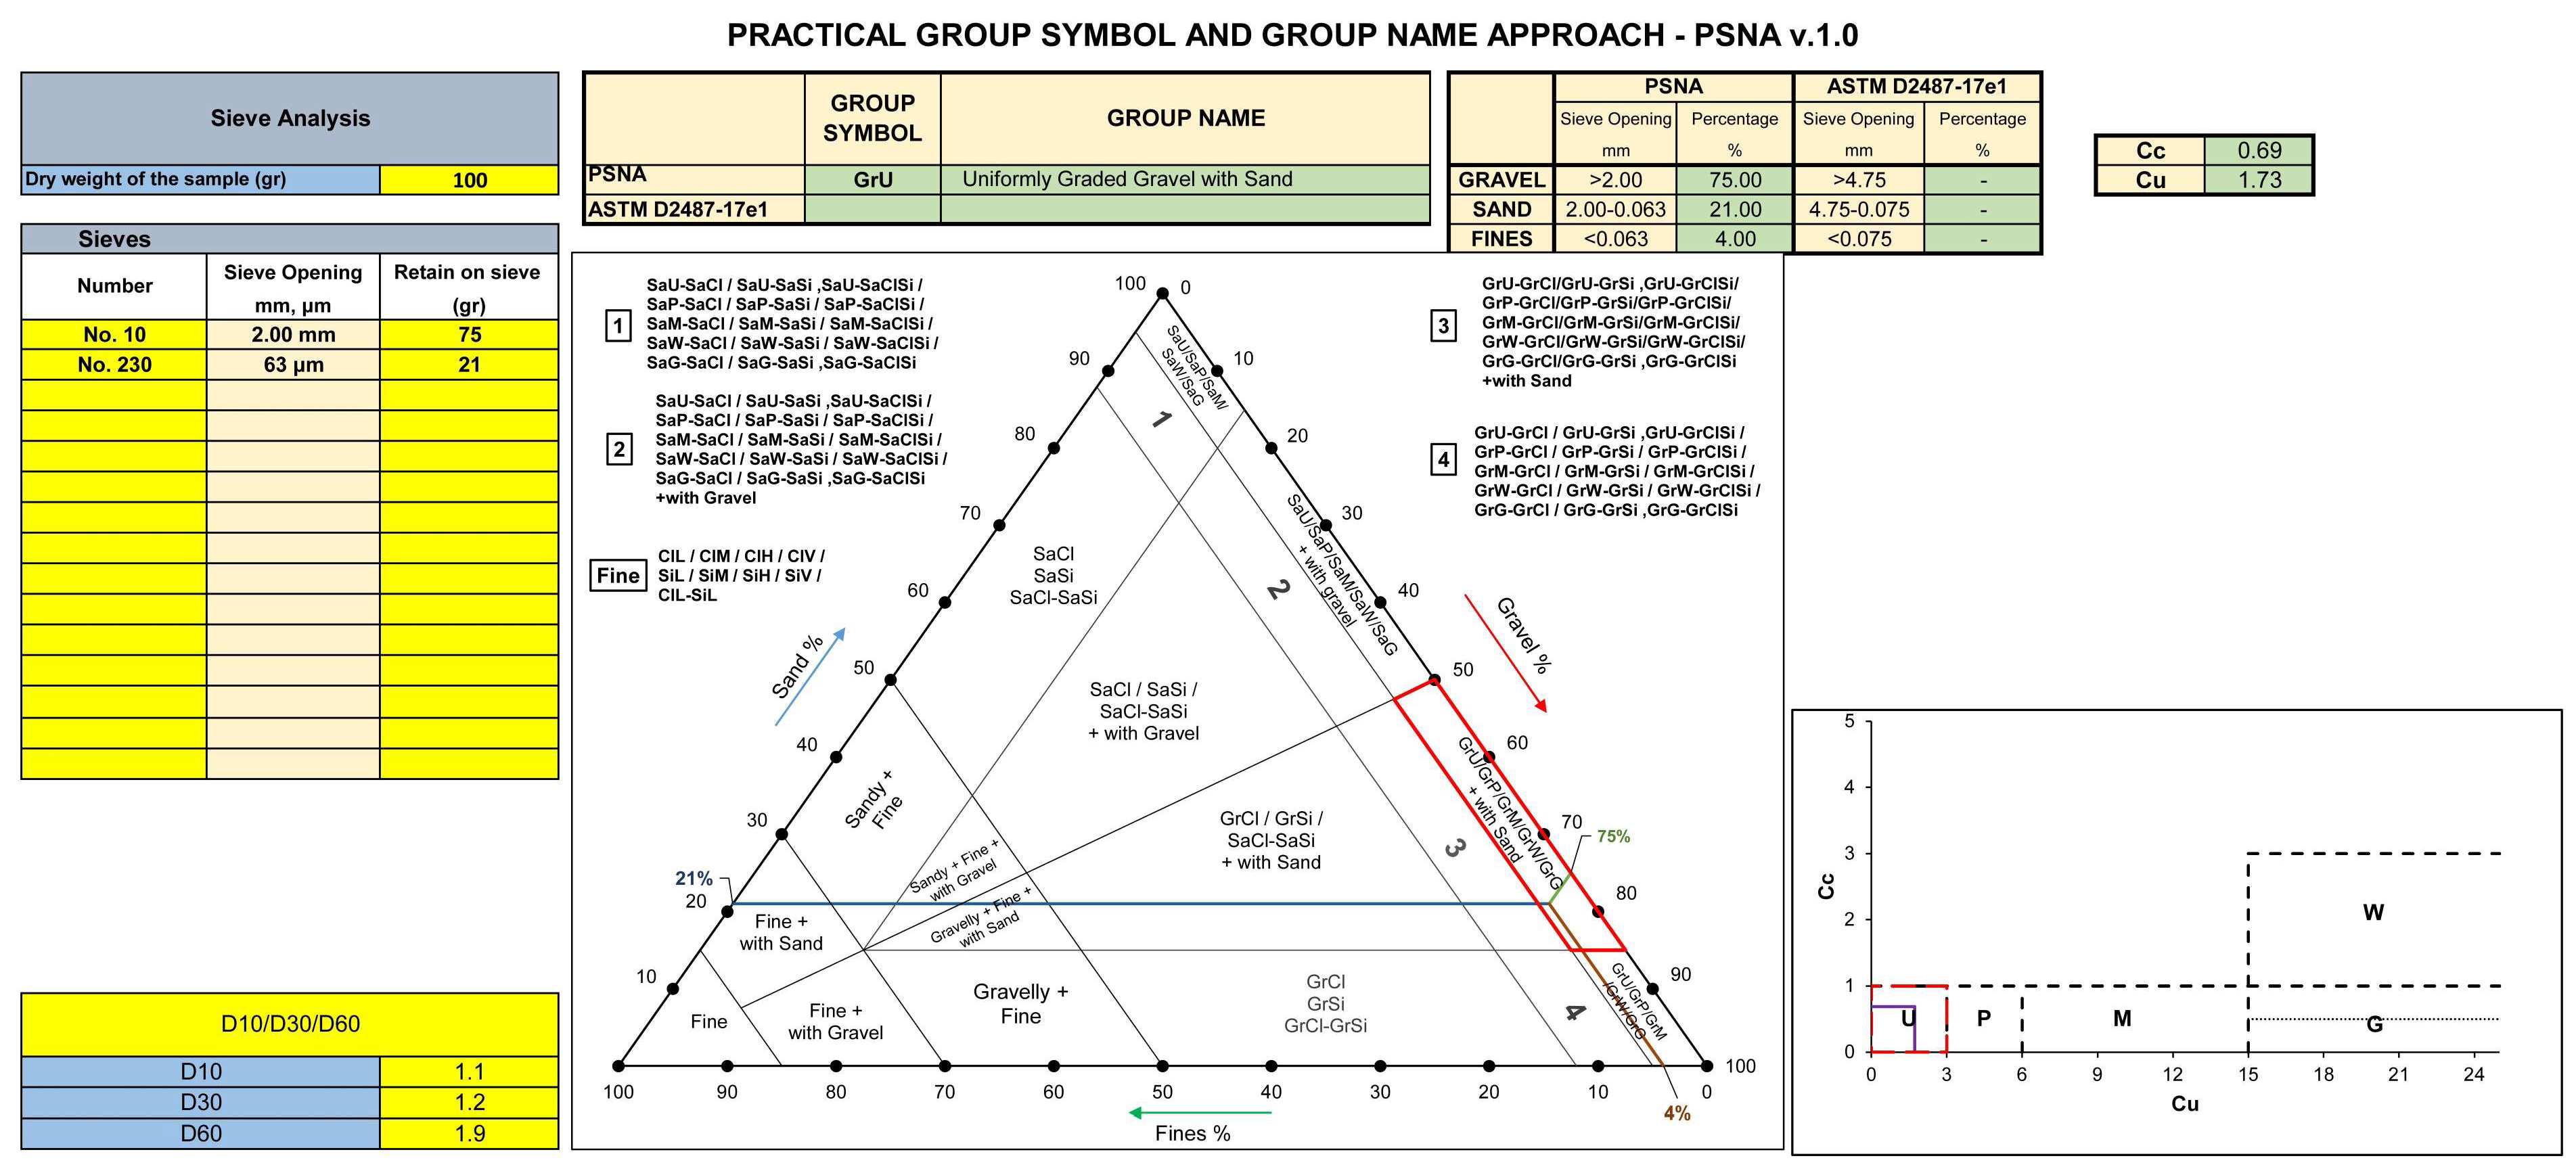
Additionally, a triangular diagram was developed in the present study to facilitate the interpretation of classification results for users of the PSNA v.1.0 macro. The edges of the triangle were prepared for gravel, sand, and fine particles (
Figure 6a). The arrowhead direction indicates the increase in particle percentage. The corners of the triangle are 100% for each particle, e.g., gravel, sand, and fine particles.
In general, a triangular diagram has an opportunity to display data based on three variables simultaneously. Triangular diagrams are easy to read and create and practical presentations for users. However, the triangular diagram developed in this study cannot classify soil alone because there is more than one group symbol in the same area. Therefore, an additional two charts were also used to overcome this obstacle. One of them was the plasticity chart (
Figure 6b) and the other one was the shape of the grading chart (C
u–C
c chart) (
Figure 6c). The shape of the grading chart was developed using C
u and C
c values in EN ISO 14688-2:2018 (
Table 2). According to the ratio of gravel, sand, and fines, a plasticity chart, C
u–C
c chart, or both were used.
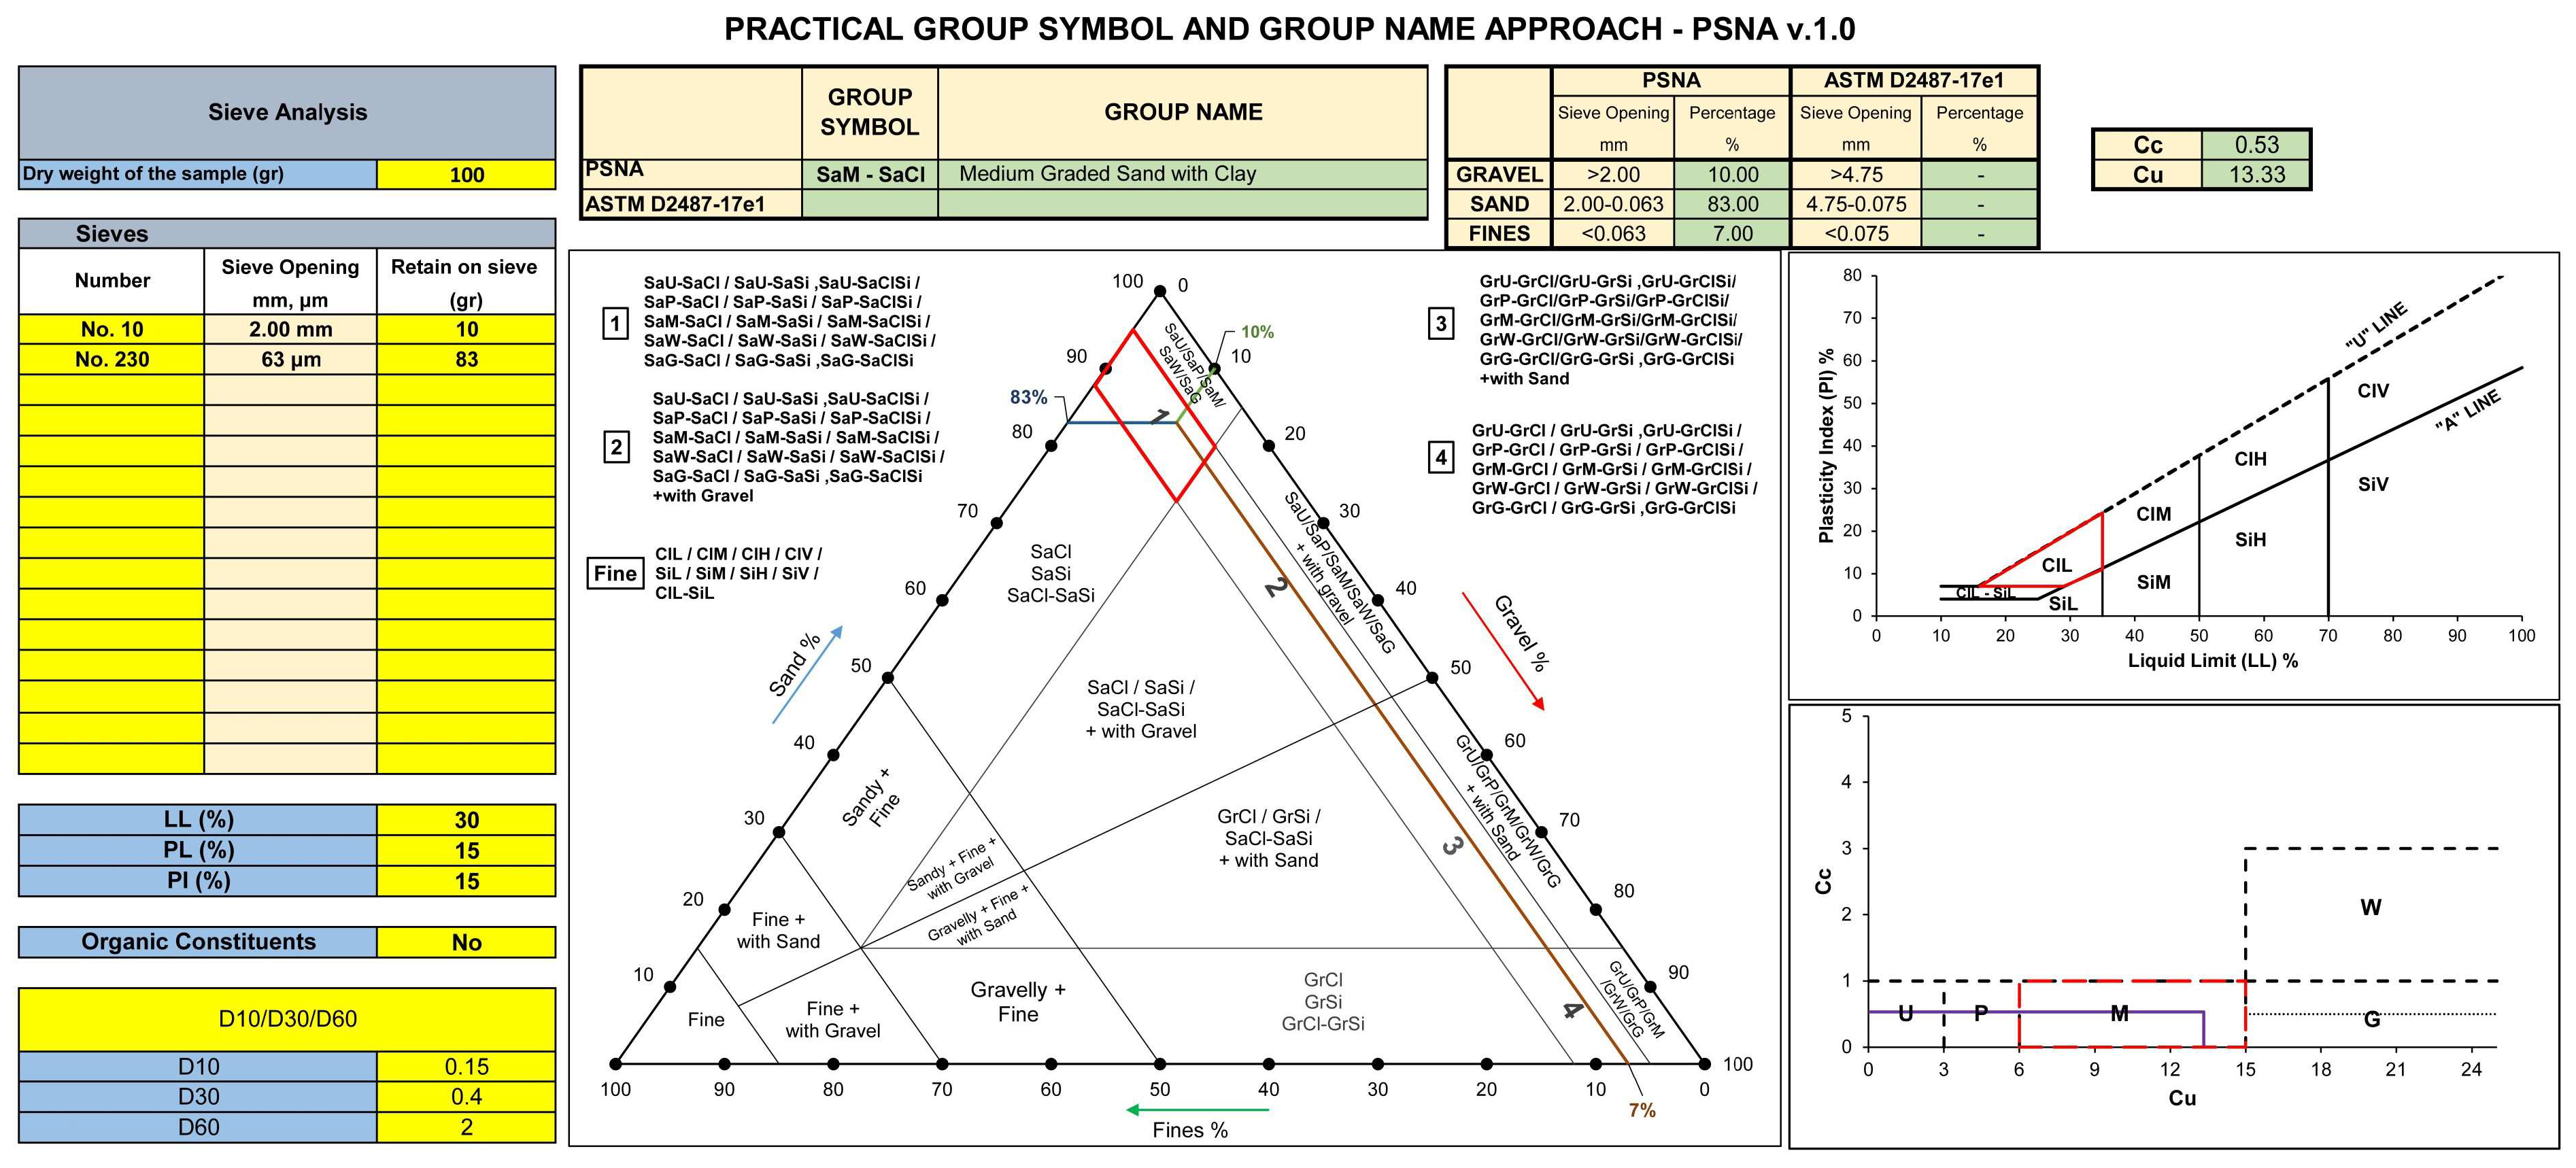
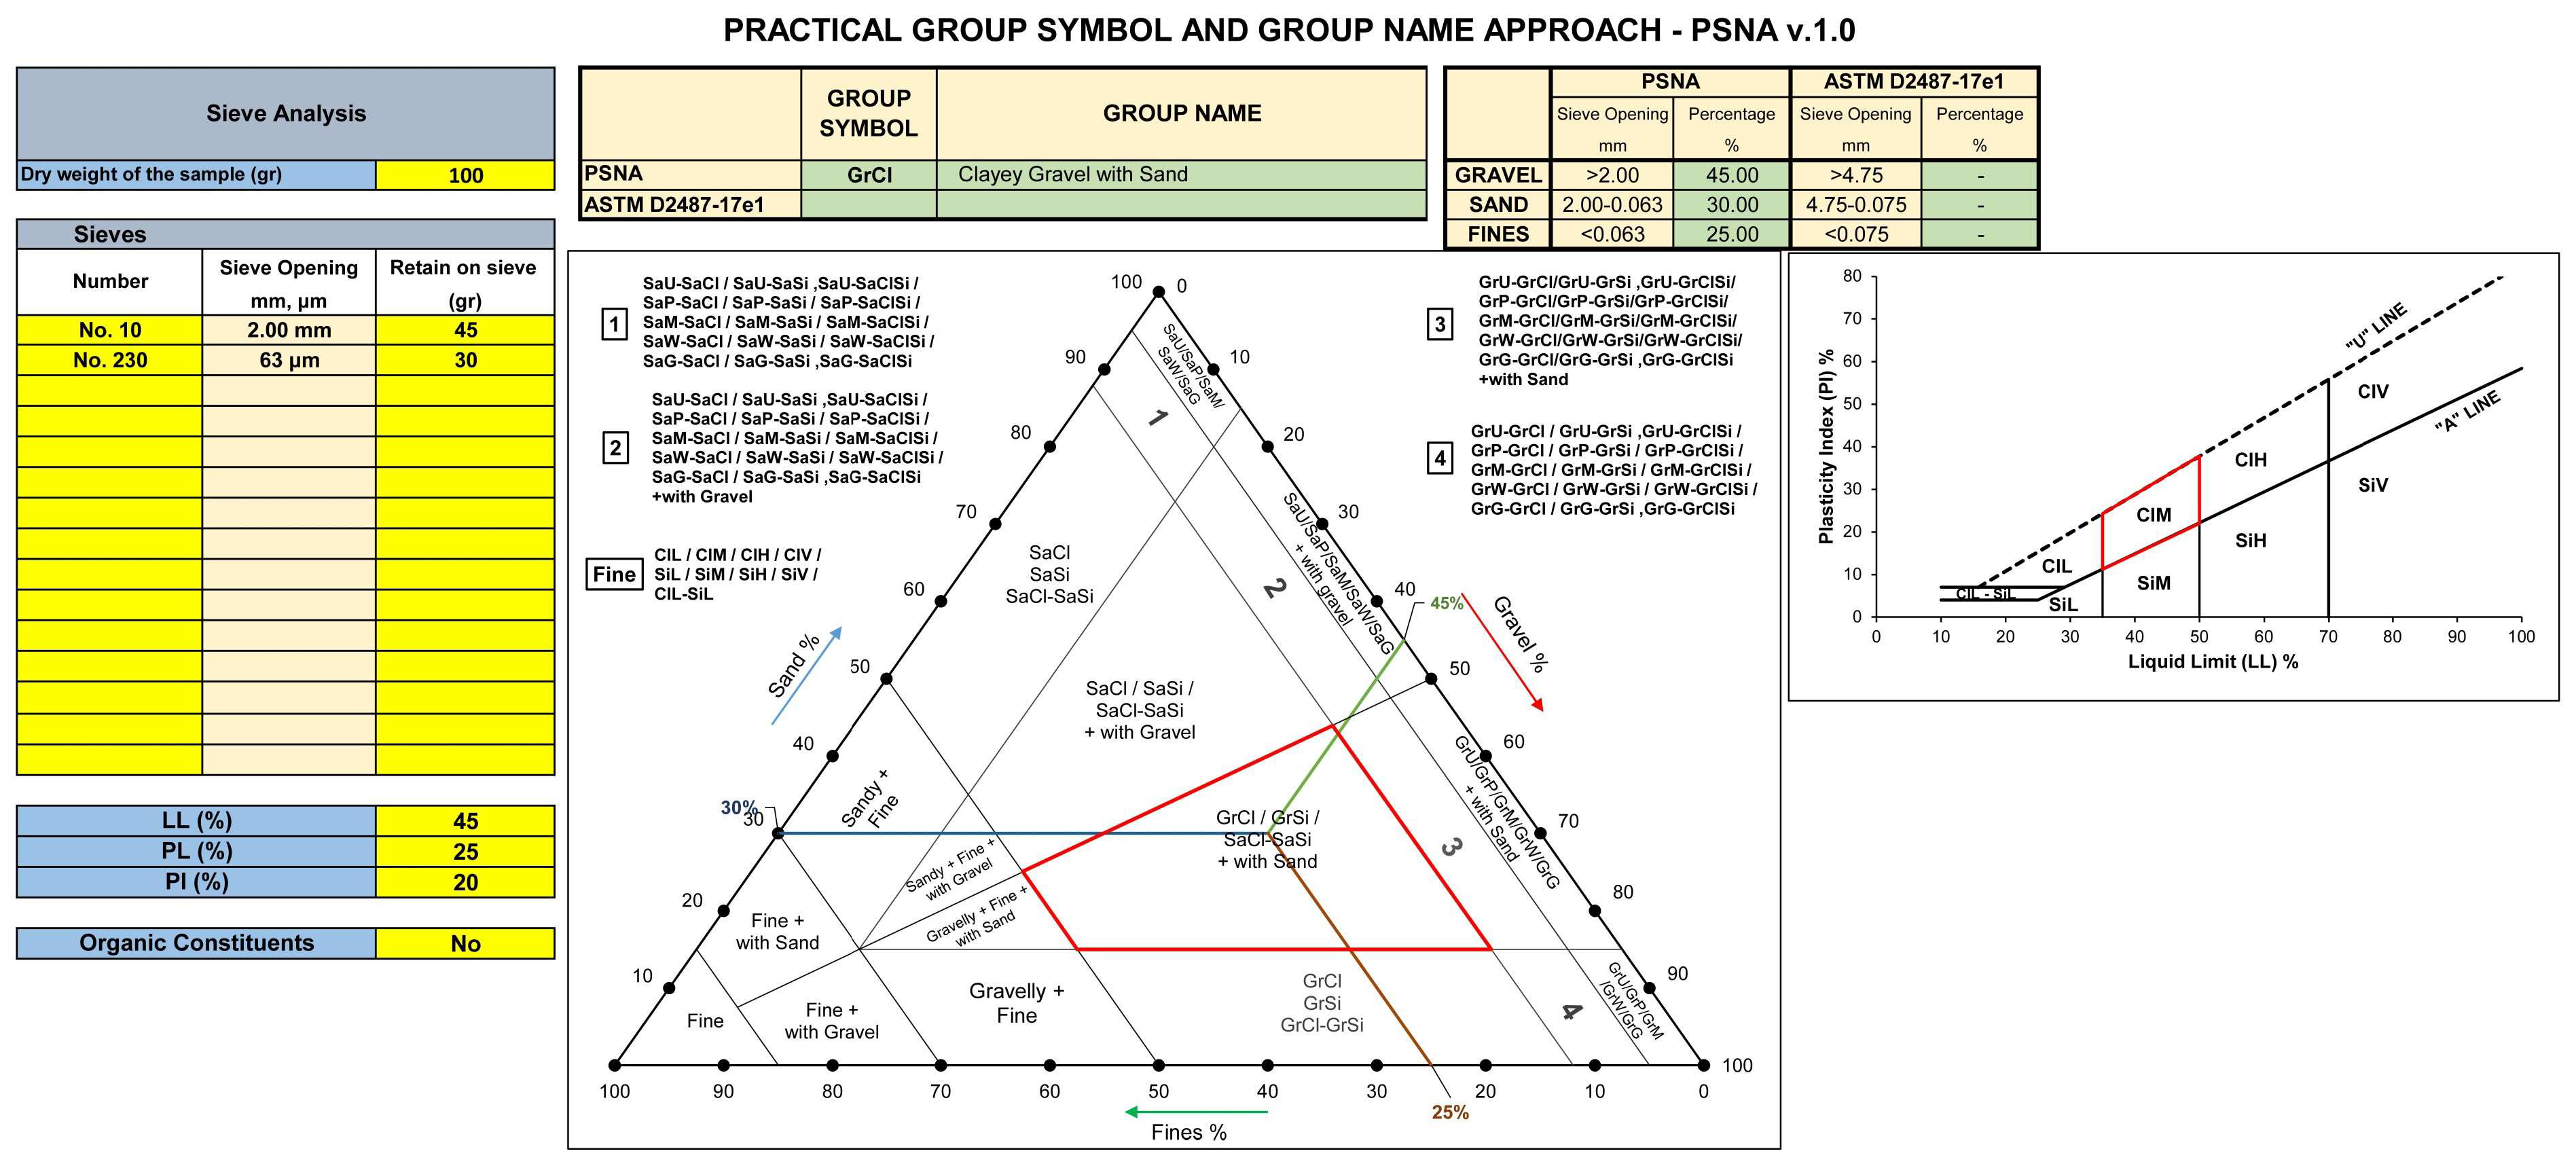
Figure 7 presents a visual representation of PSNA v.1.0.
To ascertain the location of a specific point within the triangular diagram, the sand ratio is determined on the basis of sand edge or, in other words, on the left side of the triangle. Additionally, a parallel line is drawn from this point toward the fine edge, which corresponds to the base of the triangle. Then, the gravel ratio is determined using the gravel edge or, in other words, the right side of the triangle. Then, a parallel line is drawn from this point to the sand edge or, in other words, to the left side of the triangle. Then, the ratio of the fine is determined on the fine edge or, in other words, the base of the triangle, and a parallel line is drawn from this point to the gravel edge, in other words, to the right side of the triangle. The group symbol of the soil particle is determined by the intersection of these three points. Nevertheless, it is evident from the triangular diagram that it is insufficient to merely classify and mark the group symbol. For this purpose, if a coarse material has less than 5% fine particles, only the Cu–Cc chart is used in addition to the triangular diagram. Currently, the plasticity chart is not displayed within the Excel macro. If the fine particle is more than 12% in terms of coarse material and fine materials, a plasticity chart is used in addition to the triangular diagram. Currently, the Cu–Cc chart is not displayed within the Excel macro. If the fine particle concentration is between 5–12% in coarse material, both the Cu–Cc chart and plasticity chart are used together in addition to the triangular diagram. Currently, two charts are displayed within the Excel macro.
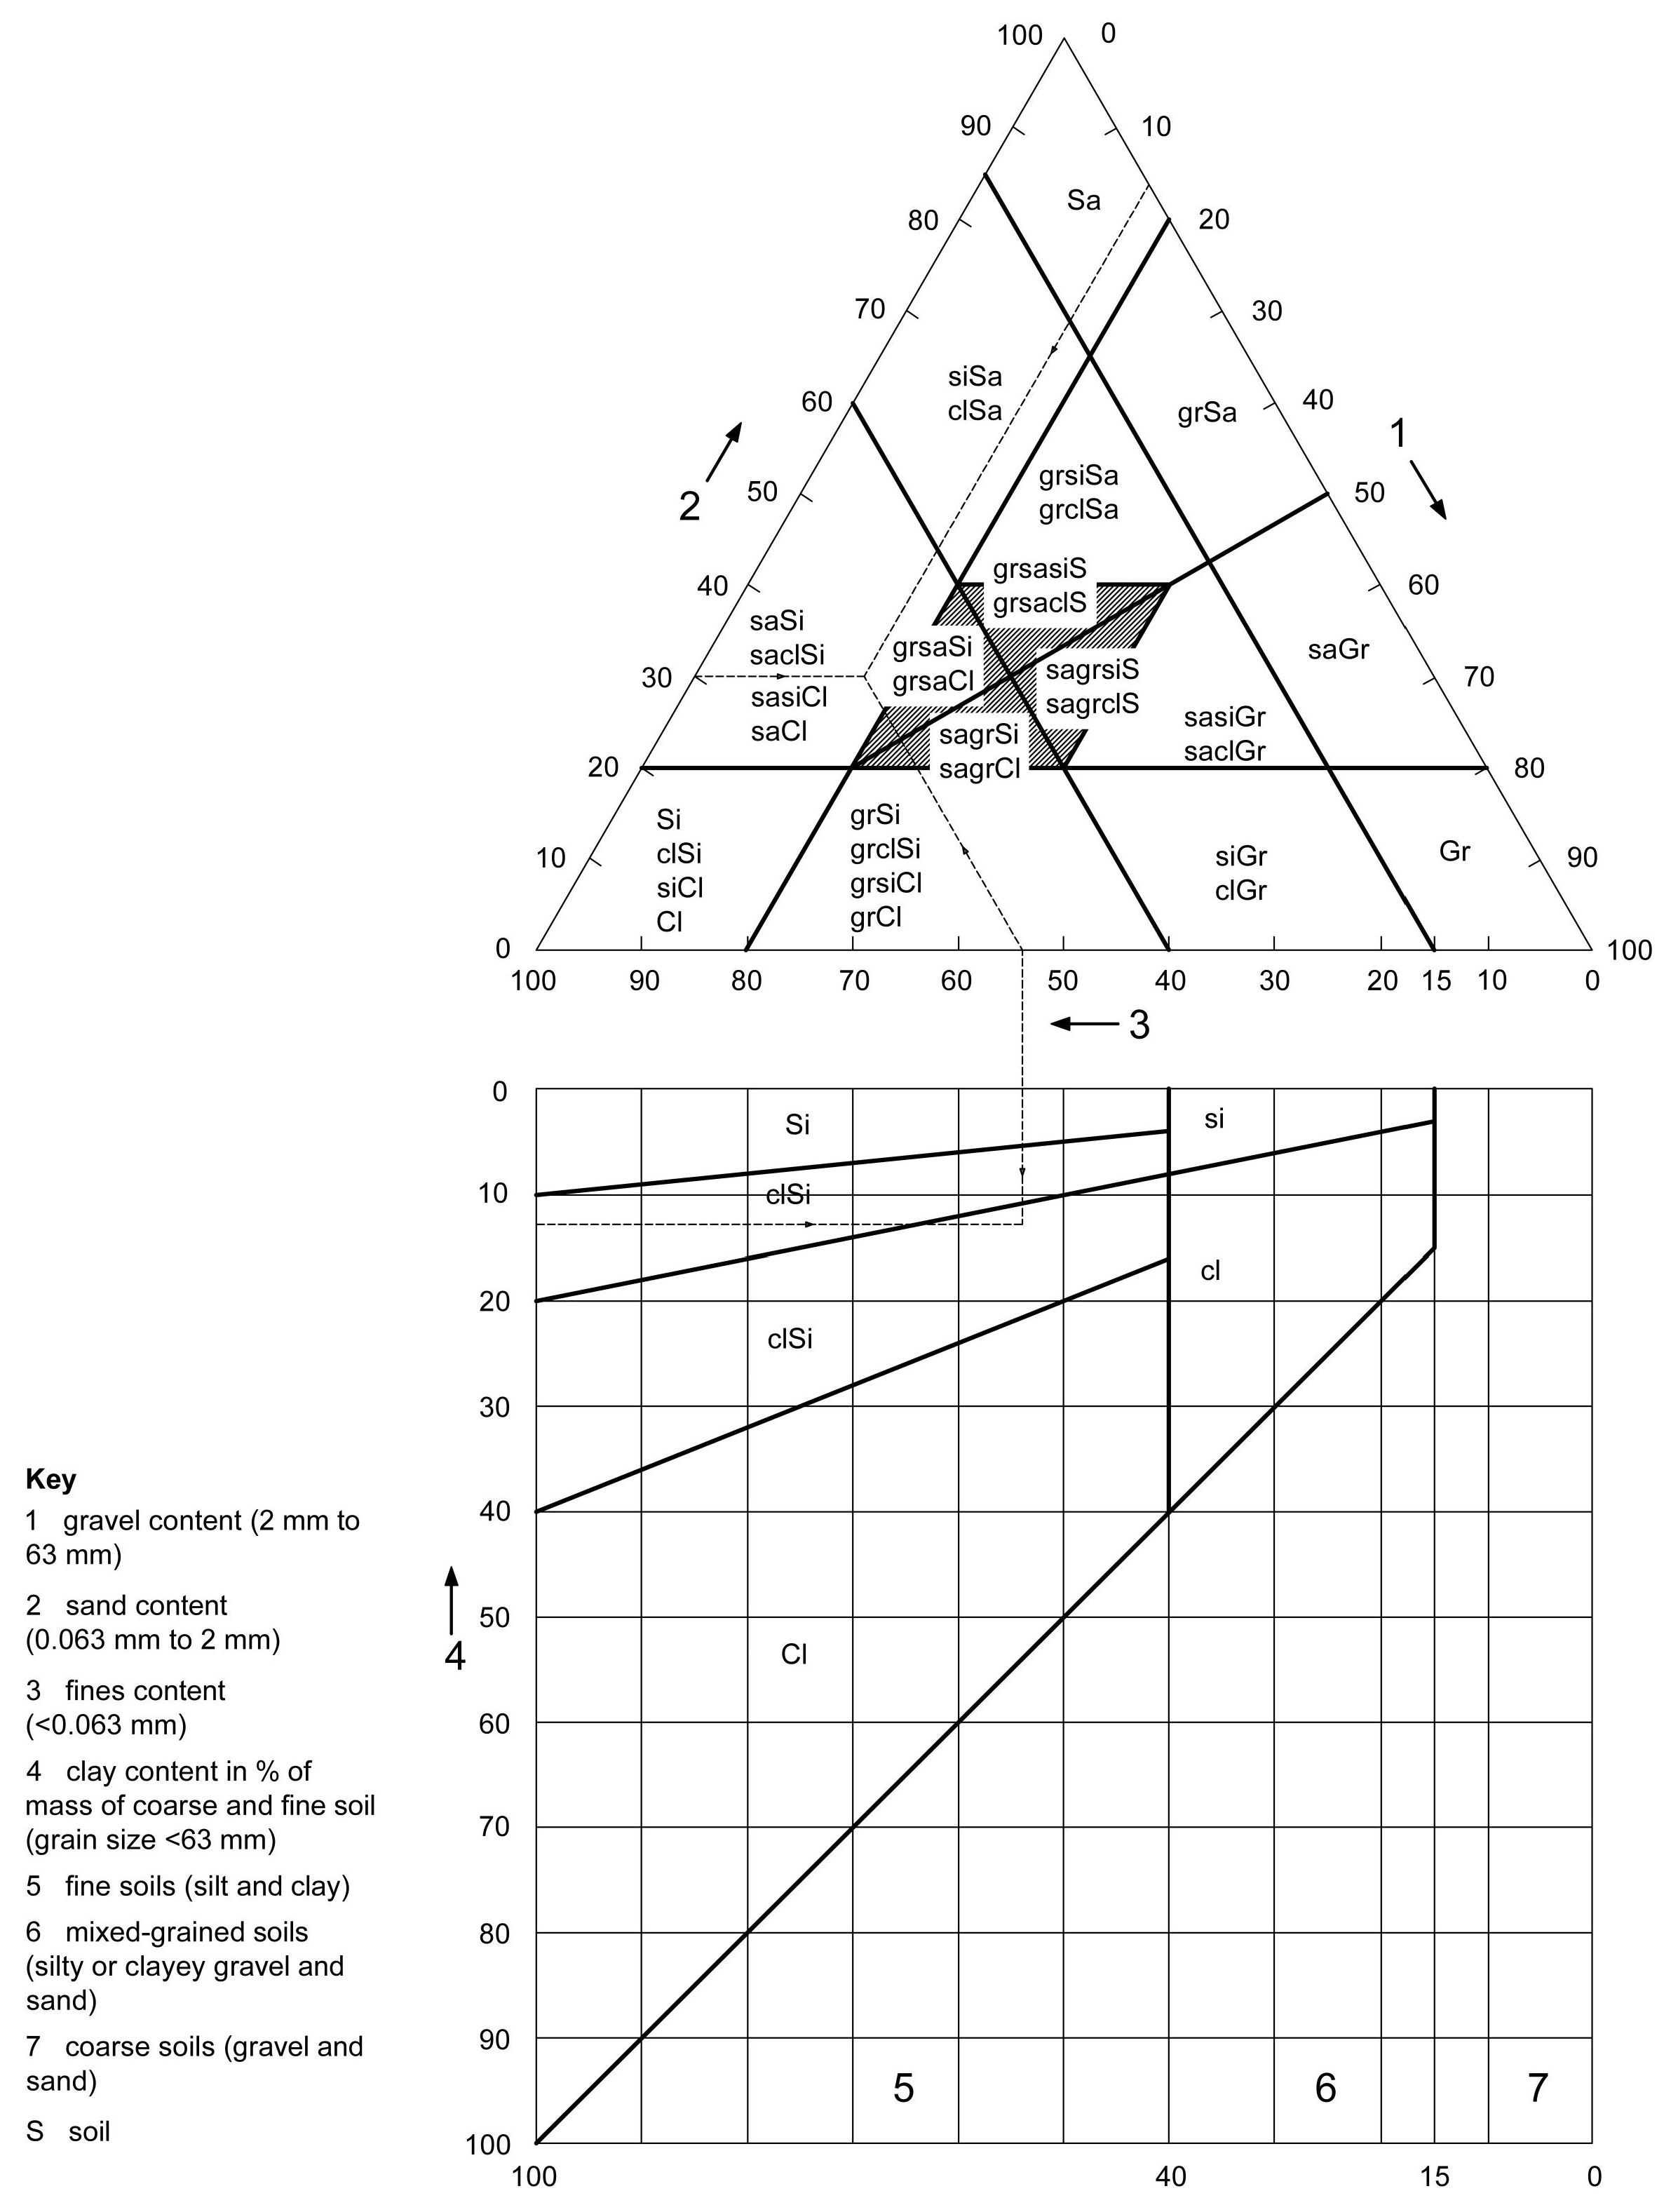
A triangular diagram was also proposed in the withdrawn version of EN ISO 14688-2:2004 [
17] but it was based on grading alone (
Figure 8). The classification methodology using the triangular diagram did not consider the plasticity chart in EN ISO 14688-2:2004. This diagram was insufficient to help in the classification.
EN ISO 14688-2:2018 [
21] does not include a triangular diagram. In this study, because of the practicality and readability of a triangular diagram, a novel diagram was developed. All the boundary percentages between particle sizes and the main structure of the triangular diagram developed here are different from those in EN ISO 14688-2:2004, except for the particles written at the corners of the triangle.
Examples for PSNA v.1.0
Six different characterized soils were prepared to assess the proposed method presented herein. The samples were assessed and designated a group symbol and group name according to PSNA. The utilization of the proposed Excel macro PSNA v.1.0 proved to be beneficial in facilitating the classification and marking procedures. The screen views were illustrated for each soil type (
Figure 9,
Figure 10,
Figure 11,
Figure 12,
Figure 13 and
Figure 14). Each example had different retain sieve weights. To explain the method easily and clearly, the examples were constructed for two compulsory sieves and a sample size of 100 g.
Table 6 presents the parameters of soils utilized for the marking. Finally, group symbols and group names of soils were obtained using the Excel Macro PSNA v.1.0.
5. Results and Discussion
A novel practical marking approach called the Practical Soil Marking Approach (PSNA) was proposed in this study. The approach described in this paper does not constitute a classification system or a standard. However, it offers a method to effectively utilize EN ISO 14688-2:2018 [
21], which cannot provide group names and group symbols in practice, by enabling the detailed identification of soil particles in practical applications and assigning them appropriate categorization. The process of doing so relies on the standard EN ISO 14688-2:2018 as its foundation. However, in cases where EN ISO 14688-2:2018 is insufficient in definitions of soils, ASTM D2487-17e1 [
25] is utilized. The standard EN ISO 14688-2:2018, which was approved in 2018, primarily focuses on providing general principles related to soil. However, it does not provide comprehensive guidance on the symbolization of soil particles. Therefore, this particular standard is not suitable for the classification of soil masses, particularly for practical engineers. To overcome these general assessments, this study proposed a novel, useful, and practical identification of group names and symbols proposed based on EN ISO 14688-2:2018. The objective was to enhance the practical applicability of EN ISO 14688-2:2018. If scientists are to identify and classify soils, the literature must spell out the precise soil classification methods required in practice. The proposed approach was based on EN ISO 14688-2:2018 and it drew from ASTM D2487-17e1 for the logical principles of group name and group symbol.
It is difficult to accept a new way of soil marking (e.g., sand is not marked as S but rather as Sa), based on using secondary fractions in front of primary fractions and explanations of group names in the event of extensive local presence. The research conducted in this study addressed these difficulties. In this study, classification was based on EN ISO 14688-2:2018 and so Gr, Sa, Si, and Cl symbols were used, and the dominant particles were always used as the initial symbol. Secondary fraction particles were used after the initial primary symbolization.
Useful flow charts were prepared to identify and mark different grain-sized particles. According to these charts, gravel, sand, silt, clay, and organic materials can be classified.
By inputting the measured mass of soil particles retained on a sieve, users can promptly obtain the corresponding soil particle group name and group symbol within a brief period. The Excel macro provides the ability to identify soils in accordance with the ASTM D2487-17e1 standard and the PSNA v.1.0. In this study, a total of 55 group symbols and 155 group names were identified based on PSNA. Thus, it has been determined that PSNA can identify soils in detail (
Table 7). A practical and useful method should be able to provide the boundaries of the particles clearly after assessing the soil mass precisely. Identifying and classifying soil is the first step in designing projects. The more detailed the classification, the more precise data a project generates. The classification of soil should consist of both a group name and a group symbol. If only a symbol is used, this can be misleading.
While the soil identification approach may appear complex due to the numerous groups and symbols involved, it may be effectively recognized by following a systematic flow chart. Furthermore, the Excel macro developed for the study was prepared to enhance the practicality of soil identification.
6. Conclusions
In the present study, PSNA was developed for the identification and marking of symbols of soil mass based on EN ISO 14688-2:2018 [
21]. Because EN ISO 14688-2:2018 does not provide specific percentages for the classification, it is not feasible for a user to utilize EN ISO 14688-2:2018 to classify soil comprehensively, including the assignment of group name and group symbol. Within countries that are members of the European Committee for Standardization (CEN), the national standard was withdrawn in cases where it conflicted with EN ISO 14688-2:2018. Therefore, many countries need a comprehensive method, but EN ISO 14688-2:2018 cannot close this gap owing to the use of general principles. Hence, this study proposed an identification and marking method for soils based on EN ISO 14688-2:2018. However, to accurately classify soil, it is necessary to possess comprehensive boundary ratios. Thus, the utilization of ASTM D2487-17e1 [
25] proved to be beneficial in facilitating the progress of this study. With this proposed soil marking approach, a detailed classification, marked group symbols and group names of soils were provided.
In order to provide appropriate engineering solutions, geotechnical engineers must initially undertake comprehensive descriptions and classifications of the soil in question. Understanding the relative quantities of soil particles within a soil mixture is essential for accurately resolving geotechnical problems. Therefore, a detailed description is crucial in understanding the engineering behavior of the soil. However, a detailed classification cannot be produced using the EN ISO 14688-2:2018 standard. The approach proposed in this study aims to overcome this limitation.
The soil definition in PSNA v.1.0 provides great convenience to the user. PSNA v.1.0, which is currently based only on EN ISO 14688-2:2018 and ASTM D2487-17e1, is a program that is open to development. Additionally, it can be defined and evaluated according to different standards for further studies. This approach helps engineers to use the same soil identification principles and to understand, describe, and interpret the material and its results. A precise and comprehensive depiction of soil characteristics also enhances effective communication among geotechnical engineers.
The contribution of the study is to provide an approach that strengthens the usability of the EN ISO 14688-2:2018 standard and allows for the detailed evaluation of soil particles.
The approach proposed in this study can be a valuable reference when revising the standards and can be developed further with novel diagrams and charts.
The author fully believes that this approach is constructive research that can provide immense benefits and great contributions to the literature. The method proposed in this study is expected to be extensively utilized in practical applications.


