Abstract
Controlled junctions of proteins and nanomaterials offer multiple potential applications in the further construction of nanobiodevices. One of the possible junction types is a set of sequential monolayers of various components deposited on a given substrate. The advantage of such an organization is its high sensitivity, resulting from a huge surface covered by molecules or particles. What is more, the molecules/particles adsorbed on a substrate might be easier to handle than the assay in a cuvette. For further application, there should be crosstalk between monolayers; this is defined by the type of individuals forming a complex system. Here, we are studying, using mainly confocal microscopy and FLIM imaging, crosstalk through resonance energy transfer. The sequential monolayers of fluorescent proteins and CdTe quantum dots were deposited on a convenient substrate, a polyvinylidene difluoride membrane. First, we found that the degree of coverage is lower in the second monolayer. Hence, by manipulating the order of deposition, we obtained a system with a varied yield of resonance energy transfer with a donor excess or an acceptor excess. For a deeper understanding of the energy transfer and its limitations in this system influencing the assay pursuit, we utilized Monte Carlo computation. We found that, indeed, the distance between the monolayers, as well as the degree of coverage, is crucial. With the results of the simulation, we might estimate the relative degree of coverage in our sequential monolayers. We also found that in quantum-dots/protein-composed systems, the yield is stronger than predicted by Monte Carlo simulation. Hence, there should be protein reorientation on the nanoparticle surface, leading to such an effect. Finally, we showed that the yield of resonance energy transfer may be modulated by the external application of poly-L-lysines. These chemicals influenced QD fluorescence but not protein fluorescence and might be used, therefore, as a trigger or a switch in nanobiodevices employing those types of sequential monolayers.
1. Introduction
Combining nanoparticles and proteins results in new nanomaterials with multiple possible applications [1,2,3,4]. The way of junction building may define the future function, as it influences the protein–nanoparticle interaction routes. There are several ways to achieve such a junction, and a final product might be a colloid (not strictly called “a solution”) or deposited on a solid substrate. The last may lead to the creation of 2D materials, with a nanosize in one of its dimensions and several centimeters or even meters in two other dimensions. The type of 2D material is graphene, which might be produced in sheets with huge surfaces [5]. The other known examples are molybdenum disulfide nanosheets, boron nitride nanolayers, and metal oxide layers, as well as 2D versions of silica or gold. In this understanding, 2D materials are of nonbiological origin, and their further interaction with protein has been already exploited [6,7]. It is known, for example, that the direct interaction of a protein and an inorganic surface may lead to protein refolding, denaturation, and the loss of protein-specific properties. However, the composite of nonbiological structures and a nanolayer of proteins still fits into the definition of a 2D nanomaterial; therefore, we will use this term with its broader meaning.
Here, we investigated the type of 2D nanomaterial created by the sequential deposition of monolayers made of fluorescent proteins (FPs) and colloidal quantum dots (QDs) on a stable support of polyvinylidene difluoride (PVDF) membrane. Fluorescent proteins (FPs), such as a green fluorescent protein (GFP), an mCherry, or an mBanana, are the product of the biotechnological modification of fluorescent proteins found in nature [8,9]. They are engineered to have better stability, as well as desired extinction and emission spectra. They are also easily expressed in heterologous bacterial systems, which leads to the relatively cheap production of high amounts of those proteins. Simple gene engineering might be used to introduce additional polypeptide fragments to a main FP sequence. Such peptides might be a specific tag, such as a HisTag (six–ten histidine residues in a row), used for single-step protein purification, as well as for specific junctions in nanoassemblies [10,11,12].
QDs are nanocrystals (with a typical diameter of 1–10 nm) of semiconductor materials. They may be composed of a single material (such as CdTe, as used here) or consist of a core and shell, such as CdSe/ZnS QDs [13]. Additionally, the surface of nanocrystals is stabilized by a small organic ligand, deciding the charge of the nanoparticle in a water-based solution [14]. QDs are well known for their fluorescence ability, resulting from a quantum confinement effect during size reduction starting from a bulk material [15,16]. The maximum emission of QD fluorescence depends on the diameter of the nanoparticle, which means that a nanoparticle of the same material (e.g., CdTe) but of a different size, shows a different color of fluorescence. Therefore, achieving a desired color of a QD emission is a simple task of slightly longer or shorter synthesis time. The absorption spectrum of QD is very broad; hence, their extinction may be realized by a broad spectrum of light sources, which is the advantage over conventional fluorophores. QDs are also very resistant to photobleaching. On the other hand, they are toxic to biological organisms, which reduces their actual application to in vitro assays [17,18].
Poly-L-lysines (PLLs), used in our study as modifiers for sequential monolayers, are frequently used as a matrix, facilitating the adhesion of various elements (living cells, organelles, and carbon nanotubes, etc.) to surfaces (glass and mica) and making covered surfaces or scaffolds compatible [19,20]. PLL-coated graphene quantum dots were shown to be useful in the detection of cysteine and homocysteine [21]. PLLs are polypeptides, which are varied in length and size and composed of an amino acid, lysine. In physiological pH, PLLs are rich in positive charges; therefore, they easily and strongly bind everything that has a negative charge on its surface (such as most proteins, QDs, etc.).
During the monolayer formation, the dense packing of particles or molecules on a surface results in a fluorescent signal strong enough to be measured using a conventional spectrofluorometer or in confocal microscopy systems. In the monolayers, one of them may be composed of donors and the second of acceptors. In this way, we built a simple but highly ordered system, with Förster resonance energy transfer (FRET). Simões et al. recently showed the application of a similar idea, with the assembly of two thin films composed of simple organic fluorophores for the quantification of nanoscale contacts [22]. FRET networks have been proposed for broadening the possible utilization of FRET-based biosensors [23]. An example of such a system is multihybrid nanoparticles for brightness-equalized single-wavelength barcoding [24]. In our application, we constructed a simple FRET network, with a densely packed monolayer of one kind of fluorophores (this adds the possibility of HomoFRET) in close contact with a densely packed monolayer of a second type of fluorophores. The quantification of the distance between the monolayers is a secondary question, although the distance is a factor that may influence FRET yield, therefore, changing the putative analytical signal. The efficiency of FRET here may be tuned, therefore, by (i) the addition of spacers or modifying conditions resulting in changing the distance between a donor and an acceptor, and, as our results suggest, (ii) the selection of donors and acceptors due to the classical rules of resonance energy transfer, and (iii) the modification of and orientation between donor and acceptor [25]. The identical coverage of each monolayer is hard to achieve. However, with the proper choice of sequences, it is possible to decide if there is a given excess of acceptors or a given excess of donors. Another question is the flatness/curvature of a 2D nanomaterial [7,26]. The atomic flatness might be achieved in laboratory conditions (e.g., with the application of freshly cleaved mica or specially treated glass flakes). However, this may not be necessary in the actual application. What is more, the curvature may significantly increase the actual surface covered by a 2D nanomaterial, increasing the analytical signal (fluorescent or other). This might also be advantageous in sensing applications, as the high contact area between a sensor and an analyte is secured by material geometry and is purposely rough [27]. The PVDV we applied is not atomically flat, but its advantage as a substrate material is flexibility, which might be important in handling and further use.
2. Materials and Methods
2.1. Monte Carlo Computation
2.1.1. Geometry Design
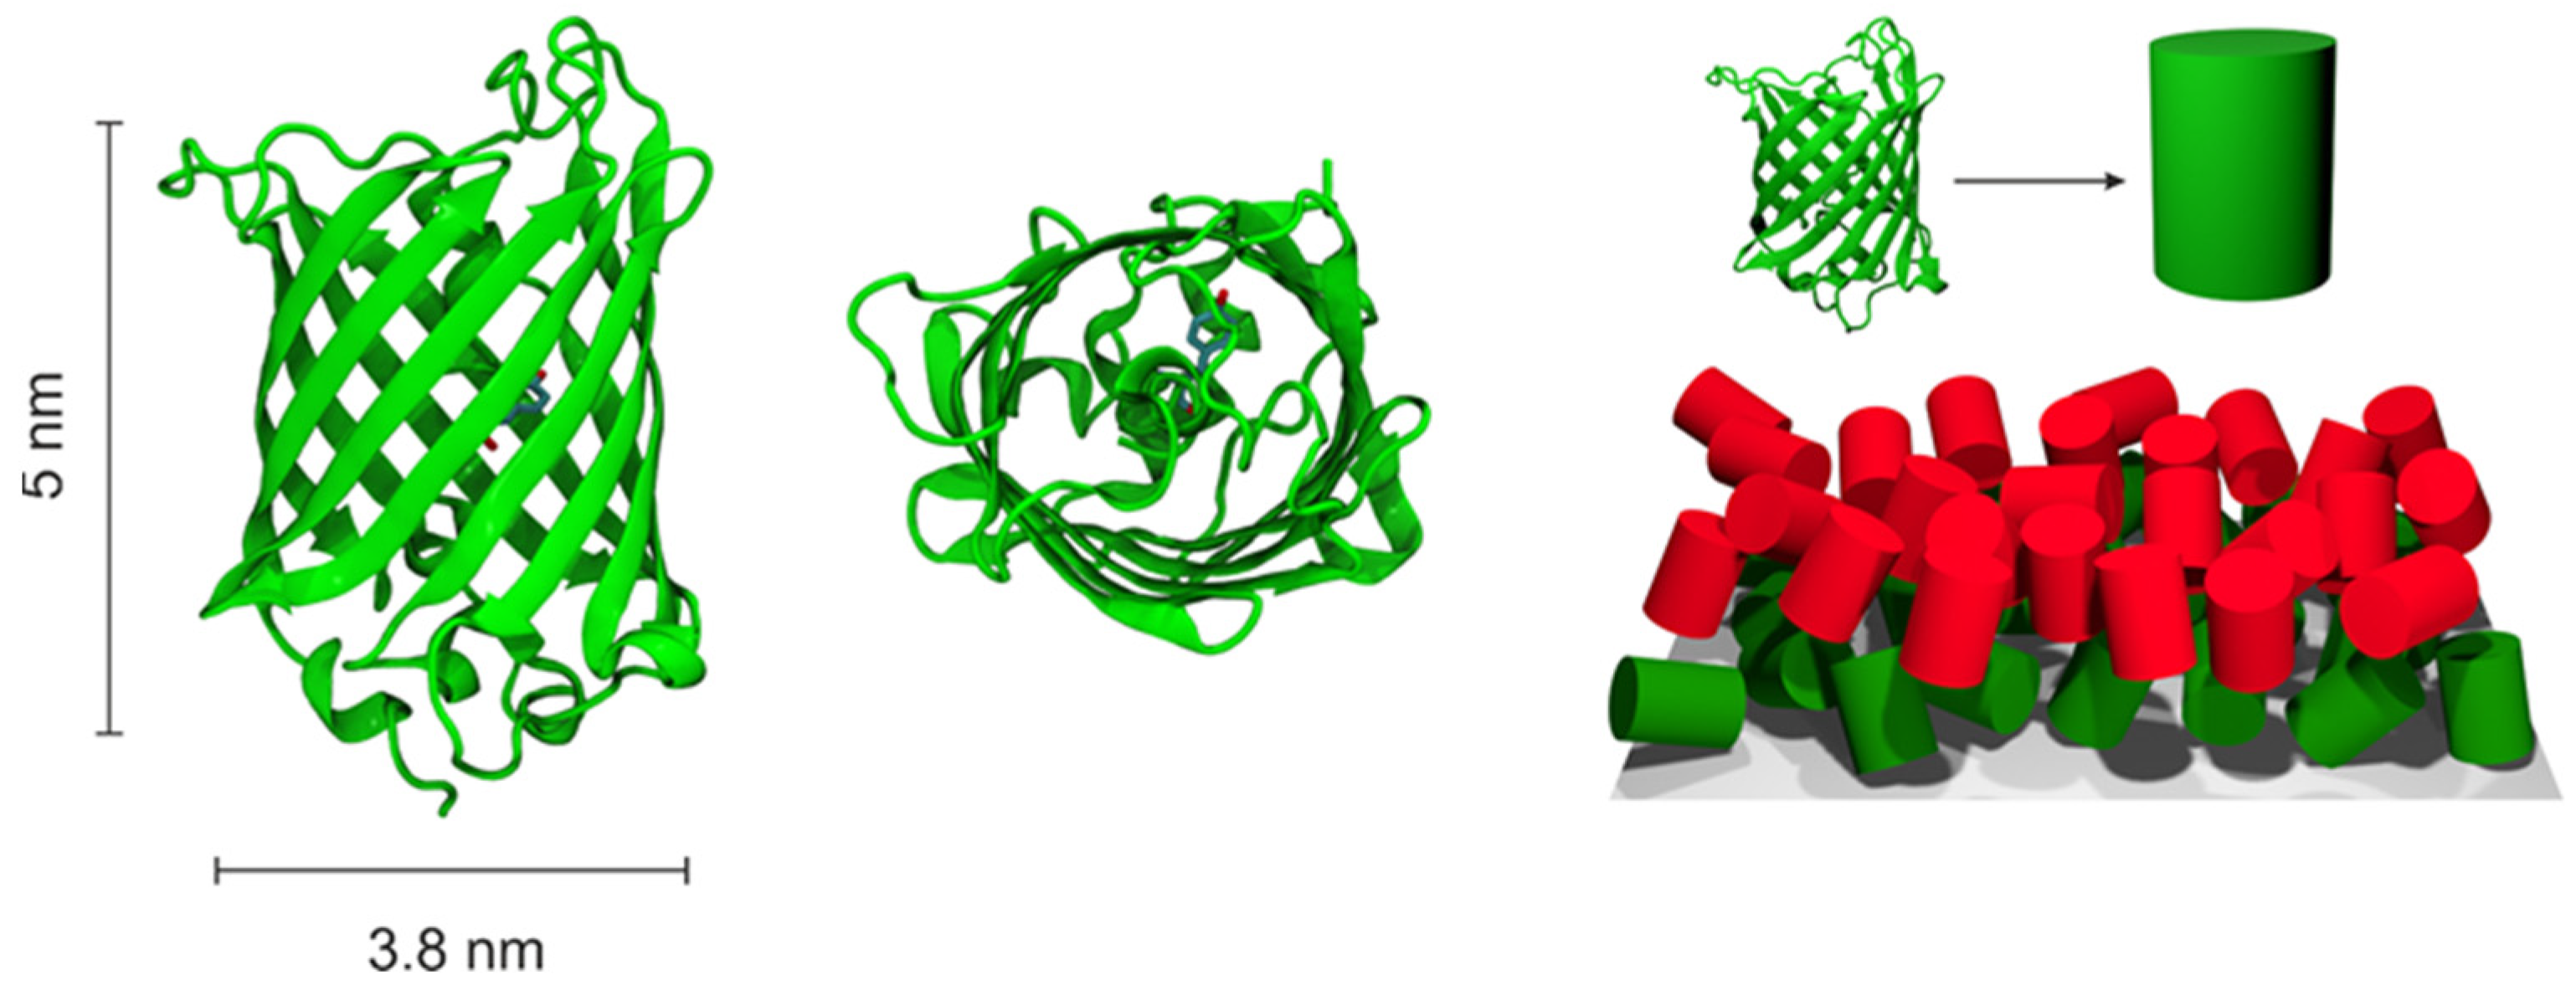
The sizes of the proteins involved in energy transfer were estimated from the available crystal structures (GFP:1GFL [28], mCherry:2H5Q [29], mBanana—homology model based on available sequence). Due to the high similarity of the structures, in all cases, we approximated the protein as a cylinder with height h = 5 nm and base diameter d = 3.8 nm (Figure 1).
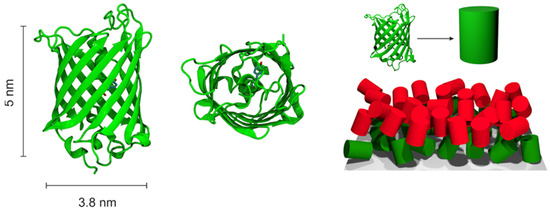
Figure 1.
The general idea of MC model geometry design. Green—a GFP protein, red—other fluorescent protein.
A plane with X-Y dimensions of 100 × 100 nm was taken as the base of the computational system. On this plane, we randomly scattered points—seeds of our proteins. Each of these points could potentially be transformed into a cylinder with a random orientation, as long as no cylinders had already formed in the immediate vicinity occupying the available space. The initial number of seeds was chosen as N = 10,000, which allows a packing of the layer close to the maximum to be obtained while keeping the computation time reasonable.
Another layer of proteins was generated in the same way. However, the position of individual molecules on the Z axis depends on the height of the molecules below. This height is, of course, dependent on the orientation of the donor molecule. In addition, in the linker systems, the Z position of the acceptor is increased by the size of the linker. In the case of BSA, this is 3 nm (estimated from the PDB:4F5S crystal structure). In the case of Jeffamine, we used short MD calculations (t = 50 ns, GROMACS 2019, CHARMM36 force field) of a two-element peptide in water to estimate its average size. The average distribution of its end distances (0.85 ± 0.13 nm) was taken as the linker length in the MC calculations.
To account for the larger layer sizes in the experiment, we used periodic boundary conditions in X and Y dimensions to calculate energy transfer.
2.1.2. Energy Transfer Modeling
To track individual energy transfer events and calculate the transfer efficiency for different configurations, we used the Monte Carlo code described previously [24,30]. Based on the distances of the individual fluorophores, it calculates the transfer probabilities and, based on these, decides the subsequent course of each “excitation” in the system. In each system, one type of protein/QD was designated as a donor and initially excited. After that, each molecule could be both donor and acceptor, depending on the current situation (homo-transfer was also possible). In each case, we used 10,000 different starting configurations of proteins within layers to calculate FRET efficiency. It is worth noting that the FRET efficiency is determined by not only the intermolecular distances but also the orientation factor, κ2. In this study, we assumed a κ2 value of ⅔, which is typical for rapidly rotating fluorophores in free solution. However, in our system, while the orientation of the fluorophores is completely random, it remains static. This distinction may introduce discrepancies when comparing computational results with experimental observations.
2.2. Preparation and Characterization of Sequential Monolayers
Small (1 cm × 1 cm square) PVDF membrane pieces were activated in 70% ethanol and blocked in 1% BSA solution in 100 mM HEPES, pH 7.4. Fluorescent protein layers were immobilized on the membrane by crosslinking with EDC + NHS (0.2 mg EDC + 0.25 mg NHS per 100 mL of protein solution). The efficiency of immobilization was largely improved by prior blocking of a membrane in BSA, probably due to a higher number of functional groups (-NH2 and -COOH) in comparison to a mere PVDF surface. The concentration of proteins in the crosslinking solution was 20 μM GFP, 200 μM mBanana, and 40 μM mCherry (in 100 mM HEPES, pH 7.4). These were chosen experimentally to provide appropriately high intensity of fluorescence.
Additionally, two types of spacers were used to introduce separation distance between two protein layers: BSA (40 Å × 40 Å × 140 Å) and 2,2′-(ethylenedioxy)bis(ethylamine) (Jeffamine, approx. 10 Å spacer arm) in 200 μM and 100 mM concentrations, respectively. Subsequent layers were immobilized on the membrane in the following order: protein I—spacer (optionally)—protein II. Conjugation of the second protein layer was less efficient (as determined using fluorescence intensity).
Unequal immobilization efficiencies resulted in different amounts of proteins in two layers and “saturation” of protein molecules as FRET acceptors or donors in the second layer. Measurement of fluorescence lifetime, therefore, was performed for the second layer in every sample. Emission spectra of three chosen proteins overlap—the spectrum tail of the GFP extends to intensity maxima of the mBanana (551 nm) and the mCherry (612 nm), and the mBanana tail overlaps the mCherry maximum (612 nm). This resulted in contamination of fluorescence decays, with remnant components of shorter wavelength-emitting proteins. They were subtracted from decay curves according to the ratio of fluorescence intensities of both given proteins in the sample, which were determined using steady-state fluorescence spectra.
Fluorescence characteristics were obtained using spectrofluorometer FS5 (Edinburg instruments), equipped with a xenon lamp (for steady state emission) and 405 nm and 470 nm laser diodes (for fluorescence lifetime measurement). The samples were mostly measured on a special sample holder, allowing analysis of surfaces. For measurements in solution, a separate holder for cuvettes was used. Decays were fitted using Fluoracle software version 2.4.1 (Edinburg instruments). Average fluorescence lifetime was calculated as amplitude-weighted mean.
For confocal fluorescence microscopy and fluorescence lifetime imaging (FLIM), sequential monolayers were mounted on cover microscopic glass slides. Imaging was performed using Stellaris confocal system (Leica, WGermany), with a tunable pulsed white laser. HC PL Apo CS2 100×/1.4 oil objective was used. Emission ranges were set using a monochromator. Image collection and FLIM processing were performed using LasX software version 3.7 (Leica, Germany). As the setup does not allow for clear analysis of emission spectra, and, therefore, the correction of acceptor decays for the remnant components of shorter wavelength-emitting donor species, only donor emission decays were analyzed.
2.3. Proteins, Quantum Dots, and Other Chemicals
Buffer components, bovine serum albumin (BSA), Jeffamine, N-(3-dimethyl aminopropyl)-N’-ethyl carbodiimide (EDC), and N-hydroxysuccinimide (NHS) were purchased from Merck, Germany. QDs were obtained from PlasmaChem GmbH, Germany. Fluorescent proteins, His-taged, were expressed in E. coli bl21 strain and purified inhouse, based on Ni-affinity chromatography, using the protocols described elsewhere [31].
2.4. Statistical Analysis
Statistical analysis (one-way ANOVA with post hoc Tukey test) was performed with R [32]. Calculated p-values are presented in figures as * (p < 0.5) and ** (p < 0.01).
3. Results and Discussion
3.1. The Order of Monolayers Defines the Effectiveness of Energy Transfer by Altering the Donor/Acceptor Ratio
Sequential monolayers are a relatively old concept realized, for example, by electrodeposition, to obtain cadmium selenide films [33]. Organic monolayers are one of the options for surface functionalization [34,35], with the option of islands of multidomains in the base material built in by sequential deposition [36]. Here, we obtained sequential monolayers of fluorescent proteins and QDs. The immobilization of proteins as monolayers is not broadly studied; however, it was already employed for the deposition of alcohol dehydrogenase, formaldehyde dehydrogenase, and formate dehydrogenase on gold electrodes [35]. These proteins are the enzymes of the enzymatic cascade, oxidizing methanol to CO2. In our study, we focused on the fluorescent properties of monolayer-forming particles.
The order of deposition should not influence the FRET direction, as the vector of energy transfer depends on the fluorescent properties of fluorophores forming the layers and the distance between them [25]. However, we found in several tests with fluorescent proteins that the order of deposition influences observed FRET-related changes. The simplest explanation for this is the different densities of both layers, resulting in varied donor/acceptor stoichiometry. Therefore, with such knowledge, one should be able to build a system with donor excess or a system with acceptor excess just by changing the protein that was deposited first.
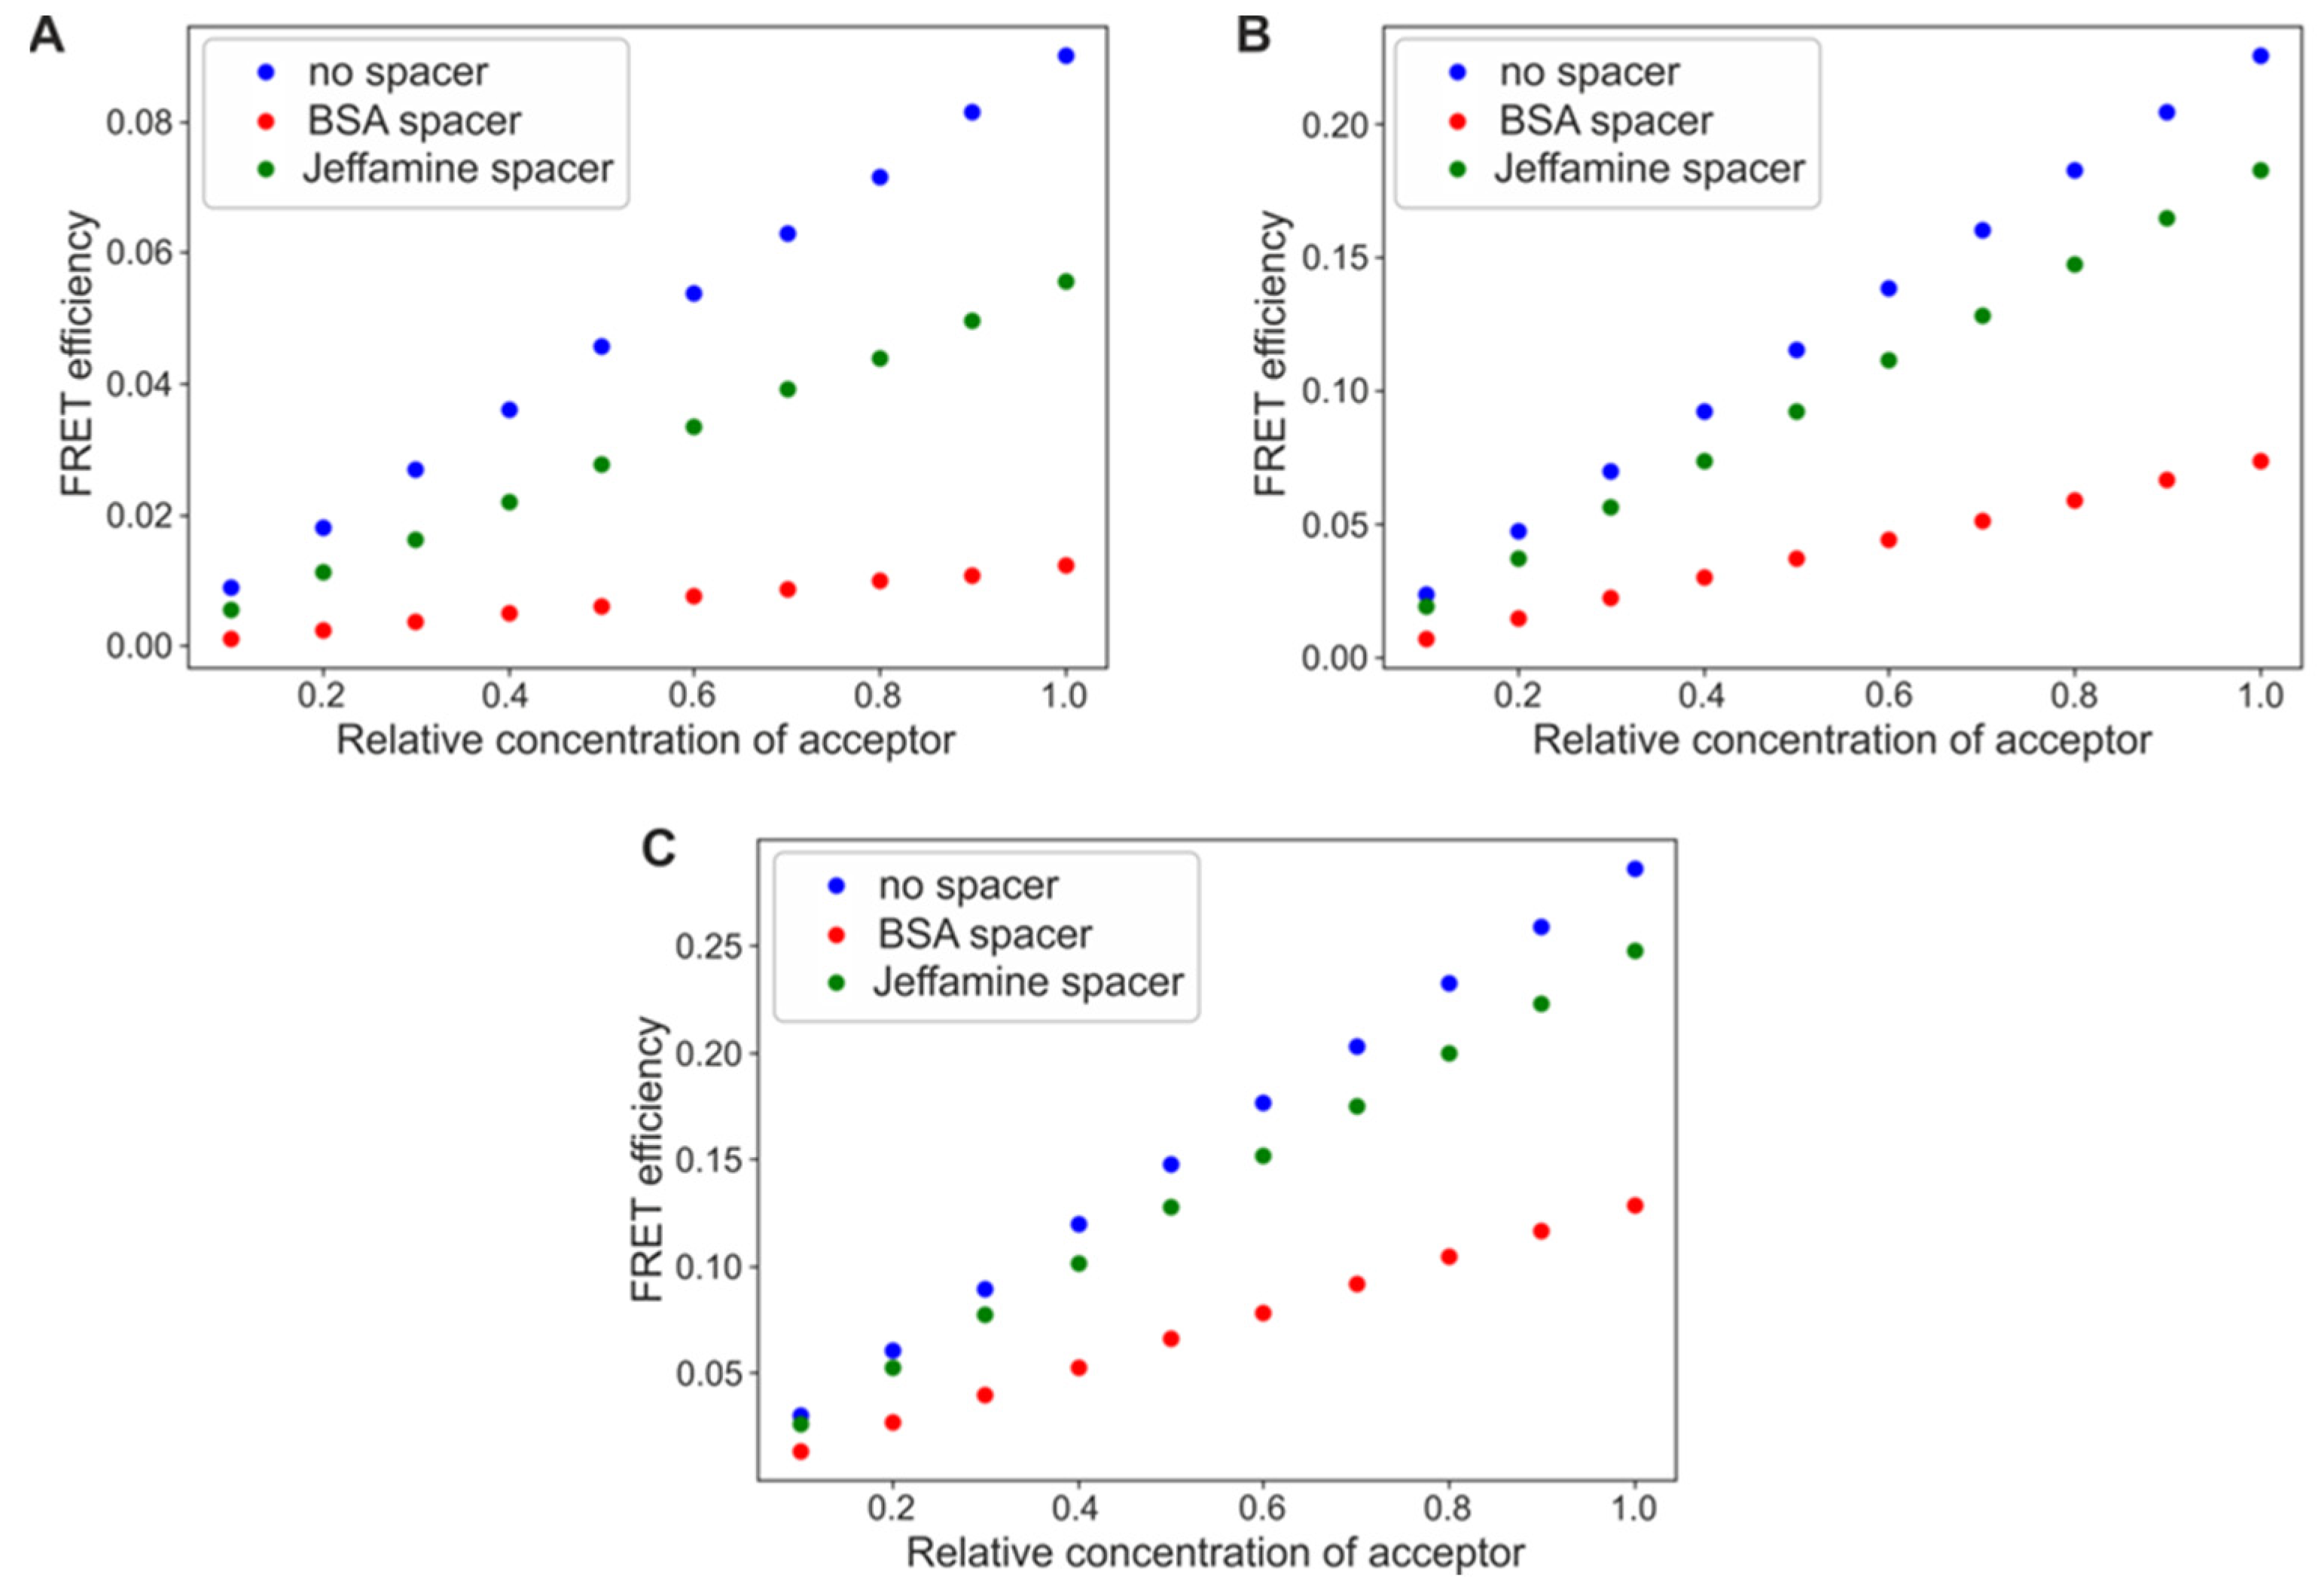
To test this hypothesis, we addressed the question of FRET efficiency between differently organized fluorescent protein monolayers, using Monte Carlo computational methods. We also examined the change in the process yield in the presence of a spacer, Jeffamine or BSA molecule. Figure 2A–C compares the results obtained for the system composed of a GFP (a donor) deposited as a first layer and an mBanana or an mCherry as a second layer, with different average densities. Similar tests were carried out for a first layer composed of an mBanana (a donor) and a second layer of an mCherry as an acceptor. In all three cases, the computational results confirm the intuitional assumption of FRET efficiency growing with an increase in the relative amount of acceptor. The final yield reaches 0.08 for a GFP-mBanana and about 0.3 for the two other tested systems. The yield is strictly defined by fluorescent protein properties (see Supplementary Files, Table S1, for detailed characteristics and parameters used in the calculation). The presence of spacers reduced FRET efficiency by about 10–40% for the shorter molecule (Jeffamine) and 30–90% for the longer spacer (BSA molecule). The actual reduction was stronger for the less efficient FRET pair, a GFP-mCherry; however, this did not significantly depend on the relative amount of acceptor. When simulations were carried out for a constant acceptor concentration and an increasing donor concentration, the FRET yield was always maximal. The yield might be reduced by the spacer introduction, without any relation to the relative concentration of a donor (Supplementary Figure S1).
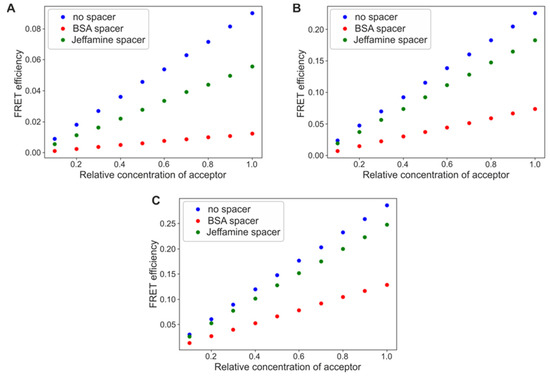
Figure 2.
FRET efficiencies calculated for a varied relative concentration of acceptor proteins. (A) GFP as the first layer, and mBanana as the second layer. (B) GFP as the first layer, and mCherry as the second layer, and (C) mBanana as the first layer, and mCherry as the second layer.
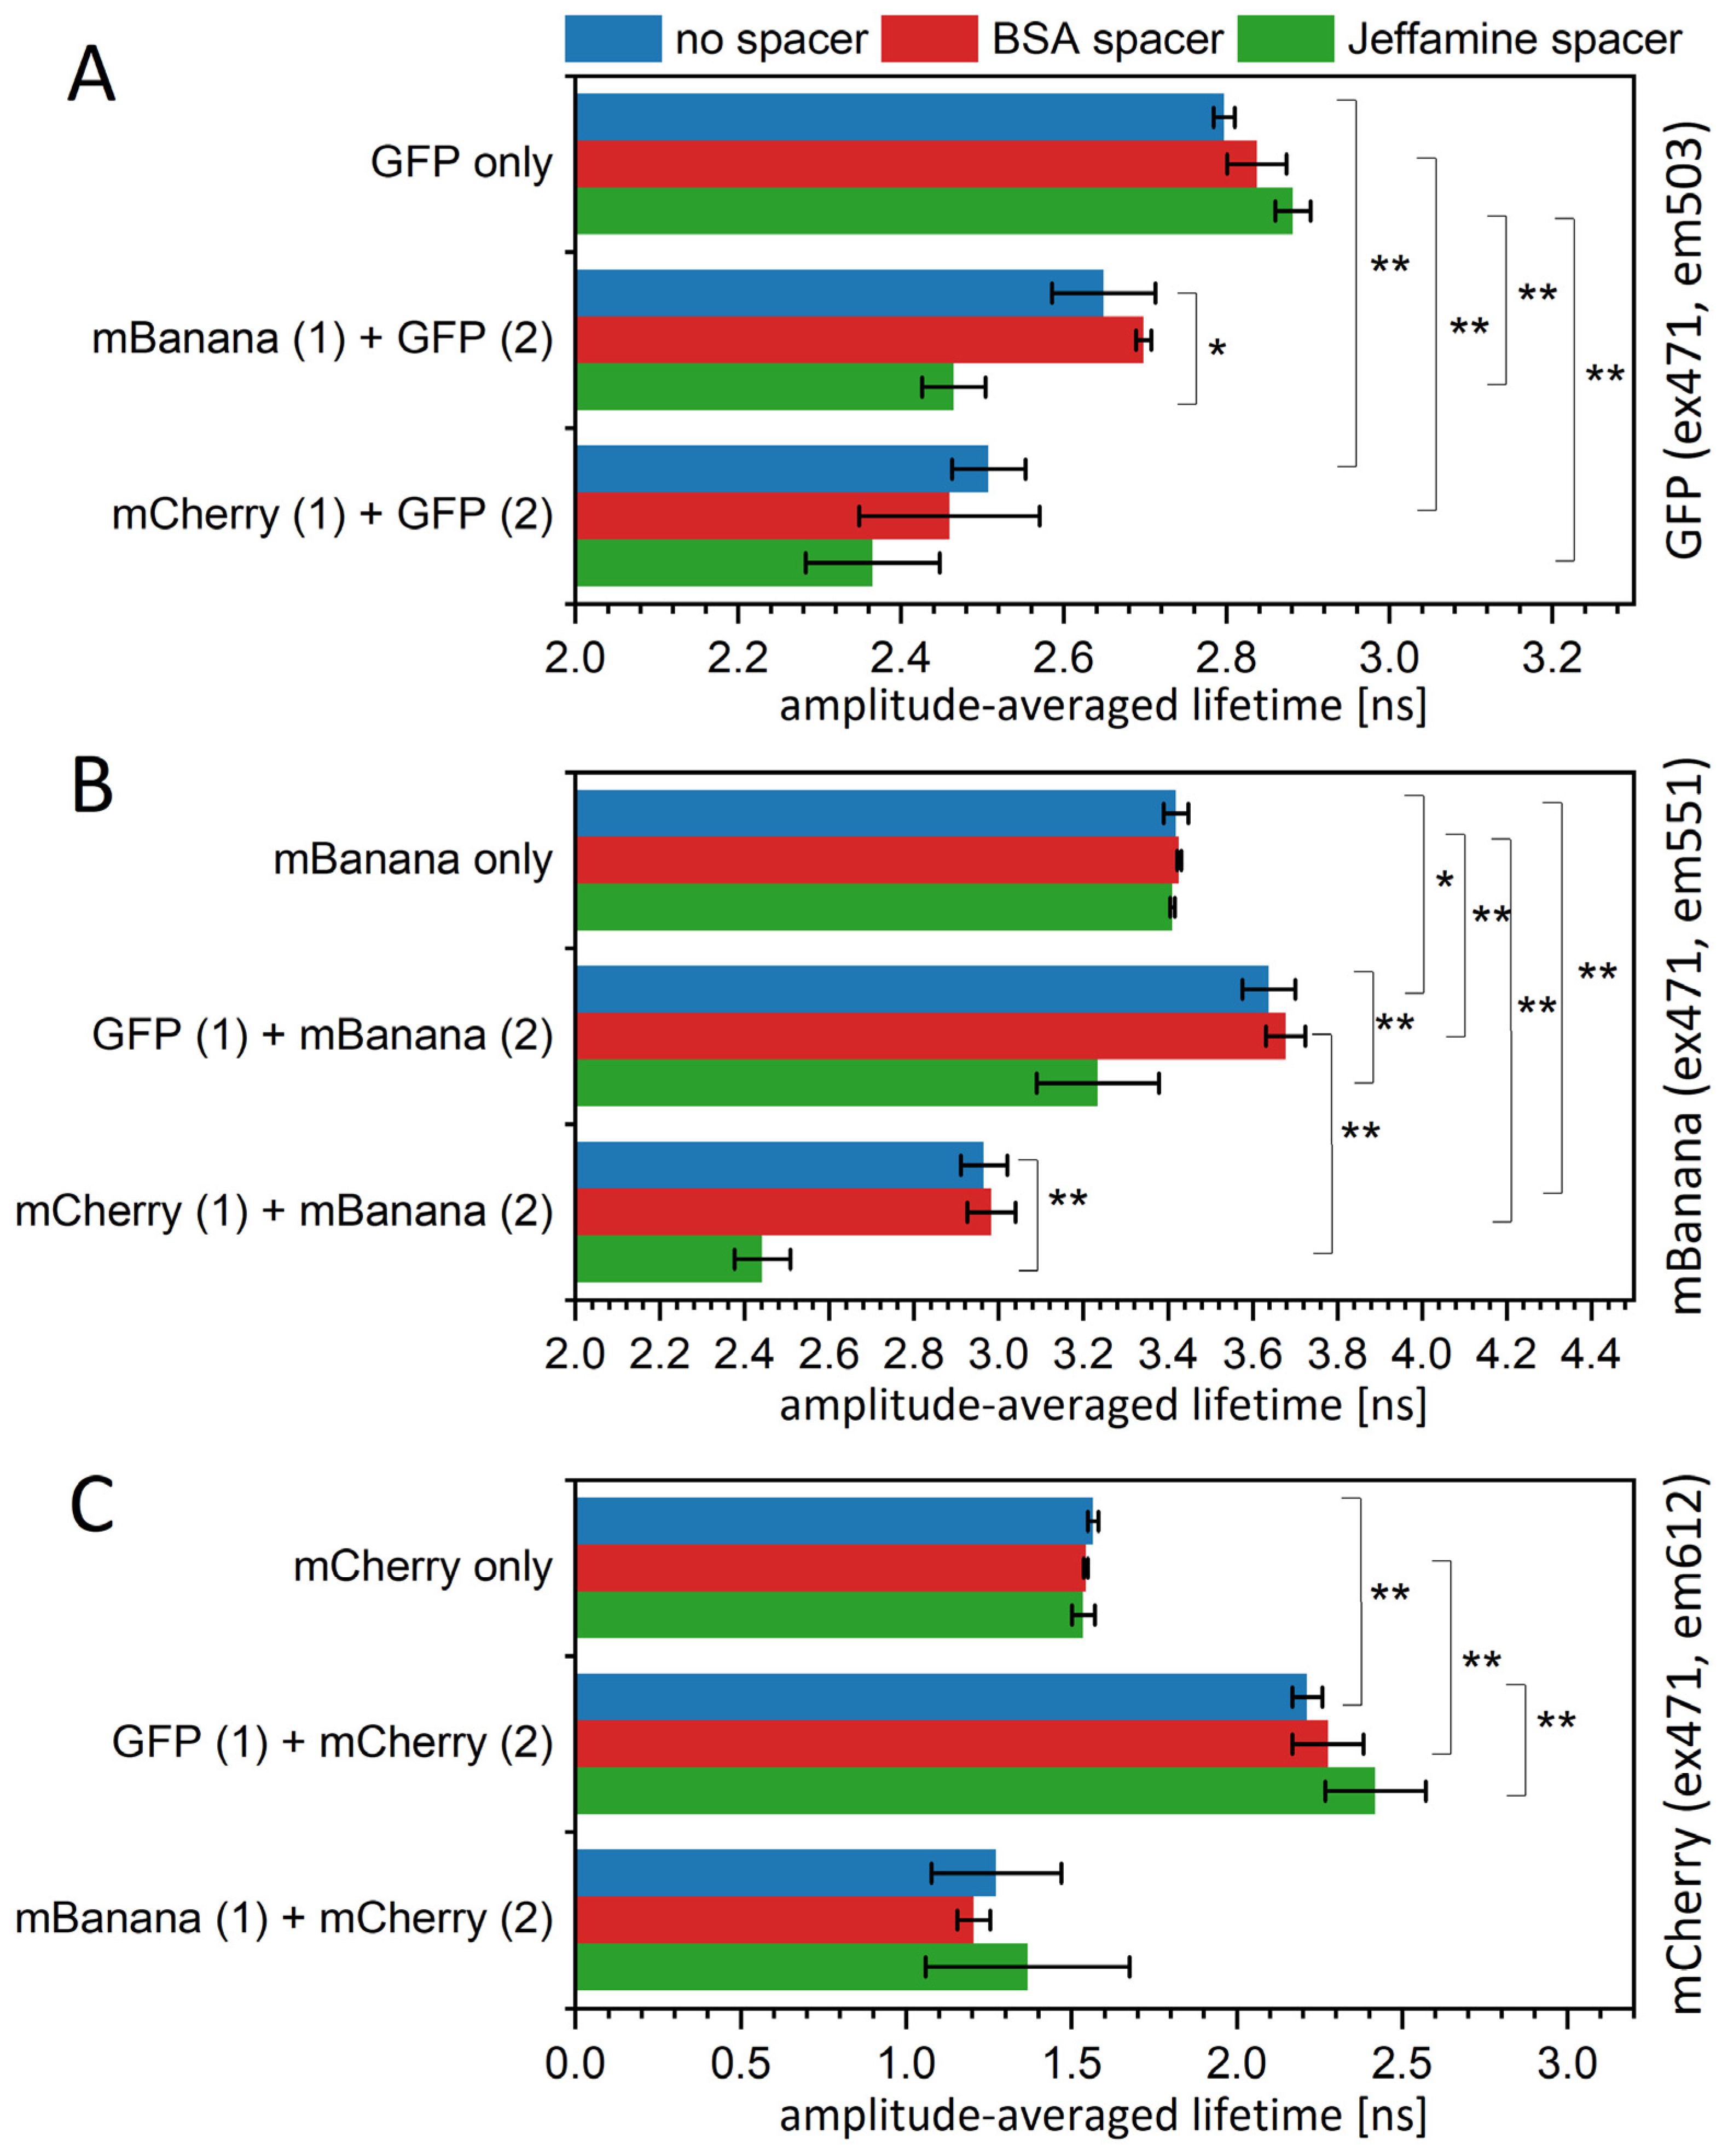
To verify theoretic calculations in a real experiment, we obtained several versions of the sequential protein layers deposited on a PVDF substrate (Figure 3A). The deposition was optimized for the maximum possible layer density. With a donor being the second layer, we might clearly calculate the FRET yield using fluorescent lifetime values. For this assumption, we obtained a yield of 0.055 for the GFP-mBanana pair, 0.103 for the GFP-mCherry pair, and 0.13 for the mBanana–mCherry pair. In all these cases, the yield indicated about 50% occupation of the second layer, referring to the computational results shown in Figure 2. When particular τ values of two-exponential decays are taken into account (Table S2), one may conclude that the average lifetime reduction mostly results from the change in amplitudes and, to a lesser extent, from the shortening of τ1 or τ2. Interestingly, the addition of a spacer did not reduce the energy transfer yield, and there was even a tendency to strengthen the interaction. The BSA presence almost did not change the transfer yield between the GFP layer and the mBanana layer and the mBanana layer and the mCherry layer; however, it slightly increased the yield of the sequential monolayers of GFP-mCherry (Figure 3A). With Jeffamine, the transfer yield was significantly higher for all three pairs. For the GFP-mBanana, the calculated yield of 0.158 was higher than theoretically enabled for those two fluorophores. All this suggests that the Jeffamine influence is behind the simple spacer effect and leads to the modification of protein properties.
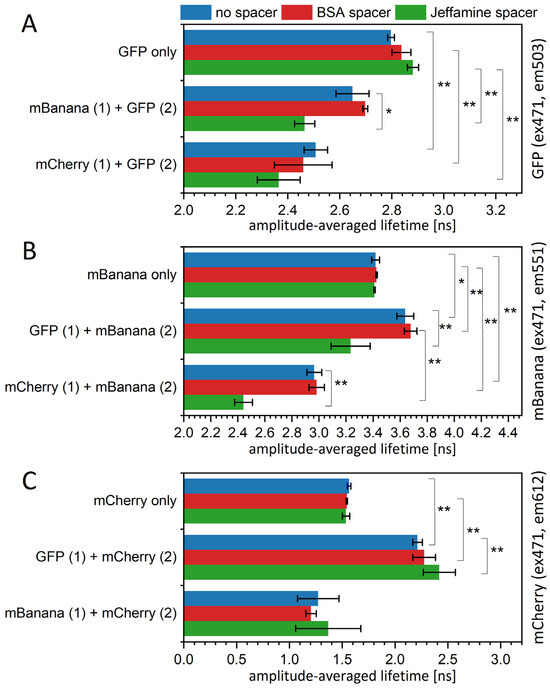
Figure 3.
Mean fluorescence lifetime values of fluorescent protein immobilized on PVDF membrane, measured in a spectrofluorometer. Samples were excited by a 471 nm LED laser, and the emission wavelengths were 503 nm for GFP (A), 551 nm for mBanana (B), and 612 nm for mCherry (C). Decay curves were fitted to a two-exponential decay equation. Particular values of decays and amplitudes are presented in Supplementary Table S2. Statistical significance of differences (p-values) is presented in figures as * (p < 0.5) and ** (p < 0.01).
For the change in the acceptor lifetime, we were not formally able to calculate the FRET yield. However, we may simply observe the 8% increase in the mBanana fluorescence lifetime in the presence of a GFP layer (Figure 3B) and the 45% increase in the mCherry fluorescence lifetime in the presence of a GFP layer (Figure 3C). Again, the presence of BSA did not decrease FRET efficiency but slightly increased it, although in the range of standard deviation. Jeffamine reduced the mBanana fluorescence lifetime below the control mBanana–Jeffamine layer. Unexpected values were measured for the mCherry fluorescence lifetime, with an mBanana as a donor; here, the mCherry fluorescence lifetime was decreased significantly compared to the control mCherry-only (or mCherry-BSA/mCherry–Jeffamine) monolayers. These results suggest that an mCherry is somehow quenched by an mBanana.
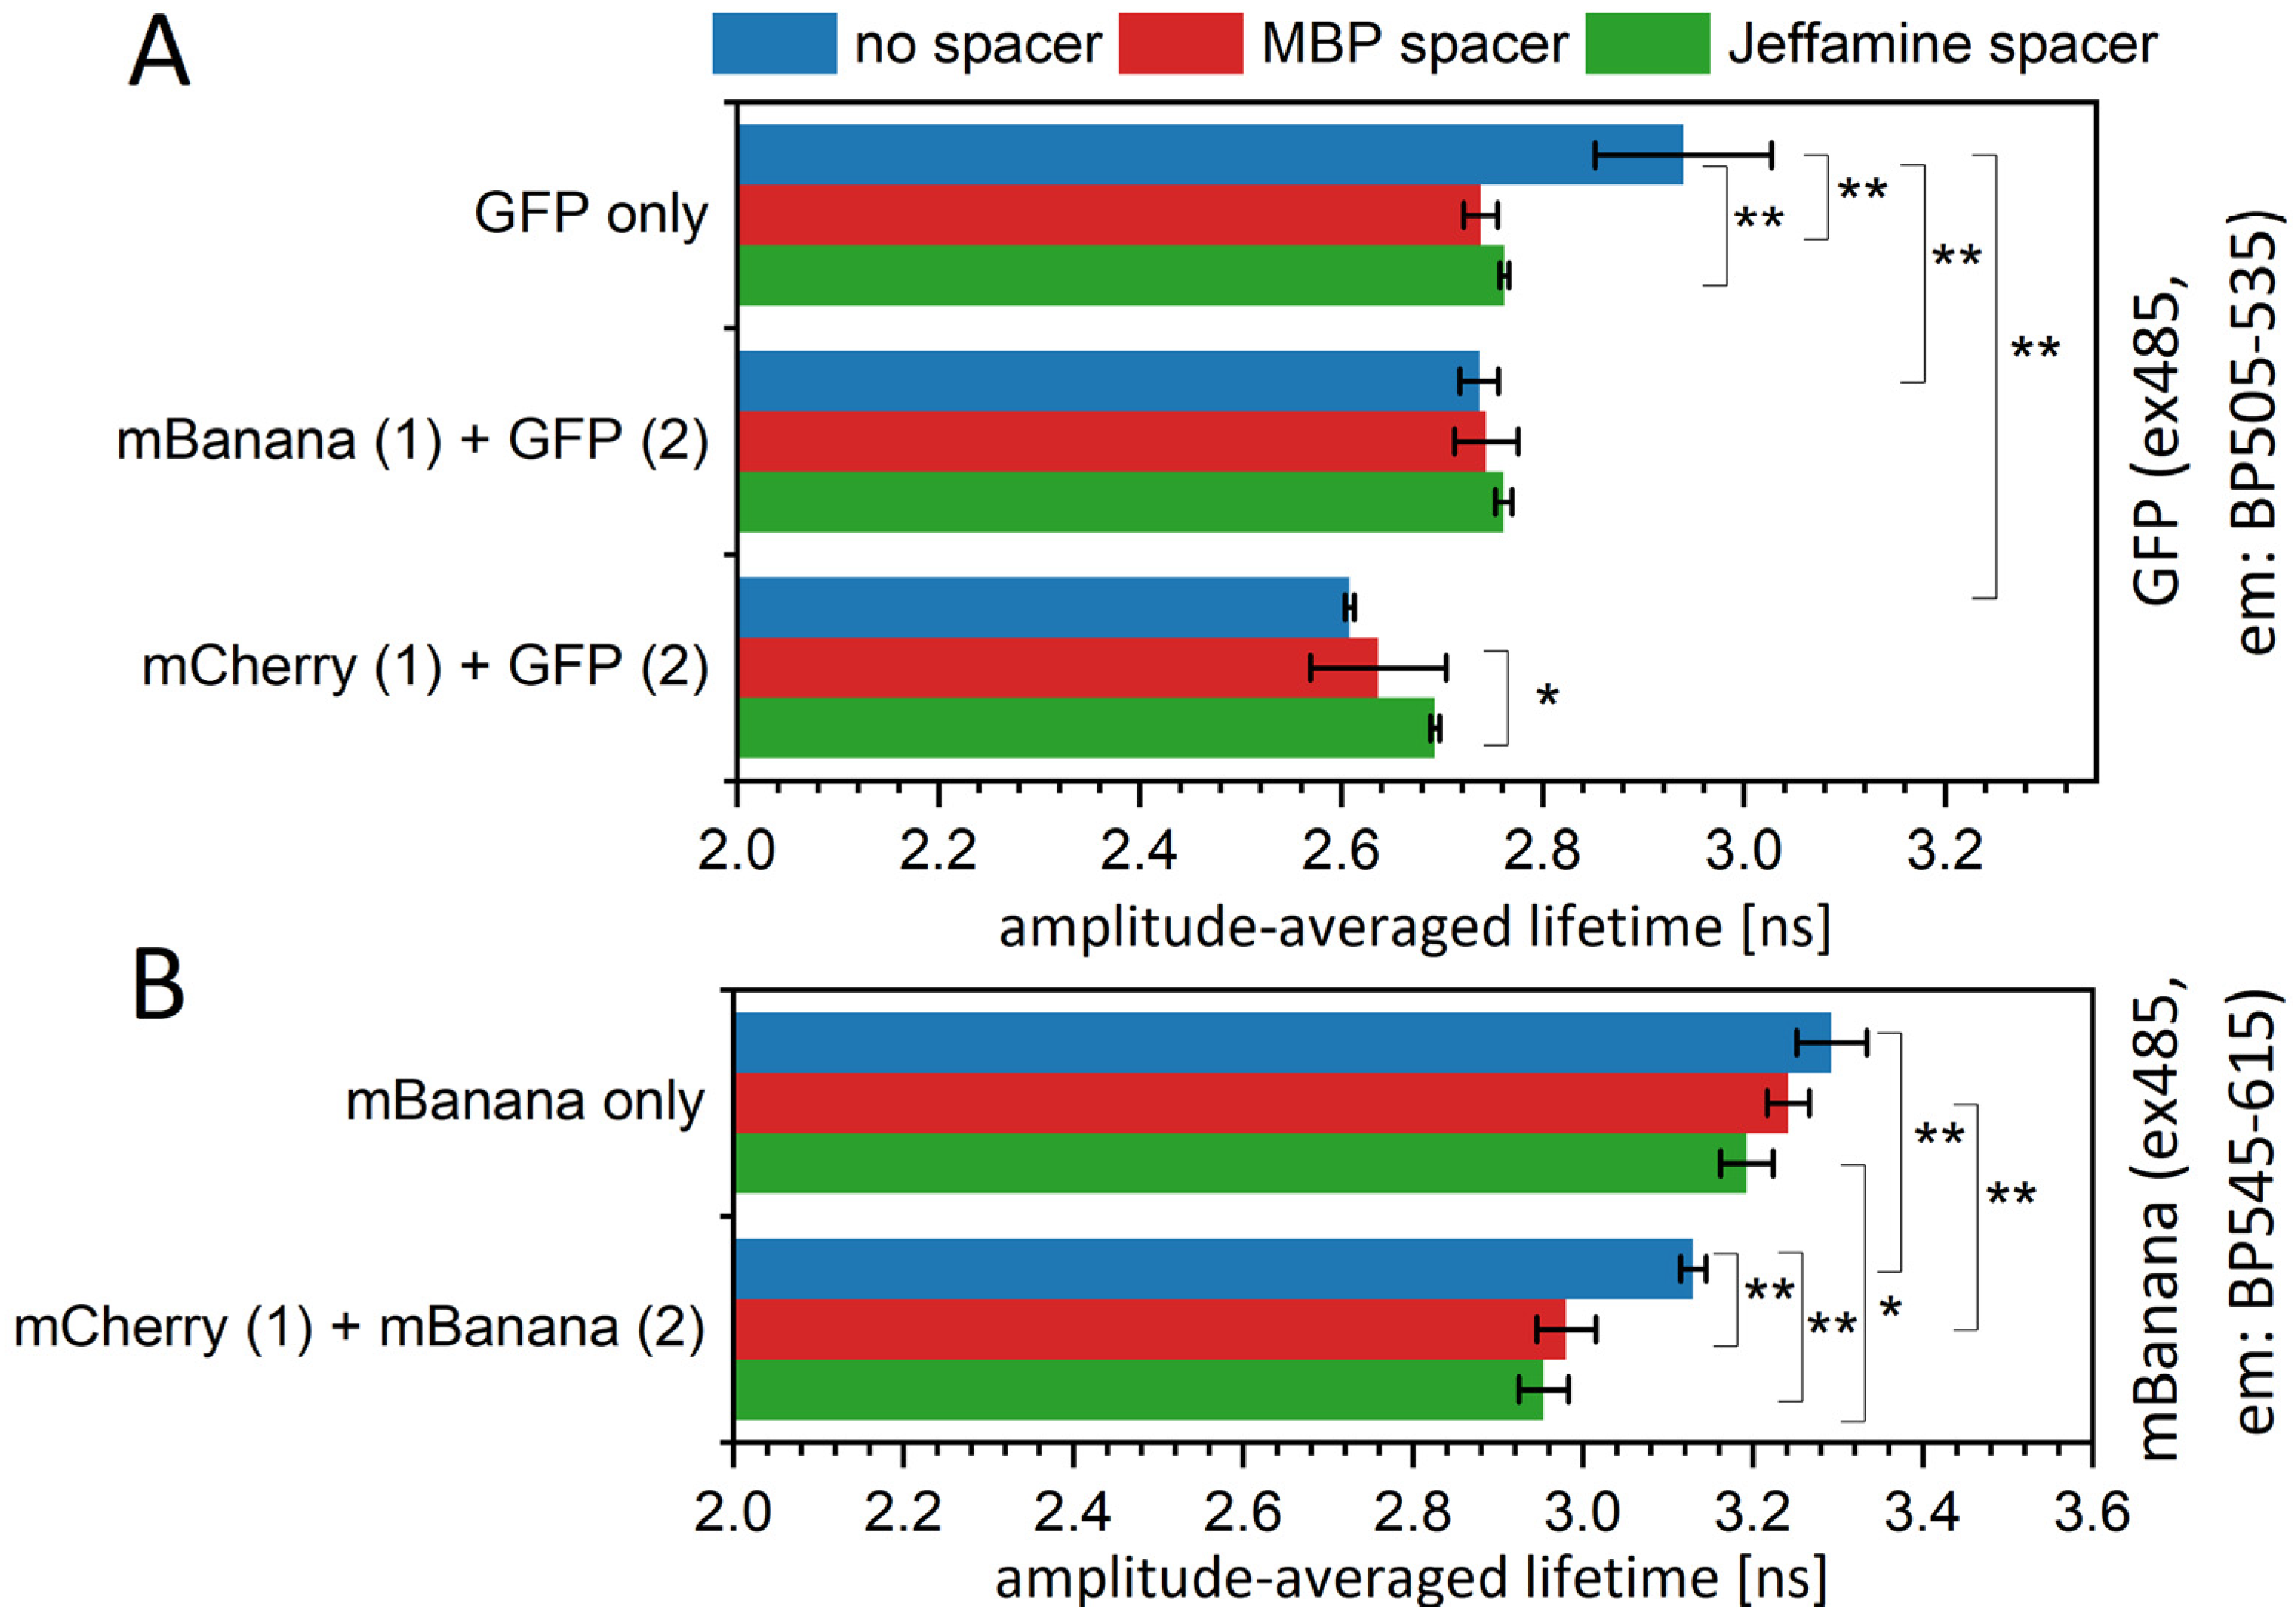
As sequential monolayers are easily visualized using confocal microscopy, we applied a FLIM setup for the observation of the FRET process (Figure 4). We, indeed, found a shortening of the donor fluorescence lifetime, indicating energy transfer from a GFP to an mBanana and an mCherry and from an mBanana to an mCherry. Again, the average lifetime reduction mostly results from the change in amplitudes and not the τ1 or τ2 values (Table S3). Interestingly, the energy transfer yield differed from those calculated based on the Figure 2 data and was higher for the GFP-mBanana pair, reaching the maximum level, as predicted by MC computation. Again, the spacers did not clearly reduce the FRET yield.
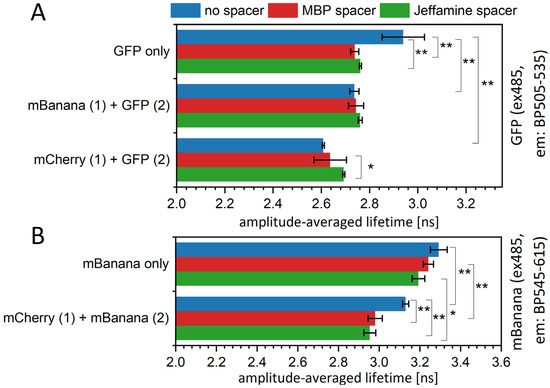
Figure 4.
Mean fluorescence lifetimes of fluorescent proteins as measured in the FLIM experiment. Samples on the PVDF membrane were excited with 485 nm, and a time-resolved fluorescence image was recorded through a monochromator set at band range 505–535 nm (GFP, (A)) or 545–615 nm (mBanana, (B)). Decay curves were extracted as means averaged for each image pixel and fitted to a two-exponential decay equation. Particular values of decays and amplitudes are presented in Supplementary Table S3. Statistical significance of differences (p-values) is presented in figures as * (p < 0.5) and ** (p < 0.01).
3.2. The QD/Protein Monolayers Are Better with the QD Layer Deposited First
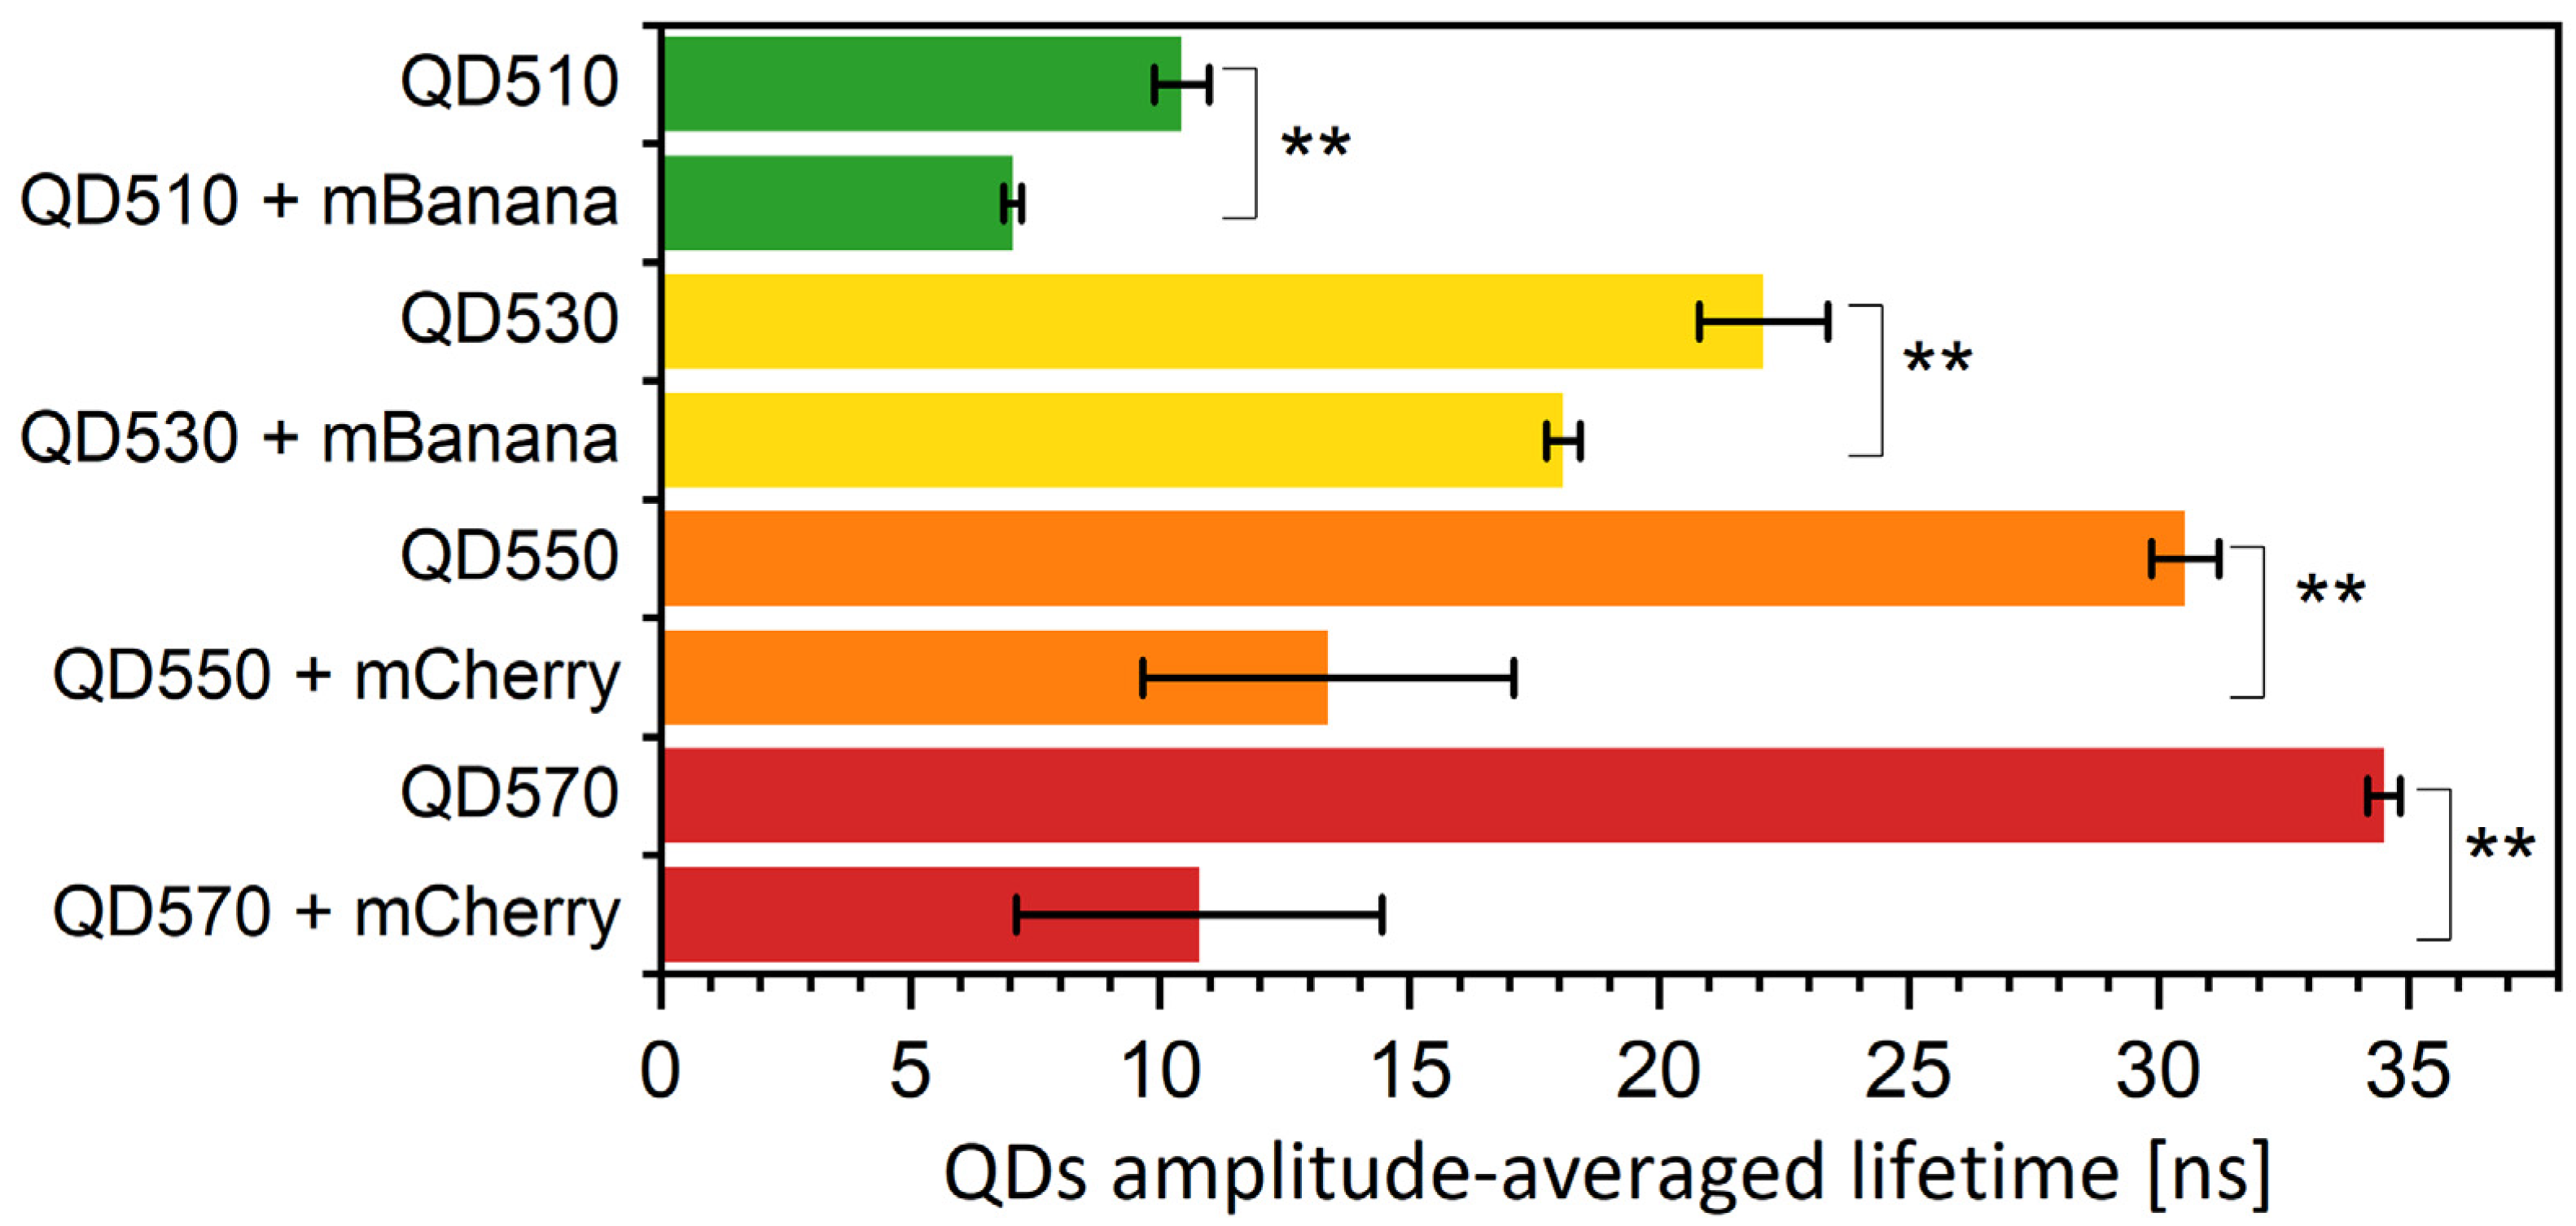
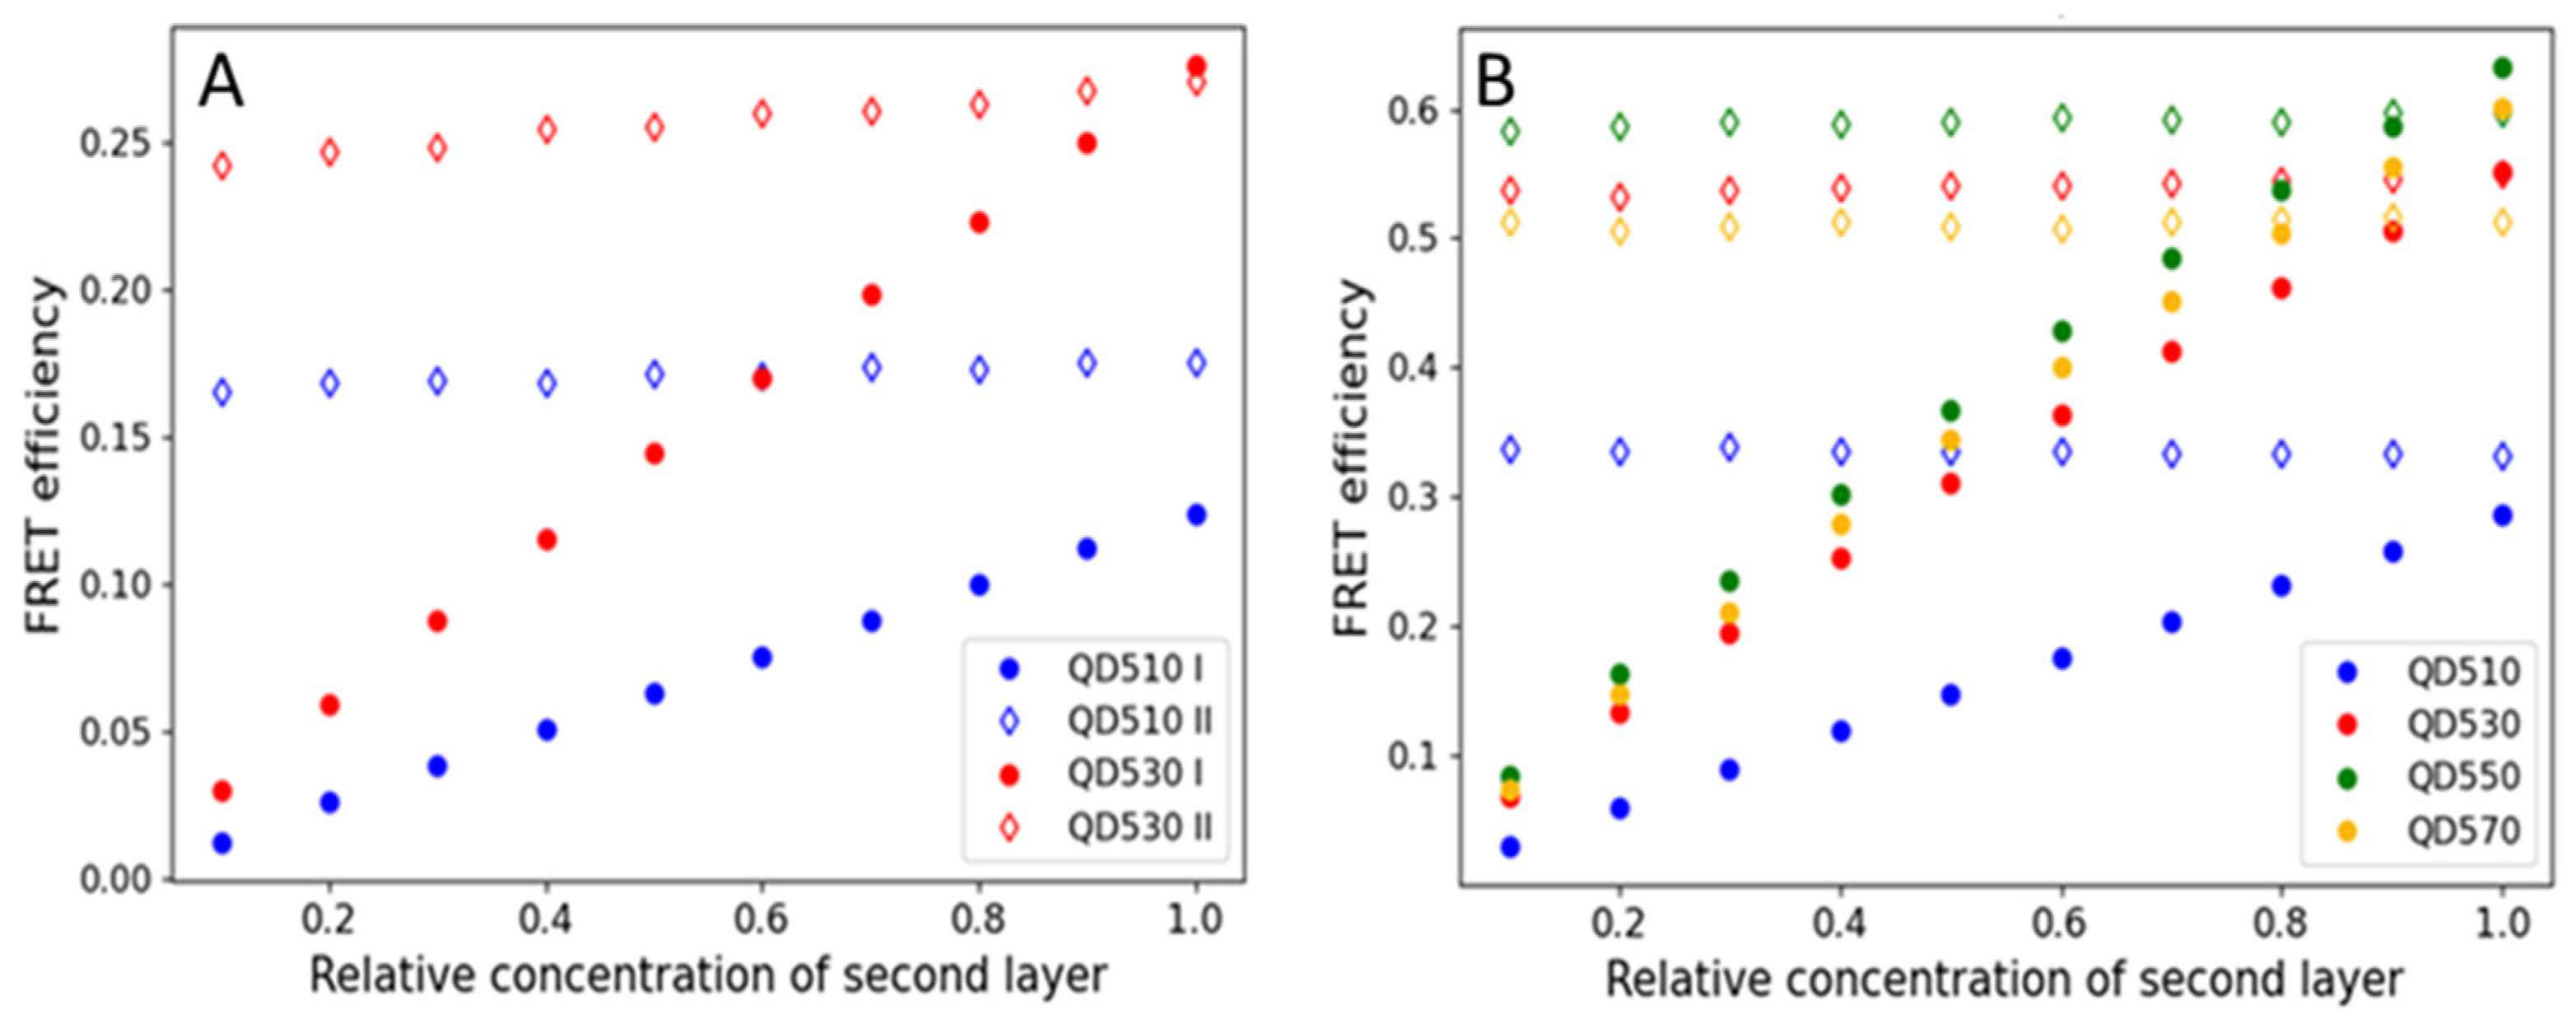
Monolayers can also be formed from nanomaterials, such as gold nanoparticles [37] and colloidal quantum dots (QDs). Here, we tested if CdTe QDs, applied on a substrate in the form of the monolayer, can efficiently transfer energy to a fluorescent protein monolayer. Due to the spectral characteristics of QDs (broad absorption spectra and a lack of selectivity of excitation), they were used as donors only. The ability of resonance energy transfer from QDs to other fluorophores in solution is already well documented [32,37,38,39,40]. The acceptor, an mBanana or an mCherry, was selected due to spectral overlaps. We also noted that the order of the monolayer deposition influences the FRET efficiency; however, the effect was less pronounced than in the case of FP-FP sequential monolayers. We noted that the transfer was most effective if QDs were the first monolayer. For example, in the preliminary tests, a QD510-mBanana monolayer resulted in a 0.2 FRET yield, while for an mBanana-QD510, the yield was 0.07 only. Even more significant differences were noted for the mCherry-QD550 pair (see results shown in Figure S2). In the actual experiment (Figure 5), we compared four versions of sequential monolayers with the QD layer being the first. We noted that, depending on the composition, the yield varied from 0.2 to 0.65. Similar variations were found when the monolayers were analyzed using FLIM methodology (the yield was between 0.25 for the QD510-mBanana pair and 0.95 for the QD550-mCherry pair; see Figure S2). Together with a donor fluorescence lifetime decrease, the acceptor fluorescence lifetime increases (see Figures S7 and S9). The change is dependent of the change in amplitudes and significant decreases in all QD τ components (Table S4). To understand the obtained difference in the FRET efficiency, we again used MC computation to simulate the FRET energy transfer between QDs and FPs. Figure 6 summarizes the results. As expected, the transfer yield increases with the relative concentration of a second layer. With an mBanana second layer (Figure 6A), the yield linearly reaches 0.12 for the pair with a QD510 and 0.25 with a QD530. With an mCherry second layer (Figure 6B), the maximal yield was about 0.25 for a QD510 and close to 0.6 for the other tested QDs. Compared with the experimental data, one may conclude that monolayers prepared with QDs as the first layer allow very effective resonance energy transfer. In the case of the mBanana-QD510 pair, the calculated yield is even higher than predicted from the computation, which suggests conformation changes in the proteins or the better-than-expected adaptation of proteins and smallest tested QDs. In a computation with proteins as the first layer, for all coverage variants of a second layer, the yield was almost maximum. The computation here is not in line with the experiments, where much lower efficiencies were found. All this led to the conclusion that the binding of a protein on the QD surface might be promoted, most probably by HisTag interaction with the QD surface.

Figure 5.
Fluorescence lifetimes of QDs immobilized onto PVDF membrane. The excitation was by 405 nm laser, and emission signal was collected at QD emission maxima. Fluorescence lifetime values are amplitude-weighted averages of three exponential decays. Particular values of decays and amplitudes are presented in Supplementary Table S4. Statistical significance of differences (p-values) is presented in figures as ** (p < 0.01).
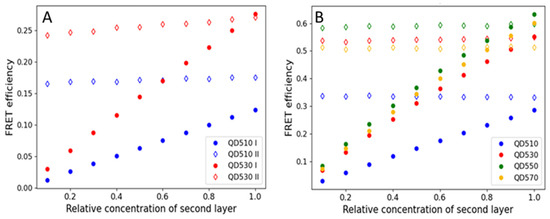
Figure 6.
FRET efficiencies are calculated for varied relative concentrations of QDs as a first layer (filled data marker) or a second layer (empty data marker). (A) An mBanana as an acceptor or (B) an mCherry as an acceptor.
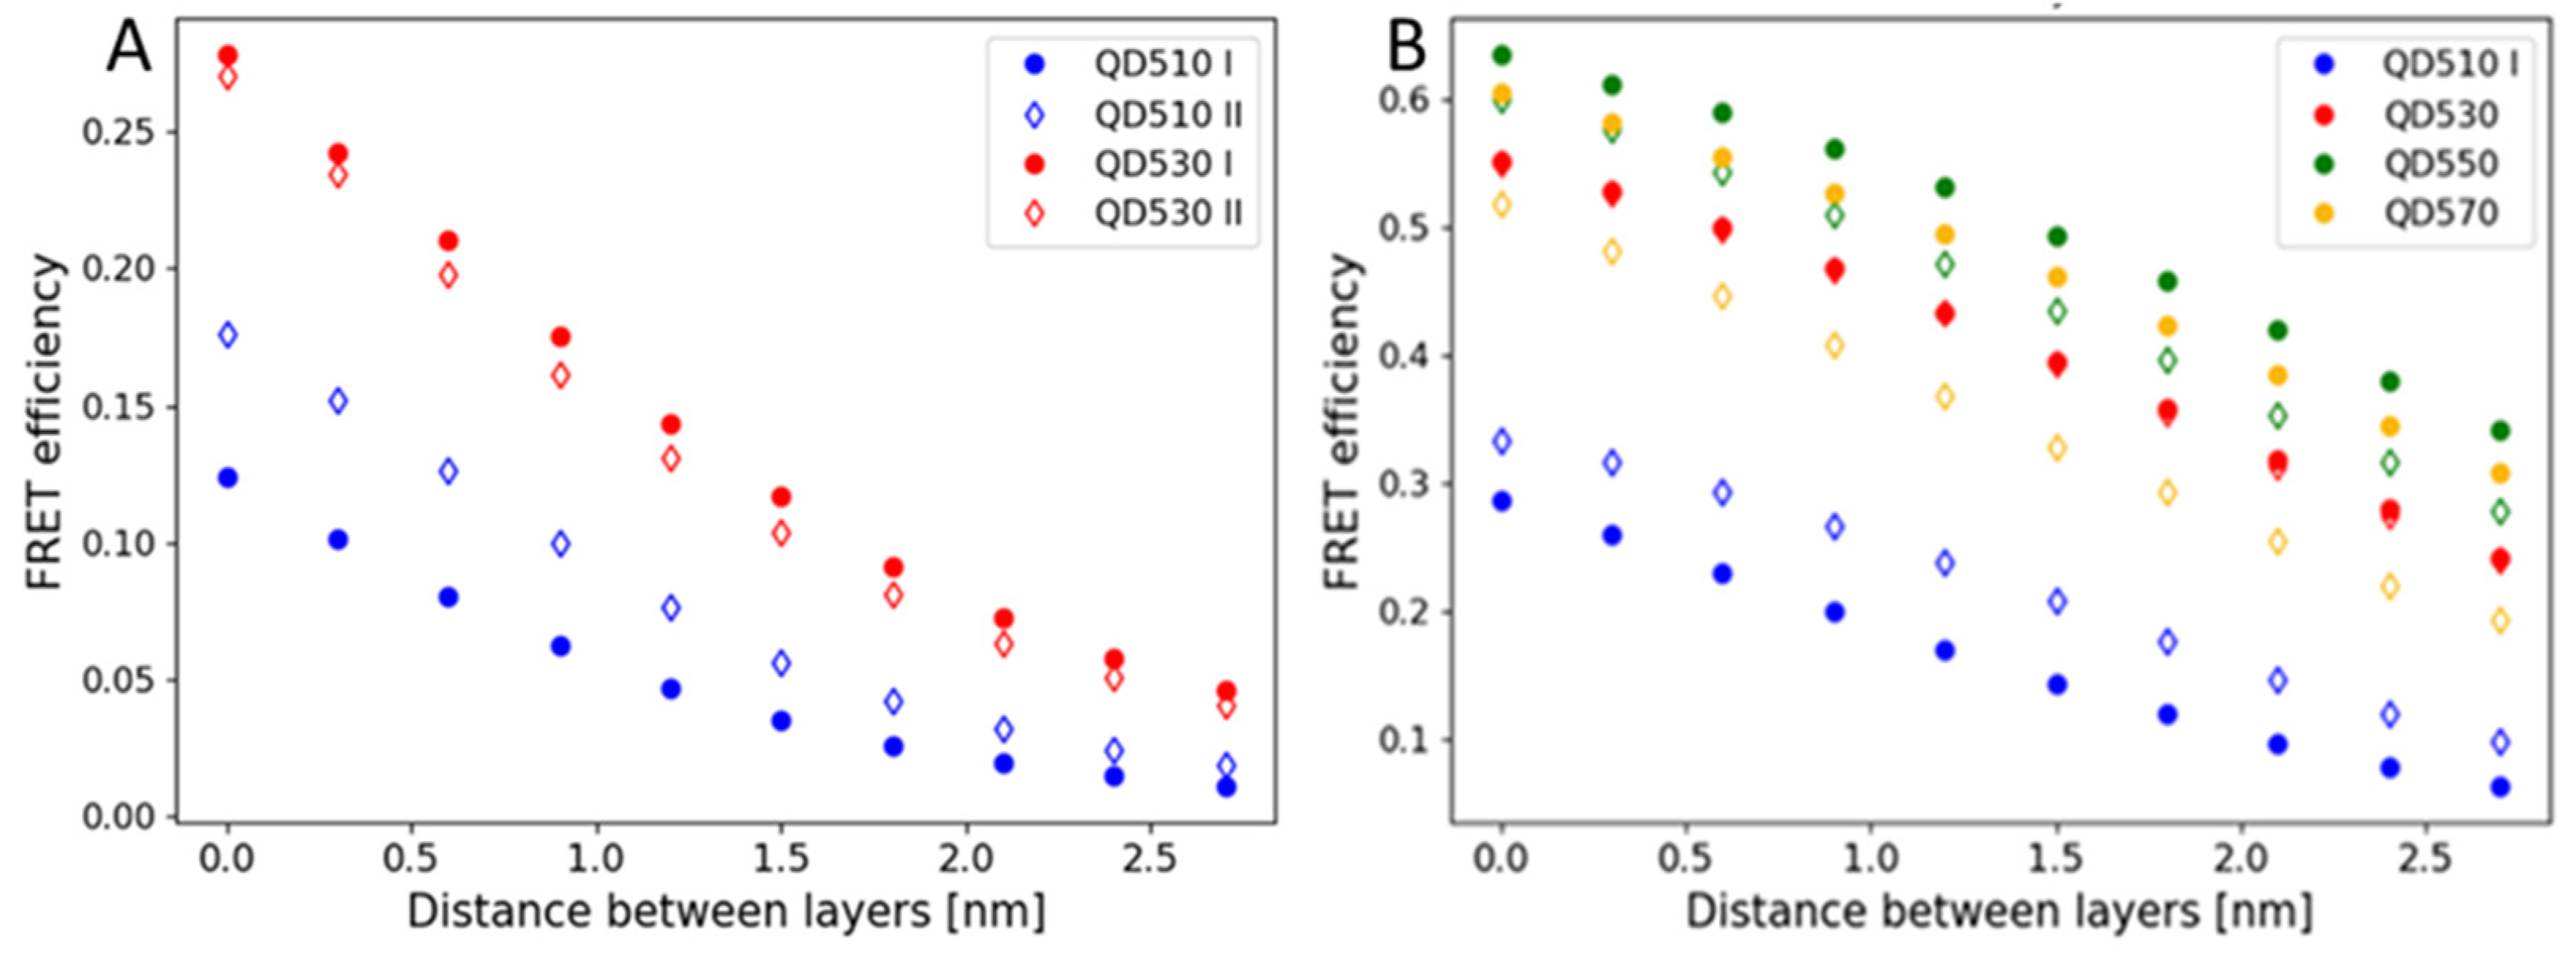
Therefore, we addressed the question of the FRET yield change with a variation in the distance between the QD layer and the protein layer. Figure 7A,B show the computation results. As expected, the efficiency strongly decreases with the distance increase. With zero distance, the efficiency is as predicted in 100% coverage. Hence, the most possible explanation for the observed experimental results of QD510-mBanana remains the reorientation and slight conformational changes in proteins. The same effect might be present in other QD-protein pairs but masked by less efficient transfer.
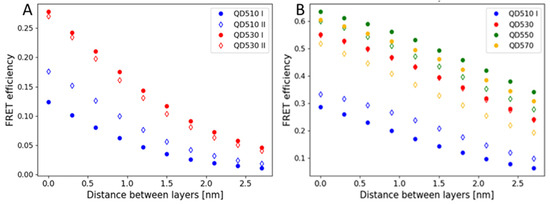
Figure 7.
FRET efficiencies are calculated for the varied distance between the first and second layers of a composite relative. (A) An mBanana as an acceptor or (B) an mCherry as an acceptor. QDs were, respectively, a first layer (filled data marker) or a second layer (empty data marker). Calculations performed form maximum layer occupancies.
3.3. In a Quest for the FRET Yield Modification in QD-Protein Monolayers—The Effect of Specific Bleaching and Externally Added Poly-L-Lysines
FRET-based assemblies are broadly designed to be used as sensors with multiple applications in chemistry, biological sciences, and medicine [16,41,42]. The idea of FRET networks for sensing was recently proposed as the natural development and broadening of a probe potential [23]. There, QDs are considered a platform, which can bring together various fluorophores. The sequential monolayers we elaborated on might be considered one of the variants of networks, however, simplified to HomoFRET and FRET in pairs. However, due to the monolayer geometry, the energy transfer may not be simply restricted to exactly one possible acceptor. This point is illustrated in the geometry design chapter of the Methods section of this paper. To be able to apply FRET-based elements as nanodevices, one needs to have a way to further modify the energy transfer yield, obtaining switches and logic gates [23]. In a formed sequential monolayer, an established FRET yield is found, depending on the factors described in the previous paragraphs. We, therefore, tested the change in this yield through the application of two external factors: laser light, with the possibility to bleach an acceptor, and a chemical factor, poly-L-lysine (PLL).
The bleach might be applied in the study of protein–protein sequential layers. The bleaching may translate to a reduction in the number of available donors, which was already proved as crucial for the efficient tuning of the intensity and fluorescence lifetime of multihybrid nanoparticles [24]. The bleaching was realized in combination with the FLIM experiment. The small square was illuminated by high laser power at the wavelength specific for a given protein absorption. With QDs and their broad absorption spectrum, it is hard to select the proper wavelength for bleaching. Additionally, QDs are relatively resistant to photobleaching. A procedure applied on an FP-FP sequential monolayer resulted in a significant decrease in a bleached protein intensity (compare Figure S3). Although the drop of the acceptor intensity was significant, the analysis of fluorescence lifetime showed that the donor fluorescence lifetime length was only partially restored (Figure S4).
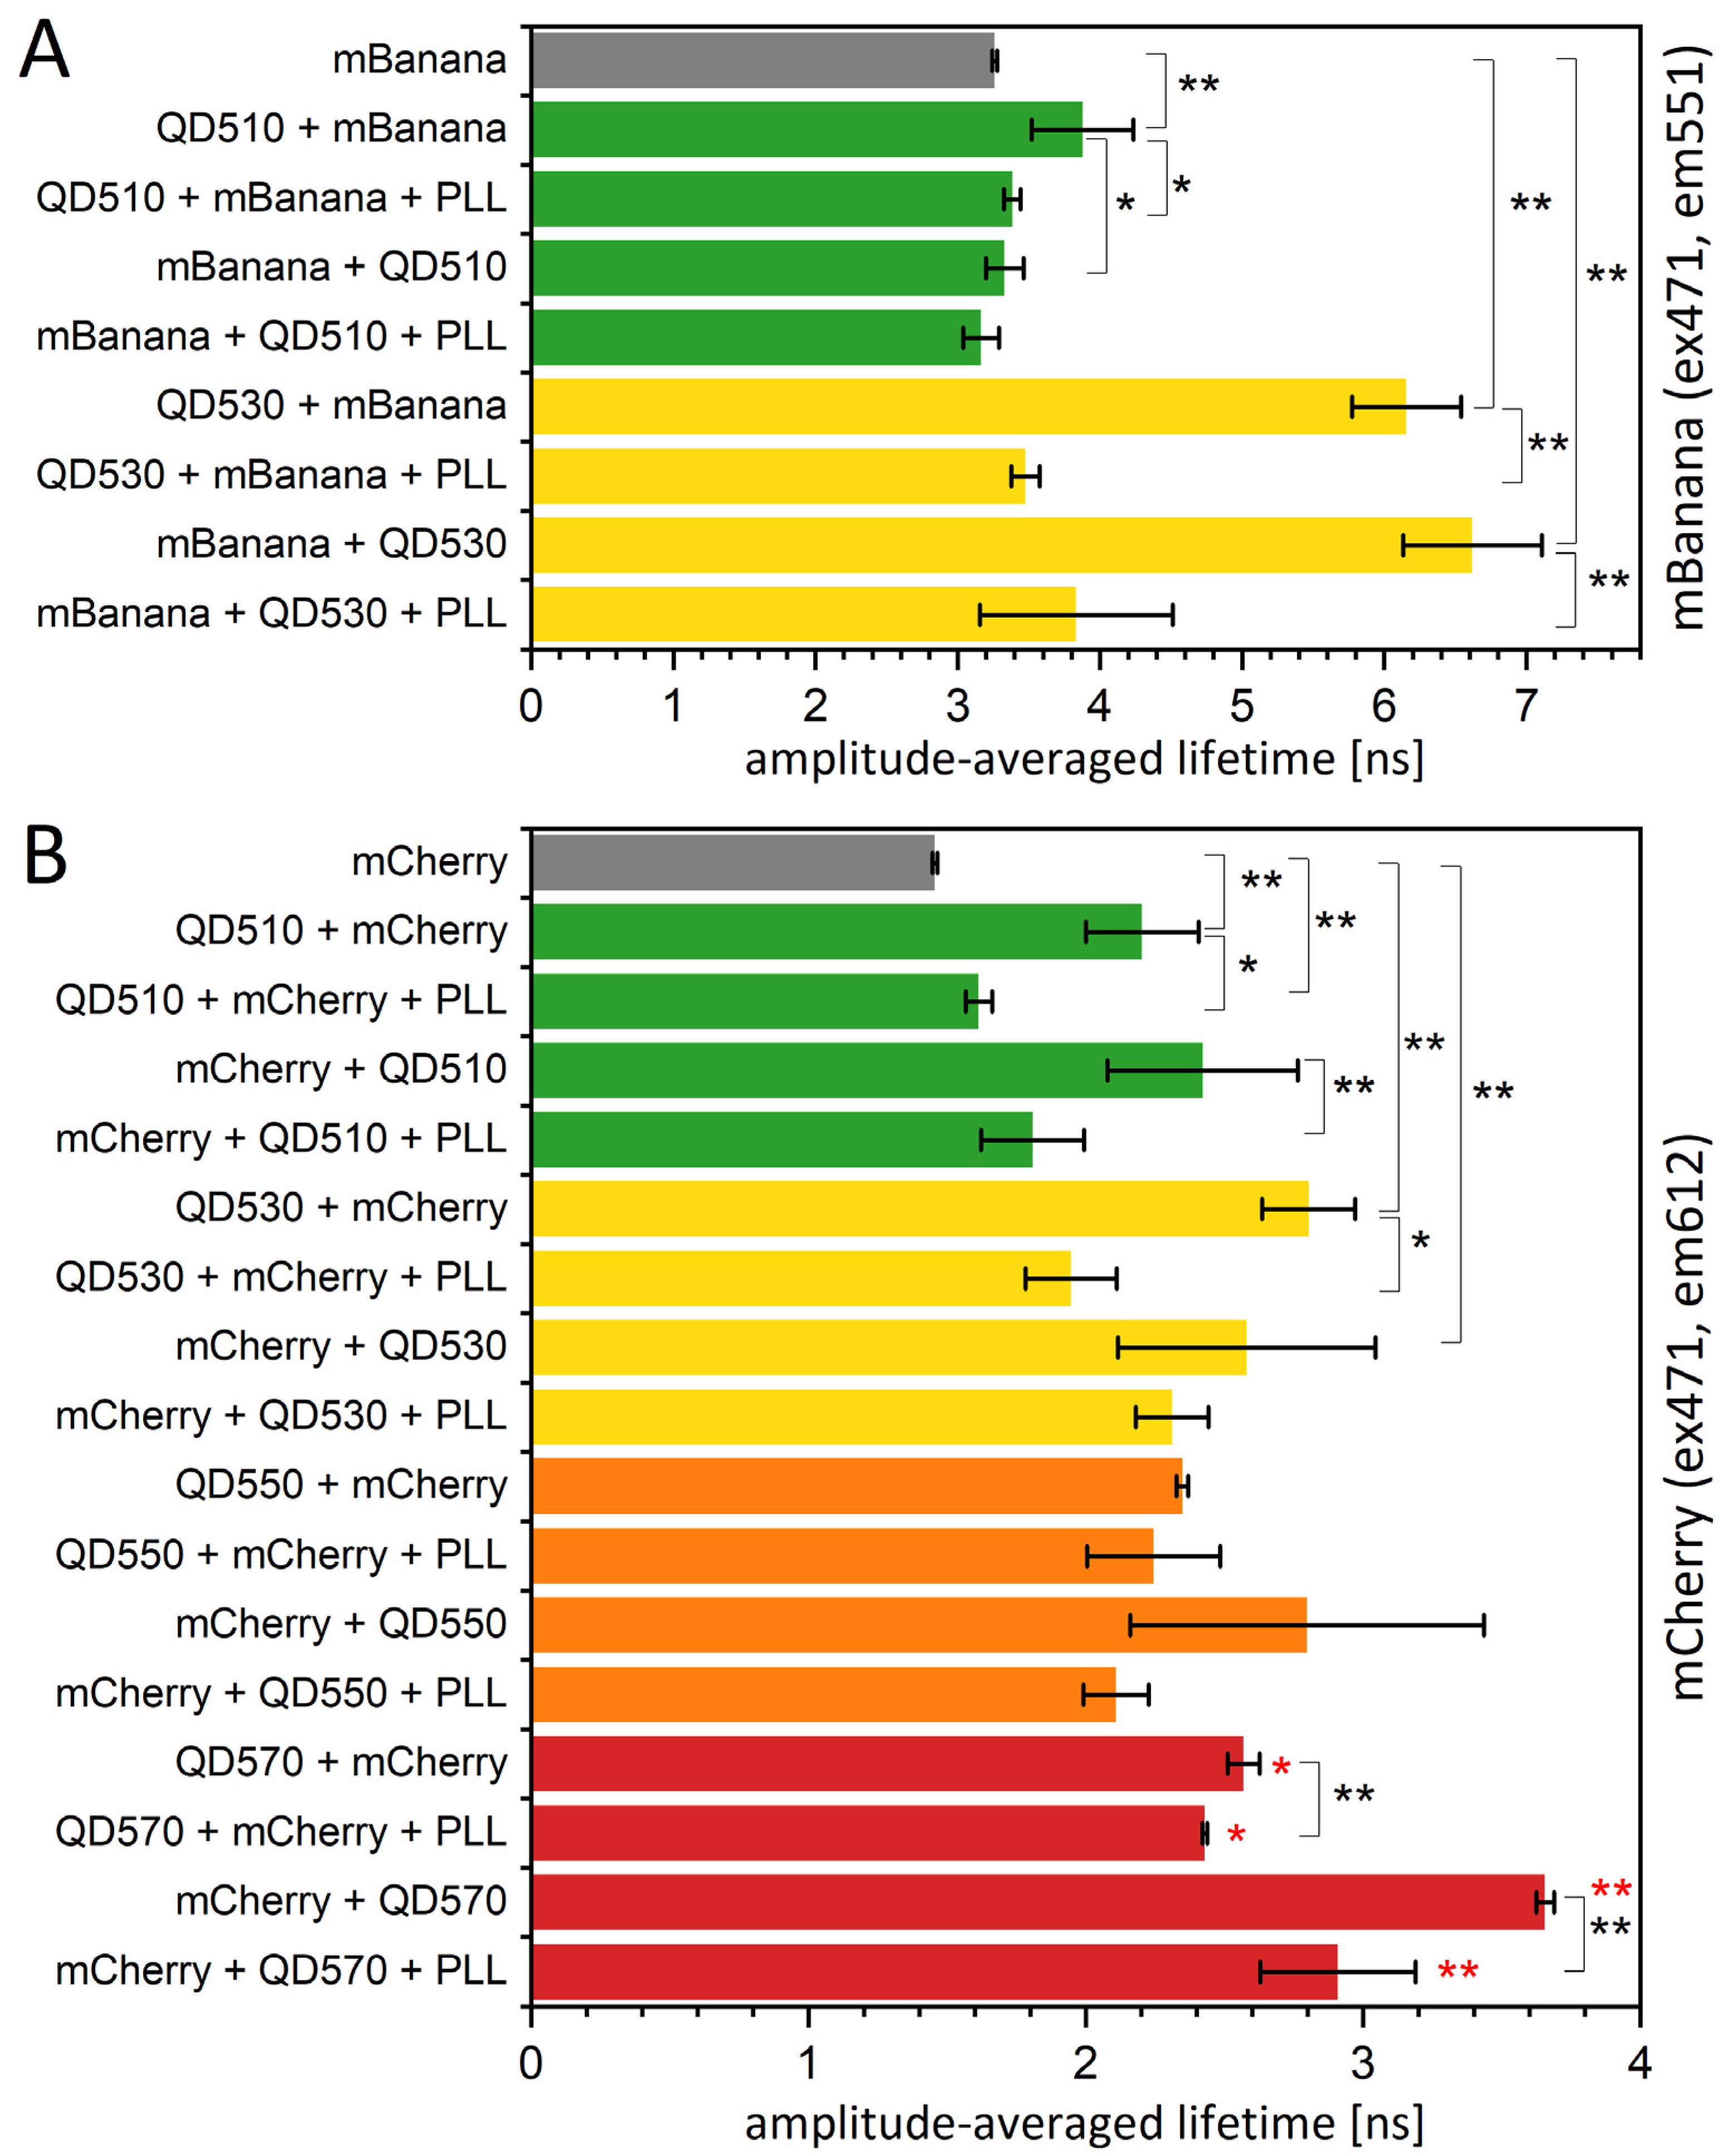
As mentioned, the bleaching procedure is not easily applied to samples containing QDs. However, we were able to find another option; in some preliminary testing, we found that PLL was strongly quenching QD emission while not influencing the fluorescence properties of proteins (see Figure S5). In the literature, PLLs are shown as nanoparticle covers; however, only those that are nonfluorescent, like iron oxide nanoparticles [43] or graphene sheets [44]. When PLL was applied to an assembled sequential monolayer, the fluorescence lifetime of an acceptor fluorescent protein was restored to a value close to the value measured for a free fluorescent protein monolayer (Figure 8). This change was accompanied by a spectral change corresponding to a significant reduction in the resonance energy transfer yield (Figure S6) and complete or partial restoration of the amplitudes and τ values found for the control protein monolayer (Table S5). The mechanism of this quenching is most probably related to the interaction of the NH2 groups of PLL with a negatively charged QD surface, resulting in the neutralization of a surface, which might influence the overall behavior of QDs. What is important here, for a QD530-mCherry assembly in solution, which we used to test the effect of PLLs on the nonimmobilized system, PLL also reduced the FRET yield. Therefore, PLL might modify the energy transfer between QDs and proteins by (i) decreasing the fluorescence yield of QDs, (ii) changing a protein-QD orientation, and (iii) changing the distance between the QDs and protein layer. The third possibility might be the effect of PLL intercalation and might result in the releasing of the protein monolayer. The last option was excluded by checking for the fluorescence of the liquid collected from the sample surface after PLL application. Recently, a formation of nanoplexes, combining fluorescent ZnS QD and Fe3O4 nanoparticles in a PLL matrix, was described [45]. The authors showed the decrease in ZnS luminescence intensity in the final combination, however, without elaborating the actual mechanism for this change.
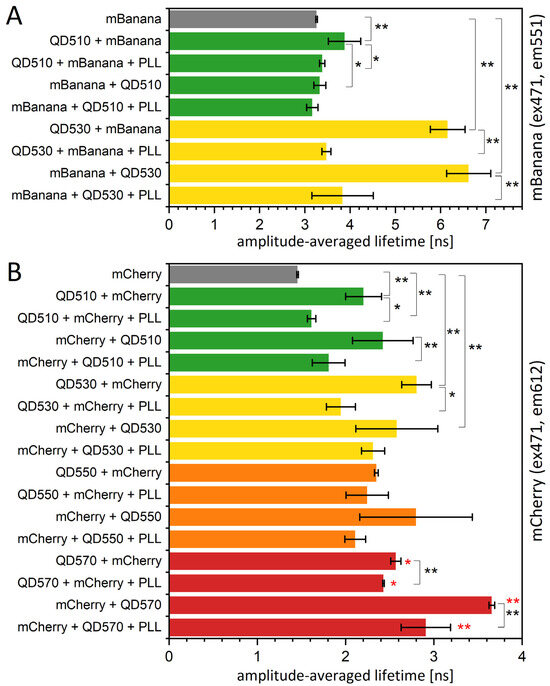
Figure 8.
The fluorescence lifetime of fluorescent proteins is increased in the presence of a QD monolayer. The fluorescence lifetime of an mBanana (A) or an mCherry (B) immobilized onto PVDF membrane with or without the presence of the first layer of QDs. The excitation was by 471 nm laser, and emission signal was collected at 612 nm (mCherry) or 551 nm (mBanana). Particular values of decays and amplitudes are presented in Supplementary Table S5. Statistical significance of differences (p-values) is presented in figures as * (p < 0.5) and ** (p < 0.01). Red * represent the difference of the last group (QD570-based monolayers) versus mCherry only (first bar).
As poly-L-lysine might be found in several length variants, we tested if the size of this polymer influences the observed effects on QD fluorescence and resonance energy transfer yield. We compared the effect of the set of available poly-L-lysines, starting from a small peptide, penta-Lys, via 1–5 kDa PLL, 15–30 kDa PLL, and 84 kDa PLL, together with the described-above 150–300 kDa PLL. We found (Figure S8) that the PLL effects are much stronger for their bigger versions and correlate directly with PLL’s ability to quench QD fluorescence (Figure S9). Similar results were found for a QD530-mCherry assembly analyzed in solution (see Figure S7). Interestingly, we found that smaller PLL may more efficiently quench QD510 monolayer fluorescence but not QD570 monolayer fluorescence (Figure S9). For PLLs which were not properly stored and resulted in huge aggregates (with a diameter of about 1 μm, as verified by DLS; not shown), the quenching efficiency was also reduced. None of the tested PLLs can be removed from the applied monolayers by buffer washing, indicating that the binding, although possibly electrostatic, is strong. Therefore, the application of PLL may work only as a one-way off-switch, without the possibility of reverting the effect to “ON” and restoring the basic state of a nanobiodevice. One may consider PLL use for time-gating barcoding, similar to fluorescence lifetime tuning, realized by a varied donor/acceptor ratio [24]. PLL use can be considered further in a pH-dependent mode, as the structure of this polypeptide changes with pH, which may lead to subtle distance changes [46].
4. Conclusions
The materials based on sequential monolayers have a great potential in the further building of nanobiodevices. Their building blocks might be of different origins and properties; also, the substrates for monolayer deposition may vary. Here, we obtained and characterized sequential monolayers of fluorescent proteins and colloidal quantum dots deposited on a PVDF membrane. In this application, there is a possibility of resonance energy transfer between the monolayers. We showed that depending on the order of deposition, we may limit the availability of donors or availability of acceptors, hence modulating the FRET yield. Additionally, we explored the possibility of gating a FRET signal by bleaching with high light power or with externally added poly-L-lysines. The last option came out as the most interesting—we showed that PLLs selectively quench quantum dots while not affecting fluorescent proteins. This results in restoring the fluorescent protein signal to a “non-FRET” situation. We found also, that—although the effect is irreversible—the size of the PLL is a factor modulating the observed effects, and various PLLs might be used for tuning the system. For a deeper understanding of the observed changes, we performed a Monte Carlo simulation of the studied systems. With this method, we proved the foregoing observation that relative acceptor concentration is crucial. This point will be explored in further studies, also taking into consideration redox-based interactions. This is important as QDs were proved to be not only resonance energy donors but also electron donors [47,48]. We also found that the effects of PLL application are not only distance-related but also include the reorientation of proteins within the monolayer. Our data make possible the precise building and prediction of the behavior of sequential monolayers, which is crucial for their further utility. The first step, we believe, should be the implementation of sequential monolayers in microfluidic systems; this would benefit a high active surface on a relatively small device area, resulting in its high functional yield.
Supplementary Materials
The following supporting information can be downloaded at: https://www.mdpi.com/article/10.3390/app132111917/s1, Table S1: FRET-related characteristics of possible donor–acceptor pairs used in the study. Tables S2–S5: Particular components of decays, shown as averages in Figure 3, Figure 4, Figure 5 and Figure 8. Figure S1: FRET efficiencies calculated for the varied relative concentration of donor proteins. Figure S2: Fluorescence lifetimes of QD510 and QD550 immobilized onto PVDF membrane. Figure S3: Representative images obtained during bleaching experiment. Figure S4: Mean lifetime values of donor proteins in bleaching experiment calculated from FLIM images. Figure S5: Emission spectra of QD+mBanana/mCherry samples before and after incubation with 0.1% PLL. Figure S6: PLL effects on a QD530-mCherry FRET pair in solution changes with the PLL size. Figure S7: PLL affects FRET efficiency in QD530-FP monolayers, as evidenced by the change in fluorescence lifetime. Figure S8: Fluorescence lifetime of QDs forming monolayer is shortened by externally applied PLLs. Figure S9: Fluorescence lifetime of FP in QD-FP sequential monolayers is restored by externally applied PLLs. Figure S10: Volume-weighted distribution of hydrodynamic diameters of PLLs obtained by DLS measurements.
Author Contributions
Conceptualization, J.G., J.S. and K.W.-S.; methodology, J.S. and K.W.-S.; software, J.S. and K.W.-S.; investigation, J.G., J.S. and K.W.-S.; writing—original draft preparation, review and editing, J.G., J.S. and K.W.-S.; funding acquisition, J.G. and K.W.-S. All authors have read and agreed to the published version of the manuscript.
Funding
This research was financed by the National Science Centre, Poland, under Sonata Bis grant No. UMO-2016/22/E/NZ1/00673. K.W.S. is a member of IDUB “Nanobiophysics” EF group, NCU. The computational results used in this paper were obtained with the support of the Pl-Grid infrastructure under the grant plgmolbio.
Institutional Review Board Statement
Not relevant.
Informed Consent Statement
Not applicable.
Data Availability Statement
All data are shown within manuscript and Supplementary Materials.
Conflicts of Interest
The authors declare no conflict of interest.
References
- Yang, S.T.; Liu, Y.; Wang, Y.W.; Cao, A. Biosafety and bioapplication of nanomaterials by designing protein–nanoparticle interactions. Small 2013, 9, 1635–1653. [Google Scholar] [CrossRef] [PubMed]
- Edrisi, F.; Baheiraei, N.; Razavi, M.; Roshanbinfar, K.; Imani, R.; Jalilinejad, N. Potential of graphene-based nanomaterials for cardiac tissue engineering. J. Mater. Chem. B 2023, 11, 7280–7299. [Google Scholar] [CrossRef] [PubMed]
- Kumar, M.A.; Jung, S.; Ji, T. Protein Biosensors Based on Polymer Nanowires, Carbon Nanotubes and Zinc Oxide Nanorods. Sensors 2011, 11, 5087–5111. [Google Scholar] [CrossRef] [PubMed]
- Mulyana, Y.; Uenuma, M.; Okamoto, N.; Ishikawa, Y.; Yamashita, I.; Uraoka, Y. Creating reversible p–n junction on graphene through ferritin adsorption. ACS Appl. Mater. Interfaces 2016, 8, 8192–8200. [Google Scholar] [CrossRef] [PubMed]
- Razaq, A.; Bibi, F.; Zheng, X.; Papadakis, R.; Jafri, S.H.M.; Li, H. Review on graphene-, graphene oxide-, reduced graphene oxide-based flexible composites: From fabrication to applications. Materials 2022, 15, 1012. [Google Scholar] [CrossRef] [PubMed]
- Nel, A.E.; Mädler, L.; Velegol, D.; Xia, T.; Hoek, E.M.; Somasundaran, P.; Klaessig, F.; Castranova, V.; Thompson, M. Understanding biophysicochemical interactions at the nano–bio interface. Nat. Mater. 2009, 8, 543–557. [Google Scholar] [CrossRef]
- Chen, S.H.; Bell, D.R.; Luan, B. Understanding interactions between biomolecules and two-dimensional nanomaterials using in silico microscopes. Adv. Drug Deliv. Rev. 2022, 186, 114336. [Google Scholar] [CrossRef]
- Remington, S.J. Green fluorescent protein: A perspective. Protein Sci. 2011, 20, 1509–1519. [Google Scholar] [CrossRef]
- Shaner, N.C.; Campbell, R.E.; Steinbach, P.A.; Giepmans, B.N.; Palmer, A.E.; Tsien, R.Y. Improved monomeric red, orange and yellow fluorescent proteins derived from Discosoma sp. red fluorescent protein. Nat. Biotechnol. 2004, 22, 1567. [Google Scholar] [CrossRef]
- Woo, E.; Ponvel, K.M.; Ahn, I.-S.; Lee, C.-H. Synthesis of magnetic/silica nanoparticles with a core of magnetic clusters and their application for the immobilization of His-tagged enzymes. J. Mater. Chem. 2010, 20, 1511–1515. [Google Scholar] [CrossRef]
- Gaberc-Porekar, V.; Menart, V. Potential for using histidine tags in purification of proteins at large scale. Chem. Eng. Technol. Ind. Chem.-Plant Equip.-Process Eng.-Biotechnol. 2005, 28, 1306–1314. [Google Scholar] [CrossRef]
- Miyazaki, M.; Kaneno, J.; Yamaori, S.; Honda, T.; Briones, M.P.; Uehara, M.; Arima, K.; Kanno, K.; Yamashita, K.; Yamaguchi, Y. Efficient immobilization of enzymes on microchannel surface through His-tag and application for microreactor. Protein Pept. Lett. 2005, 12, 207–210. [Google Scholar] [CrossRef] [PubMed]
- Owen, J.; Brus, L. Chemical synthesis and luminescence applications of colloidal semiconductor quantum dots. J. Am. Chem. Soc. 2017, 139, 10939–10943. [Google Scholar] [CrossRef] [PubMed]
- Zito, J.; Infante, I. The future of ligand engineering in colloidal semiconductor nanocrystals. Acc. Chem. Res. 2021, 54, 1555–1564. [Google Scholar] [CrossRef] [PubMed]
- Medintz, I.L.; Uyeda, H.T.; Goldman, E.R.; Mattoussi, H. Quantum dot bioconjugates for imaging, labelling and sensing. Nat. Mater. 2005, 4, 435–446. [Google Scholar] [CrossRef] [PubMed]
- Dos Santos, M.C.; Algar, W.R.; Medintz, I.L.; Hildebrandt, N. Quantum dots for Förster resonance energy transfer (FRET). TrAC Trends Anal. Chem. 2020, 125, 115819. [Google Scholar] [CrossRef]
- Filali, S.; Pirot, F.; Miossec, P. Biological applications and toxicity minimization of semiconductor quantum dots. Trends Biotechnol. 2020, 38, 163–177. [Google Scholar] [CrossRef]
- Gidwani, B.; Sahu, V.; Shukla, S.S.; Pandey, R.; Joshi, V.; Jain, V.K.; Vyas, A. Quantum dots: Prospectives, toxicity, advances and applications. J. Drug Deliv. Sci. Technol. 2021, 61, 102308. [Google Scholar] [CrossRef]
- Richert, L.; Arntz, Y.; Schaaf, P.; Voegel, J.-C.; Picart, C. pH dependent growth of poly (L-lysine)/poly (L-glutamic) acid multilayer films and their cell adhesion properties. Surf. Sci. 2004, 570, 13–29. [Google Scholar] [CrossRef]
- Zheng, S.; Guan, Y.; Yu, H.; Huang, G.; Zheng, C. Poly-l-lysine-coated PLGA/poly (amino acid)-modified hydroxyapatite porous scaffolds as efficient tissue engineering scaffolds for cell adhesion, proliferation, and differentiation. New J. Chem. 2019, 43, 9989–10002. [Google Scholar] [CrossRef]
- Khan, Z.G.; Patil, P.O. Design and synthesis of poly-L-lysine-functionalized graphene quantum dots sensor for specific detection of cysteine and homocysteine. Mater. Chem. Phys. 2022, 276, 125383. [Google Scholar] [CrossRef]
- Simões, M.G.; Urstöger, G.; Schennach, R.; Hirn, U. Quantification and Imaging of Nanoscale Contact with Förster Resonance Energy Transfer. ACS Appl. Mater. Interfaces 2021, 13, 19521–19529. [Google Scholar] [CrossRef] [PubMed]
- Algar, W.R.; Krause, K.D. Developing FRET networks for sensing. Annu. Rev. Anal. Chem. 2022, 15, 17–36. [Google Scholar] [CrossRef] [PubMed]
- Chen, C.; Corry, B.; Huang, L.; Hildebrandt, N. FRET-modulated multihybrid nanoparticles for brightness-equalized single-wavelength barcoding. J. Am. Chem. Soc. 2019, 141, 11123–11141. [Google Scholar] [CrossRef] [PubMed]
- Lakowicz, J.R. Principles of Fluorescence Spectroscopy; Springer Science & Business Media: New York, NY, USA, 2007. [Google Scholar]
- Sorout, N.; Chandra, A. Interactions of the Aβ (1–42) Peptide with Boron Nitride Nanoparticles of Varying Curvature in an Aqueous Medium: Different Pathways to Inhibit β-Sheet Formation. J. Phys. Chem. B 2021, 125, 11159–11178. [Google Scholar] [CrossRef]
- Zhang, J.; Kuang, Z.; Li, H.; Li, S.; Xia, F. Electrode surface roughness greatly enhances the sensitivity of electrochemical non-enzymatic glucose sensors. J. Electroanal. Chem. 2022, 919, 116541. [Google Scholar] [CrossRef]
- Yang, F.; Moss, L.G.; Phillips, G.N., Jr. The molecular structure of green fluorescent protein. Nat. Biotechnol. 1996, 14, 1246–1251. [Google Scholar] [CrossRef]
- Shu, X.; Shaner, N.C.; Yarbrough, C.A.; Tsien, R.Y.; Remington, S.J. Novel chromophores and buried charges control color in mFruits. Biochemistry 2006, 45, 9639–9647. [Google Scholar] [CrossRef]
- Grzyb, J.; Walczewska-Szewc, K.; Slawski, J.; Trojnar, M. Quantum dot clusters as self-assembled antennae with phycocyanine and phycobilisomes as energy acceptors. Phys. Chem. Chem. Phys. 2021, 23, 24505–24517. [Google Scholar] [CrossRef]
- Sztatelman, O.; Kopec, K.; Pedziwiatr, M.; Trojnar, M.; Worch, R.; Wielgus-Kutrowska, B.; Jemiola-Rzeminska, M.; Bzowska, A.; Grzyb, J. Heterodimerizing helices as tools for nanoscale control of the organization of protein-protein and protein-quantum dots. Biochimie 2019, 167, 93–105. [Google Scholar] [CrossRef]
- R Core Team, R. R: A Language and Environment for Statistical Computing; R Foundation for Statistical Computing: Vienna, Austria, 2013. [Google Scholar]
- Kressin, A.M.; Doan, V.V.; Klein, J.D.; Sailor, M.J. Synthesis of stoichiometric cadmium selenide films via sequential monolayer electrodeposition. Chem. Mater. 1991, 3, 1015–1020. [Google Scholar] [CrossRef]
- Chiodini, S.; D’avino, G.; Muccioli, L.; Bartolini, L.; Gentili, D.; Toffanin, S.; Albonetti, C. Self-organization of complete organic monolayers via sequential post-deposition annealing. Prog. Org. Coat. 2020, 138, 105408. [Google Scholar] [CrossRef]
- Basabe-Desmonts, L.; Beld, J.; Zimmerman, R.S.; Hernando, J.; Mela, P.; García Parajó, M.F.; van Hulst, N.F.; van den Berg, A.; Reinhoudt, D.N.; Crego-Calama, M. A simple approach to sensor discovery and fabrication on self-assembled monolayers on glass. J. Am. Chem. Soc. 2004, 126, 7293–7299. [Google Scholar] [CrossRef] [PubMed]
- Kumar, N.; Maldarelli, C.; Steiner, C.; Couzis, A. Formation of nanometer domains of one chemical functionality in a continuous matrix of a second chemical functionality by sequential adsorption of silane self-assembled monolayers. Langmuir 2001, 17, 7789–7797. [Google Scholar] [CrossRef]
- Yang, G.; Hallinan, D.T. Gold nanoparticle monolayers from sequential interfacial ligand exchange and migration in a three-phase system. Sci. Rep. 2016, 6, 35339. [Google Scholar] [CrossRef]
- Suzuki, M.; Husimi, Y.; Komatsu, H.; Suzuki, K.; Douglas, K.T. Quantum dot FRET biosensors that respond to pH, to proteolytic or nucleolytic cleavage, to DNA synthesis, or to a multiplexing combination. J. Am. Chem. Soc. 2008, 130, 5720–5725. [Google Scholar] [CrossRef]
- Mattoussi, H.; Mauro, J.M.; Goldman, E.R.; Anderson, G.P.; Sundar, V.C.; Mikulec, F.V.; Bawendi, M.G. Self-assembly of CdSe-ZnS quantum dot bioconjugates using an engineered recombinant protein. J. Am. Chem. Soc. 2000, 122, 12142–12150. [Google Scholar] [CrossRef]
- Mattoussi, H.; Medintz, I.L.; Clapp, A.R.; Goldman, E.R.; Jaiswal, J.K.; Simon, S.M.; Mauro, J.M. Luminescent quantum dot-bioconjugates in immunoassays, FRET, biosensing, and imaging applications. JALA J. Assoc. Lab. Autom. 2004, 9, 28–32. [Google Scholar] [CrossRef]
- Marx, V. Probes: FRET sensor design and optimization. Nat. Methods 2017, 14, 949–953. [Google Scholar] [CrossRef]
- Wu, L.; Huang, C.; Emery, B.P.; Sedgwick, A.C.; Bull, S.D.; He, X.-P.; Tian, H.; Yoon, J.; Sessler, J.L.; James, T.D. Förster resonance energy transfer (FRET)-based small-molecule sensors and imaging agents. Chem. Soc. Rev. 2020, 49, 5110–5139. [Google Scholar] [CrossRef]
- Babic, M.; Horák, D.; Trchová, M.; Jendelová, P.; Glogarová, K.; Lesný, P.; Herynek, V.; Hájek, M.; Syková, E. Poly (L-lysine)-modified iron oxide nanoparticles for stem cell labeling. Bioconjug. Chem. 2008, 19, 740–750. [Google Scholar] [CrossRef] [PubMed]
- Shan, C.; Yang, H.; Han, D.; Zhang, Q.; Ivaska, A.; Niu, L. Water-soluble graphene covalently functionalized by biocompatible poly-L-lysine. Langmuir 2009, 25, 12030–12033. [Google Scholar] [CrossRef] [PubMed]
- Mansur, A.A.; Custódio, D.A.; Dorneles, E.M.; Coura, F.M.; Carvalho, I.C.; Lage, A.P.; Mansur, H.S. Nanoplexes of ZnS quantum dot-poly-l-lysine/iron oxide nanoparticle-carboxymethylcellulose for photocatalytic degradation of dyes and antibacterial activity in wastewater treatment. Int. J. Biol. Macromol. 2023, 231, 123363. [Google Scholar] [CrossRef] [PubMed]
- Mirtič, A.; Grdadolnik, J. The structure of poly-L-lysine in different solvents. Biophys. Chem. 2013, 175, 47–53. [Google Scholar] [CrossRef]
- Boulesbaa, A.; Huang, Z.; Wu, D.; Lian, T. Competition between energy and electron transfer from CdSe QDs to adsorbed rhodamine B. J. Phys. Chem. C 2010, 962–969. [Google Scholar] [CrossRef]
- Sławski, J.; Szewczyk, S.; Burdziński, G.; Gibasiewicz, K.; Grzyb, J. Time-resolved absorption measurements quantify the competition of energy and electron transfer between quantum dots and cytochrome c. Spectrochim. Acta Part A 2023, 295, 122627. [Google Scholar] [CrossRef]
Disclaimer/Publisher’s Note: The statements, opinions and data contained in all publications are solely those of the individual author(s) and contributor(s) and not of MDPI and/or the editor(s). MDPI and/or the editor(s) disclaim responsibility for any injury to people or property resulting from any ideas, methods, instructions or products referred to in the content. |
© 2023 by the authors. Licensee MDPI, Basel, Switzerland. This article is an open access article distributed under the terms and conditions of the Creative Commons Attribution (CC BY) license (https://creativecommons.org/licenses/by/4.0/).