Abstract
Pump station engineering is a water conservancy project that utilizes water pump units for energy transfer and conversion, and safe water transportation. This study ensures the safe and efficient operation of the pumping station system by taking a pump station project containing seven water pump units as the research object. Under the premise that the total water intake of the pumping station is certain, the flow distribution of the pumping station is optimized with the working flow and head as the constraint function, and the minimum operating cost as the objective function, and the required number of operating units is determined to obtain the optimal combination of flow distribution and the corresponding working flow of each operating unit. Compared with previous studies, the novel feature of this study is that a genetic algorithm is used to optimize the power-up combination and rationally distribute the flow, which can minimize the energy consumption and maximize the operation efficiency of the pumping station. Then, a genetic-algorithm-based optimization method is constructed for unit operation combination and flow distribution. The optimized combination of units is evaluated by using the uniformity of flow velocity at the inlet section of the water pump and the average deviation angle of the section as indicators. The results indicate that, when each operating unit in the pump station has the same working flow distribution, the total input power of the pump station is at maximum. As the differences increase in the working flow rates allocated to each operating unit, the total input power of the pump station decreases. Through the proposed schemes, the optimal operating combination and flow distribution of the pump station system can be achieved when the total water intake is constant, thereby enabling efficient operations and creating maximum economic and social benefits.
1. Introduction
Pump station engineering, as an important component of water conservancy construction, is widely used in various aspects of national economic construction. However, its operation also consumes an increasing amount of electricity. Statistics show that the electricity consumed by pump units during operation accounts for over 21% of the operating cost. Therefore, the safe, stable, economical, and long-term operation of pumping stations has become an urgent research topic in the field of engineering [1]. In the actual operation of the pump station, the operating conditions of each unit are continuously adjusted with changes in natural water volume and downstream conditions. Under the same operating conditions of the pump station, different start-up combinations and sequences have significant effects on the performance of the pump units, and the operating status and stability of the entire system. Therefore, the operation and management personnel of the pump station must make adjustments according to the actual situation at any time to maximize the benefits while minimizing energy consumption [2].
A large number of experts and scholars have carried out relevant research on the optimization of pump station operations [3,4,5,6]. Zhou Longcai [7] determined the optimal start-up combination scheme of multi-unit parallel operations by establishing a dynamic programming model for high-lift trapezoidal pumping stations. The optimized results not only improve the flow matching rate but also reduce the energy consumption of the entire pump station. Vieira F et al. [8] used linear programming to minimize the operation cost of the pump station; comparing the optimization results with the unoptimized mode revealed that the cost savings depended on the water level or capacity of the initial reservoir. Fernández García et al. [9] obtained the optimal operating mode for minimizing energy consumption and pressure loss of pumping stations by using the NSGA-II multi-objective genetic algorithm. Chen et al. [10] also used this algorithm to establish a universal model for water intake and supply pump stations, reducing the operating costs by 7% and 6.2%, respectively. Pawel [11] developed a unique genetic algorithm program using C++ language to control the input parameters of each pump and optimize the performance of a power station with four pumps running in parallel; experiments were used to verify the optimization results, which were improved efficiency and enhanced flow rate balance. Edson Costa Bortoni et al. [12] proposed an optimization framework based on dynamic programming to improve the automatic control capability of a parallel pump circuit and thereby conserve energy. Xiao Ruofu et al. [13] optimized the operating combination of pumping station system units using the particle swarm algorithm and dynamic programming method by establishing mathematical models for each, and minimized the overall operating power of the pumping station by adjusting the combination between units. Han Xiaowei et al. [14] examined a large pumping station and determined the optimal combination plan based on Flow 3D software. A full scheduling plan was evaluated by using the uniformity of axial flow velocity and the weighted average angle of flow velocity as indicators. He Yong et al. [15], aiming at unit start-up combinatorial optimization under the complex flow state of the pump station, used a two-dimensional numerical simulation to analyze the flow state of the forebay under the operating conditions of 1–3 units and proposed their optimal combination during the operation. Bagirov A M et al. [16] used the switching operating time as a continuous variable with binary integer variables to describe the pump state, constituting a mixed integer nonlinear programming problem, and developed a new algorithm based on grid combinatorial search with Hooker Giffords pattern search as a solution. Hu S et al. [17] took the pump control system of a cogeneration plant as an example and, to minimize energy consumption, analyzed the optimal number of pumps to be operated and the synchronous speed when the water level changes. The results show that taking a small number of pumps to run is not necessarily the most energy-efficient in certain cases.
Based on the above research findings, this study focuses on a certain pumping station project, with its head and flow as constraints and its minimum input power as the objective function. A genetic-algorithm-based optimization method is constructed for the operation combination and flow distribution between pumping station units. By optimizing the combination of units, the optimal control plan of the pumping station system is determined under the premise of a certain total water intake to enable efficient operations, and create maximum economic and social benefits.
2. Research Object
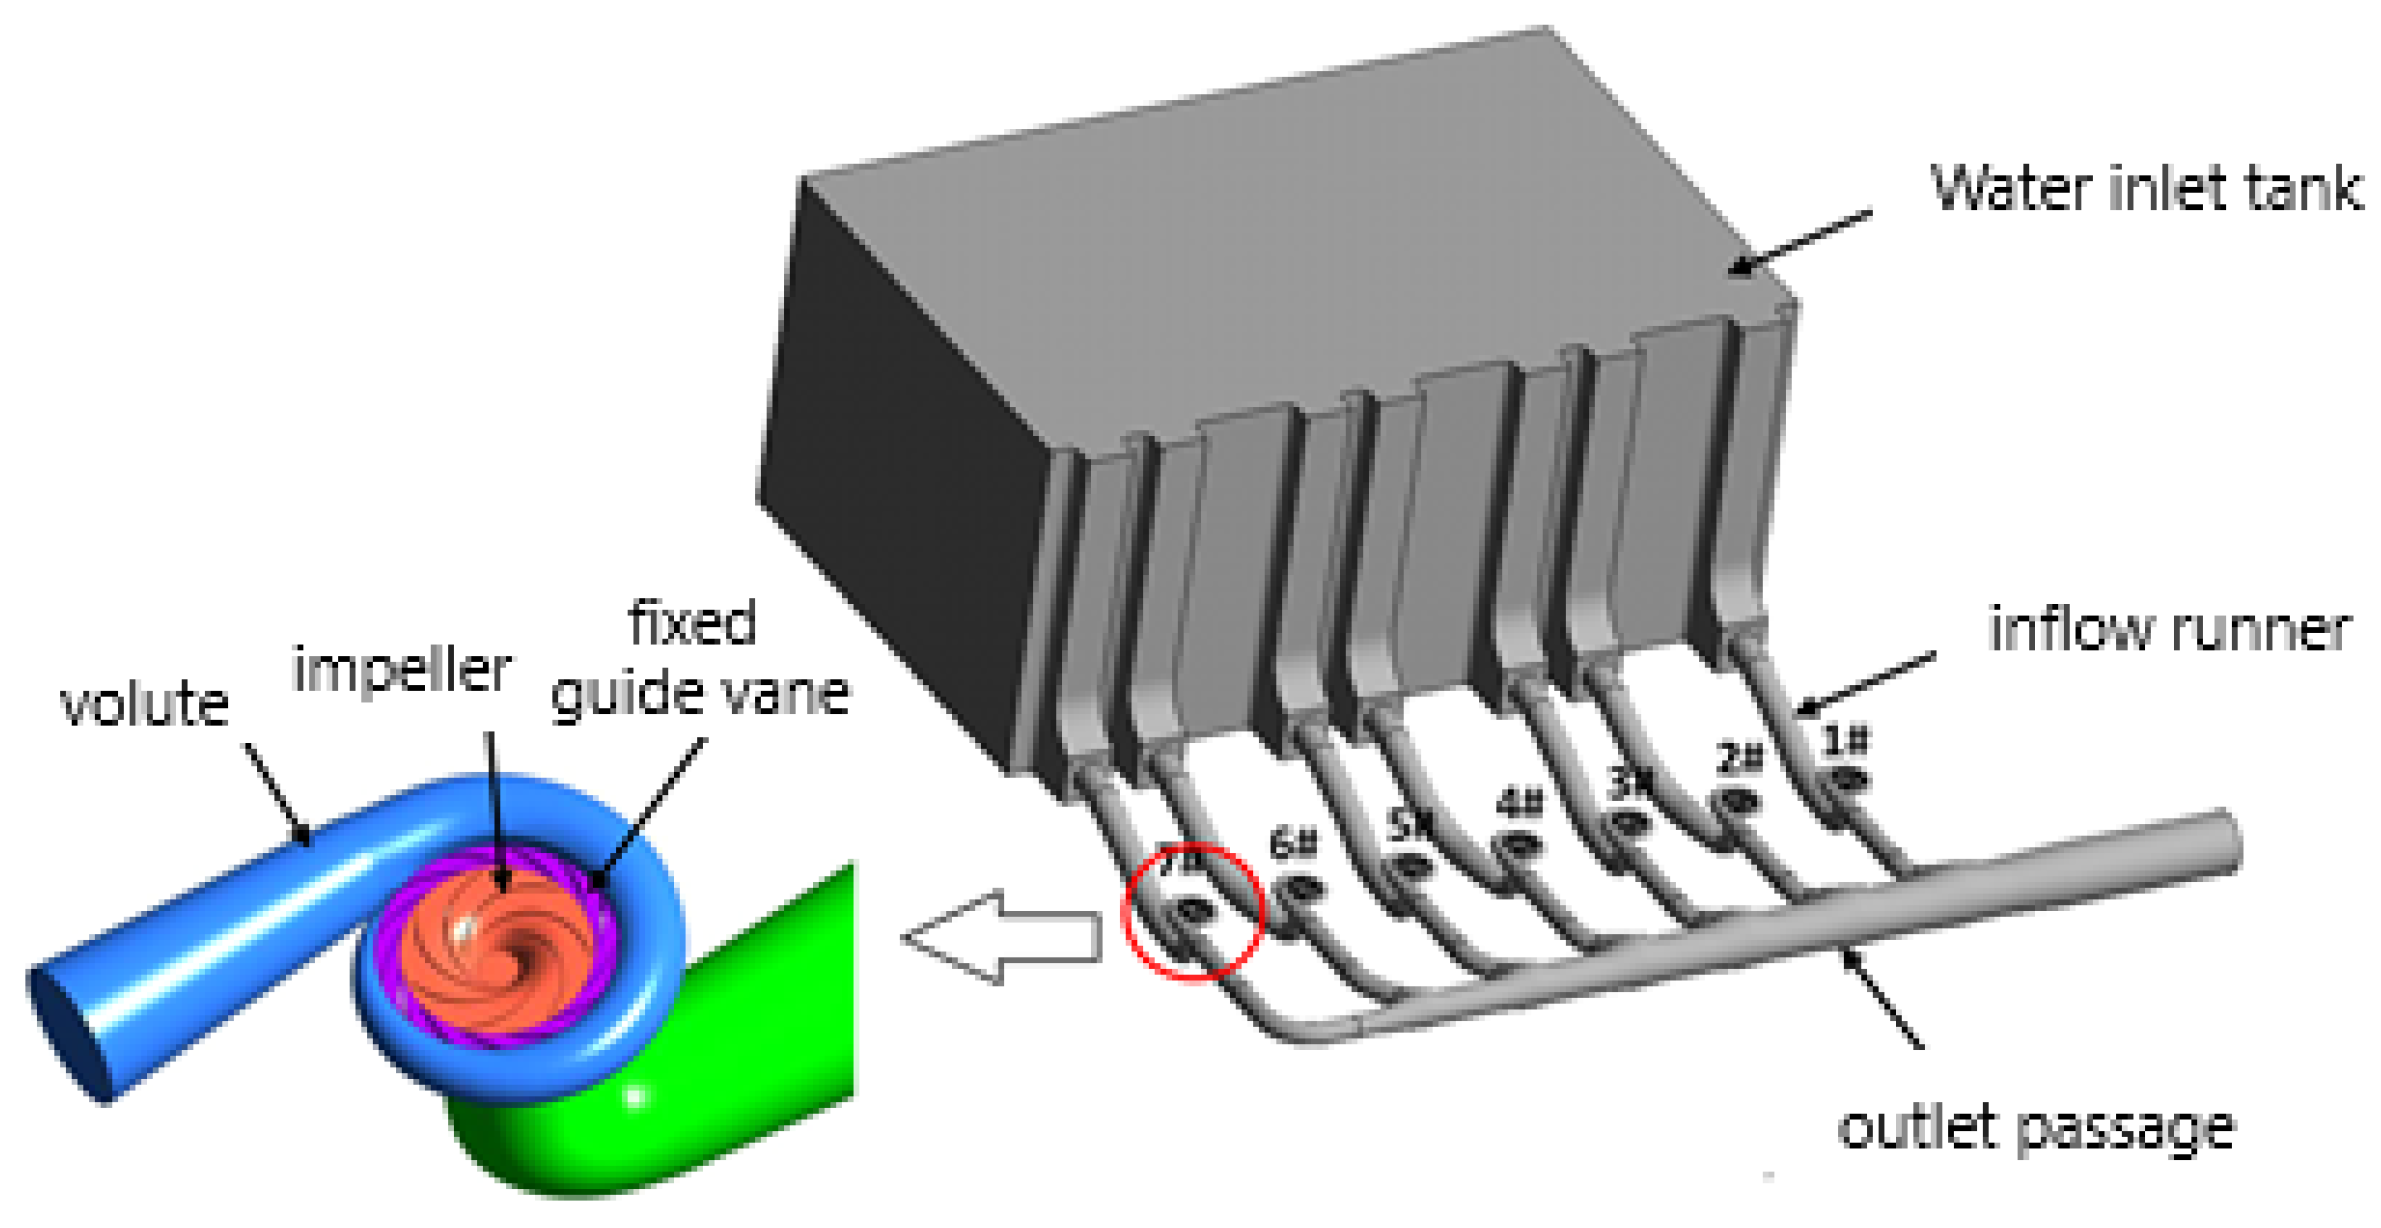
The research object is a pump station with six water pump units and one standby water pump unit. The water flow is introduced from the inlet channel to the water pump unit, passing through the impeller, fixed guide vanes, and volute, and finally leads to the outlet water tank via the outlet channel. The design flow rate of a single pump is 12.6 m3/s, the design head is 108.5 m, the maximum head is 116.5 m, and the minimum head is 100.9 m. There are two types of elbow shaped inlet channels; one has the central axis 4.7° to the left (units 1, 3, 5, and 7) and the other has the central axis 12.4° to the right (units 2, 4, and 6). The installation elevation of the pump unit is 421.00 m, the rated speed is 375 r/min, the maximum shaft power is 16 MW, the inlet diameter of the impeller is 1.397 m, the outlet diameter is 2.408 m, and there are 7 blades and 13 fixed guide vanes. The geometric model of the pump station is shown in Figure 1.

Figure 1.
Three-dimensional model of pumping station.
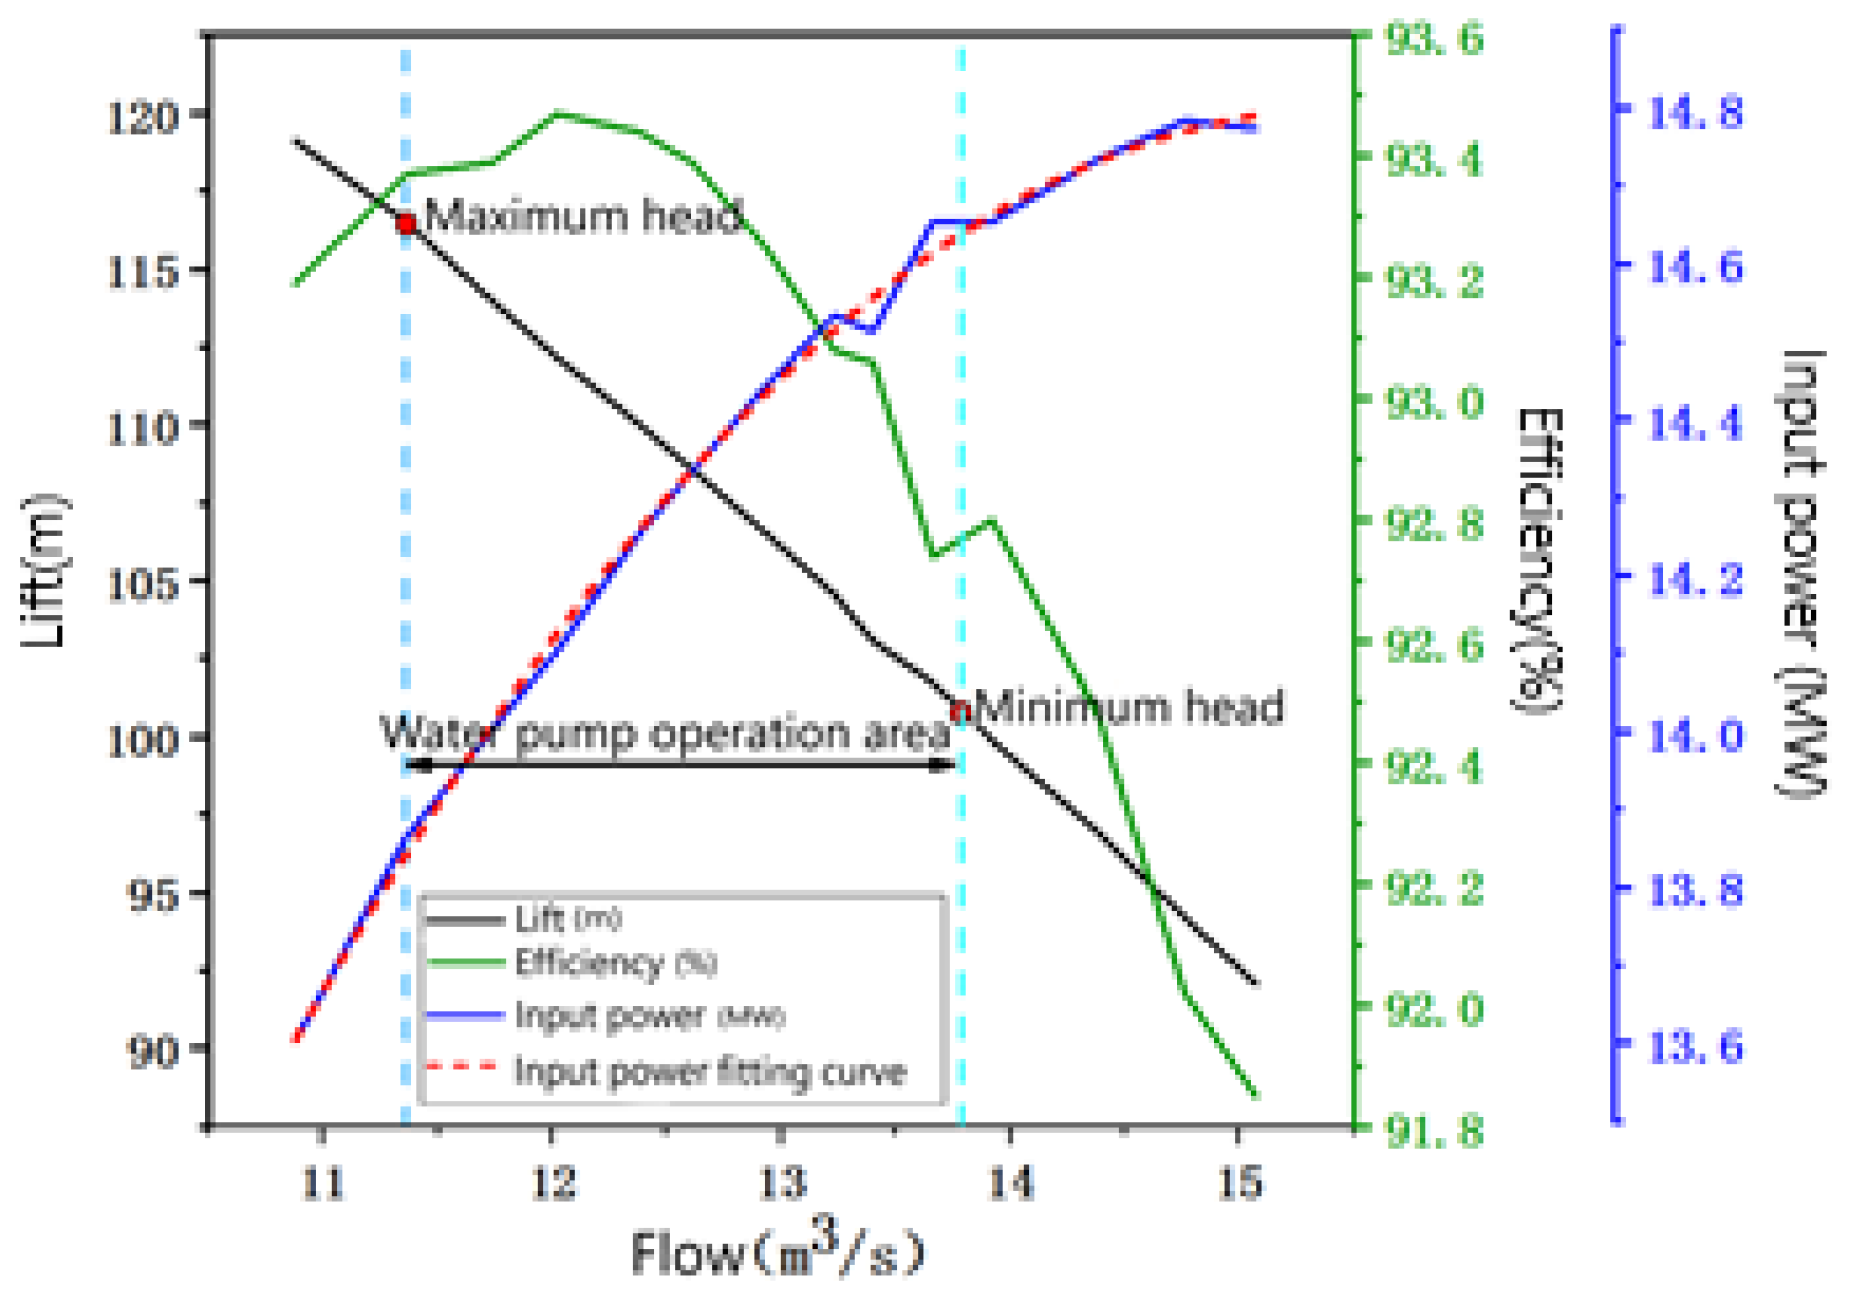
Figure 2 shows the external characteristic curve of the water pump unit. The head range of the operating area is 100.9–116.5 m. Based on the external characteristic curve of the pump unit, the operating flow range of a single pump can be concluded to be 11.38–13.63 m3/s. Simplifying the calculation, the input power curve and the operating flow rate of the water pump unit are fit into values with intervals of 0.5. The final values of the operating flow rate, head, and input power of the water pump unit are shown in Table 1. This article will mainly focus on the optimal allocation of the required number of operating units and flow rate within the pumping station for four scenarios: 70 m3/s, 60 m3/s, 50 m3/s, and 40 m3/s.

Figure 2.
Characteristics curve of pump.

Table 1.
Operating flow rate of pump unit.
3. Mathematical Model for Optimizing the Operation Combination and Flow Distribution of Pumping Station Units
3.1. Introduction to Optimization Methods
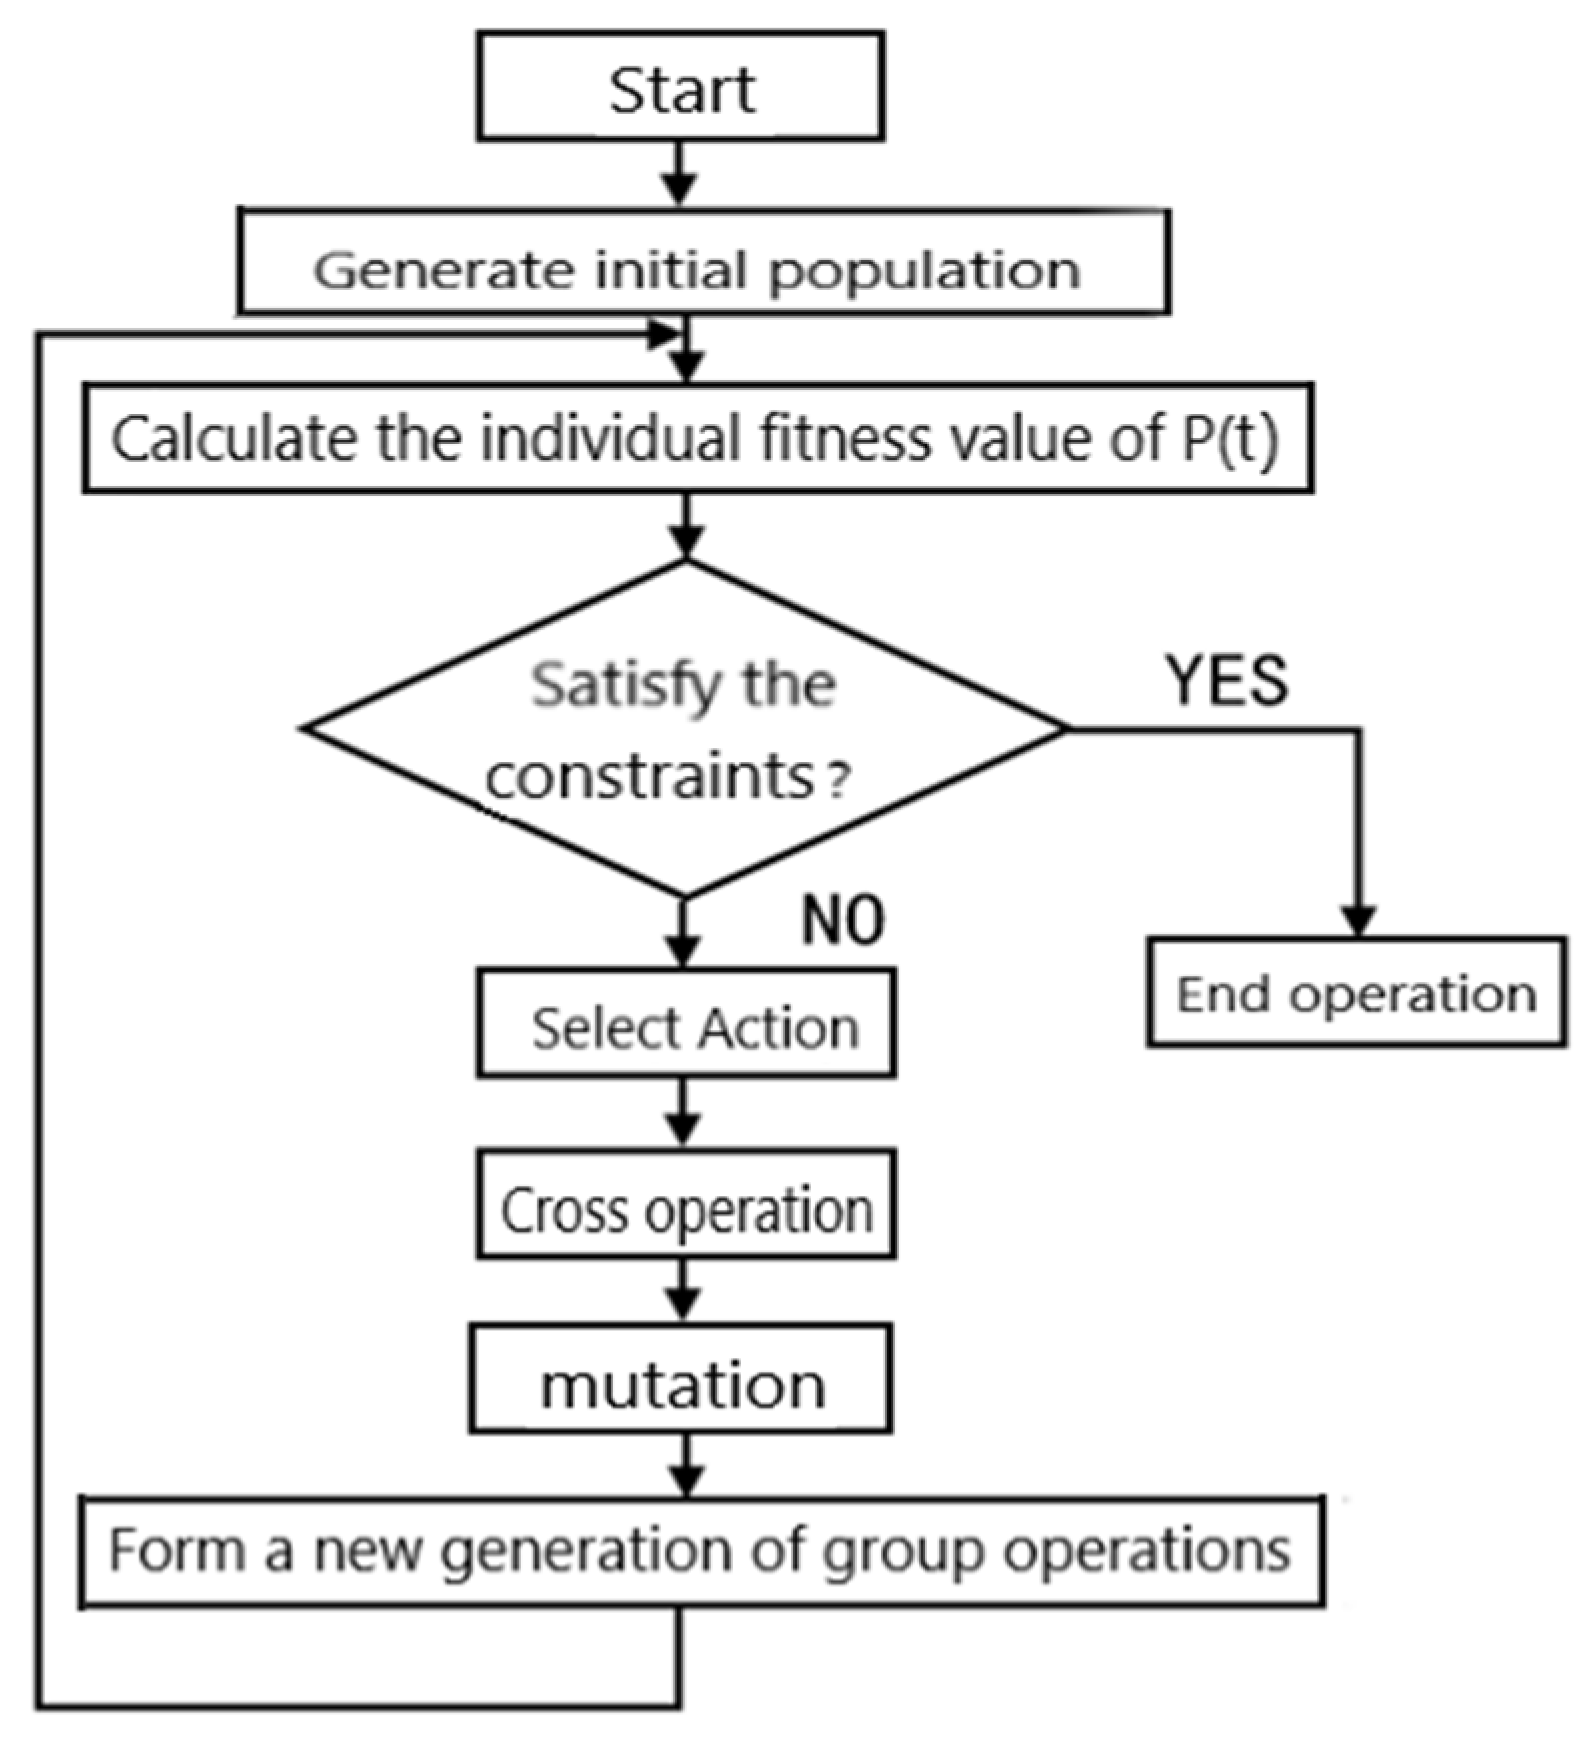
This study mainly considers two aspects for optimizing the flow distribution within the pump station. First, under the premise of ensuring the operation task of the pump station, the fixed total water intake of the pump station is reasonably distributed among the operating units. By providing an objective function and corresponding constraints, a mathematical model is established to scientifically and reasonably allocate the water flow, and the optimal combination of flow distribution under different water intake quantities is obtained. The energy consumption or input power within the pump station can then be minimized. The second aspect is the optimization combination between units within the station. Under the premise of scientific flow allocation, with the determined optimal pump station combination plan, different unit combinations are used to optimize the advantages of each operating unit while minimizing energy consumption for the whole system, thereby maximizing the pump station benefits. Thus, this study selects a genetic-algorithm-based optimization method for unit flow distribution in pump stations. The basic process is shown in Figure 3.

Figure 3.
Genetic algorithm operation flow chart.
3.2. Research Object and Mathematical Model
This article aims to minimize the total input power of the pump station under different water diversion conditions as the objective function, with the total water diversion of the pump station and the working head of the pump unit as constraints, and determines the optimal allocation of the required number of operating units and flow within the station under the premise of a certain water diversion of the pump station. The total water intake of the pump station is determined by the total workload of each operating unit. Under a certain water intake, the head of the pump station is obtained from the external characteristic curve of the pump station. By optimizing the flow distribution between each unit, the input power of the entire pump station is minimized.
The mathematical model of optimization problems can be described as follows:
Optimization variables: .
Objective function: The aim is to minimize the total input power, or energy consumption, inside the pump station. The expression is as follows:
Constraint function: Taking the operating head of the water pump as the constraint, the total water intake Q of the pump station is the sum of the working flows of n operating units. Ensuring the safe and effective operation of the unit necessitates a certain head range as boundaries. This head constraint of the water pump unit determines the flow range for single pump operation. The expression is as follows:
In the above equations, —total input power of the pump station, in MW; —number of units started; —input power of the ith operating unit, in MW; —total water intake of the pump station, m3/s; —working flow rate of the ith operating unit, m3/s; —minimum head of the water pump unit during operation, m; —maximum head of the water pump unit during operation, m; and —working head of the ith operating unit, m.
3.3. Optimal Results
The genetic algorithm used has a hybridization probability of 0.8, an algebra of 50 generations, and a population of 40 per generation. Table 2 shows the flow distribution and input power distribution for different schemes. From Table 2, it can be seen that, when multiple water pump units are operating in parallel in the pump station, and the water intake is constant, when the working flow distribution of each operating unit in the pump station is the same, the total input power of the pump station is the highest. When the difference between the maximum and minimum working flow rates assigned to each operating unit is greater, the total input power of the pump station is smaller.
Table 2.
Flow distribution results.
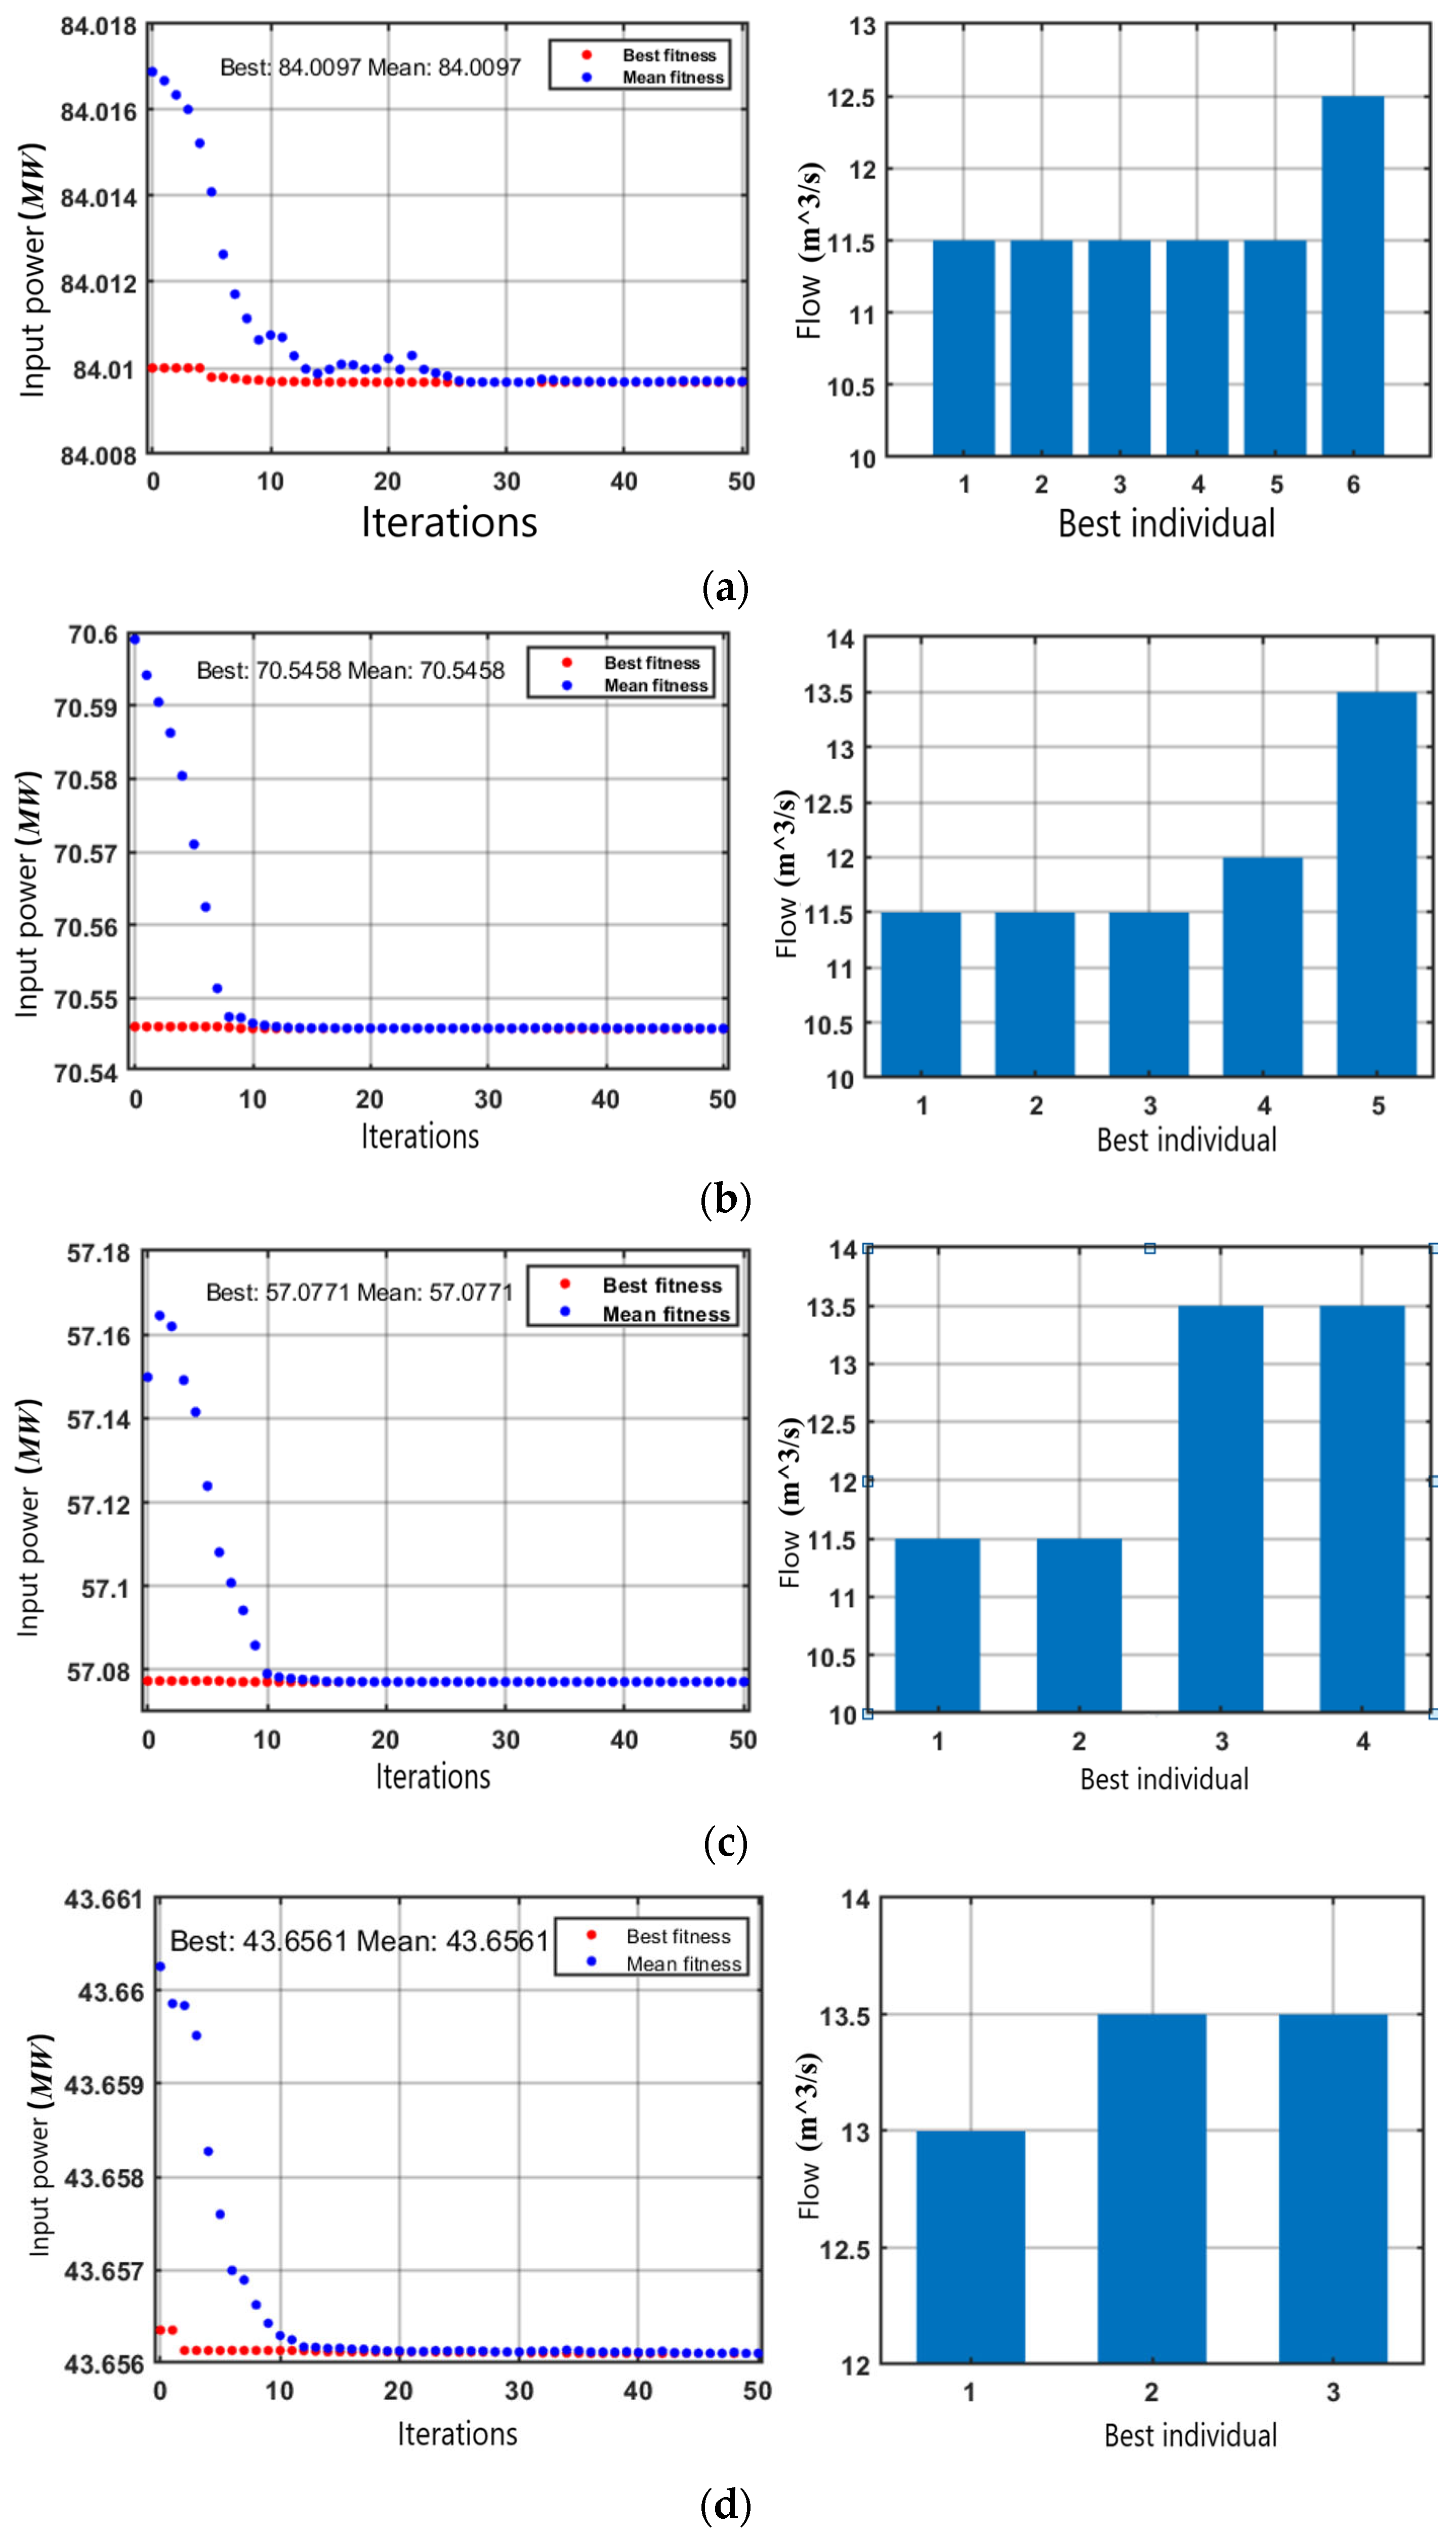
Figure 4 shows the optimal fitness and individual distribution obtained through genetic algorithms, with blue dots representing the distribution of average fitness values and red dots representing the distribution of optimal fitness values.

Figure 4.
Best fitness and best individual figure: (a) 70 m3/s; (b) 60 m3/s; (c) 50 m3/s; (d) 40 m3/s.
According to Figure 4, as the number of running iterations increases, the average fitness values show a downward trend and gradually approaches the optimal fitness values. The final flow distribution results are as follows: When the diversion volume is 70 m3/s, six units need to be started, of which five have working flow rates of 11.5 m3/s and the other unit has a flow rate of 12.5 m3/s, at minimum input power of 84.0097 MW. When the water diversion volume is 60 m3/s, five units need to be started, of which three units have working flow rates of 11.5 m3/s; the other two units have flow rates of 12 m3/s and 13.5 m3/s, at minimum input power of 70.5458 MW. When the water diversion volume is 50 m3/s, four units must be started, of which two units have flow rates of 11.5 m3/s; the remaining two units have 13.5 m3/s, at minimum input power of 57.0771 MW. When the water intake is 40 m3/s, three units must be started with flow distribution rates of 11.5, 13.5, and 13.5 m3/s, at minimum input power of 43.6561 MW.
4. Optimization of Unit Operation in the Station
The above only provides the optimal number of operating units and flow distribution of the pump station under the premise of a certain total water intake, but does not determine the specific number of operating units corresponding to the flow distribution results. When multiple units are operating simultaneously in the pumping station, under the premise of a certain flow rate and scientific allocation of flow rate, in order to maximize the advantages of each operating unit, this article uses a numerical simulation method to further determine the corresponding starting unit number for the flow distribution results and ultimately achieve maximum efficiency in the station.
4.1. Grid Partitioning of Computational models
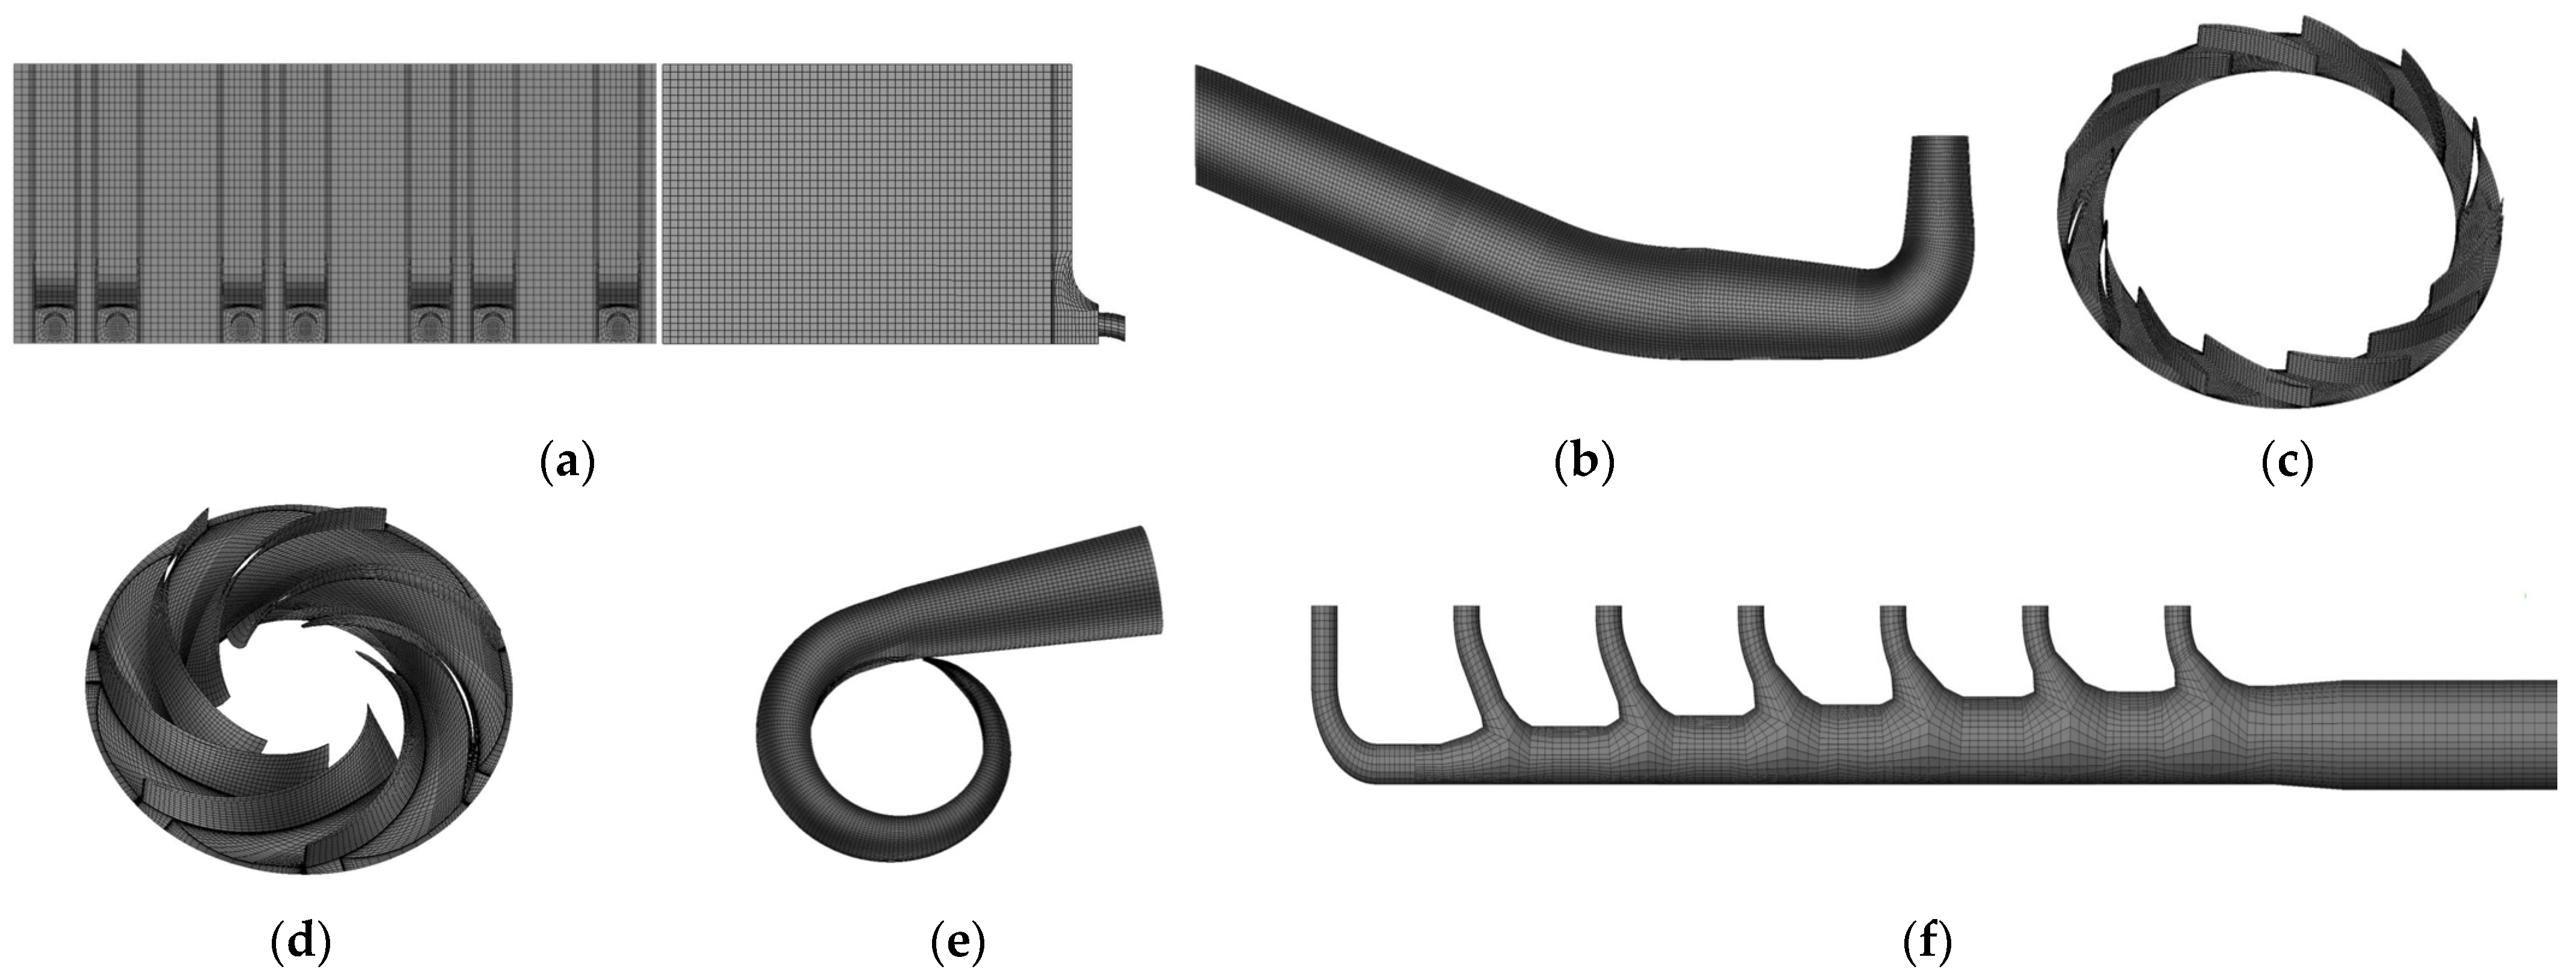
This article selects a hexahedral structured grid to divide the calculation area of the research object into multiple flow components: inlet water tank, inlet flow channel, impeller, fixed guide vane, volute, outlet flow channel, and outlet water tank. The hexahedral structured grid is divided separately, and the generated grid is adjusted to have a mass of no less than 0.2 and an angle of no less than 18°. The grid of each overcurrent component is shown in Figure 5.
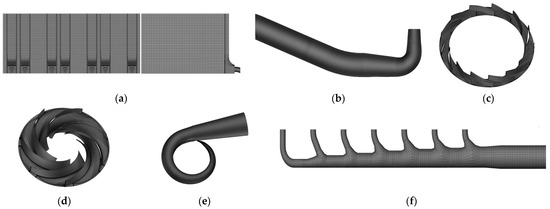
Figure 5.
Schematic diagram of meshing of different components: (a) water inlet tank; (b) inflow runner; (c) fixed guide vane; (d) impeller; (e) volute; (f) outlet passage.
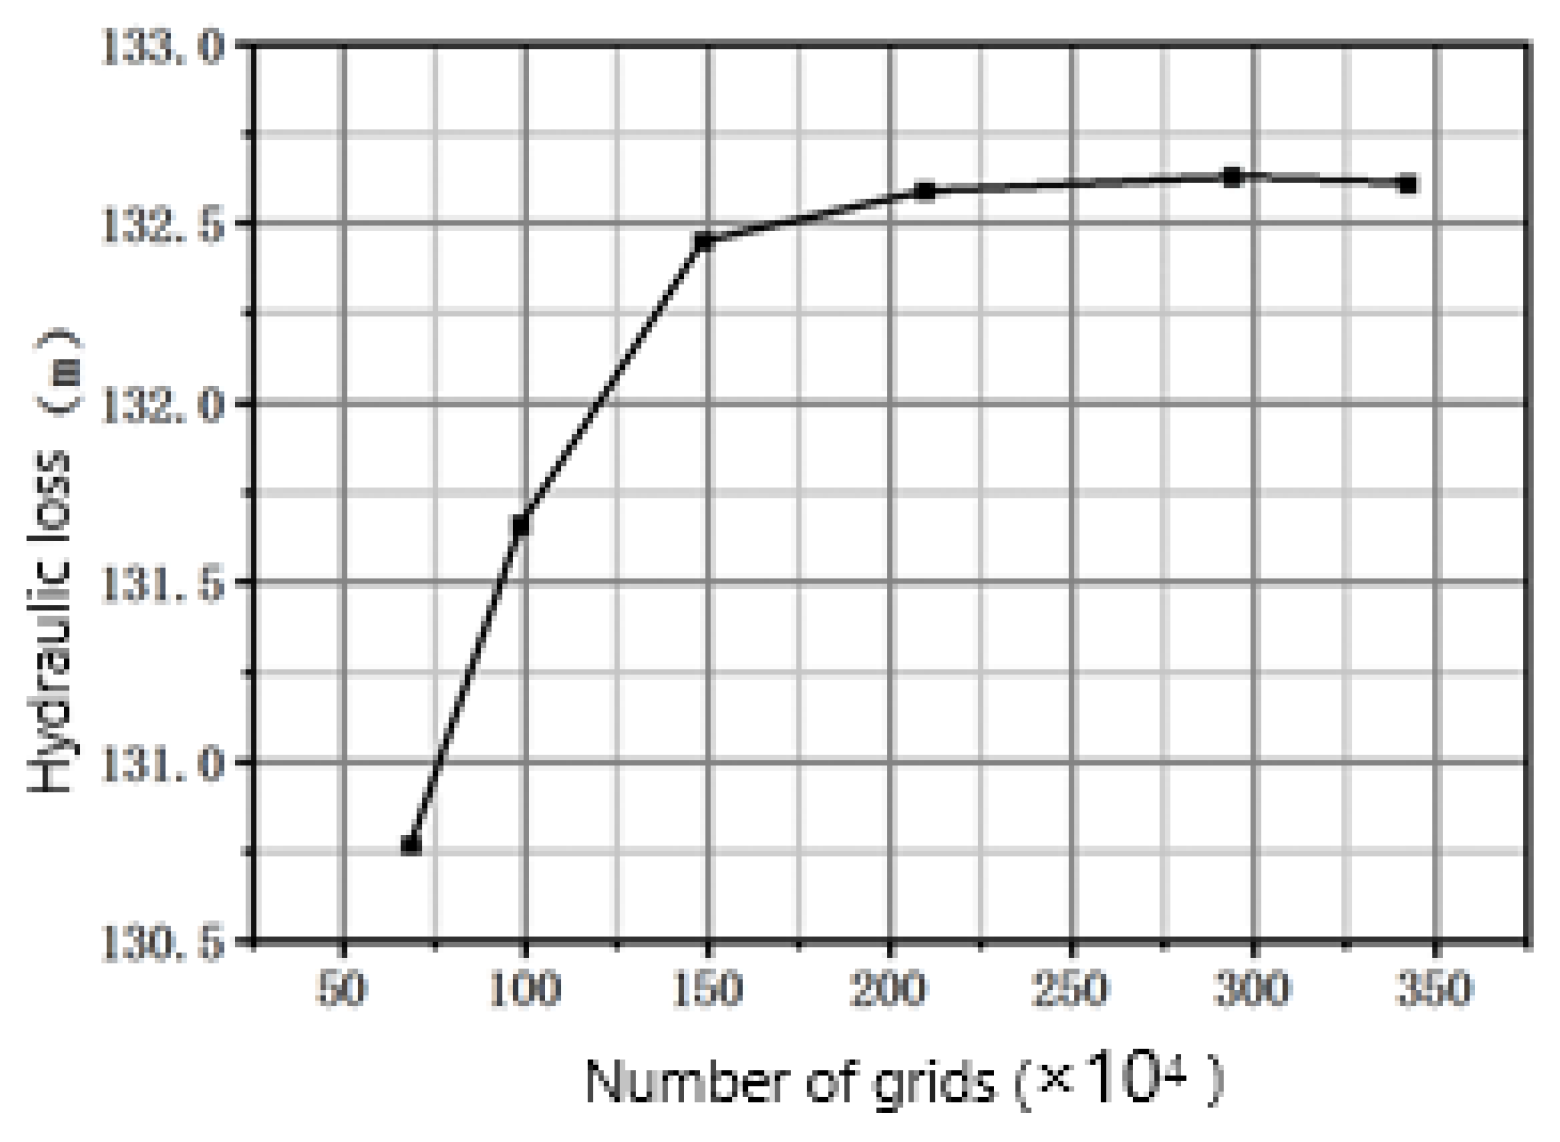
In order to eliminate the influence of the grid number on the calculation results, grid independence verification was conducted for the design conditions using the loss along the path as the evaluation index, as shown in Figure 6. It can be seen that, when the number of grids reaches 2.938 million, the variation in the loss along the way tends to stabilize, with the grid numbers for the inlet channel, impeller, fixed guide vane, and volute being 697,000, 1.116 million, 433,000, and 691,000, respectively.

Figure 6.
Grid independence verification.
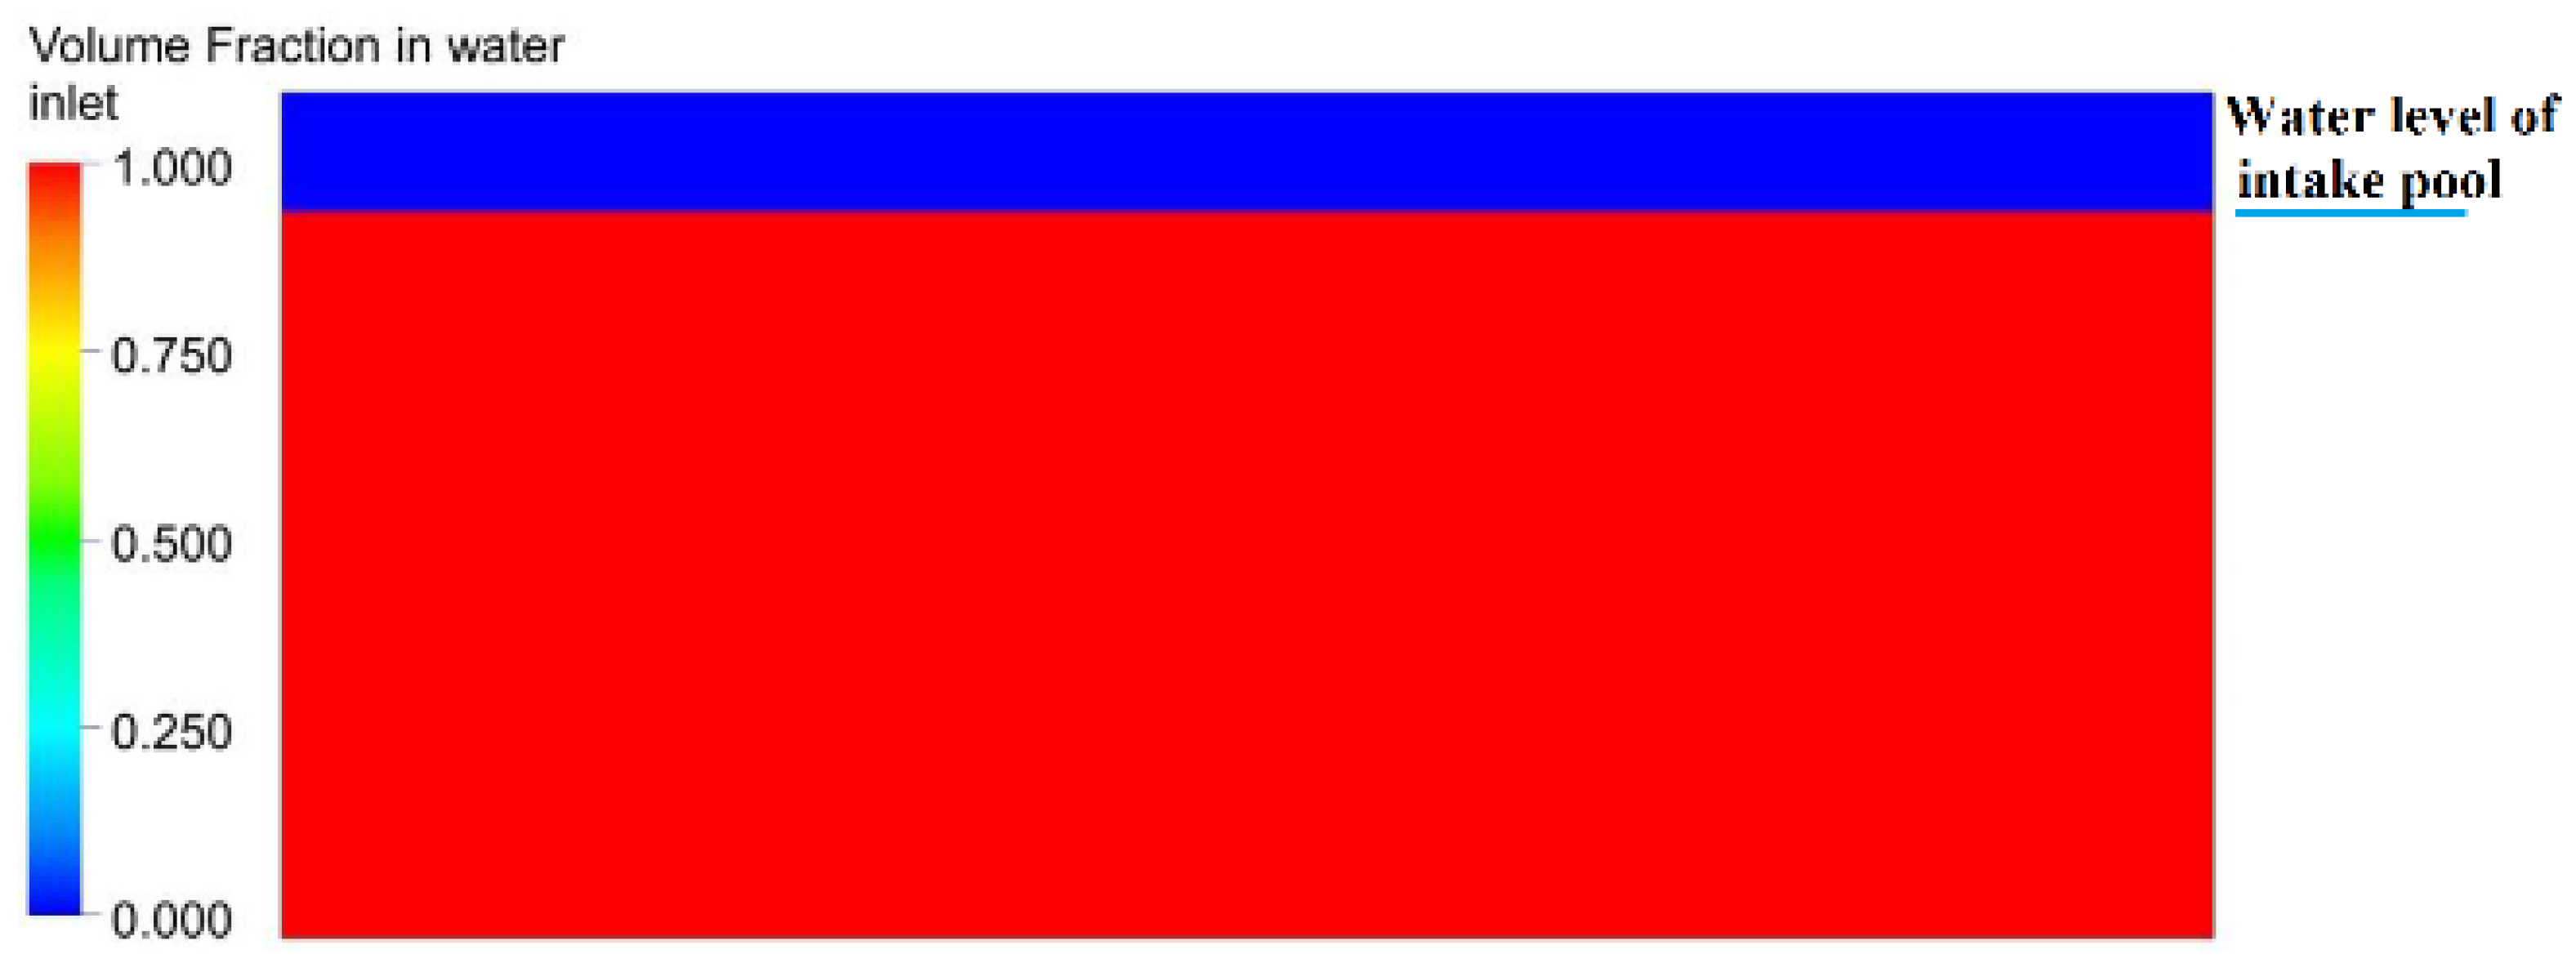
The total water intake of the pumping station varies and the corresponding water level of the inlet pool also varies. The water level of the inlet pool corresponding to different water intake volumes is shown in Table 3. The boundary conditions are (1) at the inlet of the inlet pool, given the liquid level height and static water pressure of the inlet pool; (2) the outlet boundary is the extended section of the volute and the boundary condition is set as the mass flow outlet. The inlet boundary conditions are shown in Figure 7. The red area in Figure 7 represents the liquid domain, the blue area represents the gas domain, and the boundary between the red and blue areas represents the liquid level.
Table 3.
Water level of intake pool of pumping station.
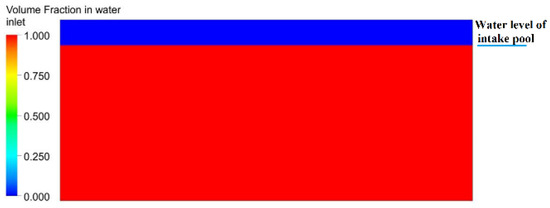
Figure 7.
Water level diagram of different flow intakes into the pool.
4.2. Total Water Inflow—70 m3/s
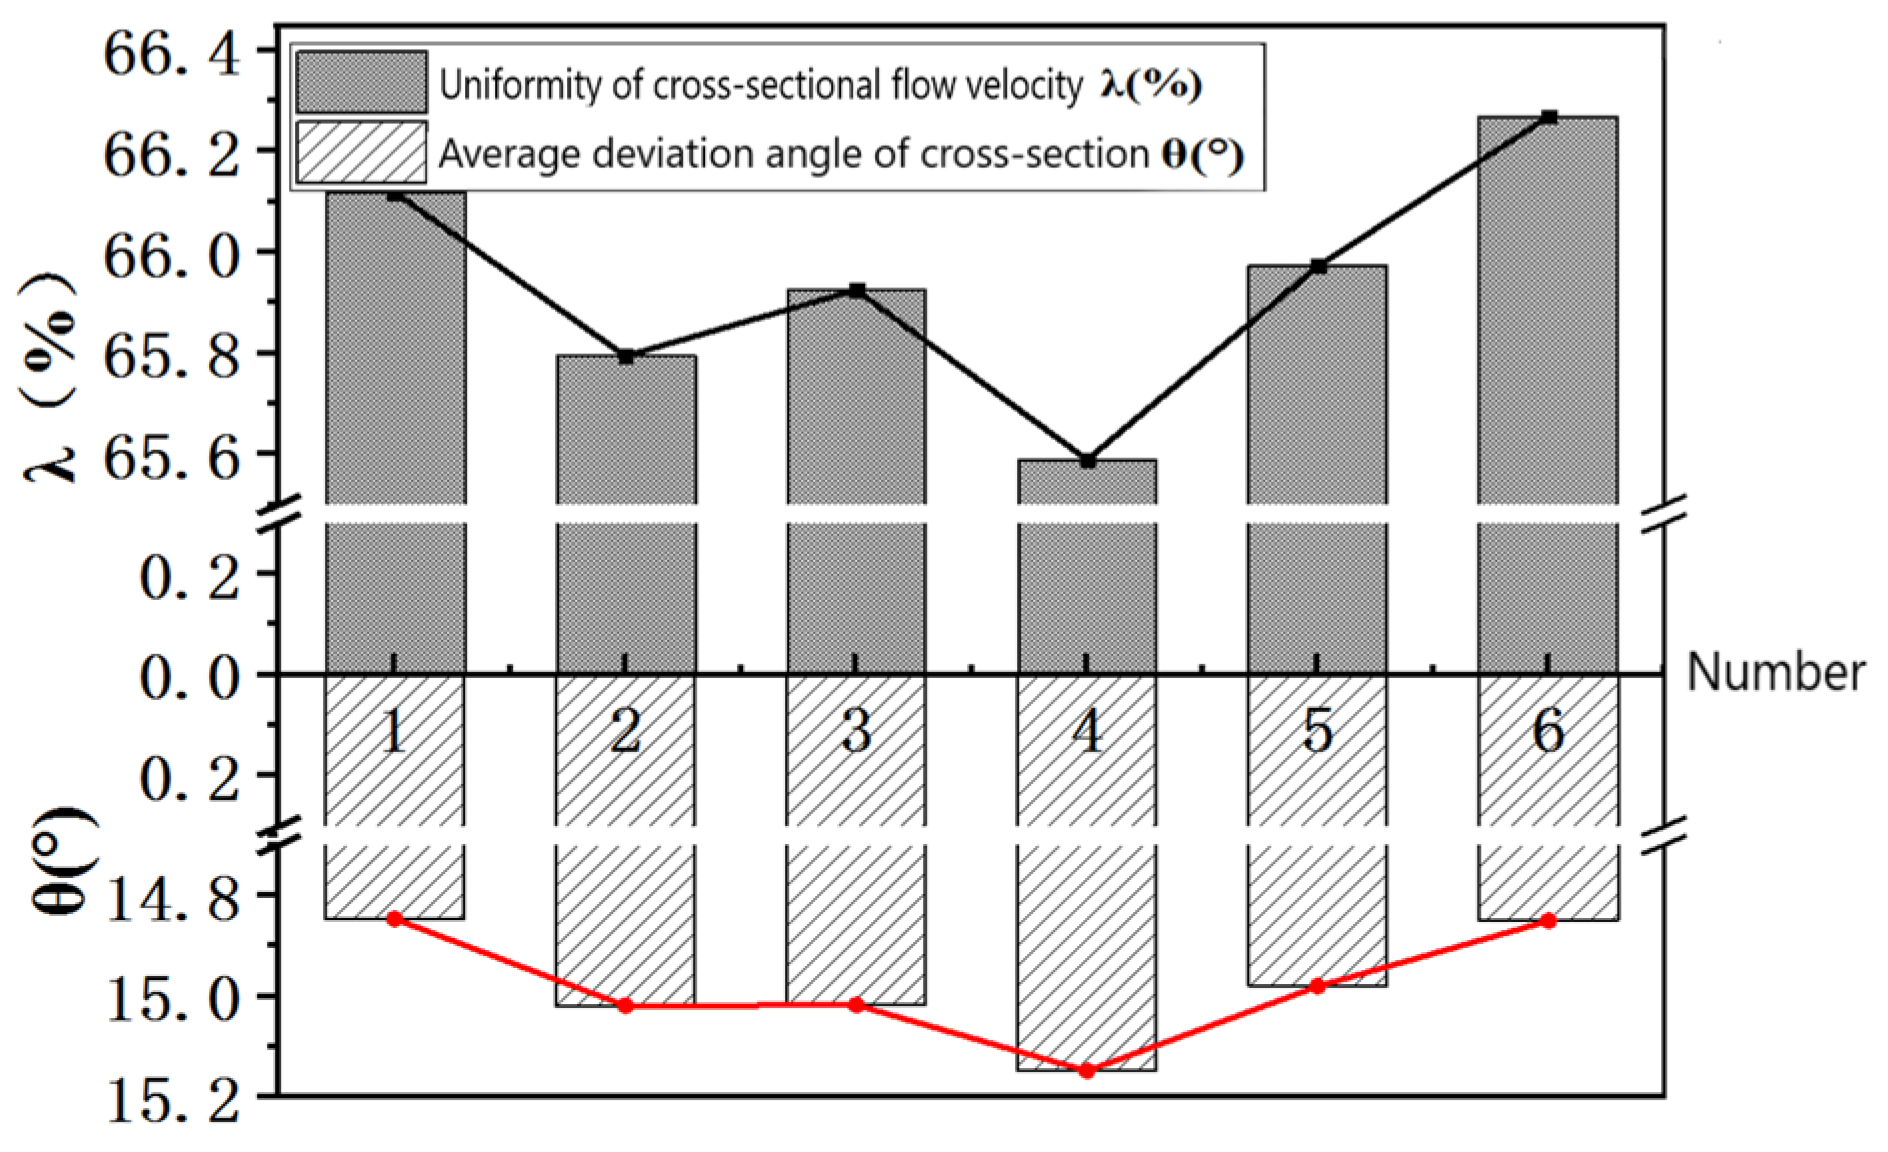
When the water intake of the pump station is 70 m3/s and the working head of each operating unit is ensured to be within the head constraint conditions, six units are started, of which five have a flow rate of 11.5 m3/s. The total input power of the pump station is at minimum when the other unit has a flow rate of 12.5 m3/s. The corresponding working flow of each operating unit of the pump station, combined with the results of flow distribution, is determined by adopting a full combination scheme. Six flow distribution combination schemes are evaluated and shown in Table 4, with the uniformity of flow velocity at the inlet section of the pump and the average deviation angle of the section as indicators (such as in Equations (4) and (5)). Compared with other cases, when the axial flow velocity uniformity and the average deviation angle of the section are closer to 0°, more water flow can enter the pump unit vertically, which is conducive to the safe and stable operation of the pump unit. Figure 8 shows the calculation results of the full combination scheme when the total water intake of the pump station is 70 m3/s.
Table 4.
Full combination scheme with a total flow of 70 m3/s/.
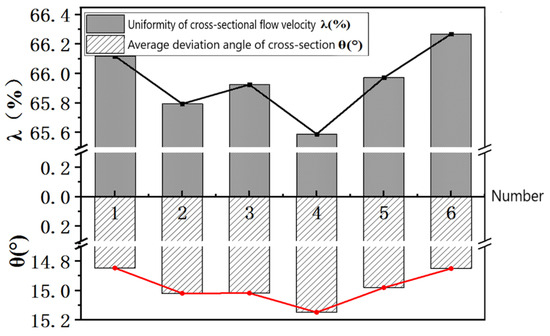
Figure 8.
Diagram of calculation result with a total flow of 70 m3/s.
Uniformity of water pump cross-sectional flow rate :
where: —Uniformity of axial flow velocity at the inlet section of the water pump, %;
- —Average axial velocity of water pump inlet section, m/s;
- —Number of calculation units for the inlet section of the water pump;
- —The ith calculation unit axial velocity of the water pump inlet section, m/s;
Average deviation angle of water pump cross-section :
where: —Average deviation angle of water pump cross-section;
- —The ith calculation unit lateral velocity of the water pump inlet section, m/s;
- (, is tangential velocity and radial velocity of the ith calculation unit of pump inlet section).
Figure 8 shows that, under different schemes, the flow velocity uniformity and average deviation angle at the inlet section of the water pump have no significant variation amplitudes. In the full combination scheme, the maximum average deviation angle of the water pump inlet section is 15.15° and the minimum is 14.84°, with a difference of 0.31°, while the maximum value of flow velocity uniformity is 66.28% and the minimum is 65.59%, with a difference of 0.69%. Thus, the changes are not significant. Considering the uniformity of flow velocity and average deviation angle at the inlet section of the water pump, the results show that when the total water intake of the pump station is 70 m3/s, the sixth group of combination schemes is selected; that is, the operating unit of the pump station and its corresponding working flows are 12.5 m3/s for Unit 1 and 11.5 m3/s for Units 2–6. This scenario achieves the minimum input power of the pump station and the maximum overall efficiency.
4.3. Total Water Inflow—60 m3/s
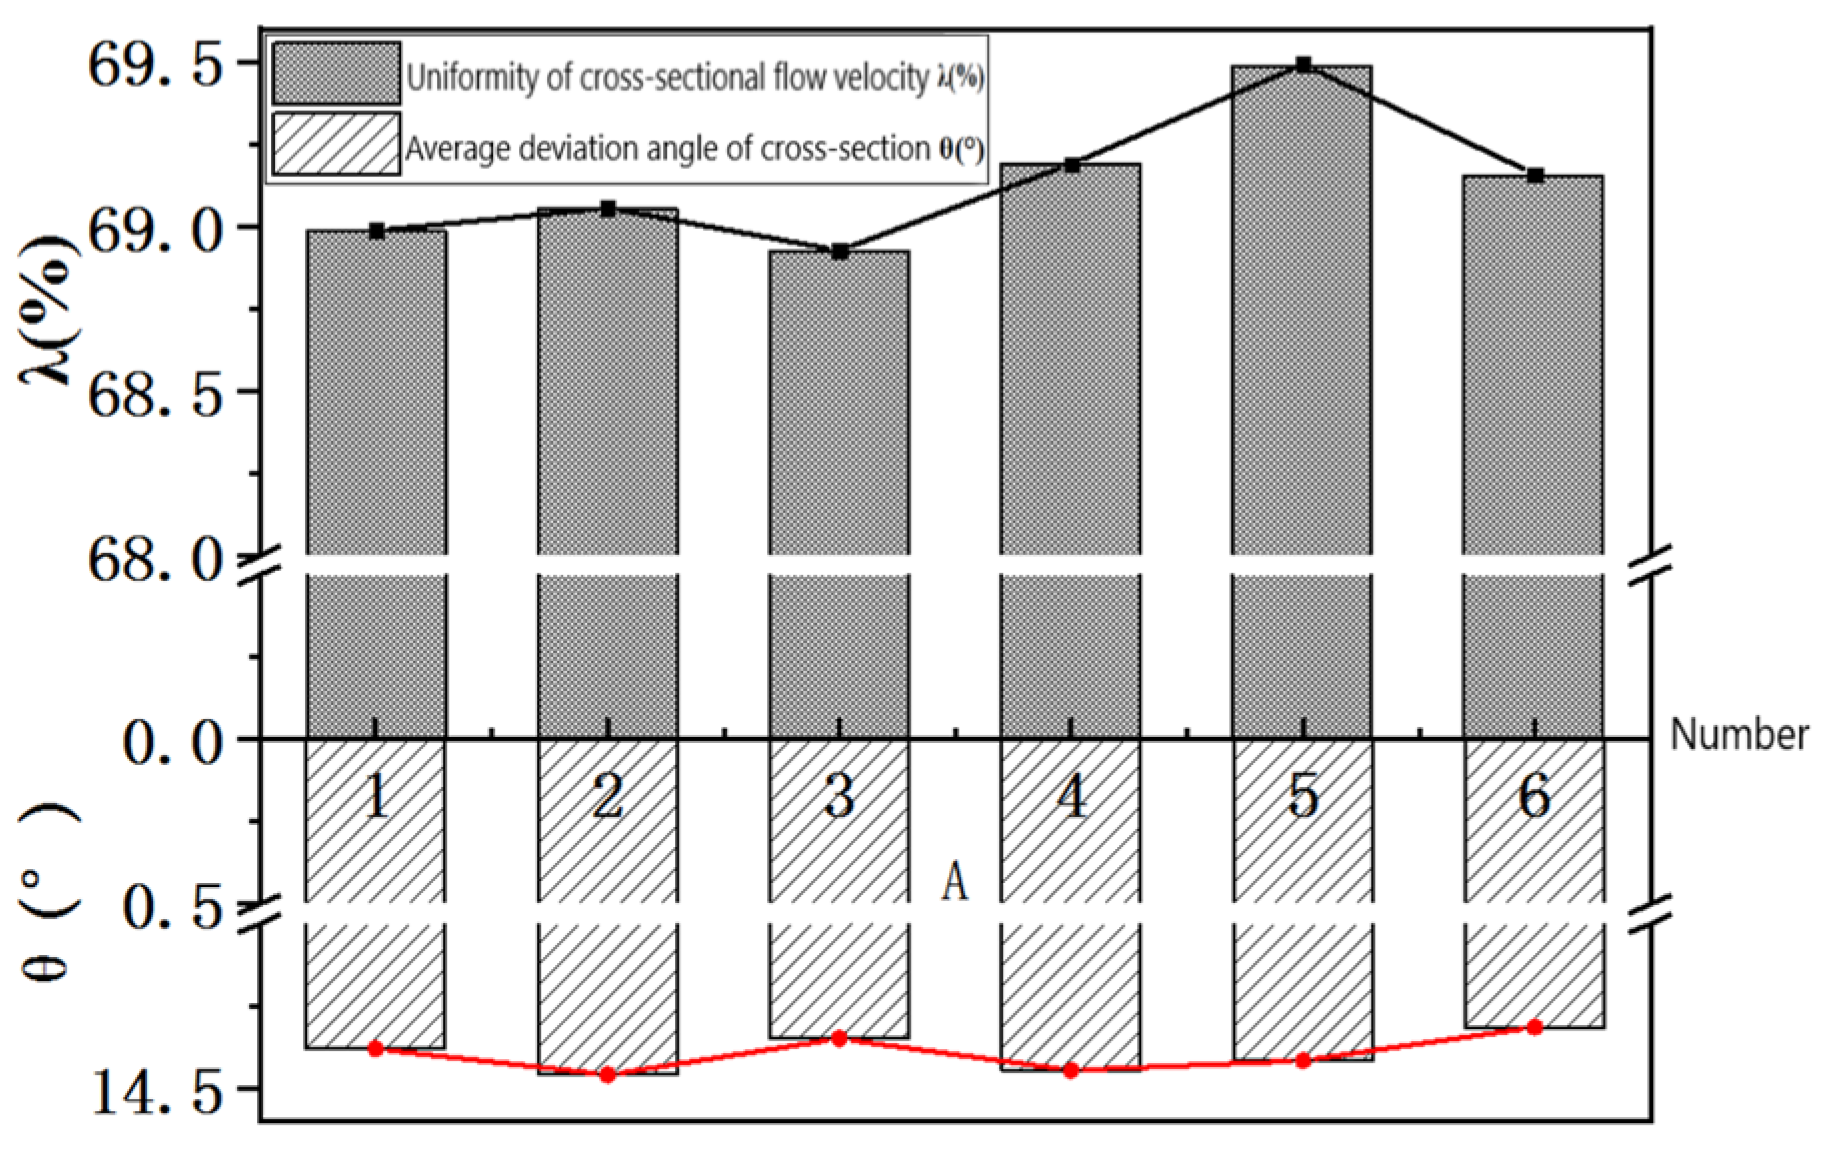
When the total water intake of the pump station is 60 m3/s, five units are started. The working flow rates of three units are 11.5 m3/s and of the other two are 12 m3/s. When one unit has a flow rate of 13.5 m3/s, the input power of the pump station is at minimum. With the aim to maximize the advantages of each operating unit, this study provides a full combination scheme for flow distribution with a diversion capacity of 60 m3/s. Table 5 shows a total of 20 combination schemes, which are used to determine the corresponding working flow rate of the operating unit under the premise of minimum input power and maximum pump station efficiency.
Table 5.
Full combination scheme with a total flow of 60 m3/s.
Figure 9 shows the calculation of the full combination scheme when the total water intake of the pump station is 60 m3/s. From the total diversion volume of the pump station at 70 m3/s, the difference between the maximum and minimum flow velocity uniformity values of the inflow index section decreases to 0.37%, while that between the maximum average deviation angle values of the index section increases to 0.52°. However, overall, these changes are not significant. Based on a comprehensive comparative analysis, the combination scheme of the 12th group is ultimately selected. The corresponding working flow rates for the operating units of the selected scheme are 11.5 m3/s for Units 1, 5, and 7; 13.5 m3/s for Unit 3; and 12 m3/s for Unit 4.
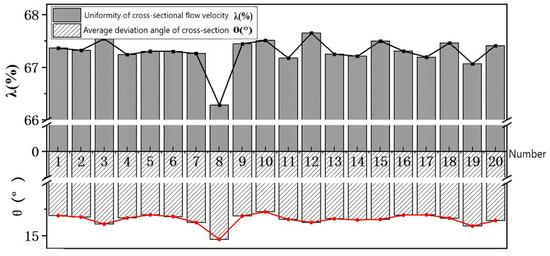
Figure 9.
Diagram of calculation results with a total flow of 60 m3/s.
4.4. Total Water Inflow—50 m3/s
According to the flow distribution results, when the total water intake of the pump station is 50 m3/s, the input power of the pump station is at minimum when four units are started and the operating flow rates of two units are each 11.5 m3/s and 13.5 m3/s. Priority must be given to starting units 1, 3, 5, and 7. The corresponding working flow of each operating unit is further explored under the premise of maximizing the overall efficiency of the pump station. Table 6 shows the full combination scheme for flow distribution at a diversion volume of 50 m3/s. Figure 10 shows the calculation results of different combinations of operating flow rates for each unit when the total water intake of the pump station is 50 m3/s.
Table 6.
Full combination scheme with a total flow of 50 m3/s.
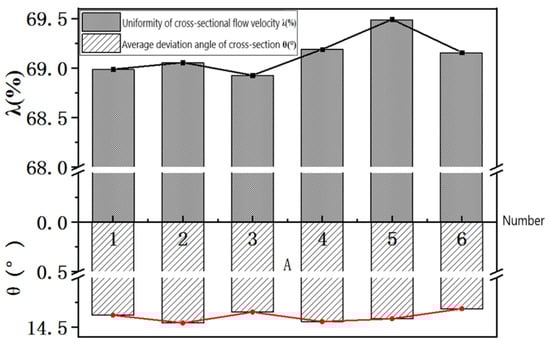
Figure 10.
Diagram of calculation result with a total flow of 50 m3/s.
Figure 10 shows that, under various operating conditions, the uniformity of flow velocity at the inlet section of the water pump is not significantly different from the average deviation angle, and the difference between the maximum and minimum values is less than 1%. In this case, the fifth combination is the best among the schemes and can provide better inlet conditions for the water pump unit. In terms of the average deviation angle of the cross-section, the sixth group of combination has the lowest value among the schemes, indicating that water can flow more vertically into the pump. Based on comprehensive considerations, the fifth combination scheme is selected to minimize the input power and optimize the overall efficiency of the pump station. When the water diversion volume of the pump station is 50 m3/s, units 1, 3, 5, and 7 are started, and their working flow rates are 13.5 m3/s, 11.5 m3/s, 11.5 m3/s, and 13.5 m3/s, respectively.
4.5. Total Water Inflow—40 m3/s
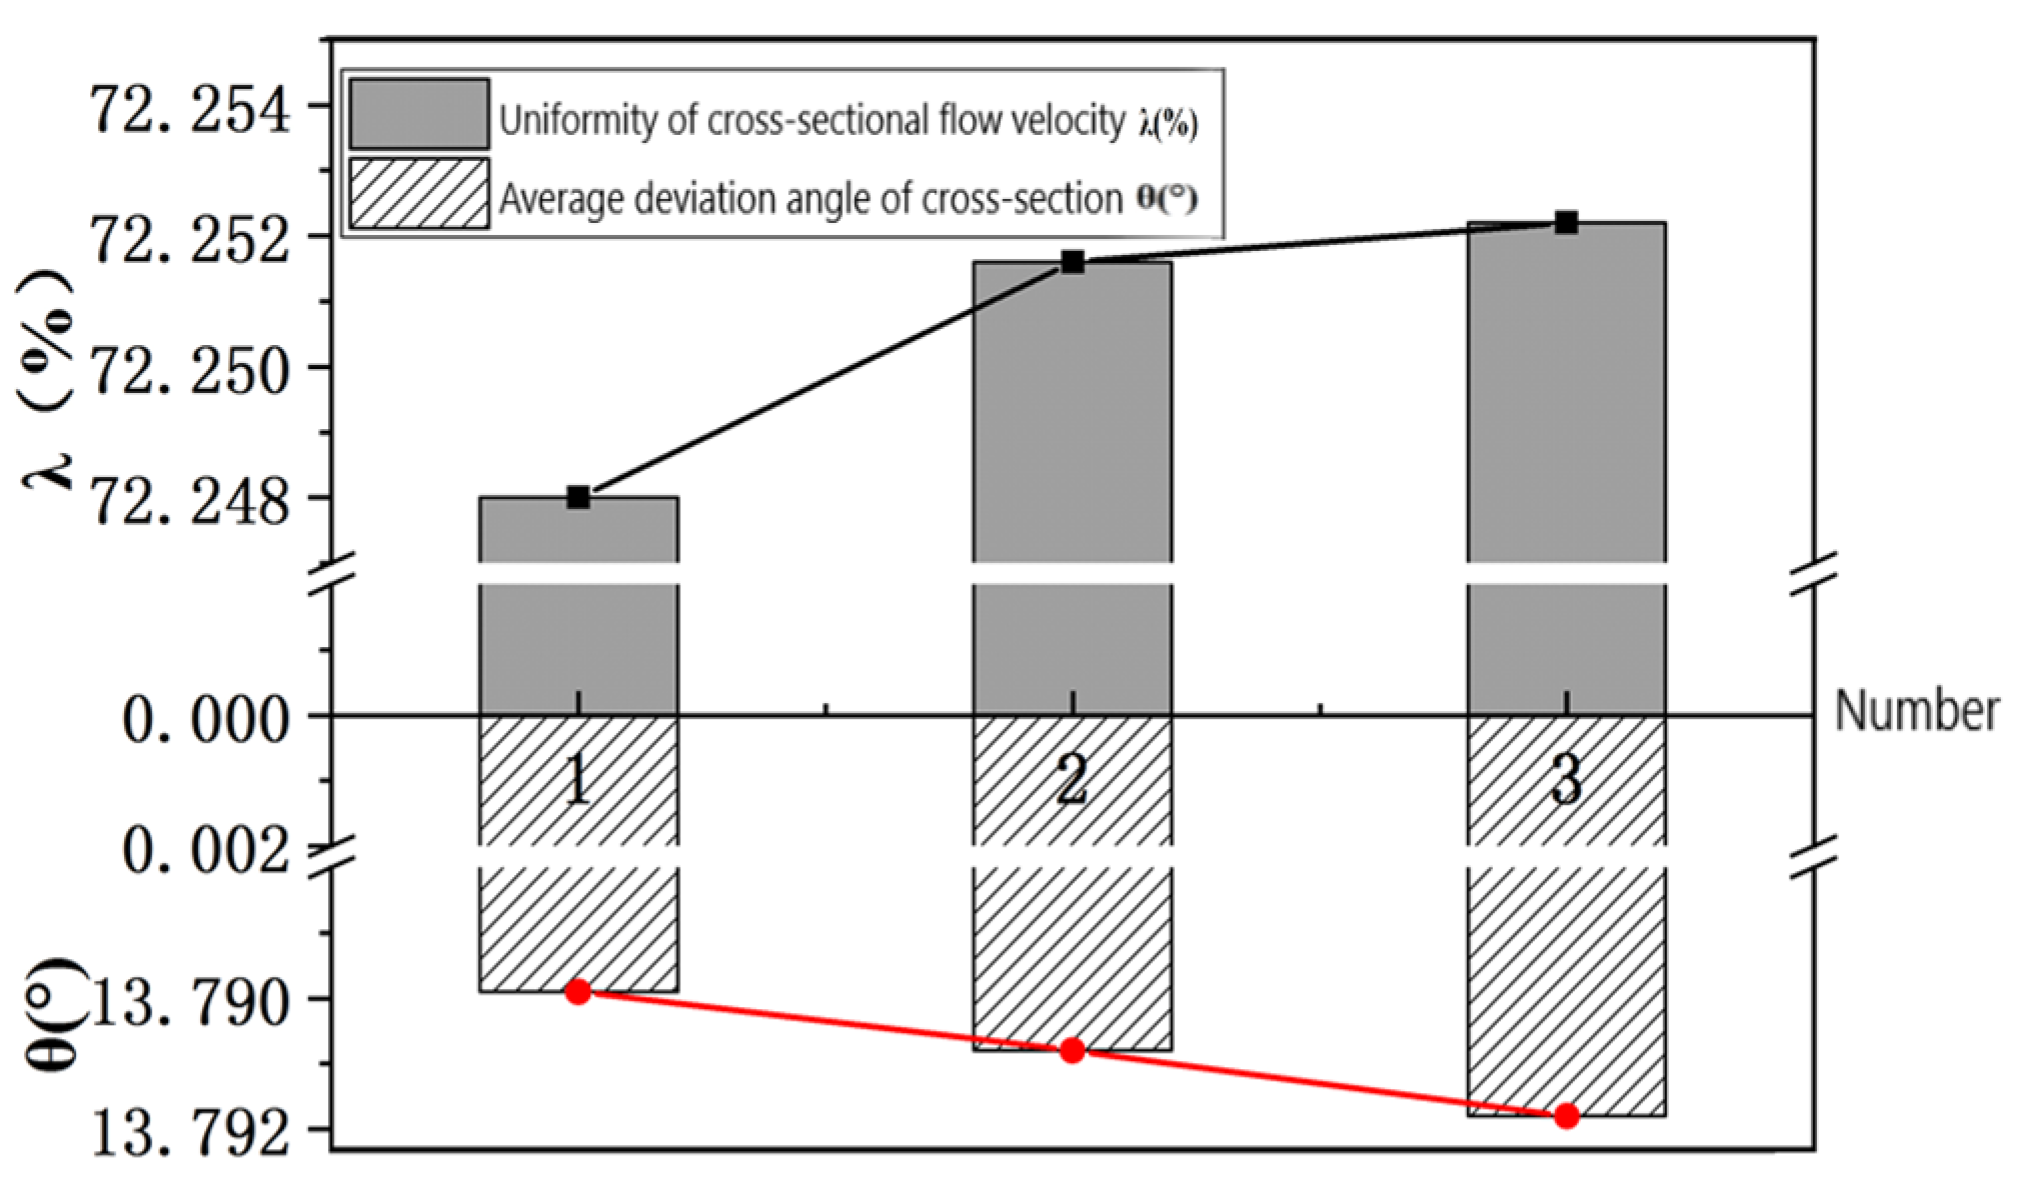
The flow distribution results show that, when the water intake of the pump station is 40 m3/s, the total input power of the pump station is at minimum when three units are started and the operating flow rates of the units are 13 m3/s, 13.5 m3/s, and 13.5 m3/s. The best efficiency is achieved, and priority is given to starting units 1, 3, and 5 respectively. Table 7 provides a complete combination scheme with a diversion capacity of 40 m3/s to determine the specific start-up unit number corresponding to the allocated flow.
Table 7.
Full combination scheme with a total flow of 40 m3/s.
Figure 11 shows the calculation results of the full combination scheme when the total water intake of the pump station is 40 m3/s. In this case, selecting the third combination results in the smallest input power and the best efficiency of the pump station among the schemes. The starting units are 1, 3, and 5, and the working flow rates are 13.5, 13.5, and 13 m3/s, respectively.

Figure 11.
Diagram of calculation result with a total flow of 40 m3/s.
Based on the results of optimizing the combination of units within the pump station, suggestions are provided for the regulation scheme of the system, as shown in Table 8.
Table 8.
Control scheme in the pump station system.
5. Conclusions
This study takes the pump station with seven water pump units as an example and combines the external characteristic curves of the units to establish a mathematical model with the objective function of minimizing input power. The regulation schemes of the pump station are examined under the constraints of flow and head. The specific conclusions are as follows:
- (1)
- Based on the external characteristic curve of the pump unit, under the premise of a certain total water intake of the pump station, with the goal of minimizing the input power of the pump station and the constraints of flow and head, a mathematical model for flow distribution in the pump station system was established. A genetic algorithm was used to optimize the number of operating units and flow distribution of the pump station under different water intake volumes. The flow optimization results indicate that, when there are multiple pump units operating in parallel in the pump station, the total input power of the pump station is the highest when the water intake is constant and the working head of each operating unit is within the operating area of the pump unit, and the working flow distribution of each operating unit in the pump station is the same. The greater the difference in the assigned working flow of each operating unit, the smaller the total input power of the pump station.
- (2)
- Based on the preliminary determination of the optimal pump station startup combination plan, combined with the optimal results of flow distribution, using the uniformity of flow velocity at the pump inlet section and the average deviation angle of the section as evaluation indicators, the optimal control plan for the pump station system was determined through the optimization combination of units in the station, under the premise of a certain total water diversion volume. When the total water intake is 70 m3, the working flow of Unit 1 is 12.5 m3/s and the working flow of Units 2–6 is 11.5 m3/s. When the total water intake is 60 m3, the working flow of Units 1, 5, and 7 is 11.5 m3/s; the working flow rate of Unit 3 is 13.5 m3/s; and the working flow rate of Unit 4 is 12 m3/s. When the total diversion volume is 50 m3, start Units 1, 3, 5, and 7, and the corresponding working flow rates are 13.5 m3/s, 11.5 m3/s, 11.5 m3/s, and 13.5 m3/s. When the total water intake is 40 m3/s, the starting units are Units 1, 3, and 5, and the corresponding working flow rates are 13.5 m3/s, 13.5 m3/s, and 13 m3/s. When these conditions are met, the pump station has the smallest input power and the best efficiency under the corresponding operating conditions.
- (3)
- This study has a good guiding effect on the operation of pumping stations, providing a reference for the same type of pumping station based on a genetic algorithm for starting combination and flow distribution methods. It can determine the number of starting units with the entire operating cost of the pumping station as the target, and enable the pumping station to achieve the goal of minimizing energy efficiency and maximizing benefits, creating economic and social benefits to the greatest extent.
Author Contributions
Y.Z. and P.Z. carried out the construction of the optimization system, numerical simulations, and data analysis. Y.P. and H.L. conducted the experiment and wrote the first draft of the manuscript. X.Z. and P.Z. conceived and supervised the study and edited the manuscript. Y.Z. and X.Z. edited the manuscript. All authors have read and agreed to the published version of the manuscript.
Funding
This work was supported by the Joint Foundation of Shaanxi (Grant No. 2019JLP-25).
Institutional Review Board Statement
Not applicable.
Data Availability Statement
Not applicable.
Conflicts of Interest
The authors declare no conflict of interest.
References
- Liu, C. Water Pumps and Pumping Stations; China Water Resources and Hydropower Publishing House: Beijing, China, 2009. [Google Scholar]
- Yu, F.; Chen, J. Research on the Optimal Operation Plan of Large Pump Stations. Water Pump Technol. 2002, 1225, 38–41. [Google Scholar]
- Wu, Z.; Boulos, P.; Schaetzen, W.D.; Orr, G.-H.; de Schaetzen, W.; Moore, M. Using Genetic Algorithms for Water Distribution System Optimization. In Proceedings of the World Water and Environmental Resources Congress, Orlando, FL, USA, 20–24 May 2001; pp. 1–8. [Google Scholar]
- Nace, D.; Demotier, S.; Carlier, J.; Daguinos, T.; Kora, R. Using Linear Programming Methods for Optimizing the Real-Time Pump Scheduling. In Proceedings of the World Water and Environmental Resources Congress, Portland, OR, USA, 1–5 June 2014; pp. 1–8. [Google Scholar]
- Pasha, M.F.K.; Lansey, K. Strategies to Develop Warm Solutions for Real-Time Pump Scheduling for Water Distribution Systems. Water Resour. Manag. 2014, 28, 3975–3987. [Google Scholar] [CrossRef]
- Zhuan, X.; Xia, X. Development of Efficient Model Predictive Control Strategy for Cost-Optimal Operation of a Water Pumping Station. IEEE Trans. Control. Syst. Technol. 2013, 21, 1449–1454. [Google Scholar] [CrossRef]
- Zhou, L. Optimization of pump station operation with multiple parallel pump units. J. Irrig. Drain. 2014, 33, 96–99. [Google Scholar]
- Vieira, F.; Ramos, H.M. Optimization of operational planning for wind/hydro hybrid water supply systems. Renew. Energy 2009, 34, 928–936. [Google Scholar] [CrossRef]
- Fernández García, J.A.; Rodríguez Díaz, E.; Camacho Poyato, E.; Montesinos, P. Optimal Operation of Pressurized Irrigation Networks with Several Supply Sources. Water Resour. Manag. 2013, 27, 2855–2869. [Google Scholar] [CrossRef]
- Chen, W.; Tao, T.; Zhou, A.; Zhang, L.; Liao, L.; Wu, X.; Yang, K.; Li, C.; Zhang, T.C.; Li, Z. Genetic optimization toward operation of water intake-supply pump stations system. J. Clean. Prod. 2021, 279, 123573. [Google Scholar] [CrossRef]
- Olszewski, P. Genetic optimization and experimental verification of complex parallel pumping station with centrifugal pumps. Appl. Energy 2016, 178, 527–539. [Google Scholar] [CrossRef]
- Edson Costa, B.; Roberto, A.A.; Augusto, N.C.V. Optimization of parallel variable-speed-driven centrifugal pumps operation. Energy Effic. 2008, 1, 167–173. [Google Scholar]
- Xiao, R.F.; Gong, S.W.; Zhou, Y.G.; Zhang, B.; Wu, R. Research on Optimization of Unit Operation Combination in Pumping Station. Rural. Water Conserv. Hydropower China 2020, 12, 164–166+171. [Google Scholar]
- Han, X.W.; Liu, Y.; Meng, J.B.; Tu, X.G. Research on Optimal Operation of Large Pumping Station’s Inlet Reservoir Based on Analysis of Flow Channel Inflow Index. Rural. Water Conserv. Hydropower China 2019, 2, 177–181+186. [Google Scholar]
- He, Y.; Pan, Z.J.; Yu, H.; Qiu, S.Y. Combinatorial optimization of unit startup under complex flow regime of inlet forebay of large pump station. Water Conserv. Hydropower Technol. 2016, 47, 69–74. [Google Scholar]
- Bagirov, A.M.; Barton, A.F.; Mala-Jetmarova, H.; Nuaimat, A.A.L.; Ahmed, S.T.; Sultanova, N.; Yearwood, J. An algorithm for minimization of pumping costs in water distribution systems using a novel approach to pump scheduling. Math. Comput. Model. 2013, 57, 873–886. [Google Scholar] [CrossRef]
- Hu, S.; Jia, X.; Gao, H. Optimization of the Number of Multiple Pumps Running Simultaneously in Open Cycle Cooling Water System in Power Plant. Energy Procedia 2012, 17, 1161–1168. [Google Scholar]

Disclaimer/Publisher’s Note: The statements, opinions and data contained in all publications are solely those of the individual author(s) and contributor(s) and not of MDPI and/or the editor(s). MDPI and/or the editor(s) disclaim responsibility for any injury to people or property resulting from any ideas, methods, instructions or products referred to in the content. |
© 2023 by the authors. Licensee MDPI, Basel, Switzerland. This article is an open access article distributed under the terms and conditions of the Creative Commons Attribution (CC BY) license (https://creativecommons.org/licenses/by/4.0/).