Article

Cyclist Injuries from Tram Track Incidents: A Retrospective 10-Year Analysis

1
Department of Orthopaedics and Traumatology, Medical University of Innsbruck, Anichstrasse 35, 6020 Innsbruck, Austria
2
Department of Pediatrics, Garmisch-Partenkirchen Hospital, Auenstraße 6, 82467 Garmisch-Partenkirchen, Germany
3
Medical University of Innsbruck, Christoph-Probst-Platz, Innrain 52, 6020 Innsbruck, Austria
4
Department for Orthopaedic Sports Medicine, Klinikum Rechts der Isar, Technical University of Munich, Ismaninger Str. 22, 81675 Munich, Germany
*
Author to whom correspondence should be addressed.
Appl. Sci. 2023, 13(21), 11861; https://doi.org/10.3390/app132111861
Submission received: 25 September 2023 / Revised: 23 October 2023 / Accepted: 25 October 2023 / Published: 30 October 2023
(This article belongs to the Special Issue Sports Injuries and Physical Rehabilitation)

Abstract

:
Trams are widely used for urban public transportation. The aim of this study was to identify the total number of accidents and common injury patterns of tram-system-related cycling injuries. All patients attending the traumatology emergency department of University Hospital of Innsbruck between January 2010 and December 2019 due to tram-track-related bike crashes were identified. Patient demographics; date, time, and mechanism of the accident; type of injury; exact diagnosis and subsequent treatment; as well as direct treatment costs were evaluated and analyzed. A total of 378 patients (56.1% female; mean age: 38.4 years) were identified. Bike tire wedging was the most frequent accident mechanism (95.2%). A total of 108 patients (28.7%) sustained a total number of 135 fractures, predominately of the upper limb. Twenty-six patients (7.0%) required surgical treatment. No patient in this collective died as a result of the injuries sustained in the accident. During the time of this analysis, the city government implemented several measures to increase cyclists’ safety. For the main injury site, a sharp reduction in injuries was observed. Urban tram tracks are a significant risk factor for cycling-related injuries. Injuries might be reduced with the implementation of cyclist-friendly safety measures.

1. Introduction

In urban traffic, there is often a large number of mutual road users side by side. Trams are getting increasingly popular and are nowadays widely used for local public transport, particularly in large cities. With the expansion of the corresponding urban infrastructure (amongst others, an enlargement of the tram track network), an increase in tram-related injuries was observed. Besides pedestrians and motorists, Cameron et al. [1] found cyclists to be the group most at risk, often sustaining serious injuries. Injuries may result from a direct collision with road users or due to ‘non-collision incidents’, like technical bicycle defects, falls because of bad road conditions, and others.
Schepers et al. showed that most fatal injuries among cyclists were due to bicycle crashes with motor vehicles caused by direct collisions. Most accidents with consequent admittance to a hospital or treatment at an emergency department, however, were isolated bicycle crashes without any external force or third-party involvement [2].
Primary research on tram-system-related cycling injuries is commonly either based on local government or police data or on hospital data. It can be assumed that severe injuries are commonly included in both police and hospital data. Minor injuries or injuries resulting from isolated bicycle crashes without a third-party involvement might not be reported to police authorities, but still require hospital attendance. Juhra et al. [3] showed that the actual number of bicycle accidents was nearly twice as high as the officially reported number. Most patients (67.9%) who were admitted to an emergency care unit did not have a police record.
Tram-system-related cycling injuries have previously been distinguished according to the underlying injury mechanism. The most common accident mechanism has been described as one of the bicycle wheels getting trapped or wedged in the on-road rail flangeway (the visible track groove), causing the cyclist to fall [4,5,6]. Sliding on the tram track surface has also been mentioned as a relevant injury mechanism [4]. The literature is scarce on these described injury mechanisms and cyclist safety. Figure 1 illustrates a potential risk situation for cyclists. The cycler must either ride on the right side of the tram tracks with a very narrow space towards the curb of the sidewalk and the tram stop visible in the distance or the cycler must cross one tram track line and ride between both lines. Both possibilities have a certain risk to crash wedging or slipping on the tram track.
The aim of the present study was to assess common patient demographics, injury patterns, treatment costs, hot spots, and safety measure implementations in detail of tram-track-related cycling injuries. Being aware of the findings, future work and safety precautions can potentially reduce the risk of injury for cyclists in urban traffic.

2. Materials and Methods

2.1. Study Design

A retrospective review was conducted of all inpatient and outpatient cases of patients who had sustained a bicycle accident related to tram tracks and visited our local emergency department between January 2010 and December 2019. All relevant patients were identified and if consistent with the inclusion criteria were included in this retrospective study.

2.2. Participants

Only those patients were included whose injury was directly caused by the cyclist getting caught in or slipping on tram tracks. Data were extracted from our in-hospital patient management system, including imaging studies and surgery protocols including patient demographics, injury date, injury time and mechanism of the accident, type of injury/exact diagnosis, and subsequent treatment.

2.3. Outcomes

2.3.1. Injuries

All included sustained injuries were divided into four groups for a more concise presentation: group I included all patients with small soft tissue injuries, e.g., wounds, bruises, sprains, or strains; group II included patients with substantial soft tissue injuries, like ruptured tendons or ligaments or joint dislocations; all fractures were included in group III, while patients with a severe injury to the head were included in group IV. If patients were in-between groups, the higher grading was chosen, e.g., if a patient showed a broken bone and symptoms of a concussion, they were assigned to group IV. Dislocated fractures and ligament/bone avulsions were assigned to group III (fractures).

2.3.2. Risk Factors and Circumstances of Injury

Individual personal risk factors were assessed if documented, in particular, the wearing of a helmet and alcohol consumption prior to the accident. Toxicological analyses were not performed in a standardized manner, but exclusively in the form of a medical case-by-case decision.
Furthermore, local weather and lighting conditions during the time of the accident were assessed using the website http://www.timeanddate.de/, accessed on 15 November 2020.
On-site observations were made to document the characteristics of the most frequent accident localizations and to view the track infrastructure. The width of the tracks was also measured at the most frequent localizations. The evaluation of the injury locations showed a pronounced accumulation of injuries in the area of one of the city’s central streets. With regard to this hotspot, an inquiry was made to the city authorities on the prevention and construction measures carried out during the observed time period.

2.3.3. Cost of Injury

Direct hospital costs of the injured patients were estimated with the help of our in-hospital finance office. The average cost of a treatment for these patients in 2018 was determined, both outpatient and inpatient costs, and multiplied by the total number of outpatients or inpatients to calculate a total direct treatment cost.

2.4. Statistical Analysis

Data evaluation was performed using Microsoft® Excel® (Version 2007, Microsoft, Redmond, WA, USA) and SPSS® (IBM Statistics, v. 26; IBM Corp, Armonk, NY, USA) and presented using descriptive statistics (mean values, percentages). The distribution of categorical variables is presented with the absolute numbers and the relative number as a percentage.

3. Results

Between January 2010 and December 2019, a total of 1429 patients reported tram-related injuries; 378 met the inclusion criteria (injury due to tram tracks) and were included in the study. The mean age was 38.4 years (SD: 16.5 y). A total of 166 patients were male; 212 were female. Detailed patient characteristics are presented in Table 1. Table 2 shows the injury frequency per year.

3.1. Injuries

A total of 108 patients (29%) sustained a total number of 135 fractures, with upper limb fractures accounting for nearly two thirds of the cases (64%). In total, 24 patients (6%) sustained a total number of 31 ruptured tendons or ligaments, with possible joint dislocations. These injuries mainly affected the lower limb. A list of injuries for group II and III sorted by the anatomical region is presented in Table 3 and Table 4.
In total, 38 patients (10%) were admitted to the hospital, and 26 patients (7%) required surgery at least once, most of them due to injuries to the extremities. A list of the actual diagnoses and the absolute and relative number of injuries in relation to the main injury site can be found in the Appendix A.
All together, 32 surgeries were subsequently performed, 17 of which were osteosynthesis procedures. In total, 235 patients (63%) suffered bruises, sprains and strains, or other soft tissue injuries. Nine traumatic brain injuries (TBI) were recorded, predominantly sustained by male patients (n = 8; 89%). Only for one of these nine patients was helmet usage documented. No patient in this collective died as a result of the injuries sustained from the accident.

3.2. Risk Factors and Circumstances of Injury

In total, 300 accidents (79%) happened during daylight, 29 (8%) at dawn/dusk, and 47 (12%) at night. In total, 64 injured patients (17%) reported to have been commuting to or from work at the time of the accident.
Tire wedging was the most frequent accident mechanism (n = 360; 95%), whereas in 5% of the cases (n = 18), tires slipping or sliding on the rail surface was reported. At each of the most frequent injury localizations, a cavity of 37 mm was measured on all tram tracks. Detailed weather and lighting conditions are presented in Table 5. The distribution throughout the year showed a similar injury count in the period between April and December (Figure 2).

3.3. Cost of Injury

The estimated direct treatment costs were EUR 361.000 in total, and, respectively, EUR 955.03 per injured patient. The indirect costs (e.g., due to the loss of working hours) could not be calculated because the average time loss of work hours for the respective patient and diagnosis could not be determined.

4. Discussion

The most important finding of this study was that wedging of bike tires in tram tracks is a frequent injury mechanism, mainly causing fractures of the upper extremity. The risk of falls and the associated risk of injury to cyclists must be taken into account by urban traffic planners. To the best of our knowledge, this report on tram-related bicycle injuries has the largest patient sample size and longest study period so far studied.

4.1. Injuries

In accordance with previous literature [1,3,4], fractures to the upper limb are the most common severe type of injury sustained by patients involved in bicycle-related tram track accidents. During wedging, bikers either fall and try to protect themselves by intercepting the fall with the arm, which can lead to fractures of the upper extremity, or they try to intercept the fall with the lower extremity, trying not to fall but potentially leading to distorsions of the ankle and knee joint. The reason that elderly patients in our cohort were more likely to have upper extremity fractures than lower extremity sprains might be a result of poorer bone health and possibly a slower reaction time, leading to falls on the upper extremity rather than decelerating with the lower extremity. However, it should also be briefly mentioned that most of the injuries were not dangerous—bruises and other minor lesions—but a percentage of 10% still required hospitalization and/or even surgery.

4.2. Risk Factors and Circumstances of Injury

The lowest number of injuries was found in the months of January and February, while most injuries happened between July and October. This might be best explained with a higher total number of cyclists during the summer months, despite possibly worse road conditions in the winter months. Similarly, Juhra et al. [3] reported a high count of overall cycling accidents in the summertime with a steady decrease towards the winter months but a further peak in December. Similar to the present data in this study, this peak value might also be explained with the weather and consequent road conditions, but possibly also with the frequent celebrations during this month, which may be related to higher alcohol consumption as reported by Juhra et al. [3].
Alcohol consumption has been previously described as a risk factor for overall cycling, and specifically tram-system-related cycling injuries [1,3]. In our department, alcohol consumption is not routinely tested in bicycle accidents and was therefore not included in the analysis.

4.3. Cost of Injury

The estimated direct treatment costs in this study were EUR 361.000 in total, and, respectively, EUR 955.03 per injured patient.
Similarly, Aertsens et al. [7] analyzed the economic costs of 118 minor bicycle accidents, excluding accidents resulting in death or hospital visits lasting more than 24 h, and calculated an average total cost of EUR 841 per accident or EUR 0.125 per kilometer traveled. Considering that the observed cohort in this study includes hospitalized patients with potentially more severe injuries, the total cost of injuries potentially could be substantially higher.

4.4. Preventing Injury

Given the overall high incidence rates, some of which continue to increase, several authors have discussed ways to prevent injury and prevent this mechanism of injury in particular. Teschke et al. [5] compared bicycle crashes directly involving tram tracks to crashes in other circumstances and found track crashes to be more common on highly frequented streets with parked cars and no bike infrastructure. In addition, Teschke et al. [5] discussed modifying standard tire width in order to prevent tire wedging and suggested separate lanes for public transportation and cyclists. The width of the tram tracks is around 37 mm in our city. Thicker tires might prevent wedging because they would not fit into the tracks while thinner tires could easily get into the tracks and lead to a fall. Moreover, thinner tires show less grip to the surface than thicker ones, which may potentially also be a reason for easier slippage inside the tracks.
Bike helmets have repeatedly been mentioned as an effective measure to reduce incidence and severity of traumatic brain injuries [6,7,8,9]. Although all cyclists are advised to wear a helmet to reduce the risk of brain injury, this is far from being widely implemented, and cyclists without helmets are still frequently seen. It should be noted that in Austria, there is no legal obligation to wear a bicycle helmet for persons over the age of twelve. In our cohort, helmet usage was reported only for one of the nine patients with a diagnosed traumatic brain injury. This might have been the real count, or the consequence of incomplete documentation of patient history or more difficult data collection in patients with traumatic brain injury and possibly impaired vigilance.
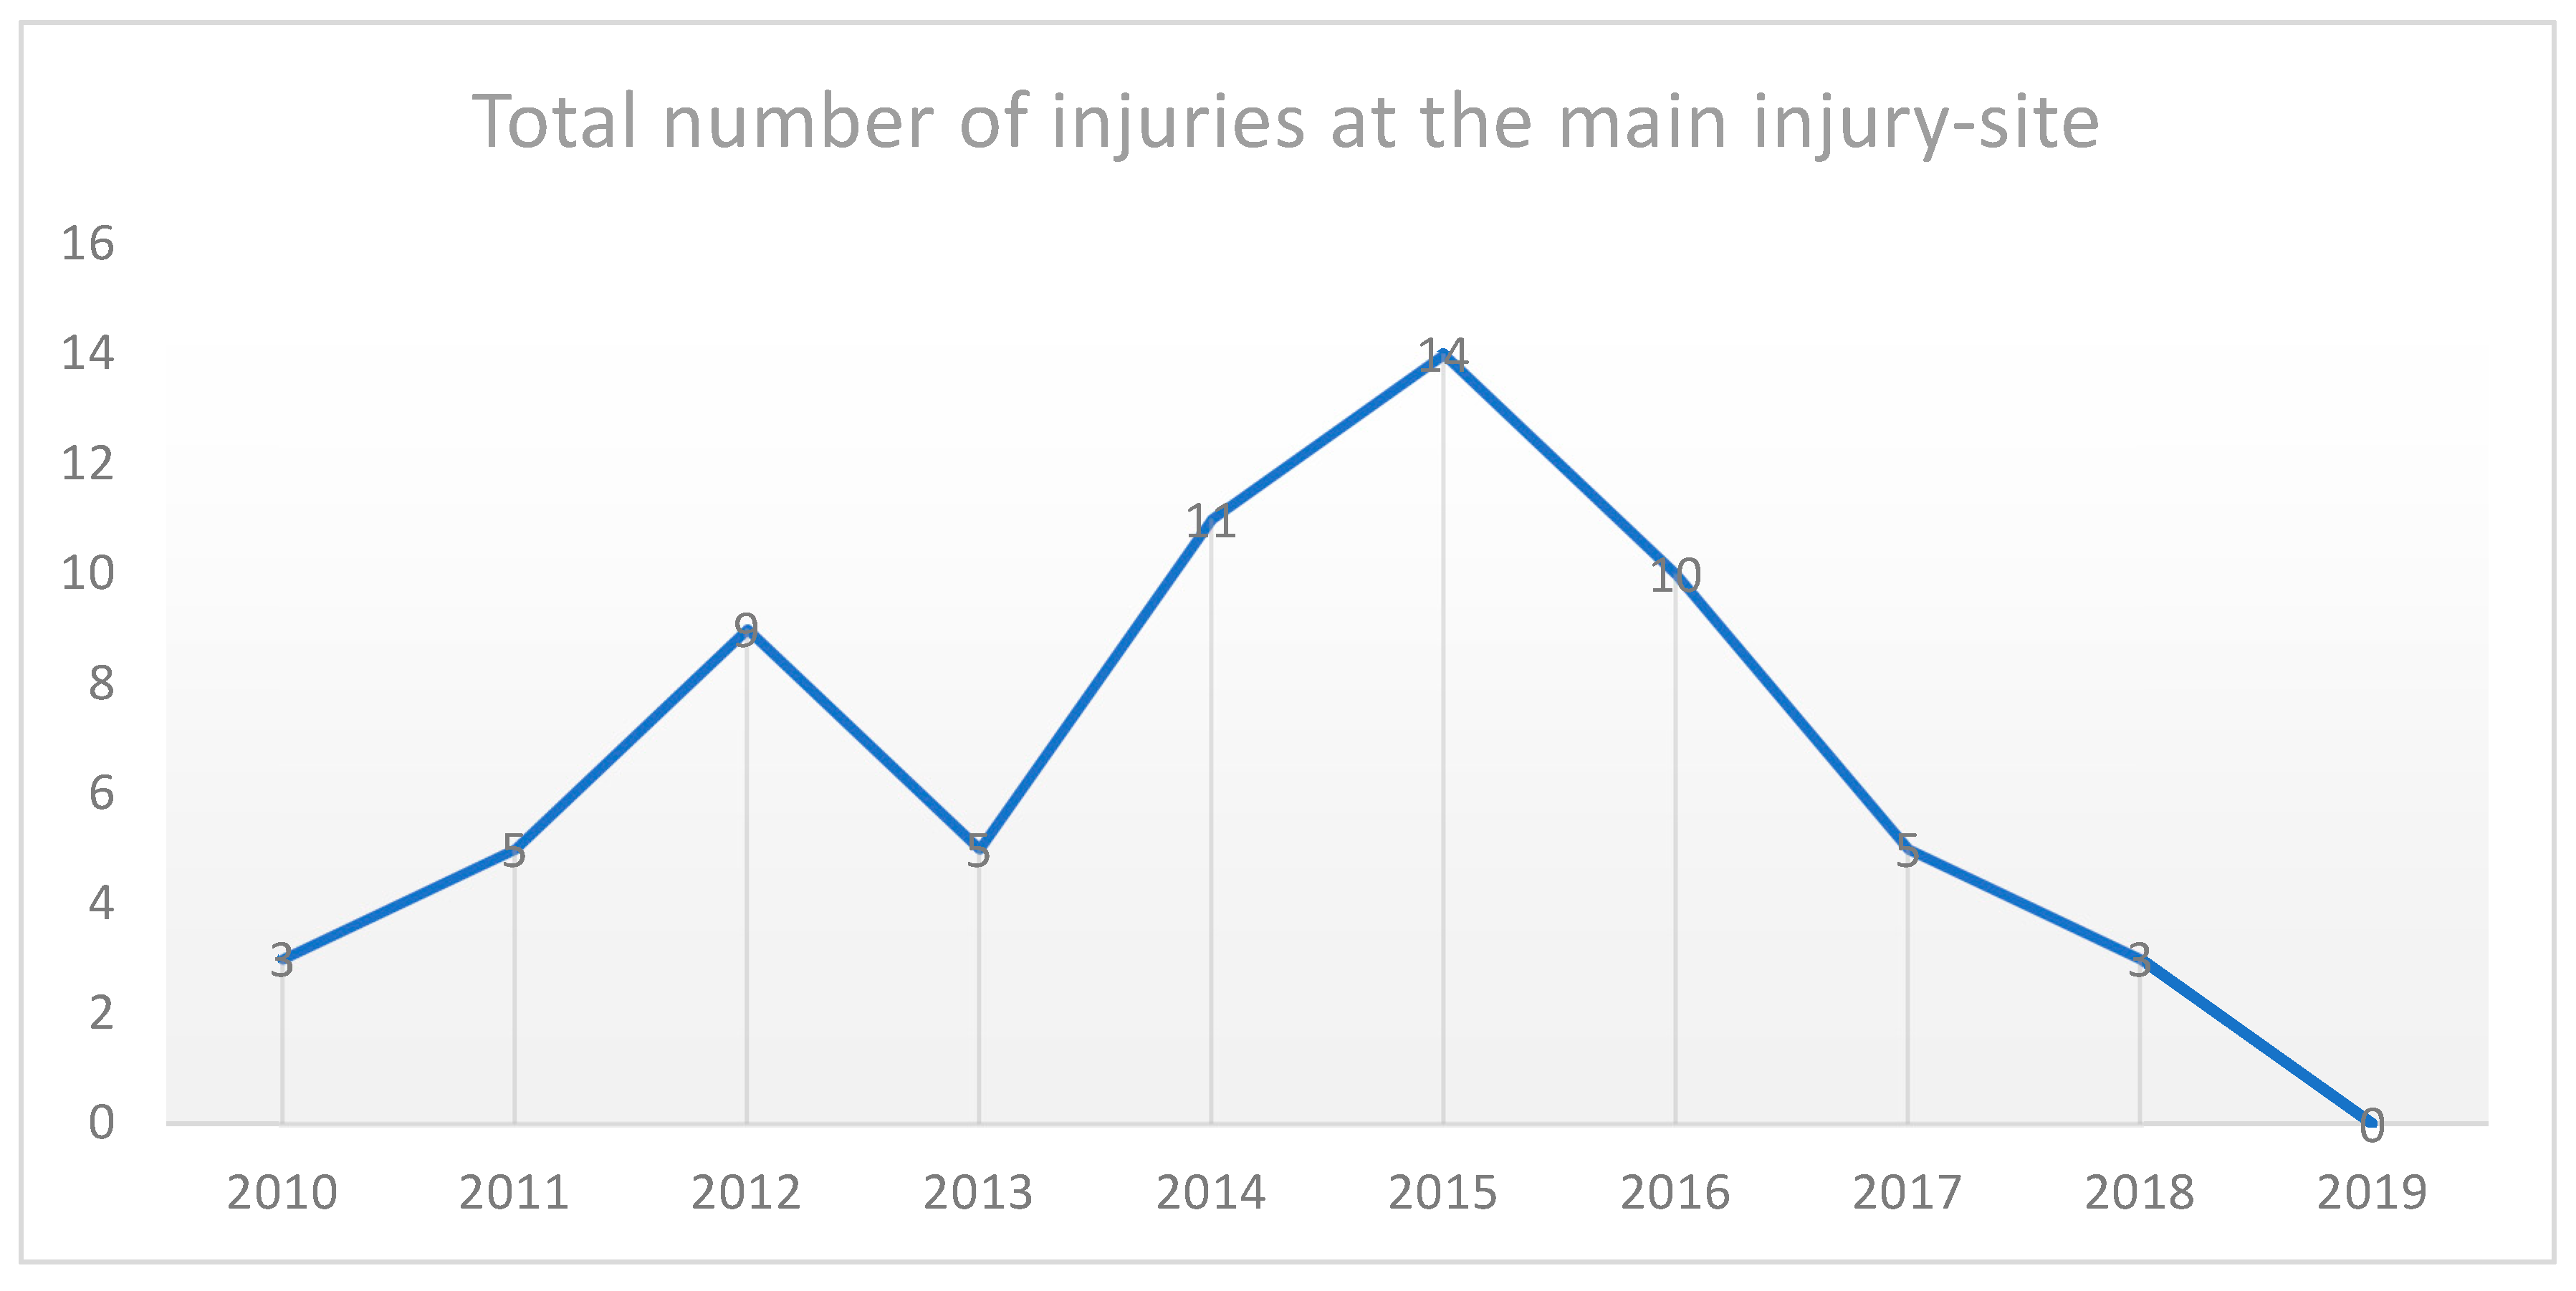
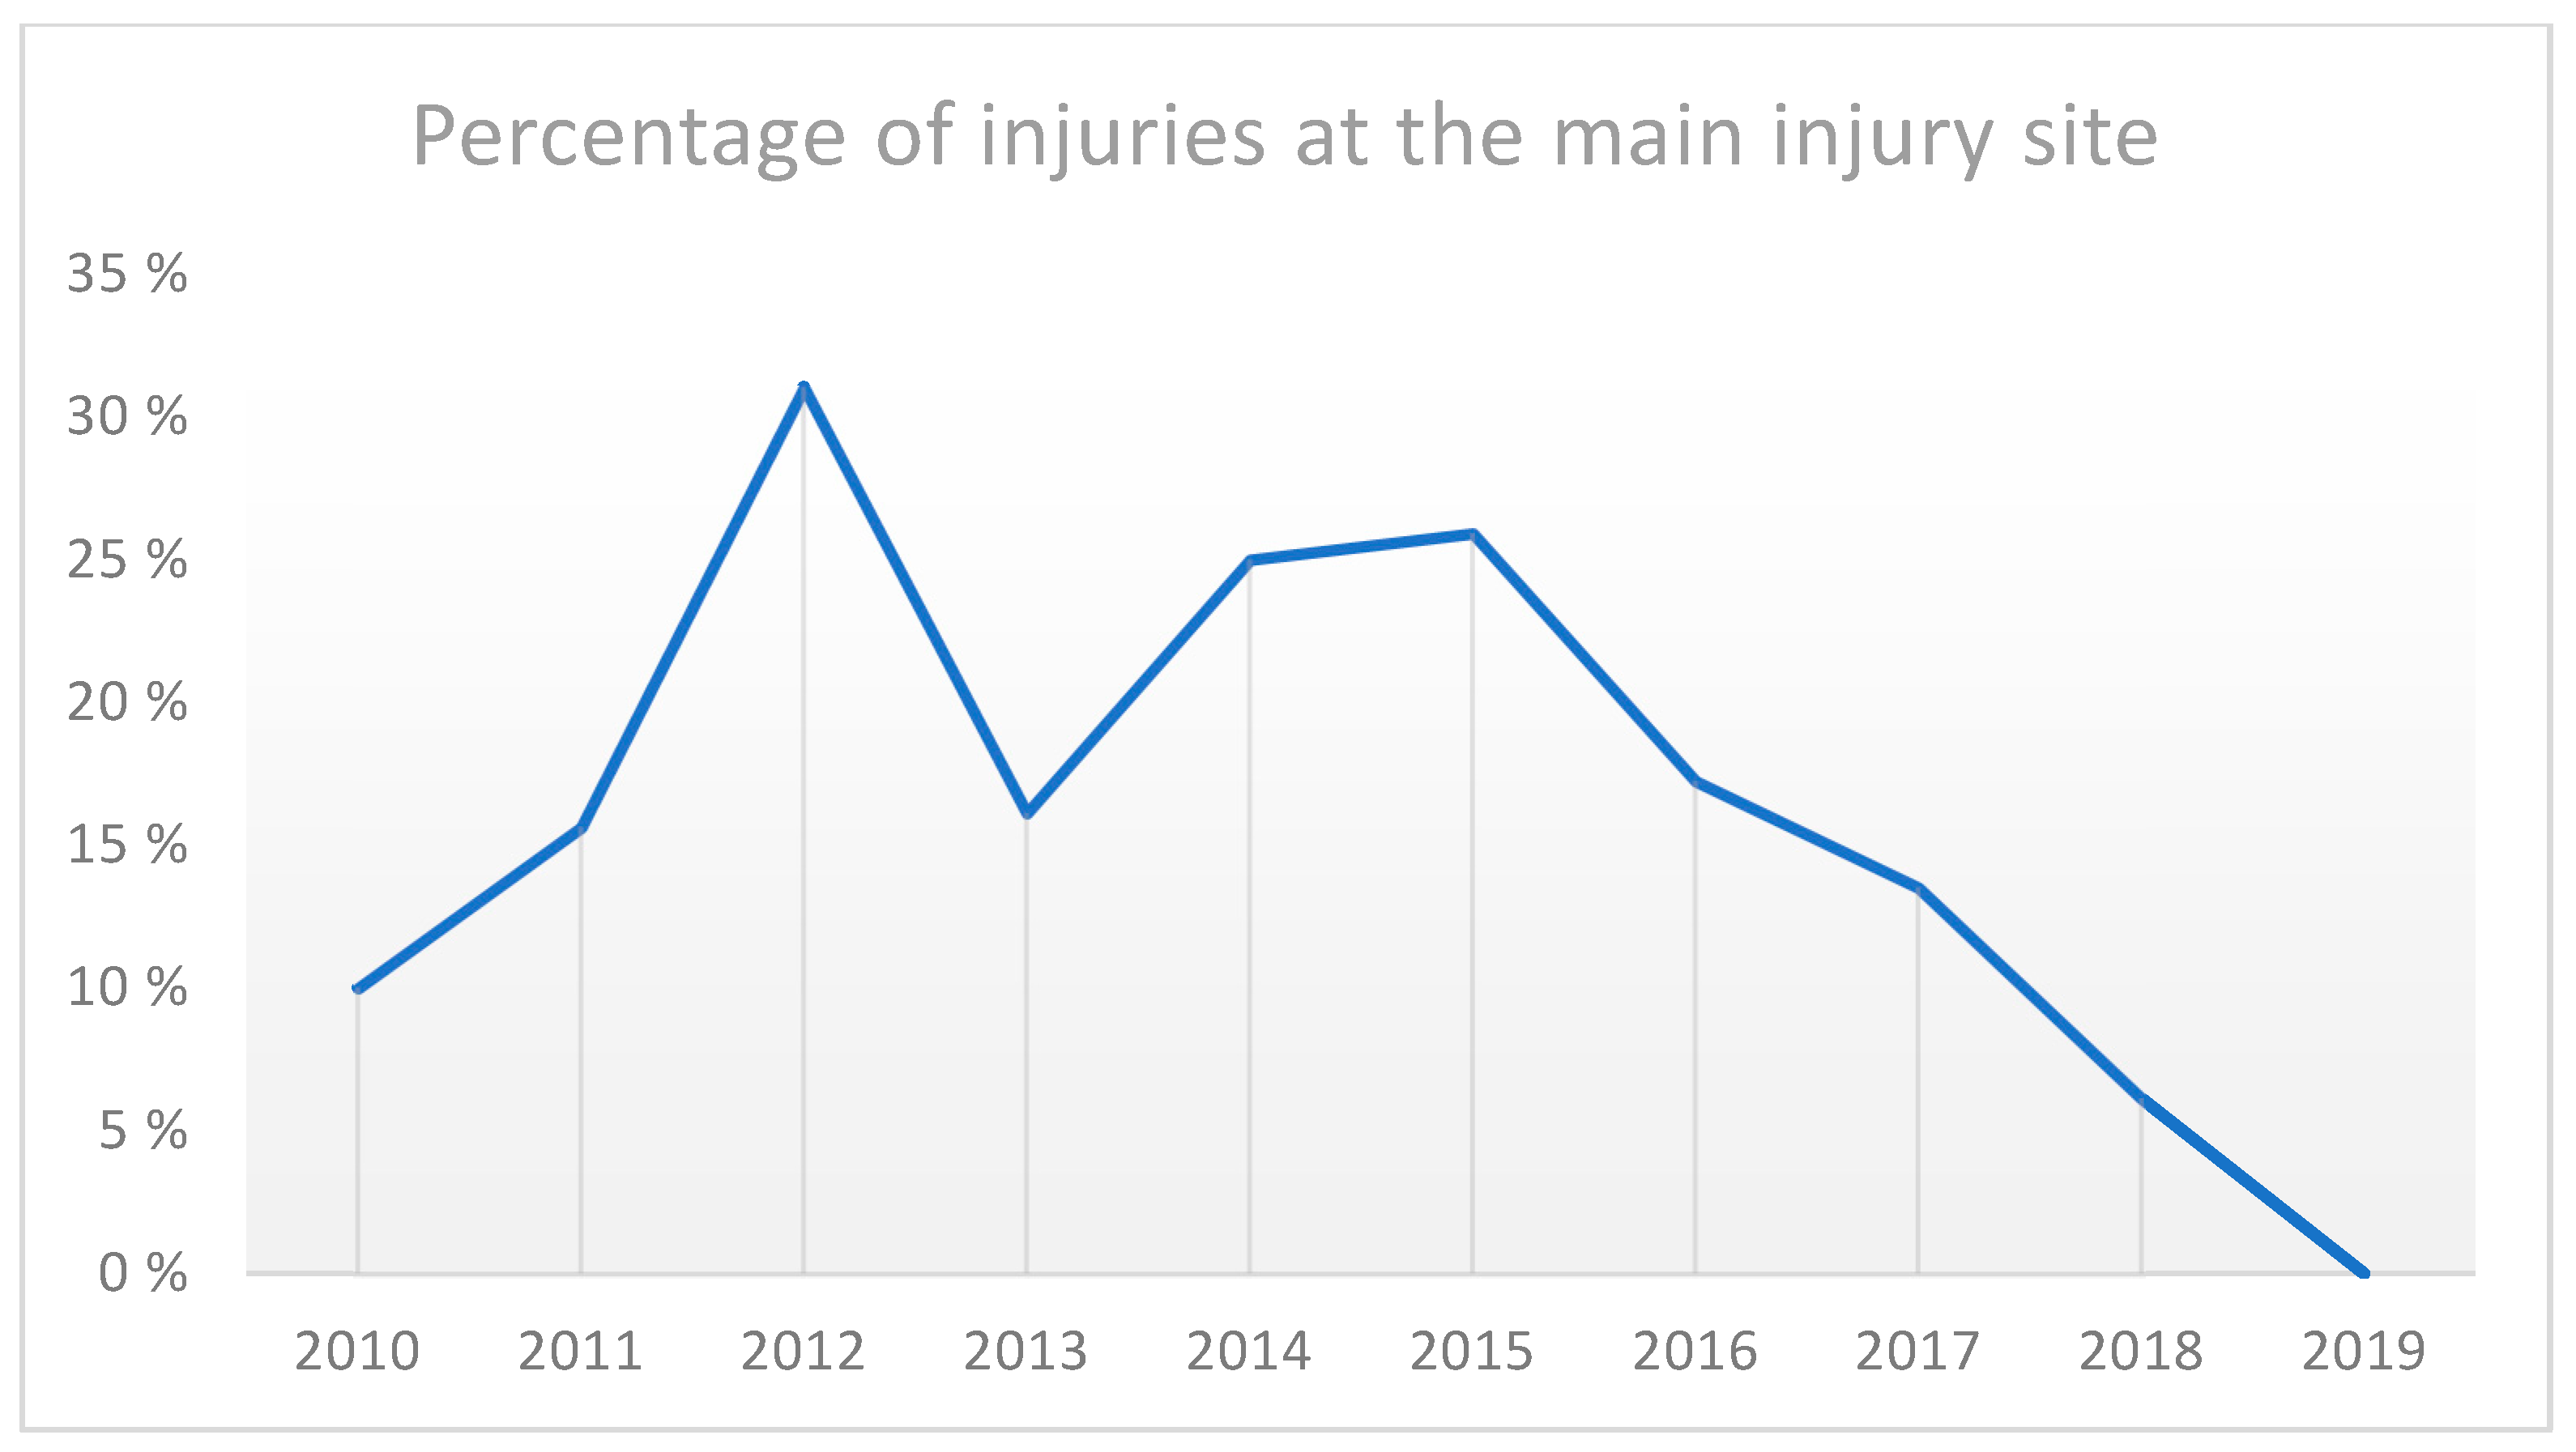
Across the entire 10-year period, about one sixth (17%), even a quarter of the cases in some years, were related to the most common injury site in the inner city. Throughout this 10-year study period, the city government implemented several measurements to the most frequented traffic hubs to increase cyclists’ safety. A taxi waiting area along a highly frequented road was removed at the most common injury site and replaced with a non-road bike lane in November 2018. Furthermore, so-called “sharrows” were introduced to indicate to cyclists the preferred bike lane in order to decrease the risk of accidents with suddenly opened car doors or entrapments between parked cars or pedestrian walkways. Figure 3 shows the separation of bike and tram routes at one main injury site.
Besides physical protective equipment and separation of traffic with ideally dedicated bicycle lanes, public awareness of common injury mechanisms and hazards related to trams was reported to decrease the injury incidence [1,10,11,12,13,14]. Cameron et al. [1] reported a sharp decrease in tram-system-related cycling injuries after a period of local media attention. Furthermore, the results of a literature review by Schepers et al. [2] suggest a rather paradox finding that a higher proportion of all journeys made by bicycle reduces the proportion of cyclist injuries caused by single-bicycle crashes. It might therefore also be concluded from these findings that traffic that is based a lot on bicycle routes, is frequently used, and adapted accordingly in terms of urban planning represents a more safe environment for cyclists. However, due to the chosen retrospective study design, no statement can be made about the absolute numbers of bicycle trips made in this study; these findings also indicate that regulatory measures taken by urban planners have relevant effects on the risk of injury to cyclists. The results of this study should furthermore be of high relevance to clinicians, traumatologists, orthopedic surgeons, and rescue workers who need to provide medical care to injured cyclists with appropriate injury mechanisms and corresponding injuries that warrant rapid treatment.
Preventing this injury mechanism requires a multifaceted approach that includes infrastructure improvements, bicyclist awareness and education, and evaluation of safety measures to reduce the frequency and severity of bicycle crashes on tram tracks. Future studies should prospectively investigate which measures have an injury prevention effect, quantify their magnitude, and thus enable urban planners to use evidence-based measures to make urban cycling as safe as possible. Several limitations apply to this study. First, because patients with only minor injuries might not have attended the emergency department of our hospital, the true injury incidence is presumably higher. Furthermore, country hospitals were not included in the evaluation and therefore it cannot be ruled out that a patient attended another hospital. Nonetheless, our emergency department is the primary care reference unit located directly in the city center, and it can be assumed that most of the patients, especially with severe injuries, were treated at our department. Second, due to the retrospective design of this study, it remains unclear if the noticeable reduction in injuries at the most common injury site represents the positive outcome of a successful city government intervention or if further unknown factors came into play. Third, due to missing data on the overall usage of the studied cycle tracks, the true incidence rate of bicycle-related tram injuries cannot be calculated.

5. Conclusions

Urban tram tracks are a significant risk factor for bicycle accidents with subsequent typical minor to severe injury patterns without any age or gender dominance. Bike tire wedging in tram tracks was the most common injury mechanism with upper extremity fractures being the most common injury type. Well-designed bicycle facilities, including separate tram and bicycle lanes, may be advised to reduce the risk of bicycle accidents and subsequent injuries.

Author Contributions

Conceptualization, F.S., P.K., R.A. and A.R.; methodology, F.S., A.R. and P.K.; formal analysis, F.S.; A.S.K. and L.D. investigation, F.S.; data curation, F.S.; writing—original draft preparation, F.S.; writing—review and editing, F.S., A.S.K., L.D., P.K. and A.R.; visualization, F.S.; supervision, P.K. and R.A.; project administration, F.S. and A.R.; funding acquisition, P.K. and R.A. All authors have read and agreed to the published version of the manuscript.

Funding

Financial support was granted by the government of Tyrol (VSR-VSF/Proj-521/1-2020).

Institutional Review Board Statement

The study was conducted according to the guidelines of the Declaration of Helsinki and approved by the Ethics Committee of the Medical University of Innsbruck (EK 1295/2020).

Informed Consent Statement

Individual patient consent was waived due to the solely retrospective study design and the lack of identifiability of individual patients within the published data.

Data Availability Statement

Additional data is provided in the Appendix, otherwise unavailable due to privacy and ethical restrictions.

Acknowledgments

We gratefully acknowledge the help of the city government of Innsbruck and the Kuratorium für Verkehrssicherheit (KFV) by providing valuable data regarding the implementation of safety measures.

Conflicts of Interest

The authors declare no conflict of interest.

Appendix A

A listing of the actual diagnoses as well as absolute and relative numbers of injuries related to the main injury site is provided in the appendix.
Figure A1. Absolute and relative numbers of injuries related to the main injury-site.
Applsci 13 11861 g0a1aApplsci 13 11861 g0a1b
Table A1. Fractures Diagnosis.
DiagnosisFrequency (n)
Radial head/neck fractures22
Rib fractures (3 isolated)20
Fractures of the carpal and metacarpal bones (including 8 scaphoid fractures)14
Clavicle fractures12
Proximal humeral fractures9
Distal radius fractures8
Avulsions of the carpal and finger bones8
Fractures of the finger bones6
Nasal Bone Fractures6
Proximal femur fractures4
Pubic branch fractures4
Distal humeral fractures3
Proximal tibia fractures3
Osteoporotic vertebral body fractures3
Facial skull fractures (nasal bone excluded)2
Tooth Fracture2
Distal ulna fractures2
Elbow dislocation fracture1
Olecranon fracture1
Fracture of the Os cuneiforme med1
Fract. ossis naviculare1
Fract. metatarsale V basis dext. 1
Lateral malleolus fracture with osteochondral talus injury1
Patellar fracture1
Scapular fracture1
TFCC Lesion with bony fragment1
Total137
Table A2. Ligament Diagnosis.
DiagnosisFrequency (n)
Knee ligament injuries (including 6 ACL and 1 PCL rupture)8
Ankle ligament injuries3
TFCC Lesions2
Acromioclavicular joint dislocations2
Elbow ligament injury2
ECU tendon subluxation1
Lacerated tendon injury hand1
Ligamentous lesion and instability of the finger joints1
Long head of biceps rupture1
Meniscus tear knee1
Muscle fiber tear1
Shoulder dislocation1
Total24
Table A3. Injuries related to the main injury-site.
YearFrequency (n)Percentage (%)
2010310%
2011516%
2012931%
2013516%
20141125%
20151426%
20161017%
2017514%
201836%
201900%
6517%

References

  1. Cameron, I.C.; Harris, N.J.; Kehoe, N. Tram-related injuries in Sheffield. Injury 2001, 32, 275–277. [Google Scholar] [CrossRef] [PubMed]
  2. Schepers, P.; Agerholm, N.; Amoros, E.; Benington, R.; Bjørnskau, T.; Dhondt, S.; de Geus, B.; Hagemeister, C.; Loo, B.P.Y.; Niska, A. An international review of the frequency of single-bicycle crashes (SBCs) and their relation to bicycle modal share. Inj. Prev. 2015, 21, e138–e143. [Google Scholar] [CrossRef] [PubMed]
  3. Juhra, C.; Wieskötter, B.; Chu, K.; Trost, L.; Weiss, U.; Messerschmidt, M.; Malczyk, A.; Heckwolf, M.; Raschke, M. Bicycle accidents—Do we only see the tip of the iceberg? A prospective multi-centre study in a large German city combining medical and police data. Injury 2012, 43, 2026–2034. [Google Scholar] [CrossRef] [PubMed]
  4. Maempel, J.F.; Mackenzie, S.P.; Stirling, P.H.C.; McCann, C.; Oliver, C.W.; White, T.O. Tram system related cycling injuries. Arch. Orthop. Trauma Surg. 2018, 138, 643–650. [Google Scholar] [CrossRef] [PubMed]
  5. Teschke, K.; Dennis, J.; Reynolds, C.C.O.; Winters, M.; Harris, M.A. Bicycling crashes on streetcar (tram) or train tracks: Mixed methods to identify prevention measures. BMC Public Health 2016, 16, 617. [Google Scholar] [CrossRef] [PubMed]
  6. Deunk, J.; Harmsen, A.M.K.; Schonhuth, C.P.; Bloemers, F.W. Injuries Due to Wedging of Bicycle Wheels in On-road Tram Tracks. Arch. Trauma Res. 2014, 3, e23083. [Google Scholar] [CrossRef] [PubMed]
  7. Aertsens, J.; de Geus, B.; Vandenbulcke, G.; Degraeuwe, B.; Broekx, S.; De Nocker, L.; Liekens, I.; Mayeres, I.; Meeusen, R.; Thomas, I.; et al. Commuting by bike in Belgium, the costs of minor accidents. Accid. Anal. Prev. 2010, 42, 2149–2157. [Google Scholar] [CrossRef] [PubMed]
  8. Wegman, F.; Zhang, F.; Dijkstra, A. How to make more cycling good for road safety? Accid. Anal. Prev. 2012, 44, 19–29. [Google Scholar] [CrossRef] [PubMed]
  9. Cripton, P.A.; Dressler, D.M.; Stuart, C.A.; Dennison, C.R.; Richards, D. Bicycle helmets are highly effective at preventing head injury during head impact: Head-form accelerations and injury criteria for helmeted and unhelmeted impacts. Accid. Anal. Prev. 2014, 70, 1–7. [Google Scholar] [CrossRef] [PubMed]
  10. Harris, M.A.; Reynolds, C.C.O.; Winters, M.; Cripton, P.A.; Shen, H.; Chipman, M.L.; Cusimano, M.D.; Babul, S.; Brubacher, J.R.; Friedman, S.M.; et al. Comparing the effects of infrastructure on bicycling injury at intersections and non-intersections using a case-crossover design. Inj. Prev. 2013, 19, 303–310. [Google Scholar] [CrossRef] [PubMed]
  11. Morrison, C.N.; Thompson, J.; Kondo, M.C.; Beck, B. On-road bicycle lane types, roadway characteristics, and risks for bicycle crashes. Accid. Anal. Prev. 2019, 123, 123–131. [Google Scholar] [CrossRef] [PubMed]
  12. Reynolds, C.C.O.; Harris, M.A.; Teschke, K.; Cripton, P.A.; Winters, M. The impact of transportation infrastructure on bicycling injuries and crashes: A review of the literature. Environ. Health 2009, 8, 47. [Google Scholar] [CrossRef] [PubMed]
  13. Teschke, K.; Frendo, T.; Shen, H.; Harris, M.A.; Reynolds, C.C.O.; Cripton, P.A.; Brubacher, J.; Cusimano, M.D.; Friedman, S.M.; Hunte, G.; et al. Bicycling crash circumstances vary by route type: A cross-sectional analysis. BMC Public Health 2014, 14, 1205. [Google Scholar] [CrossRef]
  14. Teschke, K.; Harris, M.A.; Reynolds, C.C.O.; Winters, M.; Babul, S.; Chipman, M.; Cusimano, M.D.; Brubacher, J.R.; Hunte, G.; Friedman, S.M.; et al. Route infrastructure and the risk of injuries to bicyclists: A case-crossover study. Am. J. Public Health 2012, 102, 2336–2343. [Google Scholar] [CrossRef]
Figure 1. Tram tracks at the most frequent injury location.
Applsci 13 11861 g001
Figure 2. Number of injuries per month: The distribution throughout the year shows similar injury rates between April and December.
Applsci 13 11861 g002
Figure 3. Separation of traffic lanes at the main injury site.
Applsci 13 11861 g003
Table 1. Patient characteristics.
CharacteristicPatient Count
Sex
Female212 (56.1%)
Male166 (43.9%)
Age (years)
Median38.4
Range10–86
Treatment
Outpatient340 (89.9%)
Inpatient38 (10.1%)
Injury severity group *
Group I (Soft tissue injuries)235
Group II (Ligament/tendon ruptures)24
Group III (Fractures)108
Group IV (Traumatic brain injuries)9
* The sum of the injury severity subgroups does not add up to the total number of included patients due to the lack of precise initial documentation in two cases.
Table 2. Injury frequency (per year).
YearInjury Frequency (n)
201030
201132
201229
201331
201444
201554
201658
201737
201849
201914
Table 3. Frequency of injury to specified body regions (fractures).
Body RegionFrequency (n)Percentage (%)
Hand2820
Elbow2720
Shoulder2216
Thorax2015
Wrist/Forearm118
(Facial) Skull107
Pelvis86
Knee43
Foot32
Spine32
Ankle11
Table 4. Frequency of injury to specified body regions (ligament/tendon injuries).
Body RegionFrequency (n)Percentage (%)
Knee938
Shoulder417
Wrist/Forearm313
Ankle313
Elbow28
Hand28
Thigh14
Table 5. Reconstructed weather and lighting conditions at the time of the accident.
ConditionFrequency (n)Percentage (%)
Lighting
Daylight30079
Dusk298
Darkness4712
No time given21
Weather
Cloudy 13636
Sunny 11230
Rainy 369
Snowfall 62
Cloudless 10
No information8723
Disclaimer/Publisher’s Note: The statements, opinions and data contained in all publications are solely those of the individual author(s) and contributor(s) and not of MDPI and/or the editor(s). MDPI and/or the editor(s) disclaim responsibility for any injury to people or property resulting from any ideas, methods, instructions or products referred to in the content.

