Abstract
Visual-based positioning technology plays a pivotal role in spatial artificial intelligence, facilitating precise perception and comprehension of the physical world for robotic platforms and augmented reality devices. In this study, we propose a binocular camera-based method for spatial localization of targets using CNN for instance segmentation while simultaneously providing target location information. The method encompasses image acquisition and correction, target recognition and segmentation, and stereo matching, among other components. Building upon this foundation, we introduce a pedestrian recognition segmentation network model with an attention mechanism. To accurately locate the target, we employ a multi-feature fusion feature point extraction and matching algorithm that combines edge information with semantic information. Finally, our proposed method is evaluated for dynamic pedestrian targets in indoor environments, achieving a horizontal positioning error of less than 0.25 m.
1. Introduction
Recently, significant advancements have been made in image-based object recognition, detection, and segmentation due to the rapid progress in computer processing power and deepening research on artificial intelligence algorithms. The wealth of information embedded within images enables real-time identification and positioning of specific objects such as pedestrians and vehicles through vision. Vision-based positioning technology can be categorized into two main types: active positioning technology, exemplified by structure from motion (SFM) or simultaneous localization and mapping (SLAM), which is utilized for self-positioning calculation in autonomous driving, robotics, drones, VR/AR applications [1,2]; passive positioning technology, represented by binocular or depth camera positioning systems, is employed for target posture calculation and commonly applied in industrial detection, automatic assembly processes, spacecraft docking operations, fruit collection tasks among others. The vision-based positioning method offers high accuracy at a low cost [3].
SFM is a 3D reconstruction strategy that leverages unordered images, showcasing significant advancements in both robustness and accuracy. However, its time complexity remains high, rendering real-time positioning unattainable [4,5]. SLAM serves as a dead reckoning method based on visual sensor measurement data, commonly employing feature matching and optical flow technologies in monocular and binocular SLMA systems like ORB-SLAM, DSO, and VINS [6,7,8,9]. Nevertheless, the stability of positioning results is suboptimal and susceptible to environmental interference. Furthermore, the positioning error exhibits an upward trend with the increase of paths. Although notable progress in related algorithms and sensor hardware, vision-based SLAM technology still encounters substantial challenges when operating in complex real-world environments.
By utilizing frame regression, the object detection algorithm accurately determines the coordinate position information of the target object and locates it. However, in real-world scenarios where multiple instances containing various types of objects or similar objects coexist, mere coordinate information is often insufficient. In such cases, semantic information plays a more crucial role in scene understanding. Traditional semantic segmentation methods can interpret the pixel-level semantics of the target object, but cannot determine its relative position information. In this study, we propose a passive location method that can achieve instance segmentation and synchronous localization using low-cost binocular cameras. Besides, it offers high accuracy and stability with static positioning accuracy at the centimeter level and dynamic positioning accuracy at the decimeter level [10,11,12].
2. Related Work
In this section, we present pertinent prior research encompassing studies on target recognition and segmentation, feature extraction, and matching.
Target recognition and segmentation: The field of object recognition and segmentation techniques can be categorized into two main approaches: traditional artificial design features and deep neural network-based methods. With the rapid advancements in neural network technology, CNN-based algorithms have demonstrated superior capabilities compared to artificial design features in various domains such as object detection and semantic segmentation [13,14]. Notably, the Fast/Faster R-CNN [15,16] and FCN methods for semantic segmentation exhibit remarkable flexibility and robustness. The SegNet model utilizes a symmetrical encoder-decoder architecture to maintain feature positions throughout downsampling and restore them during upsampling, thus improving the output resolution of the model. Void convolution enlarges the receptive field of output elements by incorporating “holes” into the convolution kernel while keeping the parameter count unchanged. The RefineNet model exploits features at different levels for gathering image information using various sampling techniques, optimizes utilization of global-level features, and integrates long-range residual connections to improve semantic segmentation. Deep Lab v3 integrates a batch normalization layer within its network architecture and utilizes parallel as well as serial hole convolution modules for enabling multi-scale object classification [17,18,19]. In this study, we employed a multitasking framework that facilitates target identification and segmentation, thereby incorporating a comprehensive loss function encompassing target classification error, regression error, and image segmentation error.
Feature extraction and matching: Vision-based localization methods commonly utilize point, line, and surface features. The algorithms frequently employed for feature point detection include Harris, FAST, SIFT, etc. Moreover, there are also local feature-based detection techniques such as Log edge detection, LBP, HOG, etc. [20,21,22,23]. Although these methods are interpretable and easy to understand and debug, they lack generality and flexibility. They are more suitable for small datasets with obvious scene features. Recently, several deep learning-based feature detection methods have been proposed. For example, D. DeTone et al. introduced the Super Point feature extraction method which is a self-supervised approach that trains the network to extract feature points and compute descriptors. Multi PoseNet can simultaneously handle human detection and keypoint localization by utilizing a pose residual network (PRN) to implement a novel pose allocation technique [24,25]. These methods automatically learn features with strong versatility and flexibility but lack interpretability; thus they are more suitable for scenes with large datasets and complex features. Our study proposes a novel hybrid feature detection approach that effectively integrates semantic information into BRIEF descriptors, thereby harnessing the combined strengths of both methodologies.
3. System Overview and Method
Initially, we provide a comprehensive overview of the entire system, followed by an explanation of the system procedures encompassing camera calibration, target recognition and segmentation, and stereo matching, among others.
3.1. System Overview
The system for binocular instance segmentation and simultaneous localization is depicted in Figure 1, encompassing six sequential steps: (1) Image acquisition through the binocular camera; (2) Camera calibration to derive internal and external parameters followed by image correction based on a distortion model; (3)Targeted semantic segmentation and recognition can be achieved through a multi-task semantic segmentation network that incorporates an attention mechanism, enabling the identification and segmentation of specific targets. (4) Feature extraction and matching is accomplished using a multi-feature point fusion algorithm that combines edge detection with FAST corner detection. (5) Binocular parallax positioning is employed to compute the three-dimensional coordinates of an object in the camera coordinate system by analyzing the parallax of feature points present in both left and right images. (6) The output comprises target location information along with category identification.
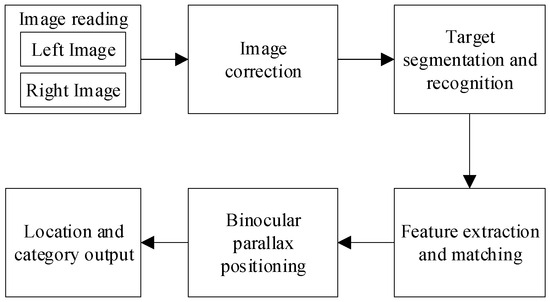
Figure 1.
The system for binocular instance segmentation and simultaneous localization.
3.2. Camera Calibration
This section primarily focuses on the analysis and rectification of lens errors. The camera lens consists of a combination of concave and convex lenses, representing the essence of a pinhole camera model. However, inherent distortions caused by the camera lenses often result in radial and tangential distortions in images. Therefore, prior to image processing, it is essential to calibrate the camera and correct these distortions. In this paper, we employ the checkerboard calibration method to obtain both internal and external parameters of the camera. The checkerboard contains multiple reference points for calibration purposes, with each point’s coordinates being subject to identical noise disturbance. Consequently, an objective function is established accordingly :
where is the coordinates between the calibration reference points j and its corresponding projected point on image i. While and represent the rotation and translation vectors of image i, respectively. Here, denotes the three-dimensional coordinate of the reference point i in the world coordinate system, whereas represents its two-dimensional coordinates in the image coordinate system. The rotation matrix and translation matrix between binocular camera lenses can be expressed as follows:
where represents the rotation matrix and denotes the translation matrix.
3.3. Architecture of Multitasking Network
This paper proposes a multitasking network architecture that incorporates an attention mechanism by sequentially connecting the channel and spatial attention modules to extract shallow global features and focus on relevant regions during object detection, recognition, and semantic segmentation tasks. In comparison with conventional network models, this approach enhances feature utilization, optimizes computational resources, and mitigates noise impact.
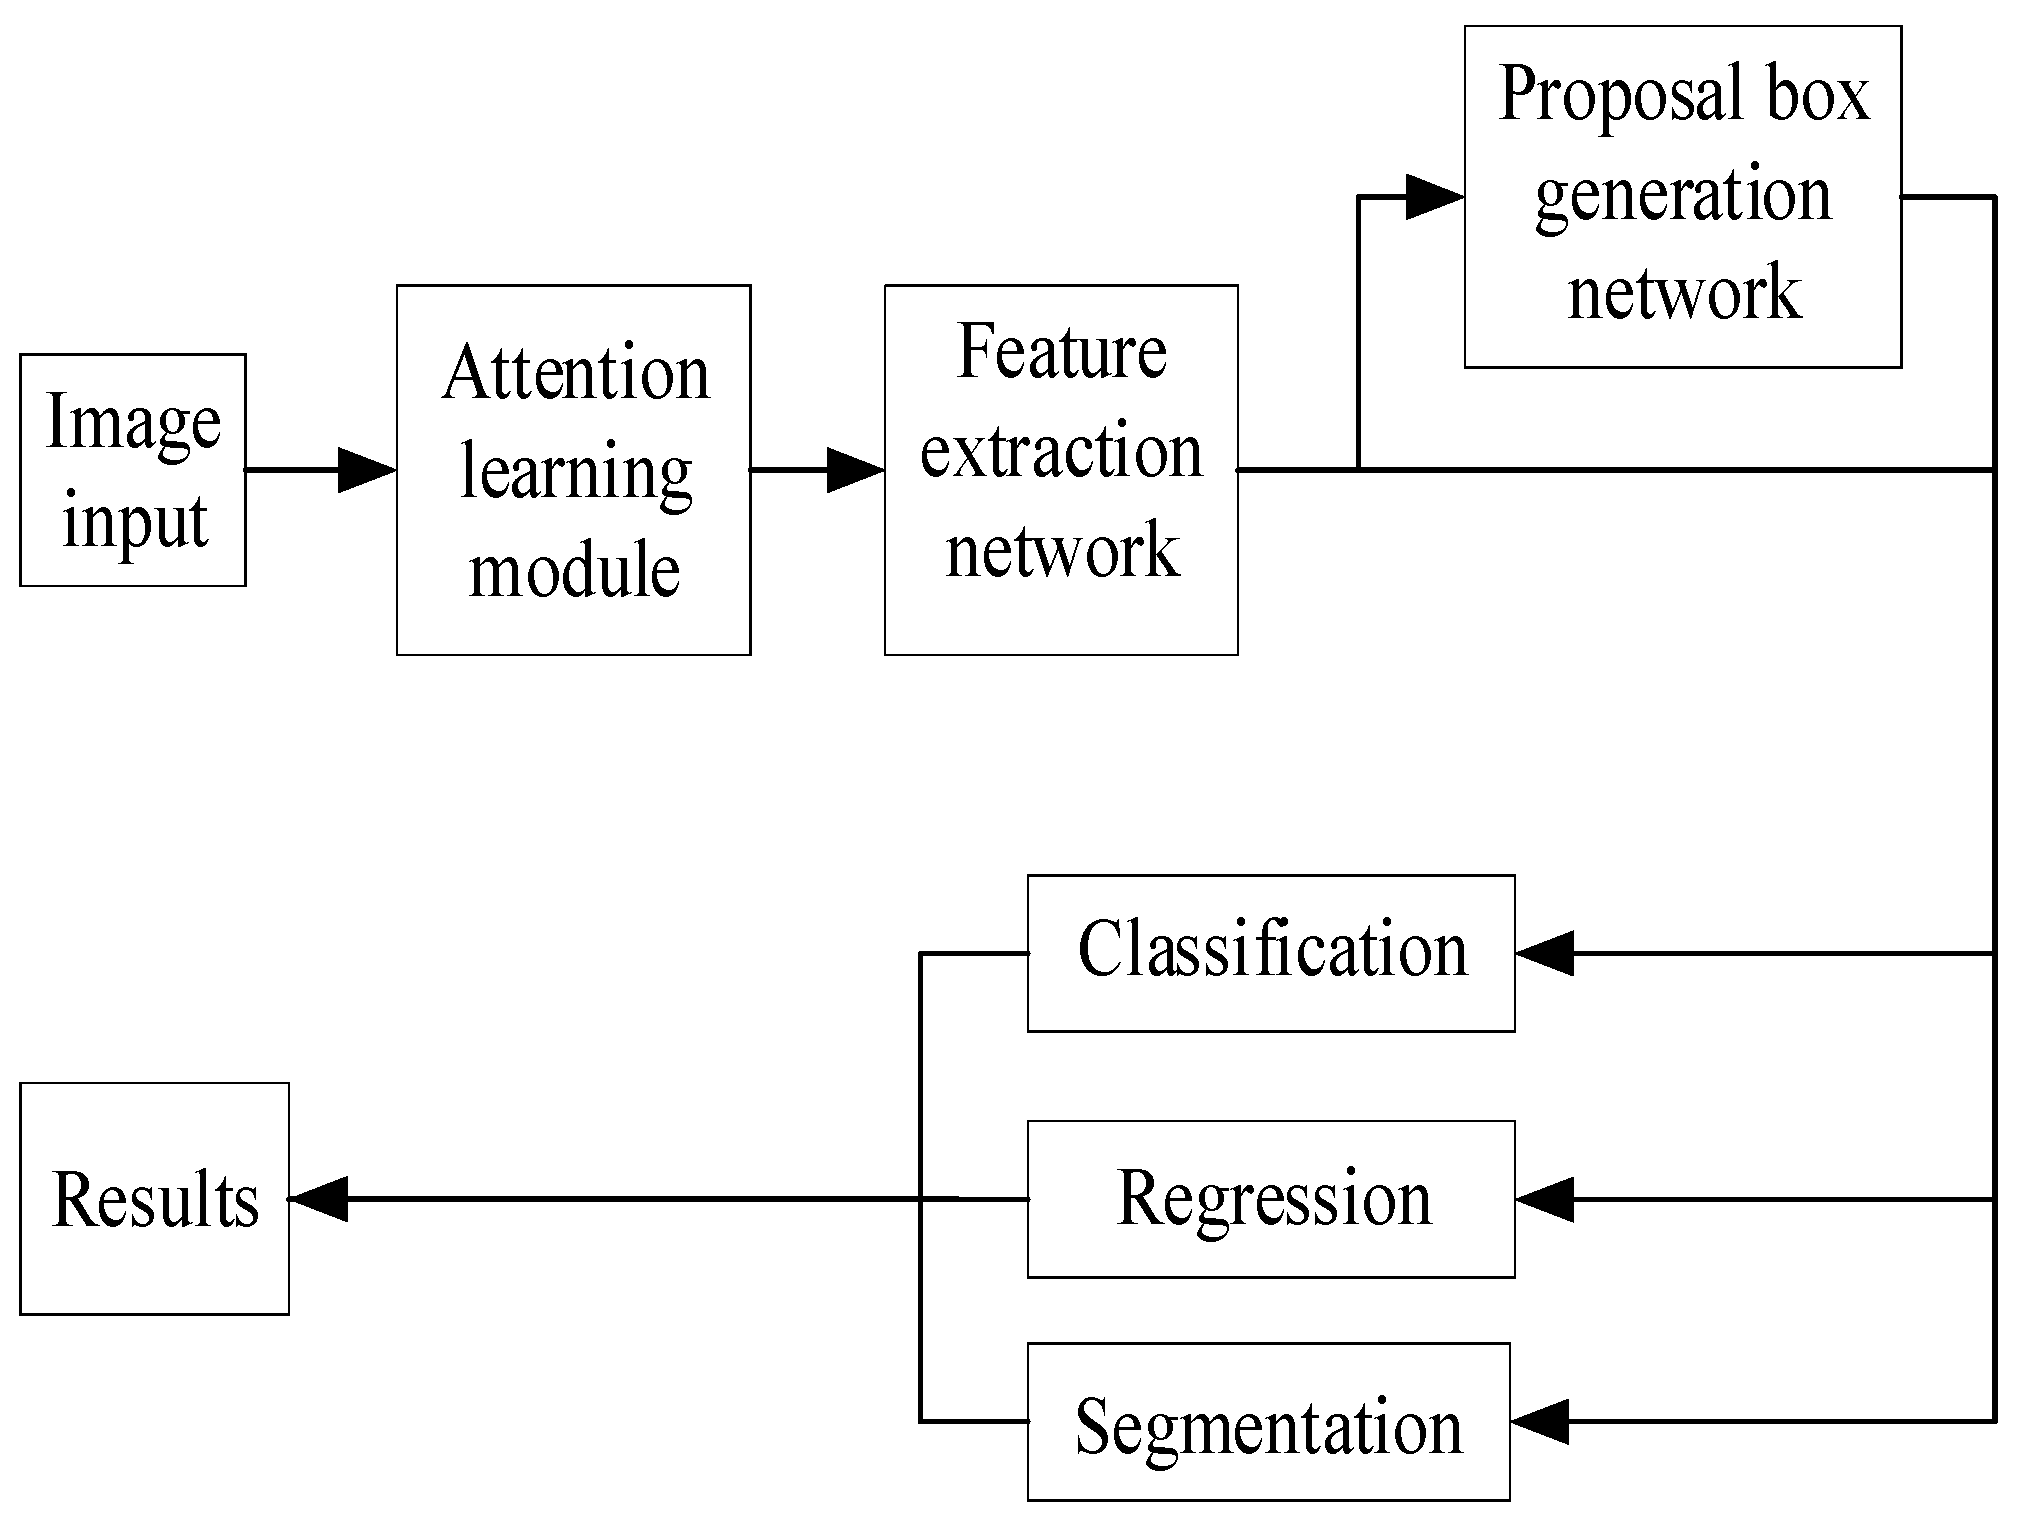
The multitasking network architecture can be divided into two stages: in the first stage, the image is scanned using a sliding window to generate a feature map and region proposal boxes; whereas in the second stage, these proposals are classified based on their features, bounding boxes are regressed, and masks are generated.
Firstly, a deep convolutional neural network is utilized to extract low-level features and generate feature maps. As the depth of the network increases, more intricate image features are obtained. The regional proposal extraction network calculates ROIs that are subsequently mapped onto the feature map. To address misalignment issues, an ROI Align operation is incorporated. The bilinear interpolation method is employed to obtain the image value of the corresponding pixel position, thereby reconstructing spatial information and generating a fixed-size feature map. One branch connects to a fully connected network layer for classification and regression detection, while another branch performs semantic segmentation at the pixel level through FCN. Ultimately, multiple tasks are accomplished in this multi-tasking-CNN model as illustrated in Figure 2:
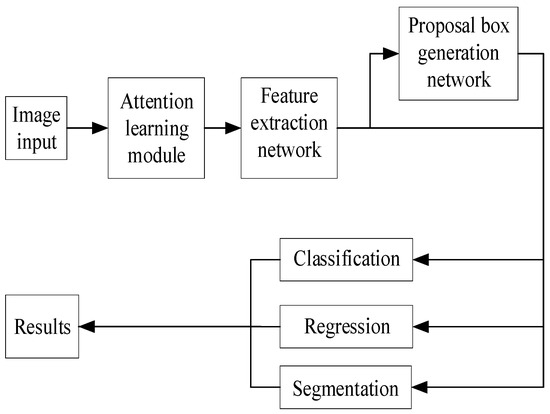
Figure 2.
Composition structure of the multi-task network.
The attention learning module consists of the channel attention module and the spatial attention module, which are concatenated to the network model to achieve discrimination in focus areas. The former includes global pooling, average pooling, a fully connected layer, and a Sigmoid activation function, while the latter comprises global pooling, average pooling, a convolutional layer, and a Sigmoid activation function. The feature extraction network employs ResNet50 as the feature extractor, which incorporates a residual module based on the VGG network architecture [26]. The lower layers detect low-level features such as edges and corners, while the higher layers capture more abstract semantic information. Once an image is processed by the backbone network, it generates a feature map that serves as input for subsequent stages. The loss function comprises classification error, detection error, and segmentation error:
where represents classification loss, denotes regression loss, and signifies segmentation error.
3.4. Feature Points Detection and Matching
Image feature point matching algorithms typically consist of two steps: feature point extraction and matching. Building upon the semantic segmentation conducted in the preceding section, this paper proposes a method that integrates semantic information, edge information, and corner information for detecting feature points. The FAST algorithm is employed to efficiently extract local corner features of objects, while the Canny algorithm is utilized to identify edge feature points of objects with sparse textures. This ensures that these objects possess an adequate number of feature points while maintaining a more uniform distribution. Furthermore, we incorporate semantic information by employing improved BRIEF descriptors to describe these feature points. The complete implementation process of the algorithm is illustrated in Figure 3.
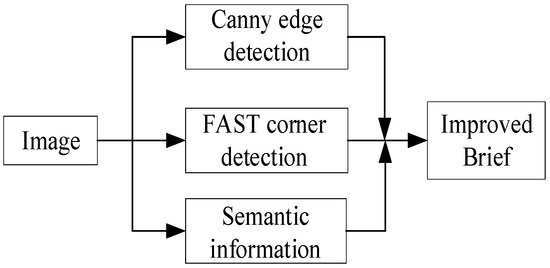
Figure 3.
Fusion-based matching of multi-feature points.
In order to improve the noise immunity of the descriptor, Gaussian templates with window size and variance are used to filter the image.
Then select comparison points in the pixel block around the feature point , and compare the intensity value of the two pixels, and the comparison rule is as follows:
where , is the grayscale value respectively. The BRIEF descriptor of the dimension is obtained by logical operations.
Select comparison points and compare the semantic information of the two pixels, and the comparison rule is as follows:
where , is the semantic information respectively. The BRIEF descriptor of the dimension is obtained by logical operations. Therefore, a binary descriptor of bits is formed for the feature point , as shown in the following equation:
During the process of matching feature points in the left and right camera images, semantic information is effectively utilized to eliminate unmatched feature points. Subsequently, a brute force algorithm is applied to calculate the Hamming distance for each feature point. The minimum Hamming distance value is then compared against a predetermined threshold. If the calculated distance is less than or equal to this threshold, it indicates a match between two points; otherwise, they are considered mismatched. Furthermore, all qualifying features are sorted based on the number of identical elements in their respective bits, with those having the highest count being selected as matching features. It should be noted that no rotation or scale transformation occurs between corrected binocular images; therefore, polar constraints are incorporated into the matching algorithm. By searching for feature points within two pixels above and below the pole during the matching process, not only can accuracy be improved but also computational time can be reduced.
3.5. Principle of Binocular Positioning
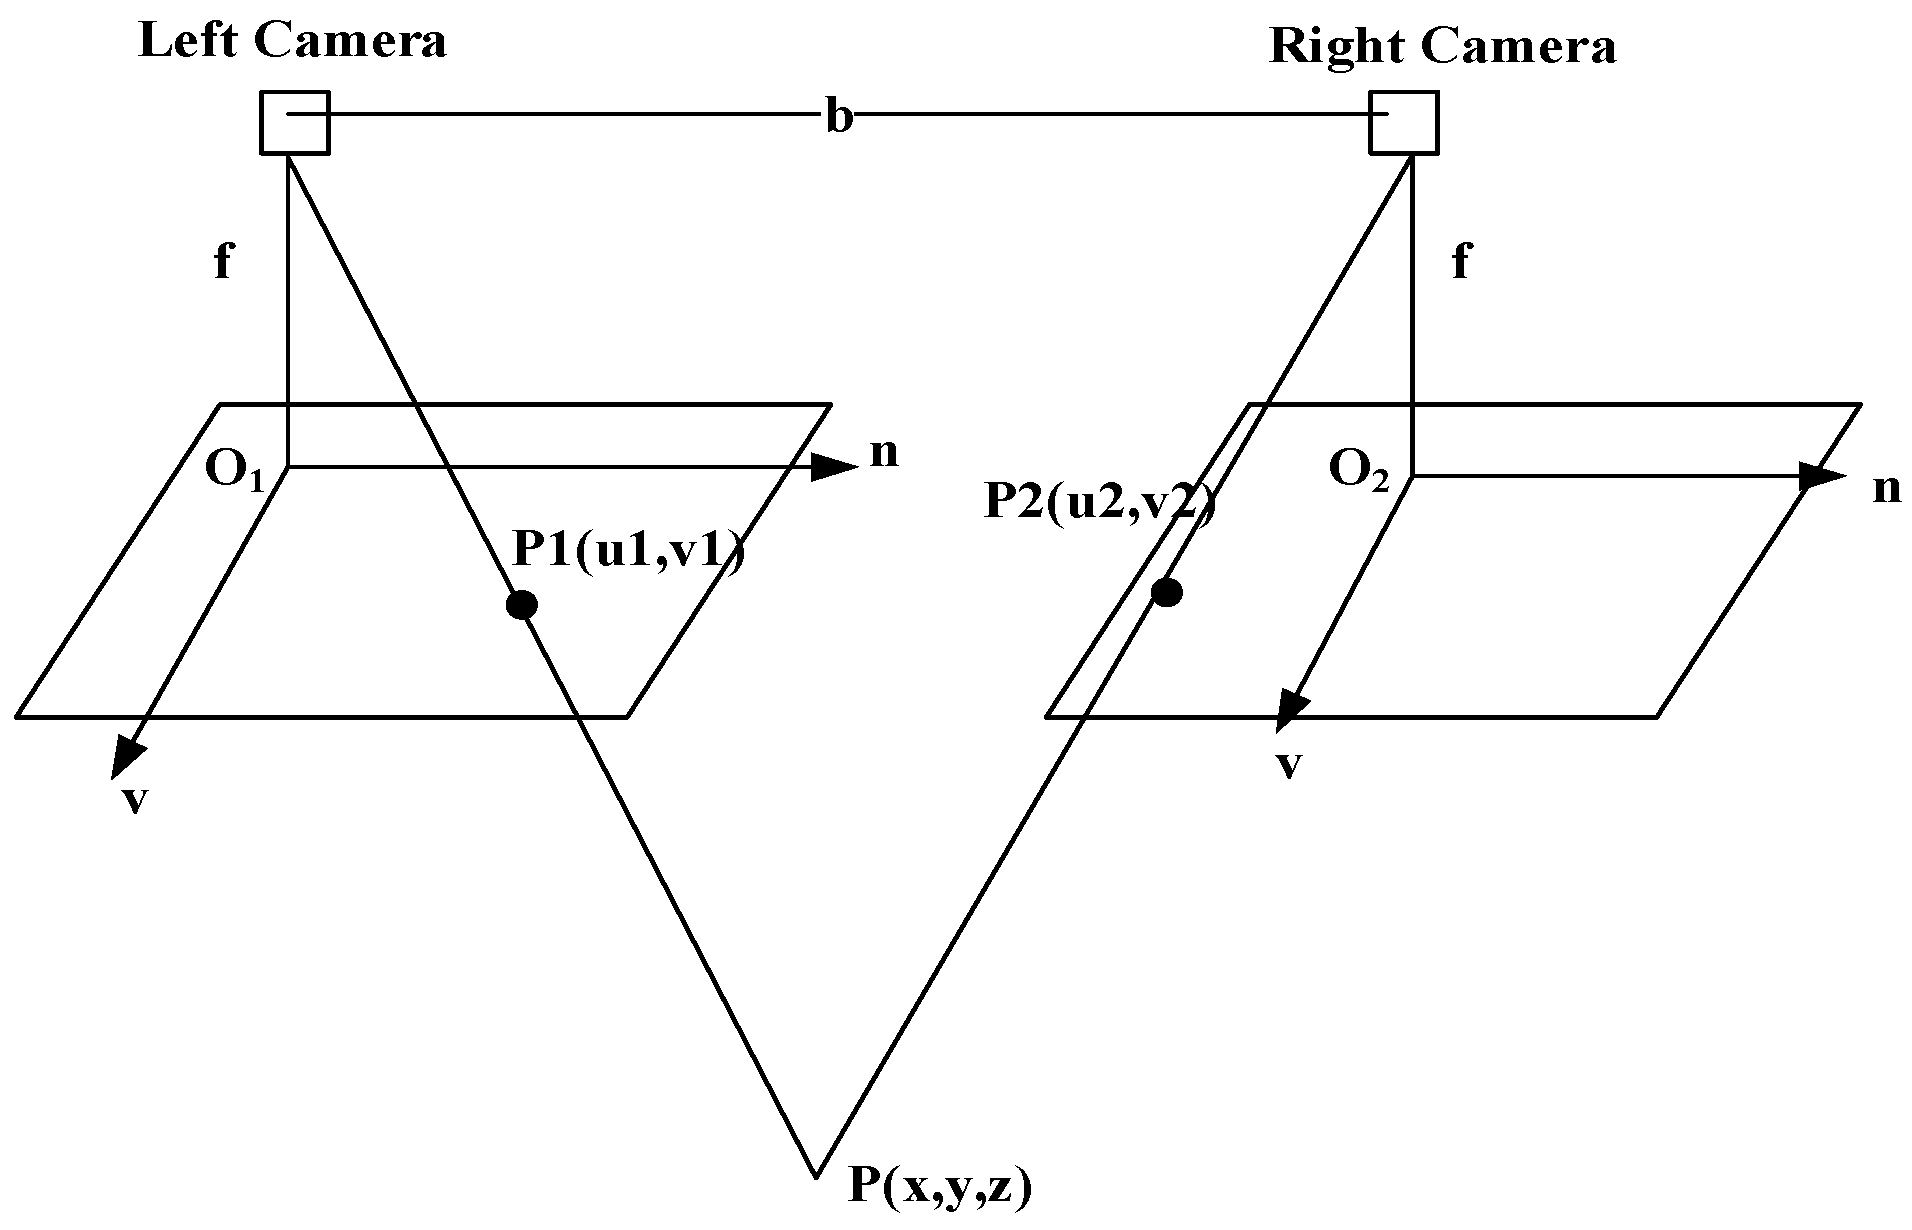
The geometric relationship between the point P and its corresponding projection point in the left and right images is illustrated in Figure 4. The baseline distance between the left and right lenses, denoted as b, and the focal length of the camera is represented by f. By applying the trigonometric similarity formula, we derive the following equation:
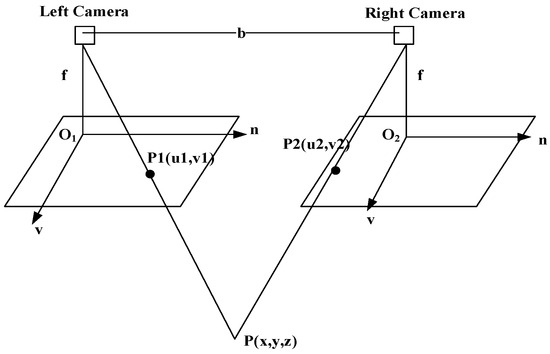
Figure 4.
Schematic of binocular stereo vision positioning.
The parallax of the P point between the two images is signified by d
Therefore, the position of point P in the camera’s coordinate system can be computed.
4. Experiments Results and Discussion
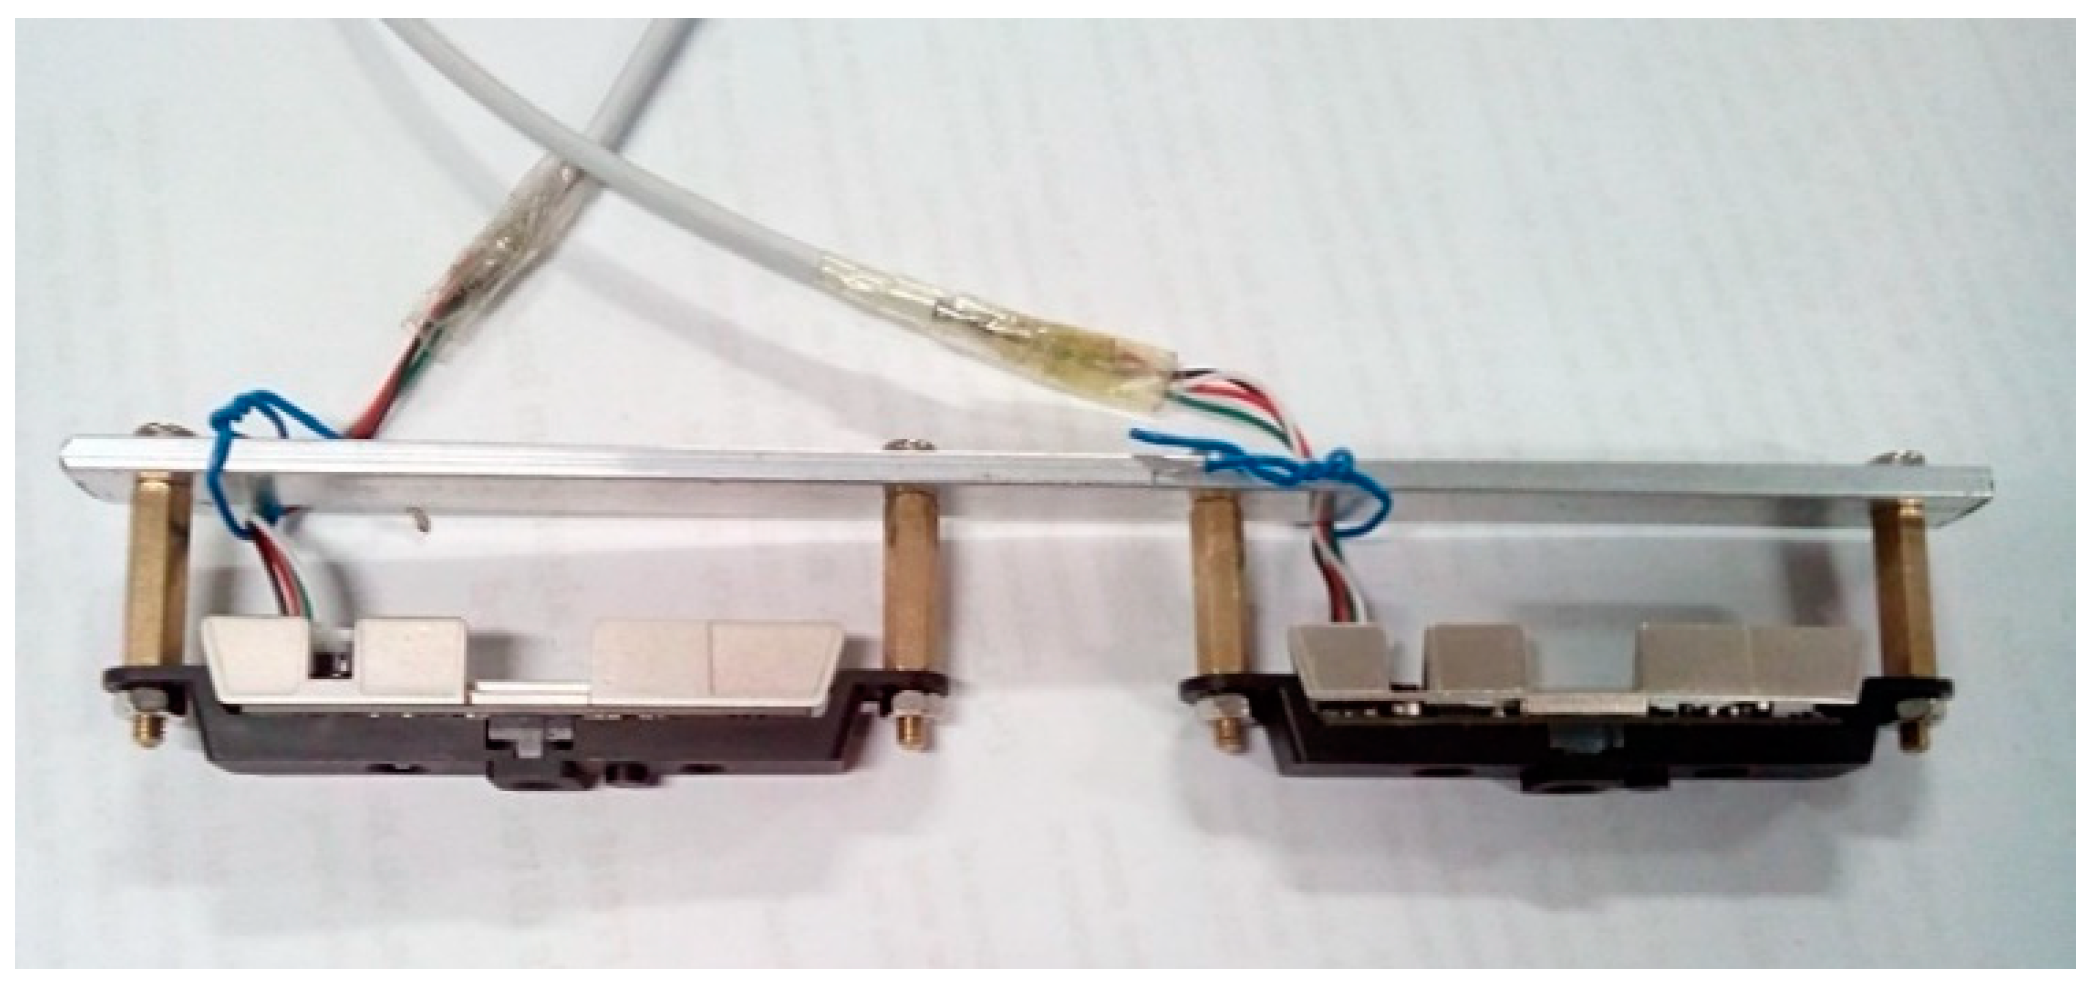
The test equipment consists of a binocular camera, comprising two cameras mounted on a fixed structure with a baseline length of 10 cm as depicted in Figure 5, and a computer equipped with an Intel Core i7-7700 (3.6 GHz) processor, 16 Gb RAM, Nvidia GTX1080 GPU, and running the Ubuntu 18.04 operating system. The binocular camera is connected to the computer via USB for real-time image transmission, enabling object segmentation and simultaneous location.

Figure 5.
Binocular camera.
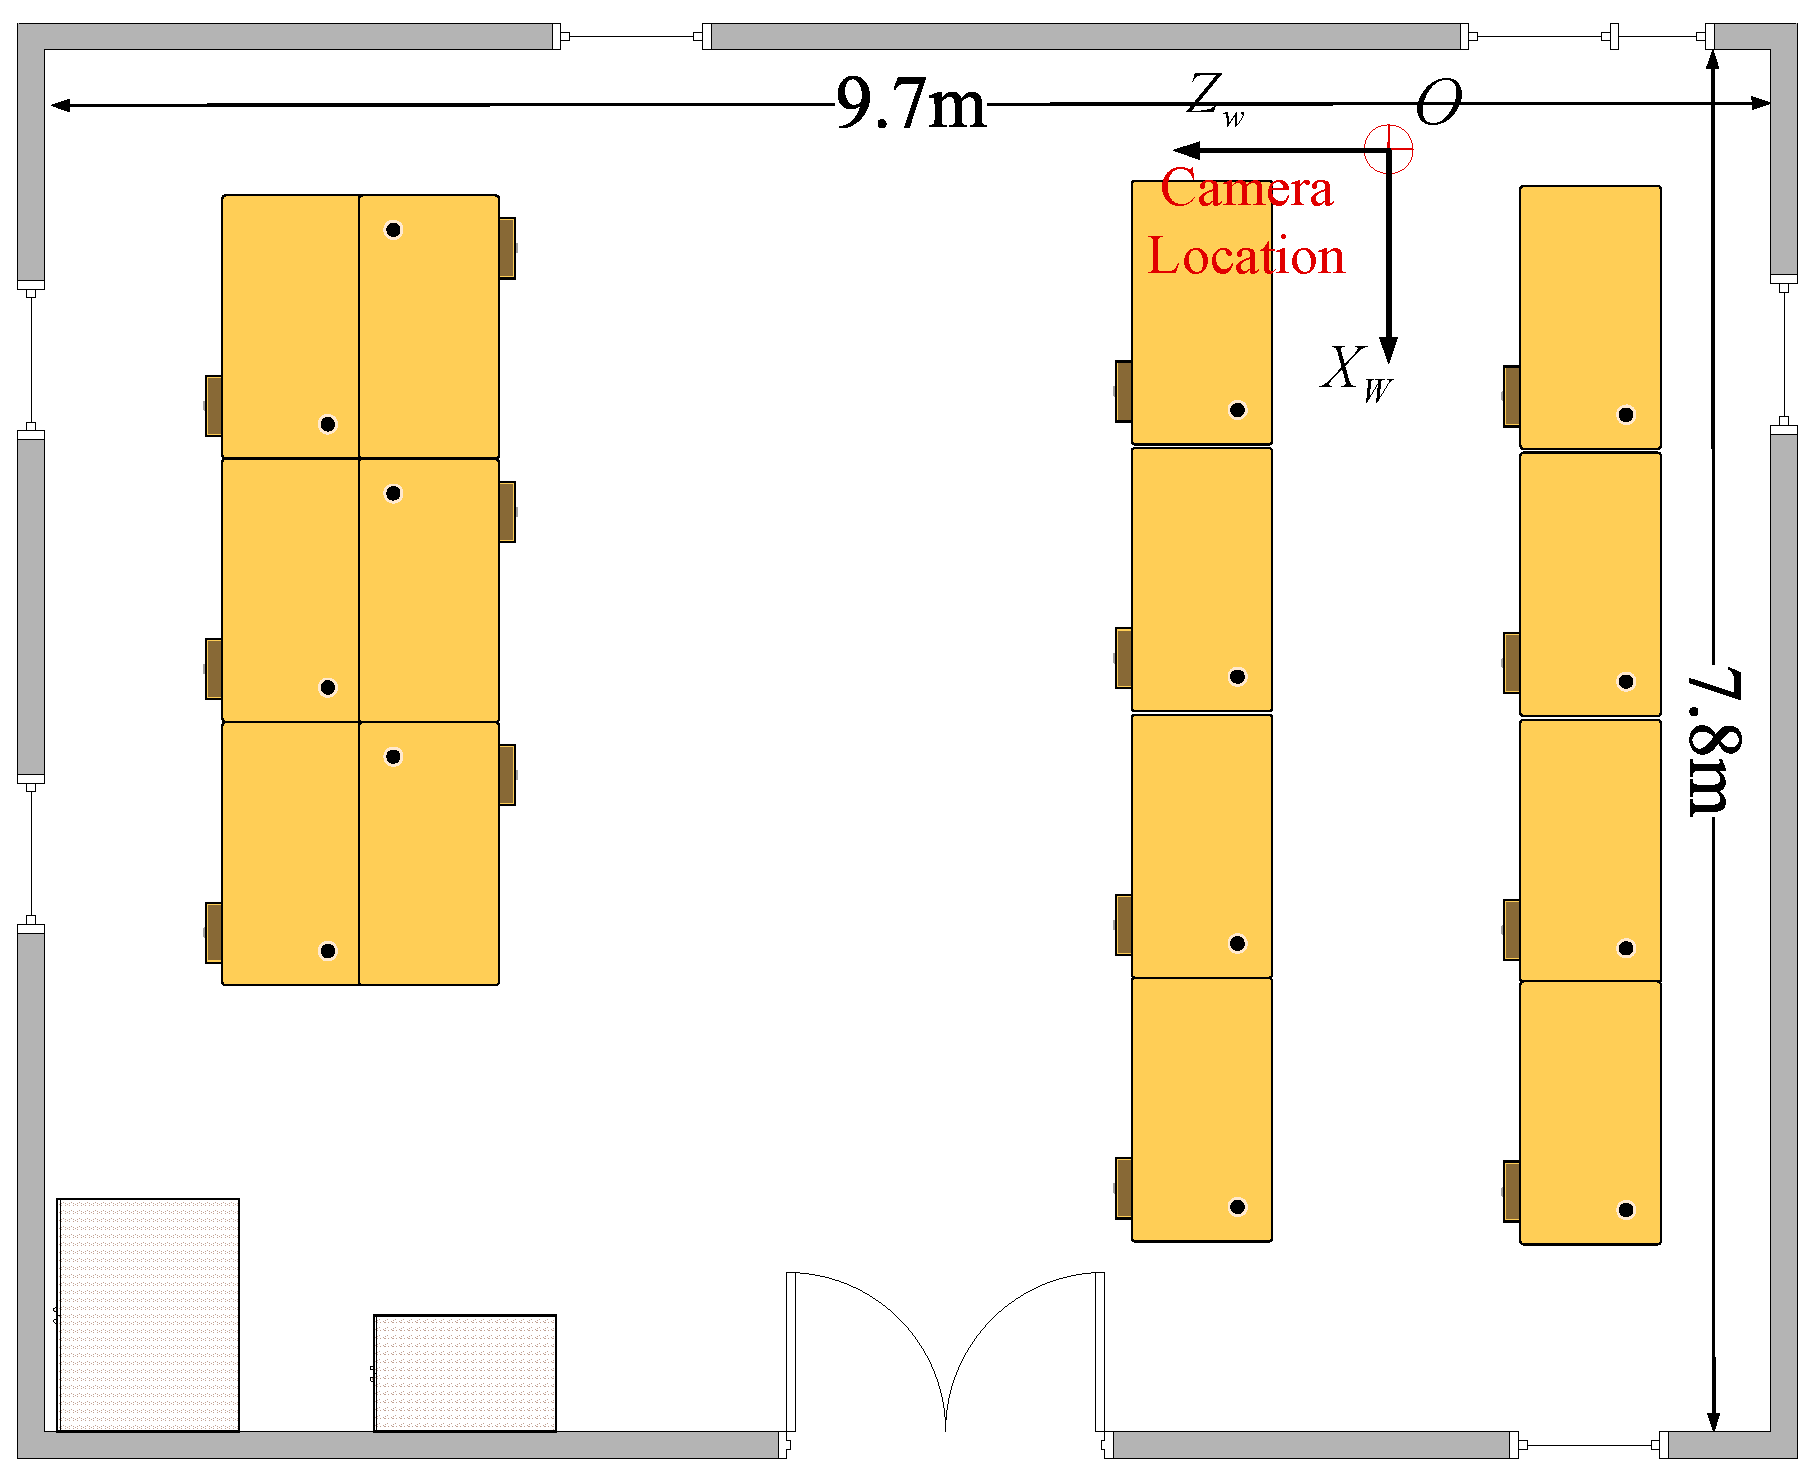
The indoor location test environment, measuring 9.7 m by 9.7 m, has been established as depicted in Figure 6. With the upper right corner serving as the origin of the world coordinate system, the camera is located at the intersection area shown in Figure 6.
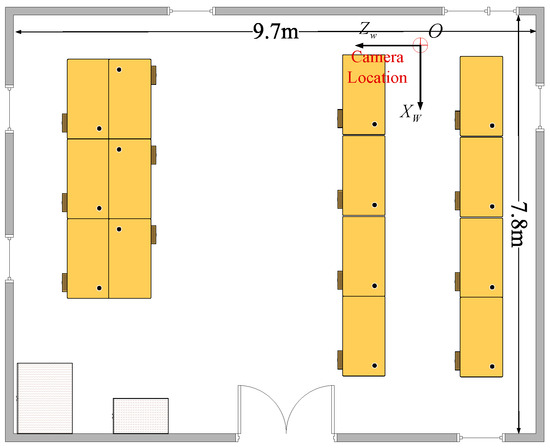
Figure 6.
The map of the indoor location test environment.
4.1. Calibration of the Binocular Camera
Before conducting the positioning test, it is necessary to calibrate the distortion parameters of the camera. The calibration process mainly involves accurate calculation of parameters such as radial and tangential distortion, along with determining the baseline length of the camera. For this purpose, a calibration board with a checkerboard size measuring 19 mm × 19 mm and containing 6 × 9 corners is utilized. Table 1 presents the resulting calibration parameters.

Table 1.
Calibration parameters of the binocular camera.
4.2. Object Segmentation and Recognition
Firstly, the image to be segmented is inputted into the training dataset. Through data standardization, image clipping transformation, and other processing techniques, the data is propagated forward through a designed network model to obtain the segmented image. The loss between the segmented image and the target image is then calculated for backpropagation purposes. This process of updating model weights continues until a set number of iteration rounds are reached. Subsequently, the test dataset is loaded and fed into the trained model for evaluation. The performance of the model is assessed using various metrics, and if it fails to meet the desired criteria, adjustments are made to the training process before saving a satisfactory version.
In this experiment, we initially trained the network model with a standardized dataset to obtain preliminary network parameters. We further refined these parameters by training on our self-made dataset collected in an indoor environment consisting of 1000 training sets and 400 test sets. The images in this dataset include roads, tables, persons, chairs, and other items considered as background.
The primary metric for evaluating the performance of a segmentation algorithm is the mean Average Precision (mAP). Firstly, precision and recall are calculated. Precision represents the ratio of correctly detected data to the total number of detected data, while recall represents the ratio of correctly identified samples to the total number of positive samples. Secondly, Average Precision is computed by plotting a precision-recall curve based on these two metrics and calculating the area under it.
The computation of the mean average precision indicator mAP is obtained by taking the average across all categories.
where N represents the number of target categories in the image. The comparative experimental results are shown in Table 2.
Table 2.
Comparison of results obtained from the experimental scenario dataset.
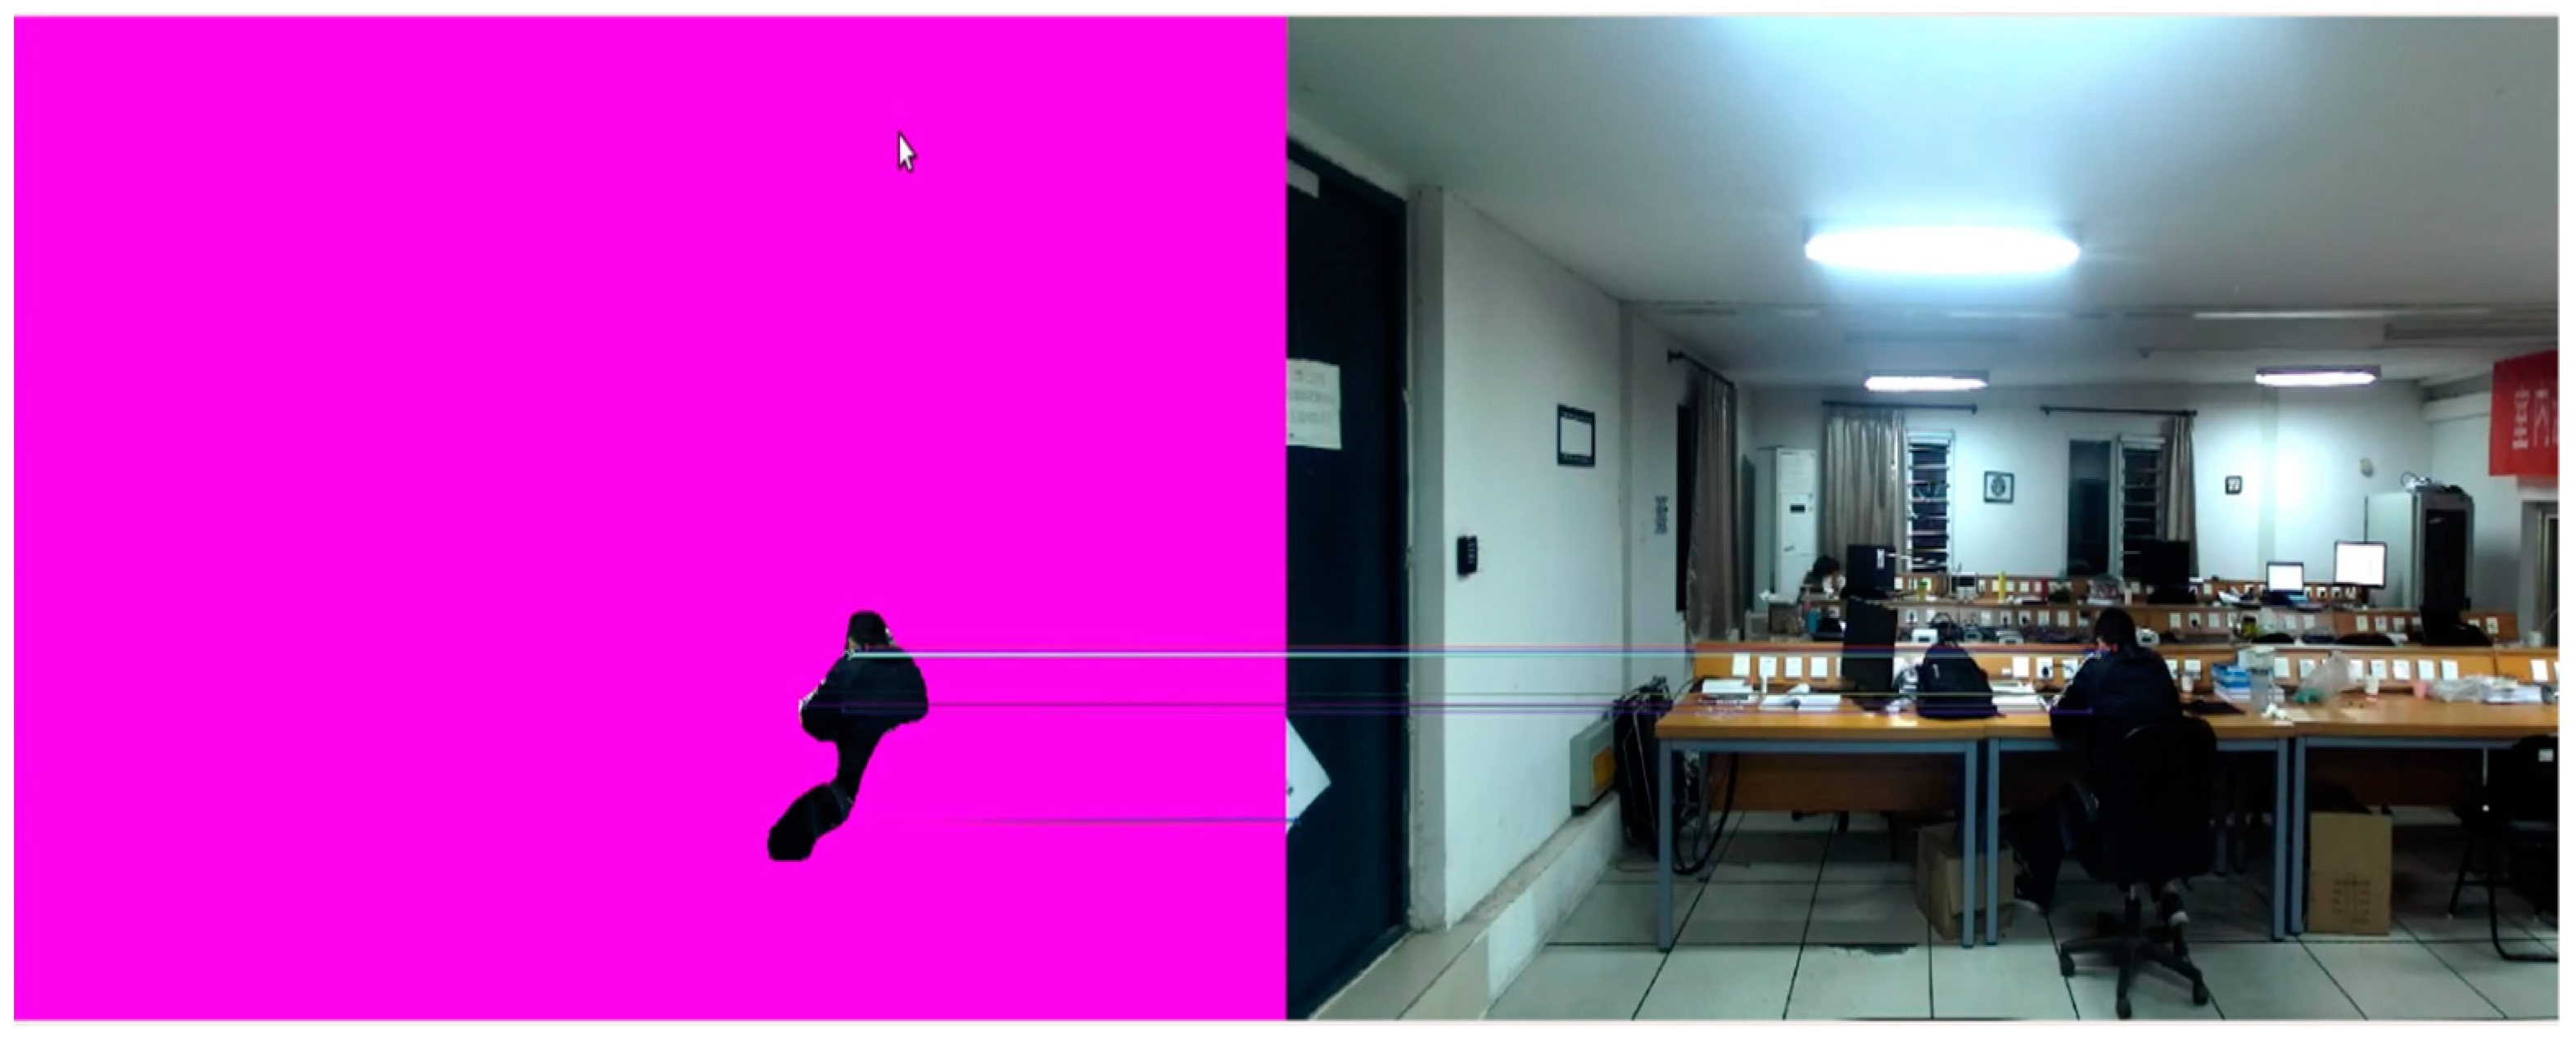
In scenarios with low light conditions, a random collection of images was employed to validate the algorithm’s performance. Many multi-task segmentation algorithms fail to accurately segment in complex indoor environments under dim lighting, resulting in poor segmentation outcomes for relatively small targets such as chairs and people, often leading to incorrect segmentation. However, the visualization results presented in Figure 7 demonstrate that our method can effectively distinguish individuals even in challenging indoor settings where chairs are obstructed and lighting is insufficient.
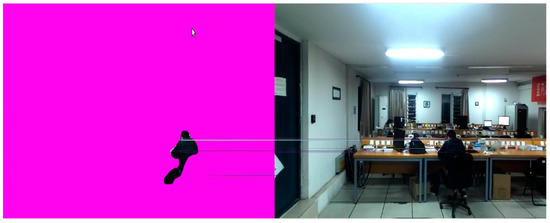
Figure 7.
Result of object segmentation and feature point matching.
4.3. Feature Point Extraction and Matching
In the segmentation area, feature points are extracted and matched, which effectively reduces the matching error and operation time. The experimental comparison methods include the SIFT, SURF, and ORB algorithms as well as our proprietary algorithm. Experimental results are presented in Table 3.
Table 3.
Performance comparison of different feature point matching algorithms.
The performance of our algorithm surpasses that of the SIFT and SURF algorithms in terms of time consumption and matching points, as evidenced by the results presented in Table 3. Furthermore, our algorithm outperforms the ORB algorithm in terms of the number of matching points.
4.4. Location Results and Analysis
4.4.1. Test of Static Positioning Accuracy
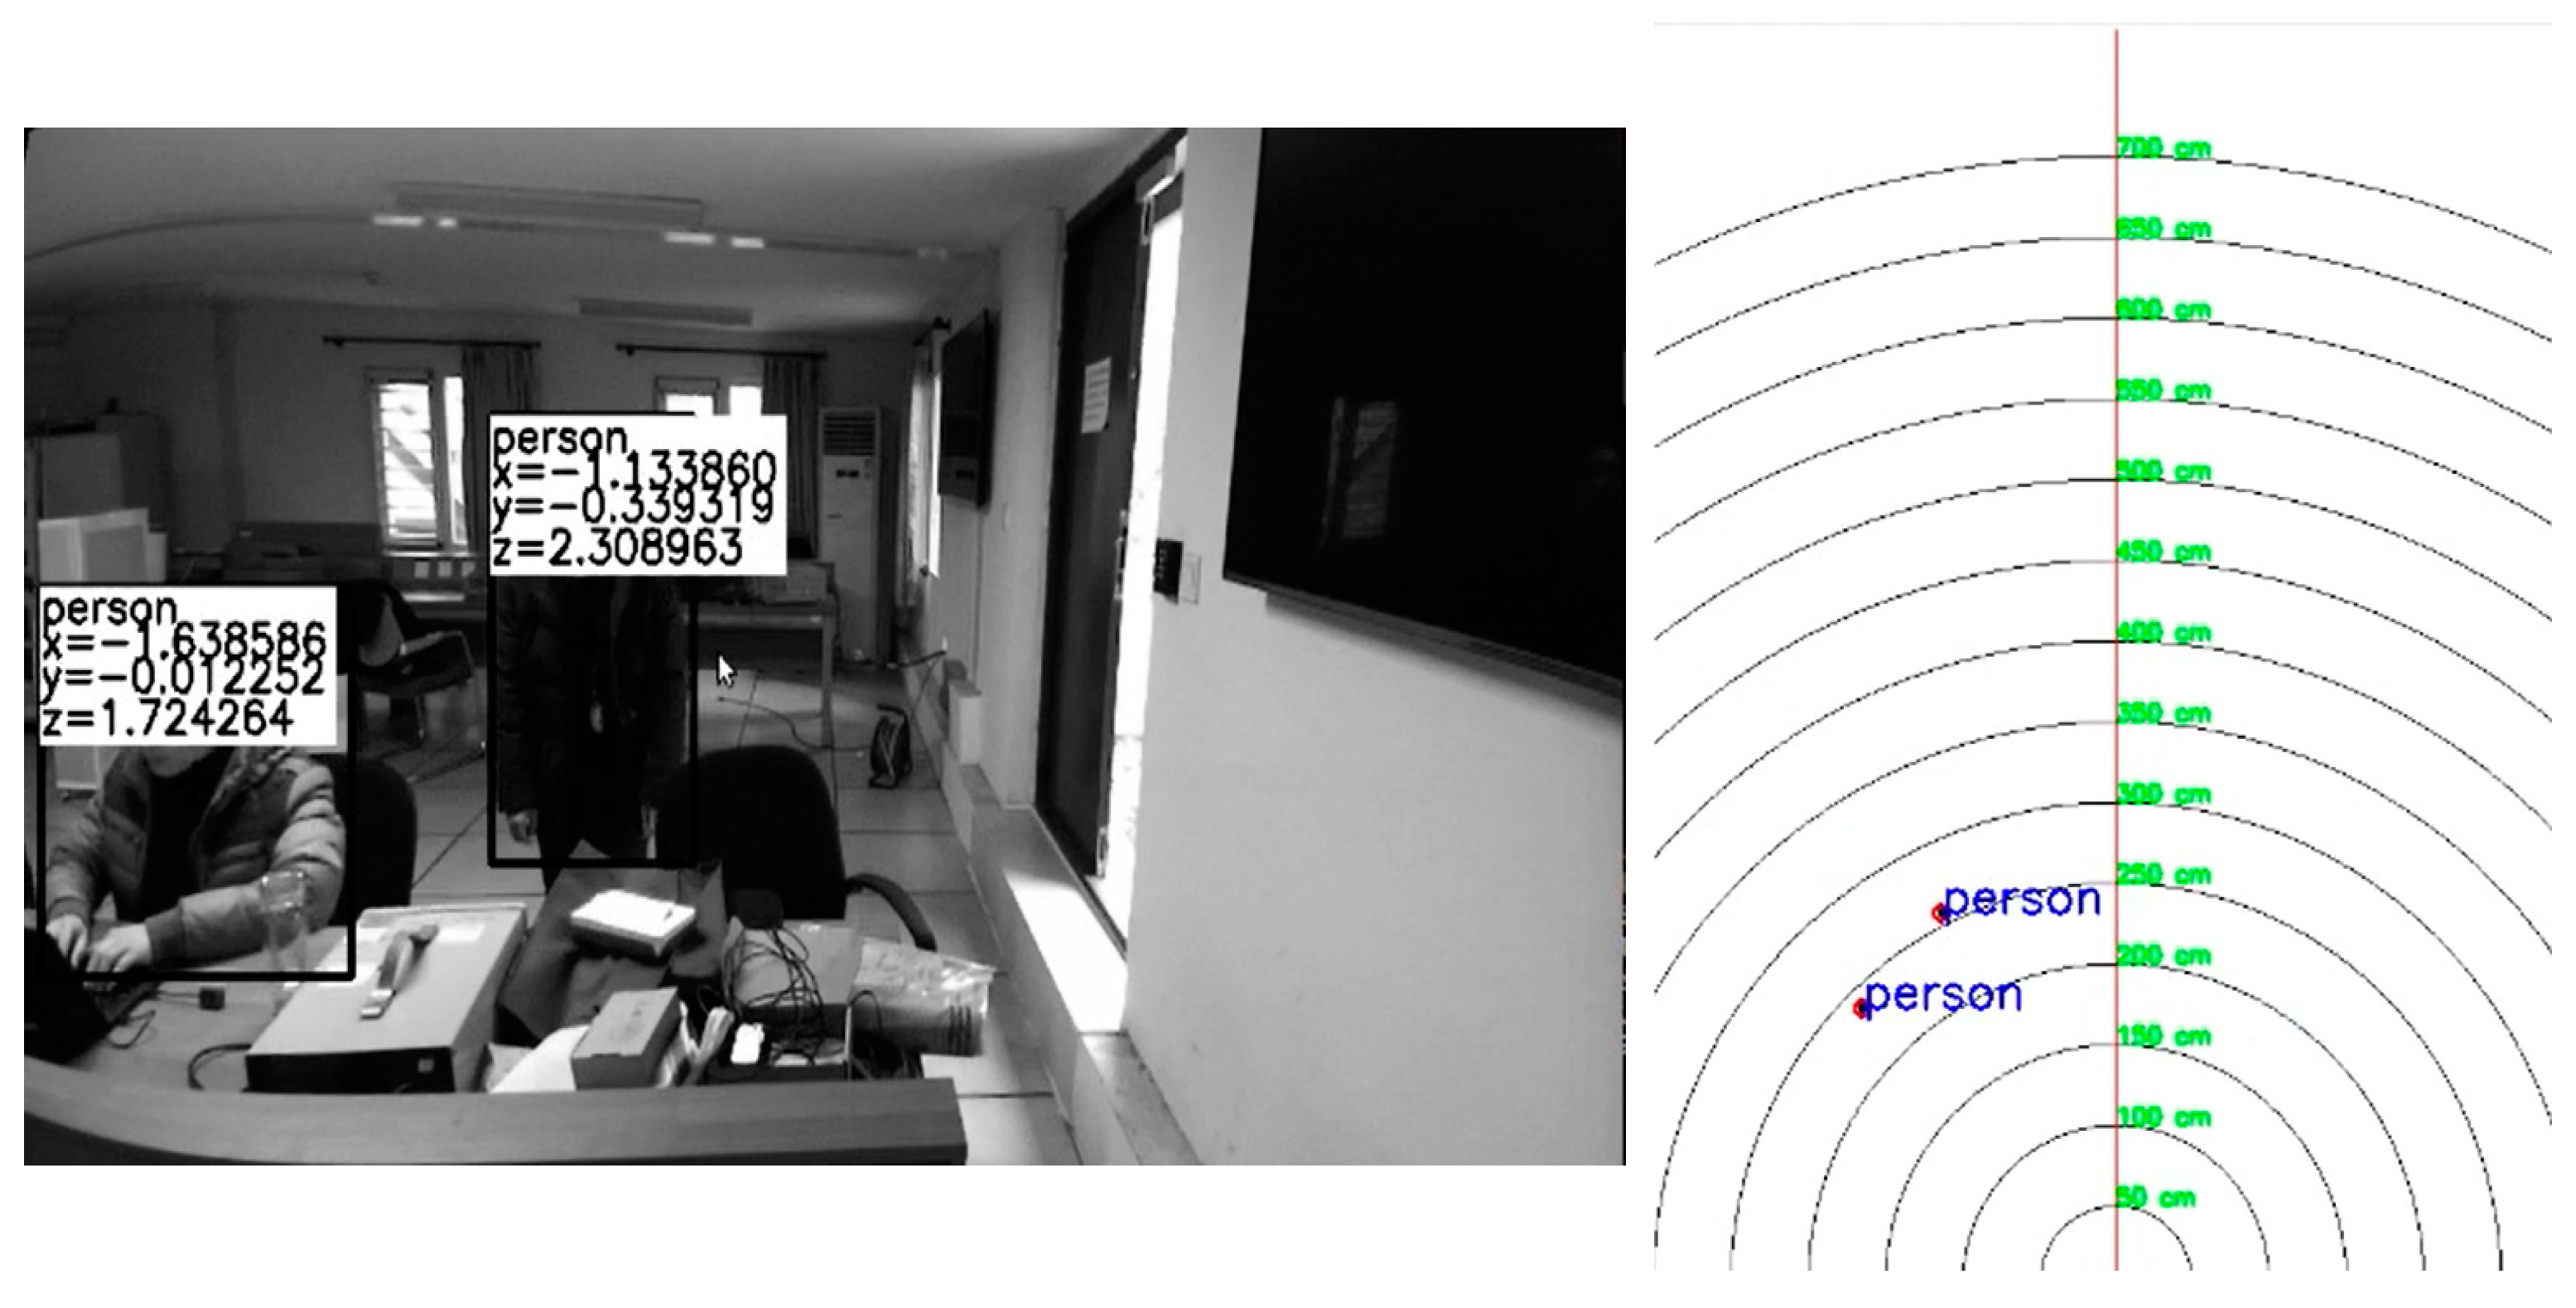
The results of the indoor target’s static positioning are illustrated in Figure 8. The tester remains stationary at various locations within the camera’s field of view, displaying the type and location coordinates of the target.
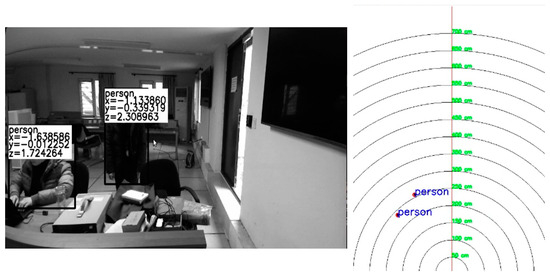
Figure 8.
Results of static positioning.
We employ a total station to accurately measure the precise position of the target. The disparity between ground truth and estimated positions is calculated using the following formula.
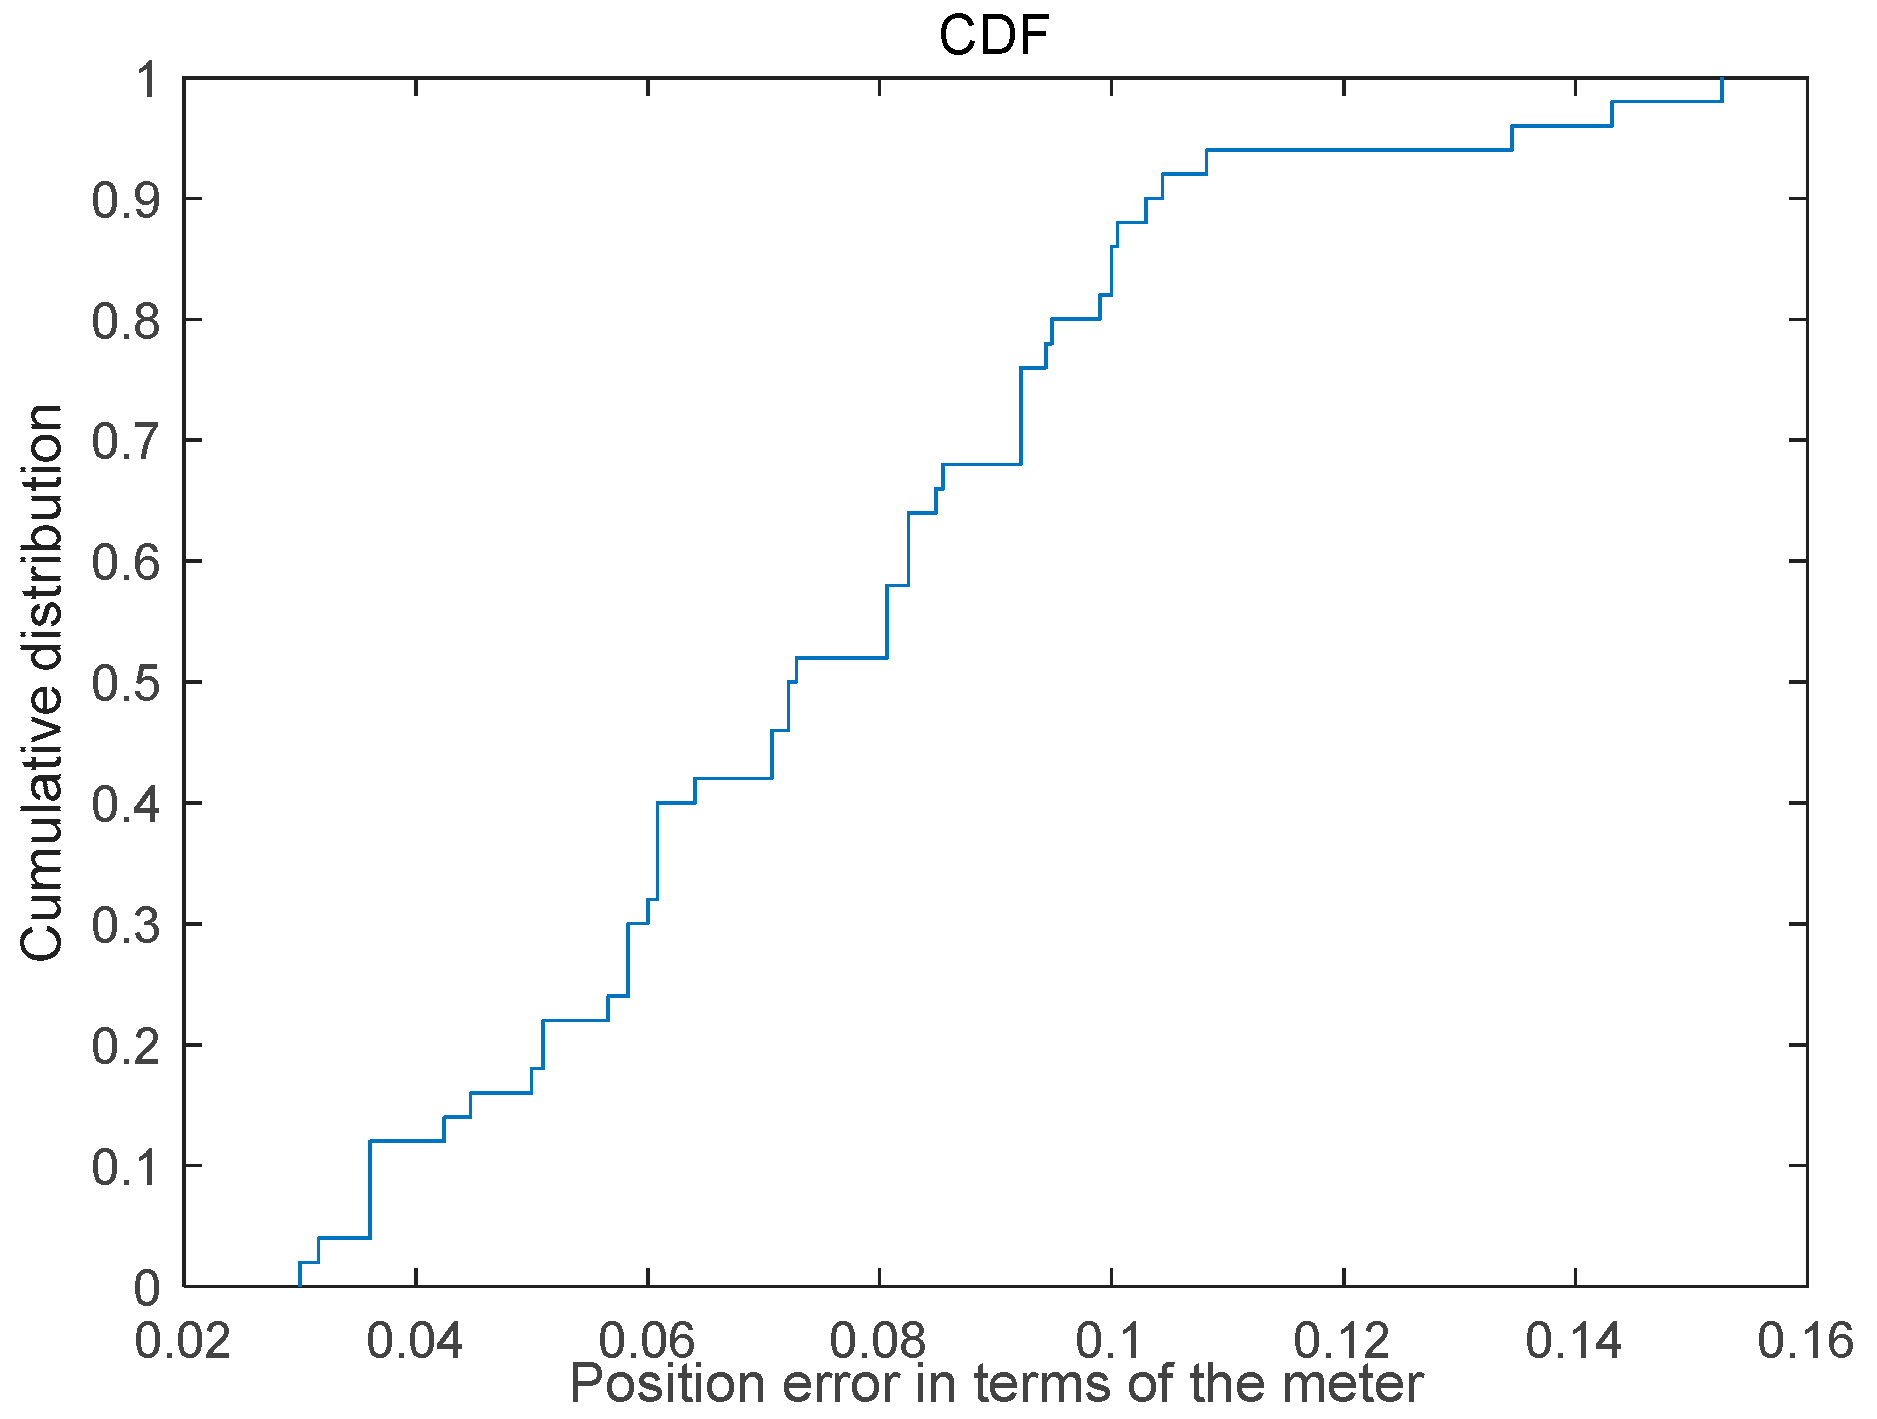
The Cumulative Distribution graph illustrating the static positioning error is presented in Figure 9, revealing that 50% of the positioning results exhibit an error rate below 0.08 m, while 80% demonstrate an error less than 0.1 m; furthermore, the maximum positioning error is below 0.16 m.

Figure 9.
Cumulative distribution graph of the static positioning error.
4.4.2. Test of Dynamic Positioning Accuracy
The tester traverses a rectangular area within the camera’s field of view, and the blue dot represents their movement trajectory as depicted in Figure 10.
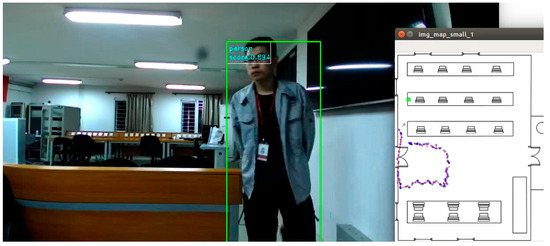
Figure 10.
Results of dynamic positioning.
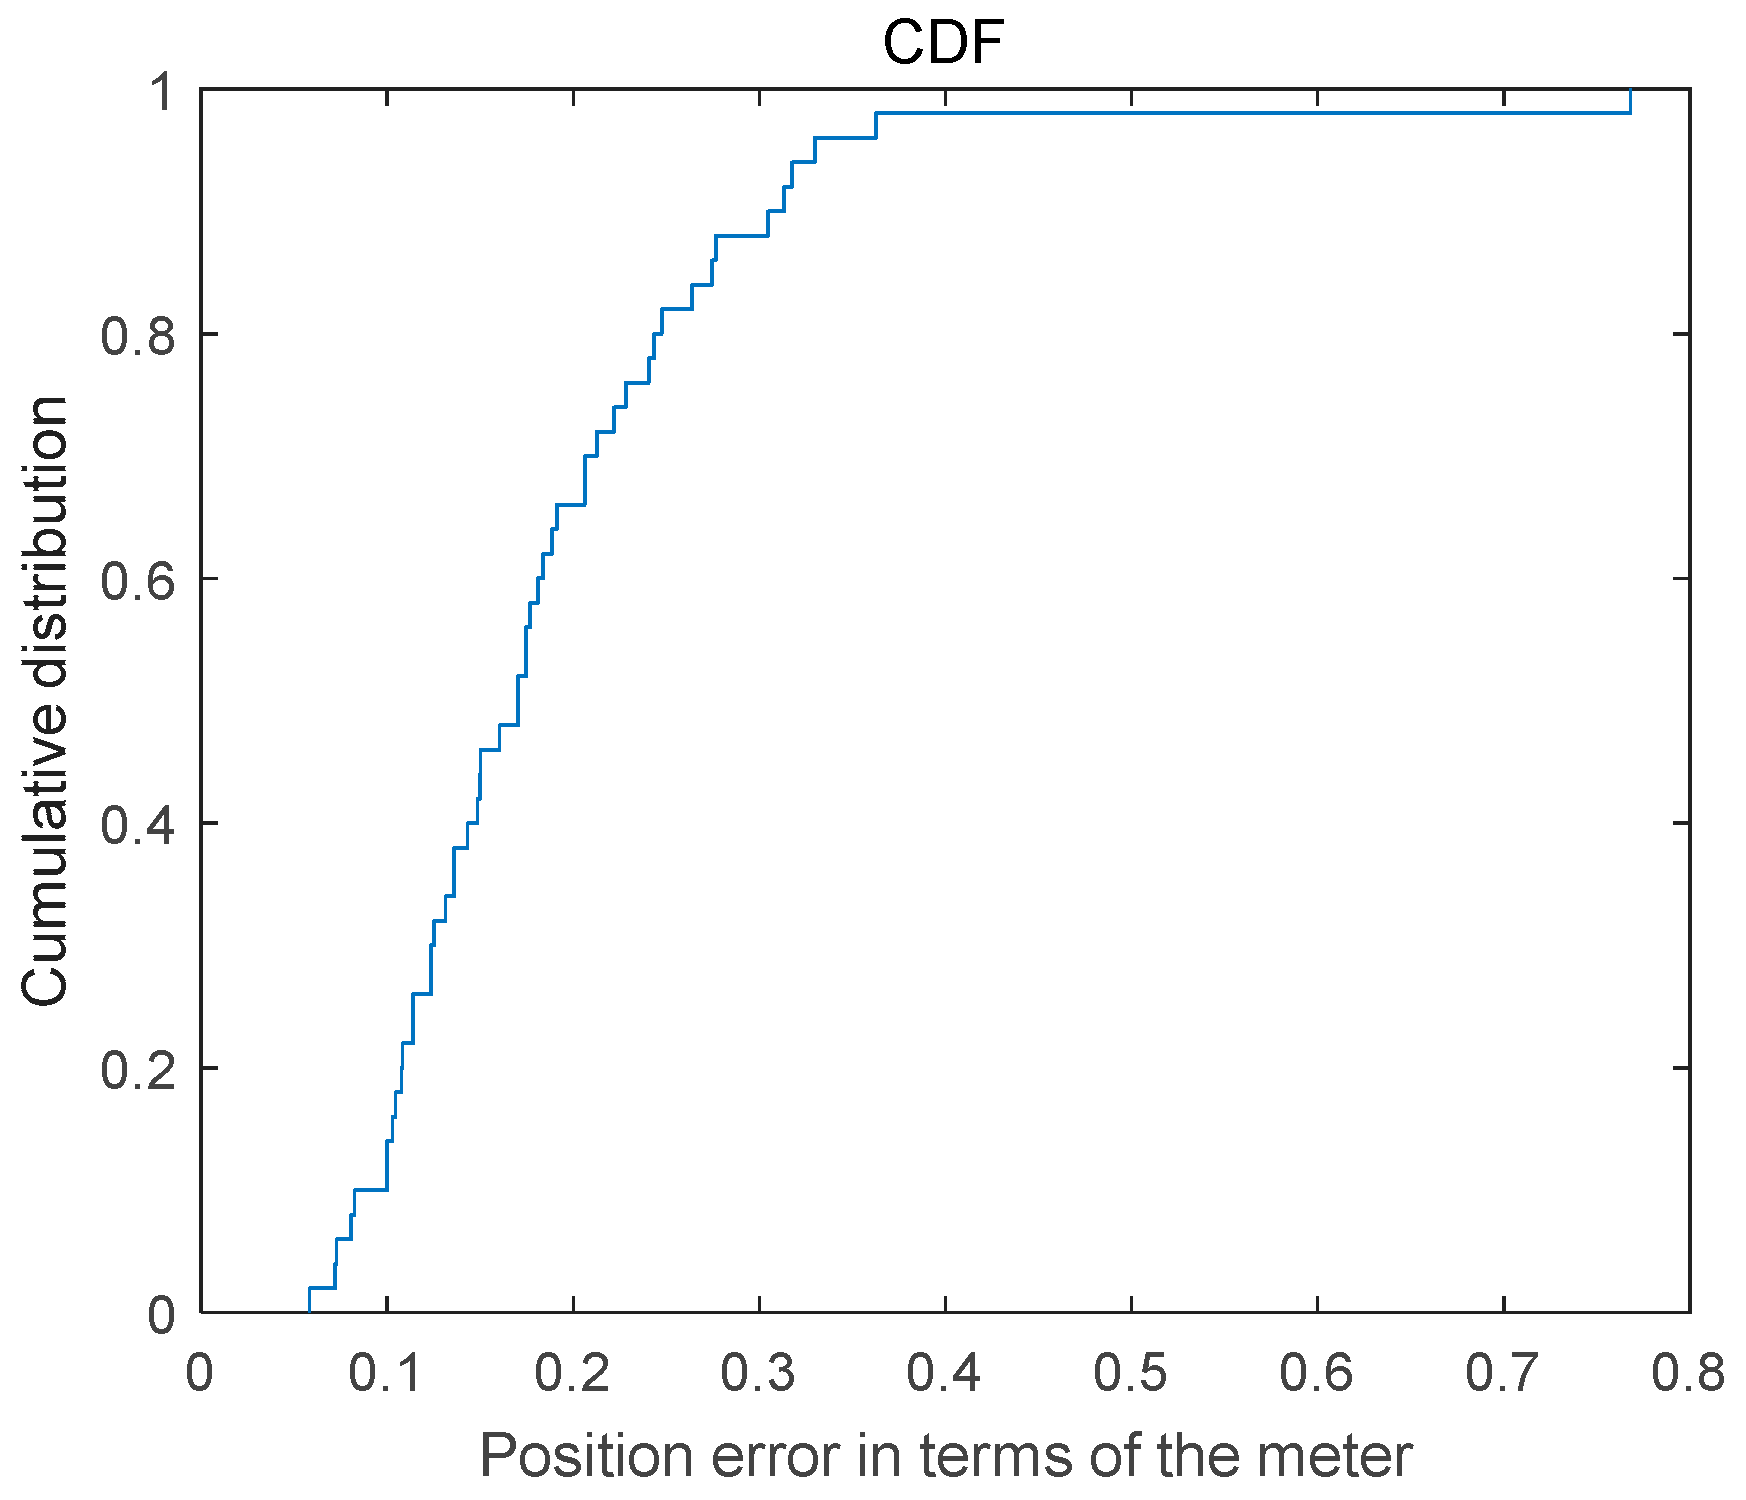
The positioning error calculation method is the same as that described in the previous section. The Cumulative Distribution graph of dynamic positioning error is presented in Figure 11, revealing that 65% of the positioning results exhibit an error below 0.2 m, while 85% demonstrate an error less than 0.3 m. Furthermore, the maximum positioning error is below 0.8 m.
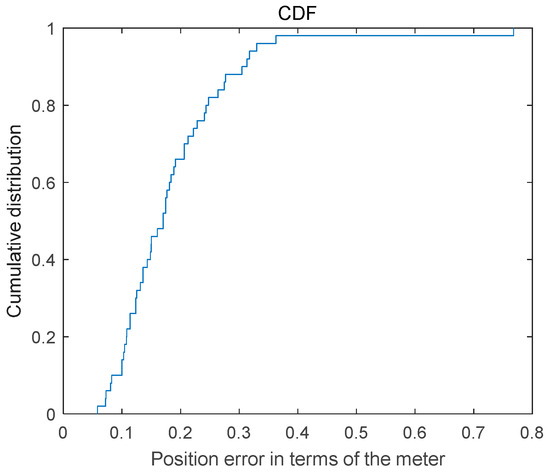
Figure 11.
Cumulative distribution graph of the dynamic positioning error.
The primary causes for the high positioning error are attributed to both instance segmentation and feature matching inaccuracies. Based on our experimental findings, the maximum error observed is less than 0.8 m. This discrepancy can be primarily attributed to challenges in accurately segmenting specific targets due to their similarity with the background, as well as discrepancies between calculated individual features and the actual target location.
5. Conclusions and Future Work
In this paper, we propose a novel approach for spatial localization of targets using binocular cameras and CNNs, which enables accurate identification of the object class and its position. To enhance the accuracy and robustness of target position determination, we introduce a method that integrates semantic information, edge information, and corner information to extract and describe feature points. Additionally, we present preliminary results from indoor positioning tests. The experiments demonstrate that our approach offers high accuracy and stability, with static positioning accuracy at the centimeter level and dynamic positioning accuracy at the decimeter level. Future attention should be given to three tasks: firstly, investigating target continuous tracking algorithms to mitigate computational complexity; secondly, exploring multi-target positioning methods across disparate cameras; and thirdly, exploring strategies to compensate for long-distance errors.
Author Contributions
Conceptualization, S.L., L.W. and B.Y.; methodology, S.L.; software, S.D.; validation, S.D.; formal analysis, S.L.; investigation, L.W.; resources, Z.Y.; data curation, Z.Y.; writing—original draft preparation, S.L.; writing—review and editing, S.L.; visualization, S.L.; supervision, S.L.; project administration, B.Y.; funding acquisition, B.Y. All authors have read and agreed to the published version of the manuscript.
Funding
This study received partial support from the Key Research Development Program of State: (Project No. 2021YFB3900803) and Hebei Province Technology Research and Development platform construction (Project No. 215676105H).
Data Availability Statement
Not applicable.
Conflicts of Interest
The authors declare no conflict of interest.
References
- Li, S.; Yu, B.; Jin, Y.; Huang, L.; Zhang, H.; Liang, X. Image-Based Indoor Localization Using Smartphone Camera. Wirel. Commun. Mob. Com. 2021, 2021, 3279059. [Google Scholar] [CrossRef]
- Wang, L.; Jiang, Q.; Li, S. Research on Fusion Matching Object Recognition and Location Based on Binocular Image Multi-feature Point Fusion. Radio Eng. 2018, 48, 628–633. [Google Scholar]
- Jiang, Q.; Gan, X.; Li, Y. Research of Target Recognition and Positioning Based on CNN Binocular Feature Point Matching. Radio Eng. 2018, 48, 643–649. [Google Scholar]
- Chen, W.; Kumar, S.; Yu, F. Uncertainty-Driven Dense Two-View Structure from Motion. IEEE Robot. Autom. Lett. 2023, 8, 1763–1770. [Google Scholar] [CrossRef]
- Schonberger, J.L.; Frahm, J.M. Structure from Motion Revisited. Computer Vision and Pattern Recognition. In Proceedings of the 2016 IEEE Conference on Computer Vision and Pattern Recognition (CVPR), Las Vegas, NV, USA, 27–30 June 2016; pp. 4104–4113. [Google Scholar]
- Lee, J.; Back, M.; Hwang, S.S.; Chun, I.Y. Improved Real-Time Monocular SLAM Using Semantic Segmentation on Selective Frames. IEEE Trans. Intell. Transp. 2023, 24, 2800–2813. [Google Scholar] [CrossRef]
- Mur-Artal, R.; Montiel, J.; Tardos, J.D. ORB_SLAM: A Versatile and Accurate Monocular SLAM System. IEEE Trans. Robot. 2017, 31, 1147–1163. [Google Scholar] [CrossRef]
- Engel, J.; Koltun, V.; Cremers, D. Direct Sparse Odometry. IEEE Trans. Pattern Anal. 2017, 40, 611–625. [Google Scholar] [CrossRef] [PubMed]
- Engel, J.; Sturm, J.; Cremers, D. Semi-dense Visual Odometry for A Monocular Camera. In Proceedings of the IEEE International Conference on Computer Vision, Sydney, Australia, 1–8 December 2013; pp. 1449–1456. [Google Scholar]
- Ma, X.; Zhong, Y.; Dian, S. Segmentation and Location Method of Foreign Objects in GIS Based on Binocular Vision. Instrum. Tech. Sens. 2022, 10, 88–98. [Google Scholar]
- Wu, D.; Chen, R.; Yu, Y.; Zheng, X.; Xu, Y.; Liu, Z. Indoor Passive Visual Positioning by CNN-Based Pedestrian Detection. Micromachines 2022, 13, 1413. [Google Scholar] [CrossRef] [PubMed]
- Ojala, R.; Vepsäläinen, J.; Pirhonen, J.; Tammi, K. Infrastructure Camera Calibration with GNSS for Vehicle Localisation. IET Intell. Transp. SY 2022, 17, 341–356. [Google Scholar] [CrossRef]
- Liu, W.; Anguelov, D.; Erhan, D.; Szegedy, C.; Reed, S.; Fu, C.Y.; Berg, A. C SSD: Single Shot Multibox Detector. In Proceedings of the European Conference on Computer Vision, Amsterdam, The Netherlands, 11–14 October 2016; pp. 21–37. [Google Scholar]
- Redmon, J.; Farhadi, A. YOLO9000: Better, Faster, Stronger. In Proceedings of the IEEE Conference on Computer Vision and Pattern Recognition, Honolulu, HI, USA, 21–26 July 2017; pp. 6517–6525. [Google Scholar]
- Girshick, R. Fast R-CNN. In Proceedings of the IEEE International Conference on Computer Vision, Santiago, Chile, 7–13 December 2015; pp. 1440–1448. [Google Scholar]
- Ren, S.; He, K.; Girshick, R.; Sun, J. Faster R-CNN: Towards Real-Time Object Detection with Region Proposal Networks. IEEE Trans. Pattern Anal. 2017, 39, 1137–1149. [Google Scholar] [CrossRef] [PubMed]
- Badrinarayanan, V.; Kendall, A.; Cipolla, R. SegNet: A Deep Convolutional Encoder-Decoder Architecture for Image Segmentation. IEEE Trans. Pattern Anal. 2017, 29, 2481–2495. [Google Scholar] [CrossRef]
- Lin, G.; Liu, F.; Milan, A.; Shen, C.; Reid, I. RefineNet: Multi-Path Refinement Networks for Dense Prediction. IEEE Trans. Pattern Anal. 2020, 42, 1228–1242. [Google Scholar] [CrossRef]
- Chen, L.C.; Papandreou, G.; Schroff, F.; Adam, H. Rethinking Atrous Convolution for Semantic Image Segmentation. arXiv 2017, arXiv:1706.05587. [Google Scholar]
- Cai, Z.; Fan, Q.; Feris, R.S.; Vasconcelos, N. A Unified Multi-scale Deep Convolutional Neural Network for Fast Object Detection. In Proceedings of the European Conference on Computer Vision, Amsterdam, The Netherlands, 11–14 October 2016; pp. 354–370. [Google Scholar]
- Luo, J.; Gwun, O.A. Comparison of SIFT, PCA-SIFT and SURF. Int. J. Image Process. 2009, 3, 143–152. [Google Scholar]
- Herbert, B.; Tinne, T.; Luc, V.G. SURF:S peed Up Robust Features. In Proceedings of the European Conference on Computer Vision, Graz, Austria, 7–13 May 2006; pp. 404–417. [Google Scholar]
- Rublee, E.; Rabaud, V.; Konolige, K.; Bradski, G. ORB: An Efficient Alternative to SIFT or SURF. In Proceedings of the IEEE International Conference on Computer Vision, Providence, RI, USA, 16–21 June 2012; pp. 2564–2571. [Google Scholar]
- DeTone, D.; Malisiewicz, T.; Rabinovich, A. SuperPoint: Self-Supervised Interest Point Detection and Description. In Proceedings of the IEEE conference on computer vision and pattern recognition workshops, Salt Lake City, UT, USA, 18–23 June 2018; pp. 224–236. [Google Scholar]
- Kendall, A.; Grimes, M.; Cipolla, R. PoseNet: A Convolutional Network for Real-Time 6-DOF Camera Relocalization. In Proceedings of the IEEE International Conference on Computer Vision (ICCV), Santiago, Chile, 7–13 December 2015; pp. 2938–2946. [Google Scholar]
- He, K.; Zhang, X.; Ren, S.; Sun, J. Deep Residual Learning for Image Recognition. In Proceedings of the IEEE Conference on Computer Vision and Pattern Recognition (CVPR), Las Vegas, NV, USA, 27–30 June 2016; pp. 770–778. [Google Scholar]


Disclaimer/Publisher’s Note: The statements, opinions and data contained in all publications are solely those of the individual author(s) and contributor(s) and not of MDPI and/or the editor(s). MDPI and/or the editor(s) disclaim responsibility for any injury to people or property resulting from any ideas, methods, instructions or products referred to in the content. |
© 2023 by the authors. Licensee MDPI, Basel, Switzerland. This article is an open access article distributed under the terms and conditions of the Creative Commons Attribution (CC BY) license (https://creativecommons.org/licenses/by/4.0/).