Abstract
Broomrapes (Orobanche and Phelipanche spp.) are non-achlorophyllous parasitic plants belonging to the Orobanchaceae family, with some species evolving to infest agricultural crops, causing substantial economic losses. This study focuses on Orobanche and Phelipenche species prevalent in Tunisia, particularly Orobanche crenata, Orobanche foetida and Phelipanche ramosa, which pose a significant threat to legume crops and other agronomically important plants. These parasitic species cause severe damage before their aboveground appearance, making early detection and management crucial. Successful breeding programs targeting their hosts necessitate a comprehensive understanding of the genetic variability within different broomrape populations. A plethora of molecular markers, including RAPD, ISSR, AFLP, SSR and SNPs, were employed to evaluate the genetic diversity of Orobanche spp., mainly in Mediterranean countries. This research seeks to analyze the genetic variability and structure of thirty-four (34) Tunisian Orobanche and Phelipanche populations infesting various crops and wild plants. The results demonstrated a higher genetic differentiation within populations rather than between populations and no clear differentiation based on the geographic origins of the populations. By measuring the genetic diversity of a large number of broomrape populations that affect both wild species and crops, this study aims to support efforts toward establishing effective management approaches.
1. Introduction
The non-chlorophyllous parasitic plants known as Broomrapes (Orobanche and Phelipanche spp.) belong to the Orobanchaceae family [1,2]. There are approximately 150 recorded species of broomrapes, most of which infest wild plants in natural habitats without causing economic problems; few of them have become serious weeds that infest important crops as obligate holophrastic root weeds. In this context, the most damaging broomrapes are O. crenata, O. cernua, O. cumana, O. foetida, O. minor, P. aegyptiaca and P. ramosa, which cause serious problems, and even the total loss of production, in important dicot crops in African, Asian and European countries; these species are constantly expanding into new areas, demonstrating their ability to evolve, thus expanding their host range [3].
Indeed, having a better understanding of the genetic evolution, differentiation and spread of these parasites is very urgent, as broomrapes are becoming a real threat to food security. In addition, the controversial phenotypic classification of broomrapes, which is a very hard task due to the reduced number of phenotypic descriptors, is leading taxonomists to errors. For these reasons, the use of molecular tools is necessary to identify and differentiate properly different broomrape species. In Tunisia, the dominant broomrape species are O. crenata, O. foetida and P. ramosa, with no accurate estimation of their impact on Tunisian agriculture even though 5000–70,000 (ha) hectares of legume crops could be infected [4]. In order to overcome this problem, some farmers have been replacing sensitive legume crops with others, such as sunflowers, oilseed rape and garlic (personal observation). However, the above strategy is not sound since the first infestation of O. cumana in sunflowers has been reported, particularly in the most infected regions (i.e., the Beja region) [5].
In this context, a recent large screening of sunflower collection in infested fields, inoculated pots and square rhizotrons infected by O. cumana shown phenotypic parasitism variability, from sensitivity to partial resistance [6]. As such, in Tunisia, the recent efforts made by seed companies and some farmers to promote oil seed rape or canola will face a serious problem of infestation by P. ramosa [7].
Yield losses due to Orobanche spp. and Phelipanche spp. infestation range from 20–80% [8]. O. crenata is mostly spread in the western–northern, northern, and central–eastern regions of the country, especially in faba bean crops, where losses caused by the parasite can reach up to 97% [9], whereas O. foetida, which is an emerging threat for faba beans, is mainly found in northern and northern–western parts of Tunisia. Finally, P. ramosa is reported to attack legumes, tobacco and many vegetable crops, as well as oil seed rape [7].
Broomrapes cause severe damage even before their appearance aboveground. Therefore, most crop losses may occur before the infestation is clearly observed. In the literature, many different strategies have long been proposed, such as hygiene and prevention measures, the use of selective herbicides, biological control, soil treatment with fumigants, sun disinfection and trap crops. Nevertheless, they have not provided sufficient controls representing poor solutions in real-field, large-scale conditions. The key strategy, therefore, is to develop resistant crops via breeding, supported by a rapid, accurate and reliable diagnostic method for the detection of the tissues or spores of the pest in soil samples from infected crops [10].
To develop successful breeding programs toward crop tolerance or resistance to parasitic weeds, a strong emphasis should be placed on investigating and identifying the genetic variability within and among broomrape populations since their virulence depends on their genetic structure and high diversity [11,12]. Given the controversial phenotypic classification of broomrapes and the reduced number of phenotypic descriptors, the use of molecular tools is necessary to properly identify and differentiate different broomrape species. Modern breeding efforts are always indicating the use of molecular markers to thoroughly examine the diversity of the genetic material in use [13,14]. Several studies have been carried out in recent years to analyze the genetic diversity of Orobanche spp./Phelipanche spp. using molecular markers, mostly in countries of the Mediterranean region (i.e., Spain, Tunisia, Morocco, Algeria, Turkey) but also in other countries such as Ethiopia, Iran, Bulgaria, etc.
The most popular molecular markers are RAPD [15,16,17,18], ISSR [19,20,21] and AFLP [22,23] used separately or in combinations [2,24]. SSR markers are currently being developed and have provided useful information in several cases [12,25,26]. Moreover, in recent years, the utility of more advanced molecular techniques, such as high-resolution melting analysis (HRM) [27] and SNP coupled with sequencing [11,28], have been recognized as the most appropriate means of precisely characterizing and distinguishing different broomrape species. However, these techniques cannot be applied in large-scale screening experiments because of cost limitations.
Certain problems are highlighted when working with broomrape genetic variability screening. These species do not form leaves and have complex vegetative organs that lead to many errors and confusion; as such, there are no standardized descriptors for the description or classification of these species. Indeed, the majority of studies dealing with the identification or genetic diversity of broomrapes tend to be very objective and based on the morphology/characteristics of the flowers or seeds with no sound discrimination criteria. Furthermore, the classification of Orobanche spp. is further complicated by the inherent variability and interaction of these species with their hosts [29].
The objective of this study is to document the genetic variability and structure of thirty-four (34) populations of O. crenata, O. foetida and P. ramosa and wild species from the northwestern region of Tunisia, which is the main grain legume cultivation area, among other crops.
2. Materials and Methods
2.1. Sampled Broomrapes and Their Geographic Localization
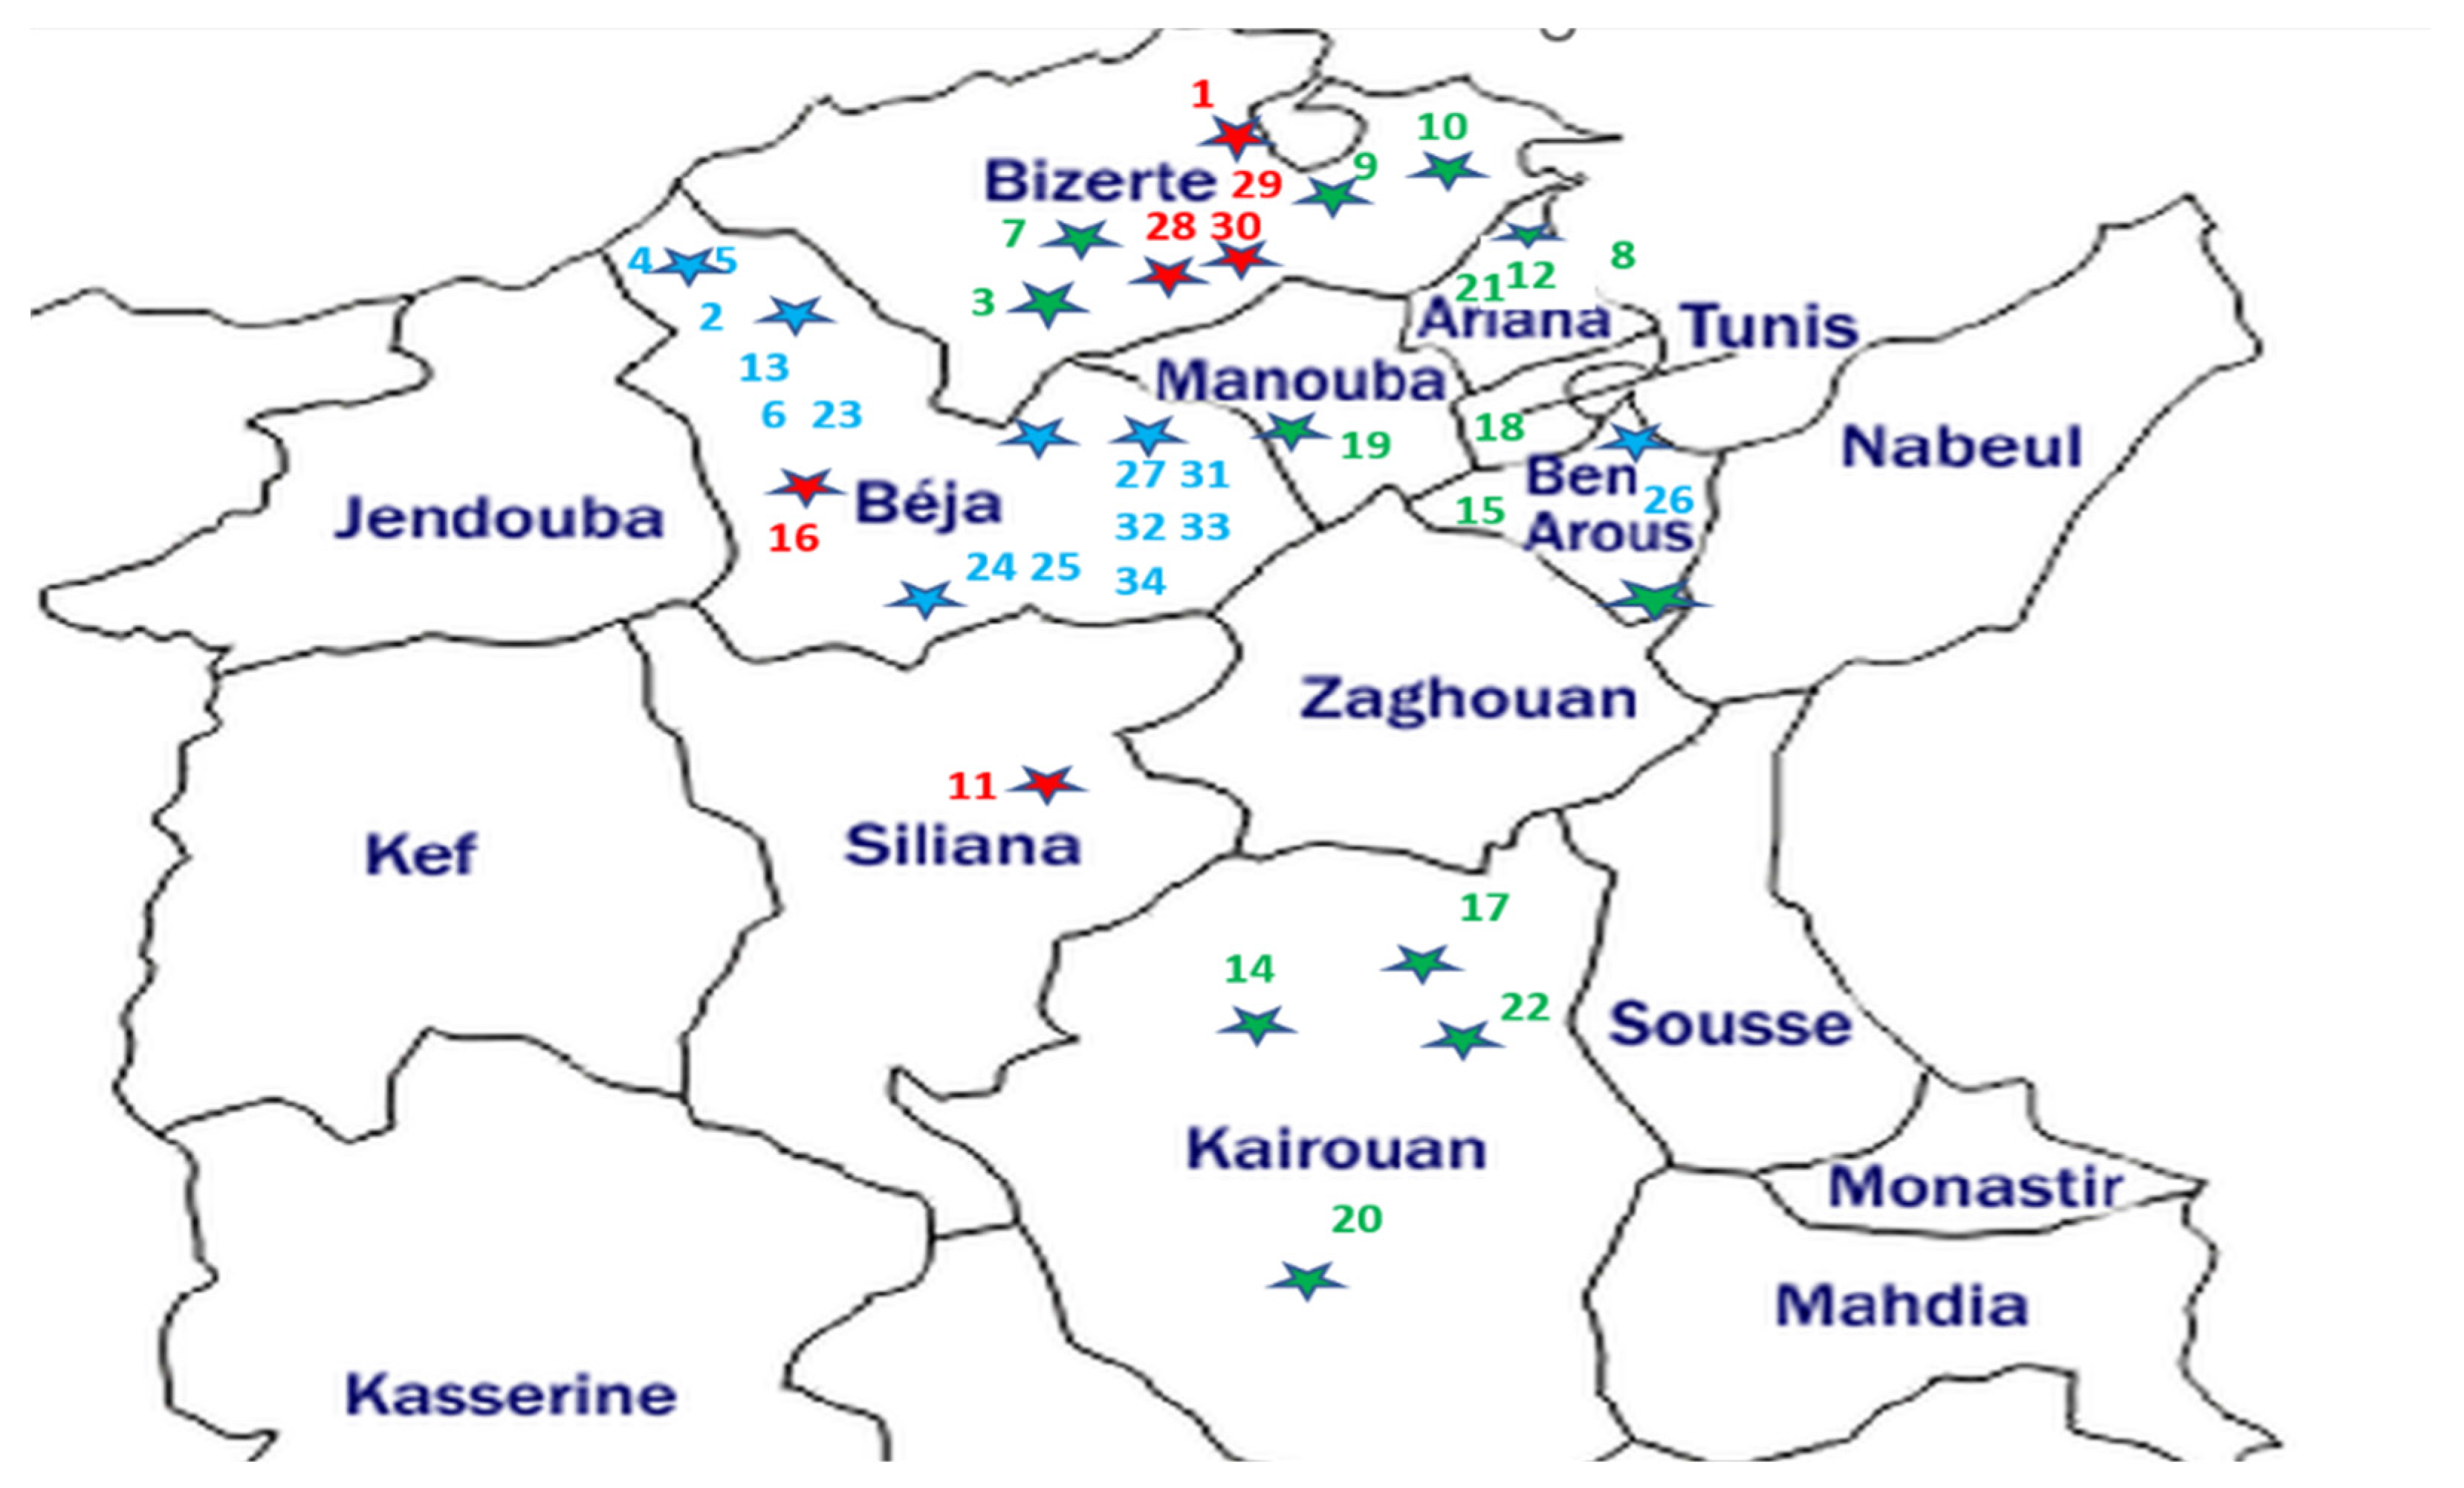
The broomrape samples consisted of the spikes (stem and flowers) of thirty-four O. crenata, O. foetida and P. ramosa populations affecting different crops and wild species from the northern and central prospected regions of Tunisia. The geographic localization of the sampled broomrapes and their respective hosts are summarized in Table 1 and Figure 1.

Table 1.
Sampling localization of weed parasites and their host plant species.
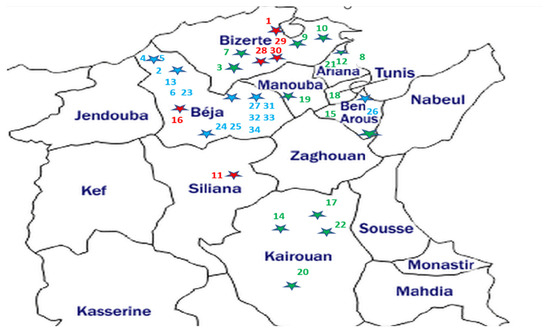
Figure 1.
Geographical location map of the studied parasitic weeds affecting food legumes and weeds in Tunisia. The host sample IDs are from Table 1. Parasite samples—blue: O. foetida; green: O. crenata; red: P. ramosa. Each dot star is indicating the sampling site with its parasite corresponding color.
2.2. DNA Extraction Protocol
Whole genomic DNA was taken from the fresh floral buds (100 mg per sample) of each Orobanche sp. and Phelipanche sp. Each sample was a unique spike found attached to the respective host. We used a modified protocol [30] including 2% cetyltrimethylammonium bromide (CTAB) buffer (Table 2). DNA quantity/µL and quality were evaluated via both spectrophotometric absorbance (260 nm and 280 nm) and 1% ethidium bromide-stained agarose gel electrophoresis.

Table 2.
DNA extraction modified minipreparation composition [31,32].
2.3. Primer and Polymorphic Chain Reaction (PCR) Condition
Nine-base-long RAPD primers (OPERON Technologies, Louisville, KY, USA) were analyzed (Table 3). These primers were carefully chosen because of their high polymorphism and repeatability in studies with O. crenata and O. foetida [18,31,32,33,34], such as OPF-03 or our unpublished preliminary results.

Table 3.
Used RAPD polymorphic primer sequences.
The RAPD-PCR amplifications were performed in a 25 μL volume mix for each sample consisting of 12.5 µL of a standardized 10X PCR ready-to-use master mix (Promega, MW, USA), 2 μL of 30 ng/µL template genomic DNA and GoTaq DNA polymerase (Promega, WI, USA) following Table 4. Amplification was executed via a standard RAPD-PCR program using an ‘’Simpliamp” (Applied Biosystems, CA, USA) 96-Well Thermal Cycler (Table 5).

Table 4.
PCR reaction mix composition.

Table 5.
PCR program for amplification of RAPD primers.
Amplicons were visualized via electrophoresis with 3% agarose gels with ethidium bromide-stained DNA. The sizing of amplicons was performed via comparison to a standard DNA ladder, 100 bp (Promega, USA). The RAPD dominant-marker-amplified bands were scored as 0 (absent) or 1 (present) in the scoring matrix.
2.4. Data Analysis
The Rp index (resolving power index) was calculated to estimate the ability of the nine RAPD primers to differentiate between genotypes following the formulation below [32]:
Ib: amplicon’s informativeness; p: percentage of individuals containing amplicon I.
Moreover, the PIC index (polymorphism information content) was determined to assess the efficacy of each RAPD primer in identifying polymorphic loci both within and across populations using the following equation:
Pi is the ith allele’s frequency [35].
The usefulness per marker was evaluated indirectly via the indices: PPB (the proportion of polymorphic bands or amplicon), MI (marker index) and EMR (effective multiplex ratio), as described by [36]. The binary data matrix resulting from the RAPD polymorphism was processed through the PopGene software (Version 1.31) based on the assumption of Hardy–Weinberg equilibrium [37]. This analysis provided a structure of measurement for the population’s genetic diversity degree, including Nei’s genetic diversity index (H) [38], PPB and the Shannon (I) information index. Nei’s gene diversity statistics [39] were utilized to determine the amount of gene or interpopulation differentiation for several loci (GST). The method outlined by [40] was employed to estimate gene flow (Nm) following the formula below:
Furthermore, a molecular variation analysis within broomrape species (AMOVA) was conducted to determine RAPD’s statistical variance components. This analysis divided the variation both within and between species using the GenAlEx 6.5 software [41]. A non-parametric test was used to estimate p-value significance after 1000 random permutations. The neighbor-joining (NJ) method was selected to construct a dendrogram. To assess the dependability of the clusters, a bootstrapping analysis was carried out with 1000 resamples using the DARwin software, version 5.0.158 [42].
The diversity and differentiation between individuals (genetic relationships) were evaluated through principal coordinate analysis (PCoA) using PAST version 2.17c [43].
The genetic structure of the population was inferred through Bayesian methods of clustering implemented in STRUCTURE version 2.3.4 [44].
An ad hoc method to assess the probable number of clusters, K, based on ΔK was developed by [45]. ΔK is a statistic used to determine the optimal number of genetic clusters (K) in a population when performing Bayesian clustering analysis. The formula for ΔK is as follows:
where L′ (K) represents the mean likelihood of K; L(K − 1)| represents the mean likelihood of K minus one (the previous K value); and s(K) represents the standard deviation of the likelihood values of K.
ΔΚ = |L′ (K) − L(K − 1)|/s(K)
The K with the highest ΔK is considered the optimal number of genetic clusters. This statistic is valuable for determining the genetic structure of populations and understanding how individuals group together based on their genetic data.
Within STRUCTURE, we operated under an admixture model, considering the prior data from the sampling site. In total, 10 repetitions were executed to the respective potential values of K (ranging from K = 1 to K = 6) consisting of 70,000 repetitions and 100,000 burn-in steps. The online tool STRUCTURE Harvester was used as an easier way to distinguish the sum of genetically similar groups (K) that best fit the data that we employed [44,45]. To ensure a better arrangement of independent runs, we utilized CLUMPP version 1.1.2 [46], employing the “Greedy” algorithm. This involved 10,000 random input sequences and an extra 10,000 repetitions that provided the pairwise similarity score (H′) of the runs. Eventually, the Distruct version 1.1 visualization tool [47] was used for cluster representation.
3. Results
3.1. RAPD Polymorphism
We evaluated the capability of the ten selected RAPD Operons (B, D, E, F, G, H and J) for the random amplification of selected genotypes using PCR. The characteristics of these primers, when applied to the thirty-three genotypes tested, are detailed in Table 6. Out of the 10 primers used, 98 bands were recorded, with 97 (or 98.98%) of them being polymorphic. The sum of polymorphic amplicons using different RAPD primers varied from 6 (OPG12 and OPG14) to 15 (OPJ01). All primers had 100% polymorphism except the OPD20 primer (88%) (Table 6). The primer’s Rp value varied from 2.26 (OPG12) to 6.82 (OPJ01); meanwhile, all primers registered high PIC, varying from 0.79 (for OPG12) to 0.92 (for OPJ01), with an average of 0.87.

Table 6.
Polymorphism features of the ten RAPD primers for the thirty-four Orobanche sp. and Phelipanche sp. samples.
3.2. Genetic Diversity and Structure Explored Using RAPD Markers
O. crenata has the highest diversity estimators with I = 0.483 and PPB = 91.84%, whereas P. ramosa has the lowest: I = 0.391 and PPB = 72.45% (Table 7). The GST provided a value of 0.207, and the AMOVA showed that 70.31% of the total genetic variability happened within species and 29.69% between species (Table 8).

Table 7.
Genetic variation statistics and Shannon’s diversity estimation for three broomrapes species.

Table 8.
AMOVA of Tunisian broomrapes.
The low frequency of genetic variability between the broomrape species is supported by the high gene flow (Nm = 1.912).
To calculate allelic frequencies in the absence of genotypic information, which is the case for the markers studied (RAPD), we assumed the following:
- -
- Alleles from different loci never co-migrate in a gel;
- -
- Each locus has bi-allelic determinism.
The two molecular phenotypes’ presence, [A], and absence, [a], of a fragment actually correspond to three genotypes: (AA), (Aa) and (aa) (heterozygotes (Aa) and homozygotes (AA) represent the same phenotype, [A]). In this sense, estimates of genetic diversity based on RAPD markers were carried out with reference to the work of Lynch and Milligan (1994).
3.3. Neighbor-Joining Method and Principal Coordinate Analysis
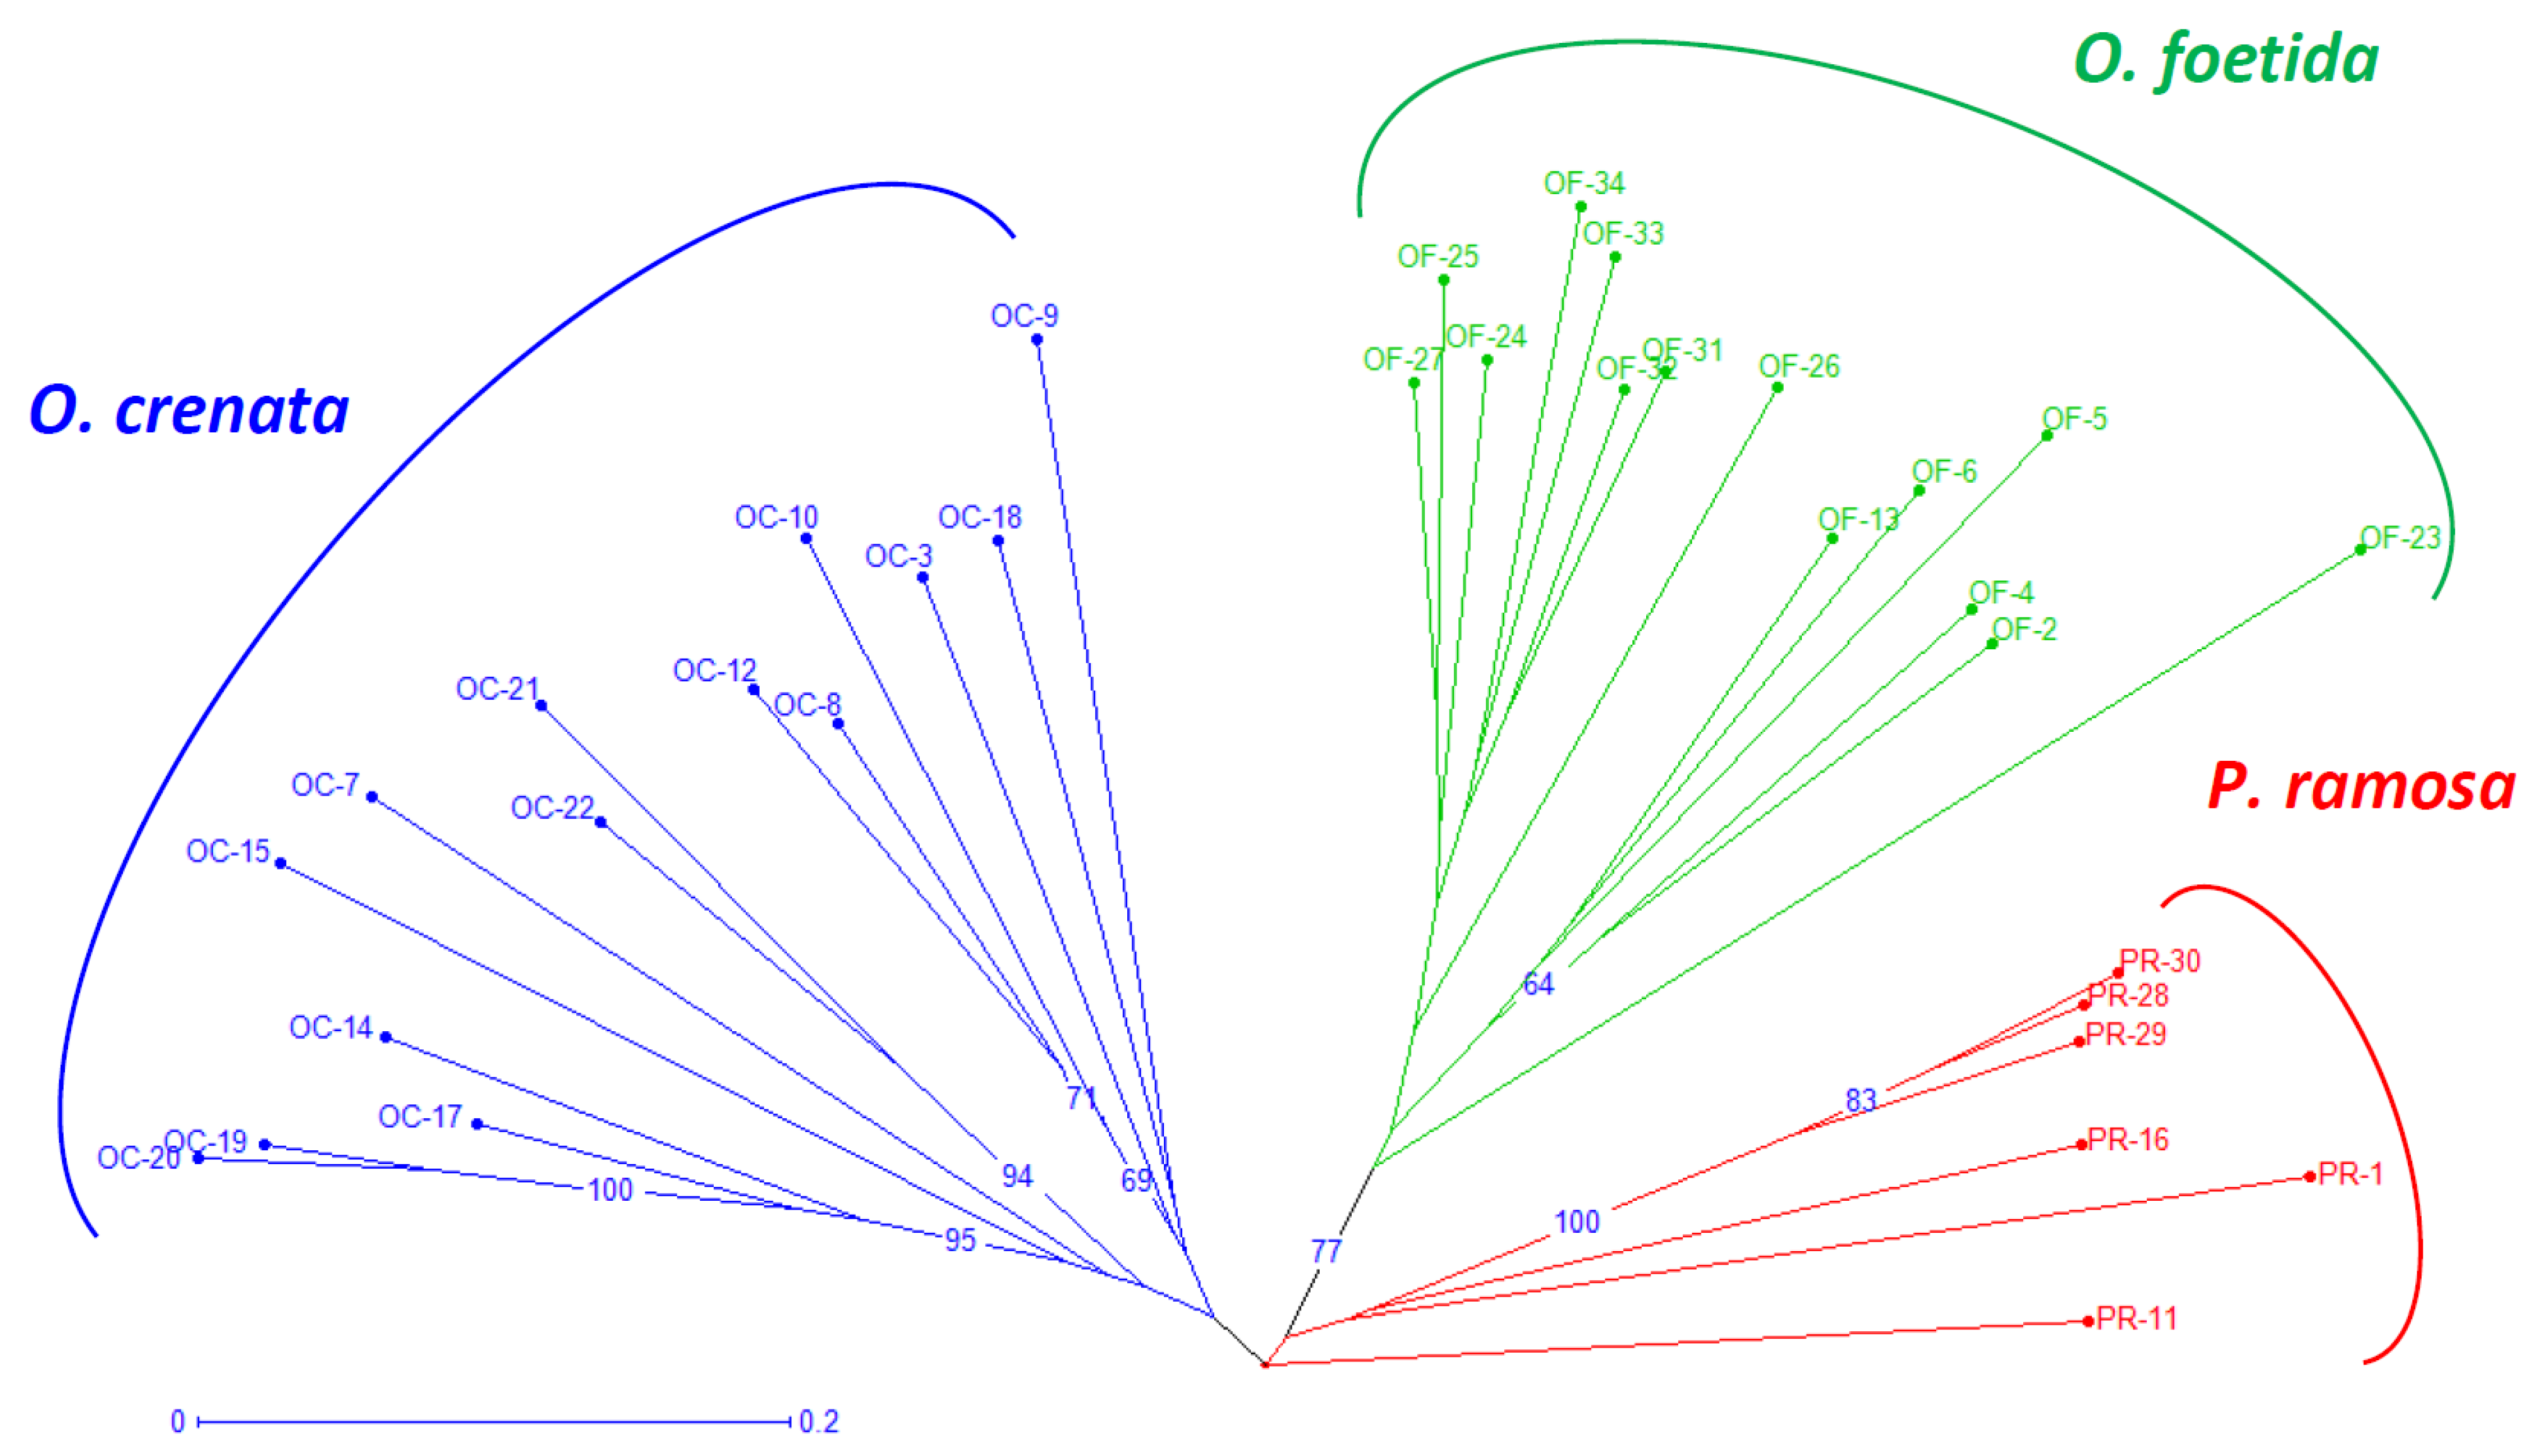
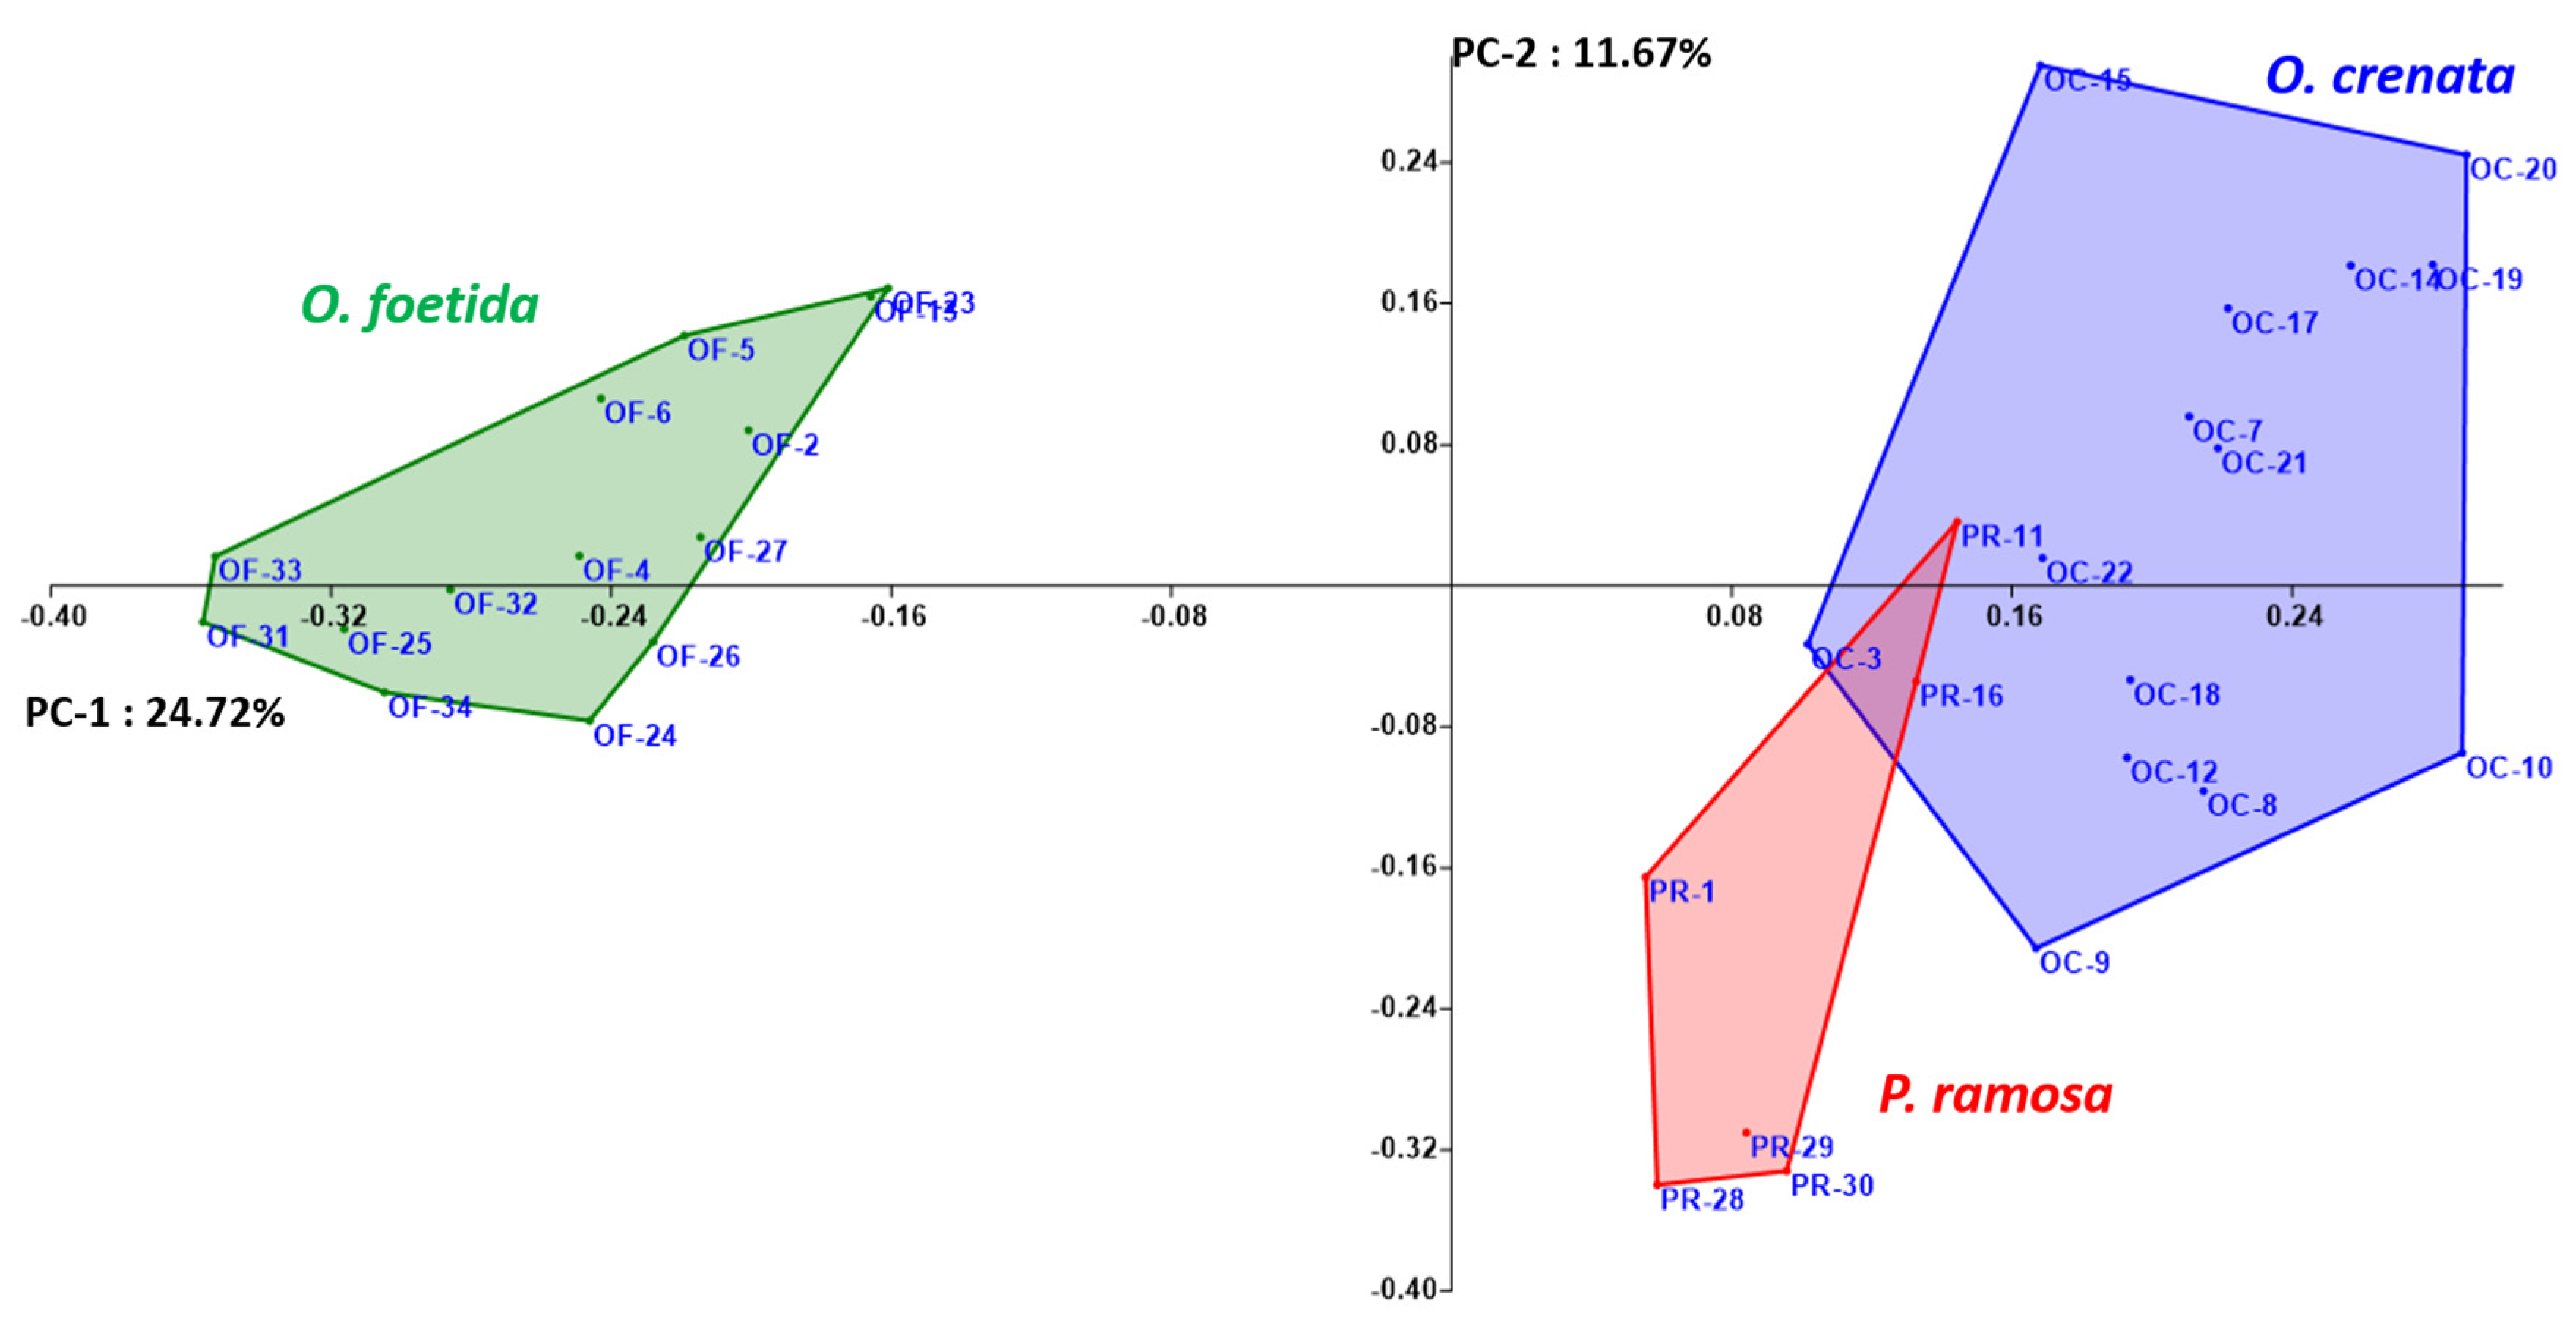
Both the NJ method and the PCoA, presented in Figure 2 and Figure 3, respectively, are used to depict the genetic relationships between the studied broomrape species. The NJ method clearly shows three major groups corresponding to the three studied broomrape species. However, a genetic similarity is noticeable between the genotypes of P. ramosa and the genotypes of the species O. crenata. Meanwhile, the genotypes of O. foetida differ significantly from the other two species. The PCoA reveals the same observations with a slight overlap between P. ramosa and O. crenata, (mainly due to the similarity of their hosts) [8], in particular, the genetic closeness of the two PR-11 and PR-16 genotypes to OC-3 and OC-22.
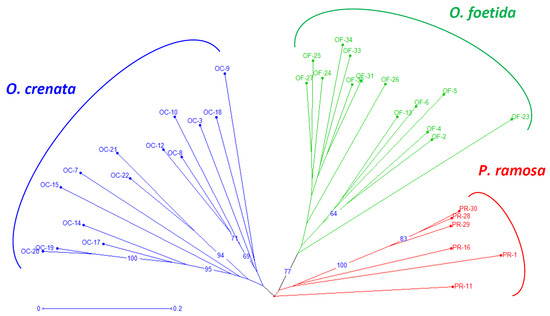
Figure 2.
Neighbor-joining tree of broomrape derived from RAPD markers. The neighbor-joining tree displays genetic distances, rooted following Jaccard’s genetic distances. Numbers at the branches are percentages that indicate the degree of 1000 bootstrap replicates. Branches collapse when they have less than 60% support. Branches of different color group different species. The coding of the different populations is presented according to Table 1.
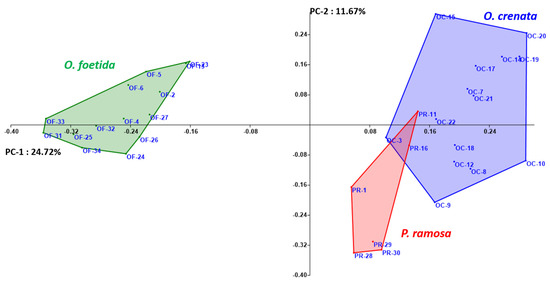
Figure 3.
Principal coordinate analysis (PCoA) of broomrape derived from RAPD markers. Different colors indicate different species.
3.4. Tunisian Broomrape’s Genetic Structure
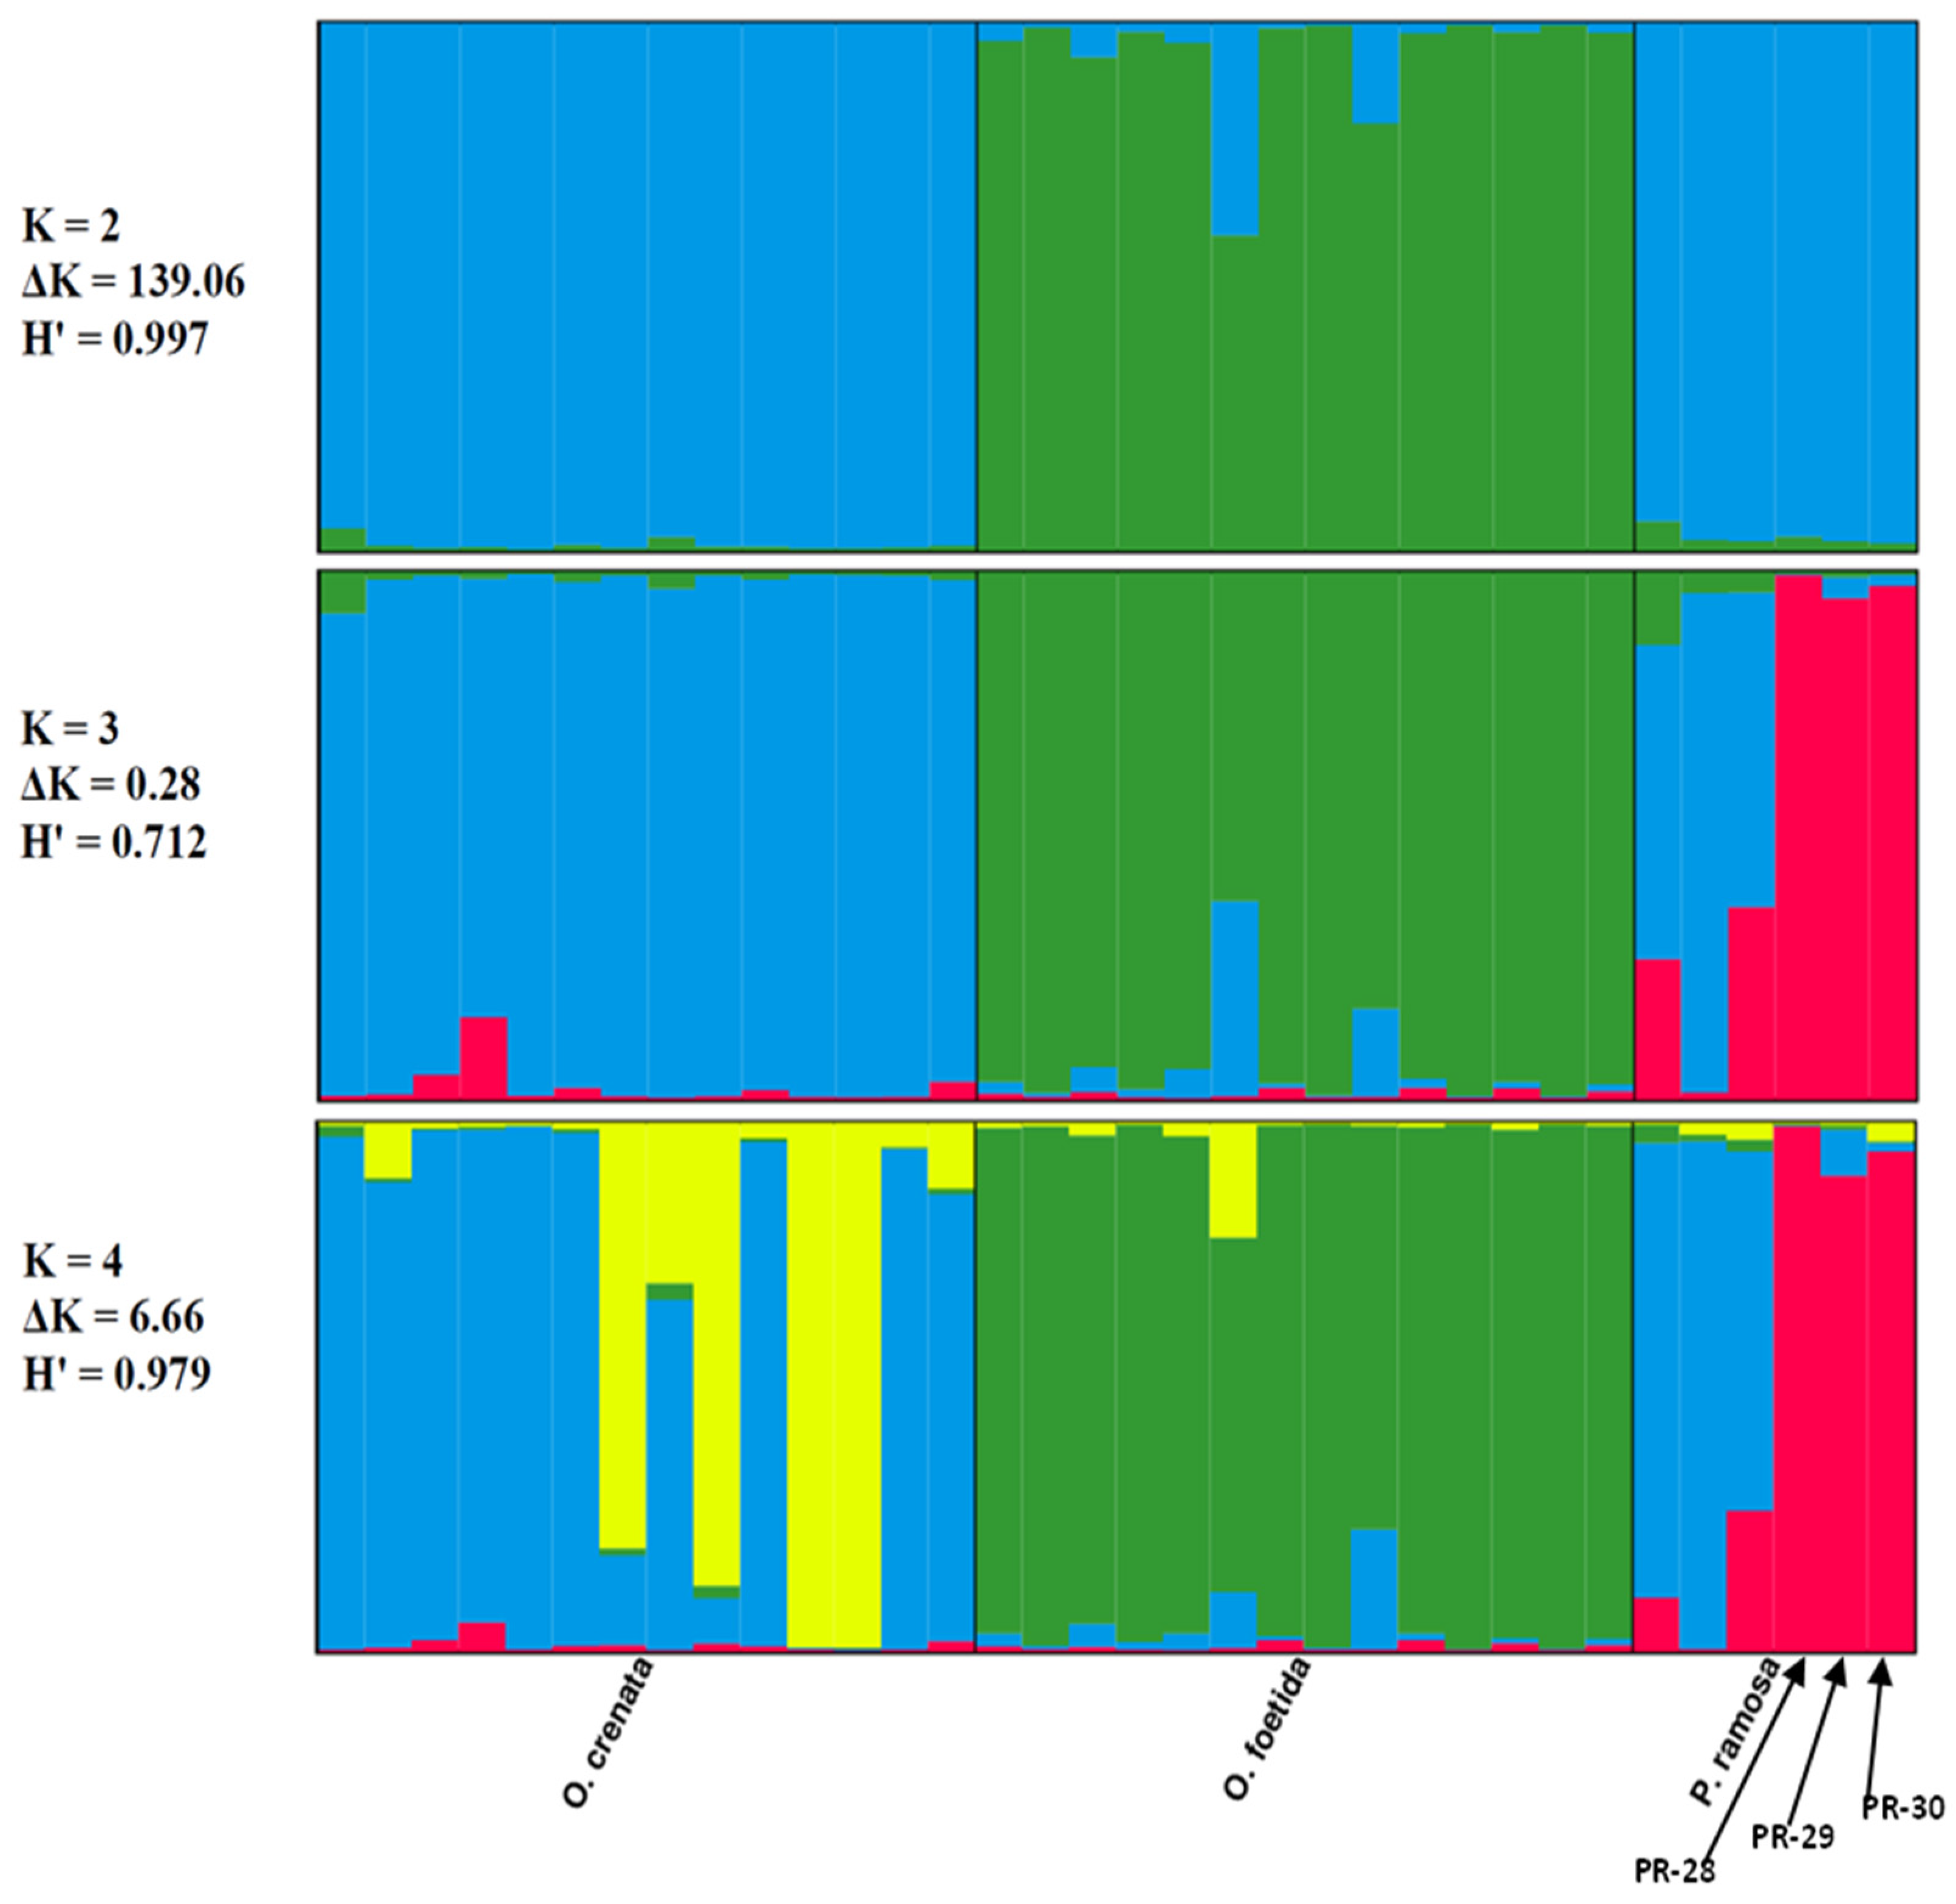
The genetic structure of the three studied broomrape species was analyzed based on a model comprising two to three clusters (K = 2, K = 3 and K = 4). The ad hoc measure, derived from the second-order rate of variation of the likelihood function (ΔK) [45], indicated a primary clustering at K = 2 for the studied Tunisian broomrape (ΔK = 139.06) and a further subgrouping at K = 4 (ΔK = 6.66).
Each vertical bar represents an individual sample, segmented into K colors. Each colored section characterizes the estimated level of that individual’s association with a specific genetic cluster.
The Clumpp program generated a permuted average Q-matrix after ten STRUCTURE runs, which provided the highest H at K = 2 and K = 4, equal to 0.997 and 0.979, respectively. This suggests reliable results for both models (Figure 4). Based on the K = 2 model, the broomrape genotypes were categorized into two genetically distinct groups or metapopulations as determined from the STRUCTURE analysis: Cluster 1 (blue) included genotypes of two species: O. crenata and P. ramosa. Cluster 2 (green) included O. foetida genotypes. We note that genotypes of foetida were assigned with over 70% probability to cluster 2 (green), whatever the model, which justifies the genotypic specificity of O. foetida compared with the broomrapes studied. From K = 3, we note the appearance of a third cluster (red), bringing together three genotypes of the P. ramosa species, in this case, PR-28, PR-29 and PR-30, which differ significantly with an assignment probability greater than 80%, unlike PR-1, PR-11 and PR-16, which show significant genetic similarity with O. crenata (cluster blue).
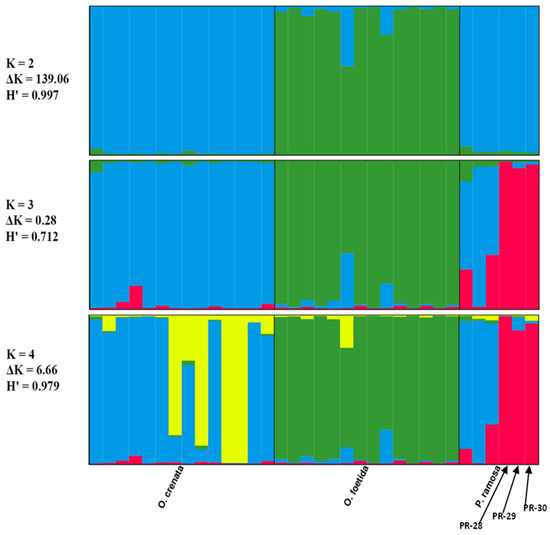
Figure 4.
Results of the STRUCTURE analysis’s genetic clustering (N = 34). Different colors indicate different clusters.
At K = 4, we note the appearance of a sub-cluster (yellow) grouping four genotypes of O. crenata, which seems to indicate a subdivision, but we cannot confirm this observation, because the K = 4 model is not very stable compared with K = 2, especially since the neighbor-joining method and PCoA do not show a subdivision within O. crenata.
4. Discussion
The present study is an original genetic diversity and structure analysis based on the dominant RAPD molecular markers of samples of O. foetida, O. crenata and P. ramosa from different hosts and regions in Tunisia. RAPD markers were chosen based on their high polymorphism and discrimination capacity as identified in our own unpublished optimizations.
Moreover, the genome of these species has not yet been sequenced, and there are no available standard molecular markers or kits that have been published to study the three species’ diversity altogether. RAPD was previously used to investigate broomrape [15,18,48,49] genetic diversity in Tunisian populations [31,49], and RADseq was used to study the genetic diversity of Tunisian O. foetida populations [11].
The RAPD markers applied in this study clearly showed their efficiency in revealing the polymorphism between Orobanche and Phelipanche species and individuals. Indeed, the PIC ranged between 0.79 and 0.92. These results agree with those of [18], who reported the effectiveness of RAPD markers in revealing the polymorphism of varied populations of Orobanche spp. affecting wild hosts in Spain.
The highest PPB was monitored for O. crenata, followed by 80.6% for O. foetida, while the lowest was detected for P. ramosa (72.45%). These results were supported by the AMOVA, which revealed 70.31% genetic variability within species and only 29.69% between species, in agreement with previous results (75.4%) showing internal variation in Tunisian and Spanish O. foetida populations [34,49]. Comparable results were found in a study undertaken by [25] (the highest variability occurred between individuals as opposed to within populations based on SSR markers that screened a significant O. crenata population number in Ethiopia). In our study, there was a high gene flow measured between species (Nm = 1.91). This result could be based on the high level of outcrossing (71%) of O. crenata [2] due to its flower morphology, with large low lips that serve as a platform for pollinators. In this context, it is well documented that such plant species possess a low rate of diversity among populations compared to self-pollinated ones.
Previous research has documented that Orobanche spp. and Phelipanche spp. have a complex genetic structure due to their allogamous mating: O. crenata from Ethiopia [25] or from Algeria [28] and Orobanche spp. from Spain [24,33,34].
Our broomrape population structure investigation showed that, at K = 2, the model-based clustering divides the studied samples into two subgroups, the first of which grouped O. crenata and P. ramosa together, and the second of which included samples from all of northern Tunisia without showing any particular correlation with the geographic origin of the samples or overlapping between the two groups. Conversely, when we move to K = 3, we can distinguish three groups, and O. foetida is clearly distinct from the two other species. This could be explained by the fact that an outburst of Orobanche races from wild to cultivated species has been documented, as reported by many researchers in the Mediterranean regions [5,29,33]. For instance, O. foetida was reported in Tunisia in 1905 on Medicago truncatula [50]; and also on common vetch [51] and lentil [52] in Morocco with variable levels of parasitism. The results of [11], utilizing Radseq to explore O. foetida genetic variability, are in agreement with the grouping of O. foetida separately from the other species in this study and the high genetic variability within the population without any geographic origin correlation. Indeed, both [11,33] pinpointed the autogamous mating of Tunisian O. foetida populations, affecting crop plants compared with the allogamous mating of Spanish O. foetida that parasitizes wild species.
Moreover, we noticed during our field tours and sampling expeditions that O. crenata and P. ramosa [11] were predominant in the same regions and fields; for example, in the Kairouan region, we found O. crenata to be very common on milk thistle (Silybum marianum) in uncultivated and zero-tillage fields. In that region, farmers grow peas and faba beans in the winter season; then, they move to tomato cultivation during the summer season with no knowledge of the parasites. As such, this practice increases the differentiation process from wild to cultivated species, as both O. crenata and P. ramosa grow in the same regions and have wild hosts that keep them growing in fields offseason, and they will thus cross-pollinate.
In our study, Figure 3 shows that O. crenata samples are clustered together without region differentiation, in agreement with a previous study [25]. The aforementioned results, however, contradict those of [48], which discovered a distinct differentiation between Moroccan O. crenata accessions based on their place of origin. Nevertheless, the same results were found by [25,28] in Ethiopia with O. crenata populations. The clustering without correlation with sample geographic localization suggests that there is significant mixing or outcrossing in the gene pool of O. crenata between populations, supported by the AMOVA’s high genetic diversity inside populations compared with the diversity between populations. Moreover, we noticed that the farming practices (i.e., seed exchange) helped the spread of O. crenata and P. ramosa from the north to the center. Additionally, there is always a succession from non-cropping, zero-tillage to the cultivation of two seasons with broomrape-sensitive crops (pea or faba bean cultivars in winter and tomato in summer). This practice makes the parasite not mutate very much, as there is always a susceptible host in both cases (wild species and cultivated crops). This is obvious when we closely look at the subgroup of O. crenata, where populations of parasitized Silybum marianum from the north and central regions of the country are grouped together with two populations of parasitized faba beans from the Kairouan region. On the other hand, the O. crenata populations parasitizing other wild species are grouped together with two broomrape samples parasitizing two V. faba cultivars from the Bizerte region, where the farmers are aware of broomrape problems, and intensive weeding, crop rotation and the use of resistance cultivars are taking place, which may promote the parasite’s differentiation.
5. Conclusions
The current study seeks to estimate the genetic variability and structure of the most devastating broomrape species in Tunisia. Indeed, RAPD-dominant markers were able to demonstrate appropriate polymorphism and provided adequate and clear information relative to the genetic diversity of O. foetida, O. crenata and P. ramosa and their populations’ structures given the lack of full genome sequencing.
A significant genetic disparity within individuals of each genus and species resulted in us classifying the Tunisian Orobanche spp. and Phelipanches spp. into two main metapopulations and then into two genetic groups based on genius and species diversity levels, deprived of a geographic origin correlation. The low levels of diversity between the populations indicate that breeding schemes for rendering resistance to grain legumes against broomrapes can be conducted in one location. The present study is original and a baseline for studying the diversity and population structure of two genera of Tunisian broomrape, Orobanche spp. and Phelipanche spp. An additional screening based on the available markers of each species, such as ISSR, SSR and plastid DNA polymorphism, and via high throughput techniques such as HRM and GBS, with a large sample from the neighboring Mediterranean countries, would bring better knowledge and understanding about the diversity and population structure to assist breeding for resistance.
Author Contributions
Conceptualization, K.K., E.T., R.C. and M.K.; methodology, K.K., Z.A., E.T. and A.K.; software, A.K., K.G. and M.R.; validation, K.K., E.T. and M.K.; formal analysis, K.K., Z.A., E.T., A.K., S.K. and K.G.; investigation, K.K., Z.A., E.T., A.K., S.K. and K.G.; resources, R.C. and M.K.; author data curation, K.K., Z.A., E.T., A.K., S.K. and K.G. writing—original draft preparation, K.K., Z.A., E.T., A.K. and K.G.; writing—review and editing, K.K., Z.A., E.T., R.C., D.C. and M.K.; visualization, all authors; supervision, R.C. and M.K.; project administration, D.C. and M.K.; funding acquisition, D.C. and M.K. All authors have read and agreed to the published version of the manuscript.
Funding
The project was partially funded by PRIMAII ZEROPARASITIC Project, PRΙΜA 2018, Section 2, “Innovative sustainable solutions for broomrapes: prevention and integrated pest management approaches to overcome parasitism in Mediterranean cropping systems’’.
Institutional Review Board Statement
Not applicable.
Informed Consent Statement
Not applicable.
Data Availability Statement
Data can be available upon request.
Acknowledgments
The authors wish to thank the Ministry of Agriculture, Hydraulic Resources and Maritime Fisheries; the Ministry of Higher Education and Scientific Research. In addition, we would like to thank Ioanna Kendrick for English revisions of an earlier draft of the manuscript and Maria Gerakari for helping with proofreads.
Conflicts of Interest
The authors declare no conflict of interest.
References
- Joel, D.M. The new nomenclature of Orobanche and Phelipanche. Weed Res. 2009, 49, 6–7. [Google Scholar] [CrossRef]
- Satovic, Z.; Joel, D.M.; Rubiales, D.; Cubero, J.I.; Román, B. Population genetics in weedy species of Orobanche. Australas. Plant Pathol. 2009, 38, 228–234. [Google Scholar] [CrossRef]
- Rubiales, D. Broomrape Threat to Agriculture. Outlooks Pest Manag. 2020, 31, 141–145. [Google Scholar] [CrossRef]
- Amri, M.I.; Trabelsi, Z.A.; Kharrat, M. Release of a new faba bean variety “chourouk” resistant to the parasitic plants Oroban-che foetida and O. crenata in Tunisia. Intl. J. Agric. Biol. 2019, 21, 499–505. [Google Scholar]
- Amri, M.; Abbes, Z.; Youssef, S.; Bouhadida, M.; Salah, H.; Kharrat, M. Detection of the parasitic plant, Orobanche cumana on sunflower (Helianthus annuus L.) in Tunisia. Afr. J. Biotechnol. 2012, 11, 4163–4167. [Google Scholar]
- Hosni, T.; Abbes, Z.; Abaza, L.; Medimagh, S.; Ben Salah, H.; Kharrat, M. Effect of broomrape (Orobanche cumana Wallr.) on some agro-morphological and biochemical traits of Tunisian and some reference sunflower (Helianthus annuus L.) accessions. J. Plant Dis. Prot. 2020, 127, 831–841. [Google Scholar] [CrossRef]
- Medimagh, S.; Abbes, Z.; Chtourou, M.; Hosni, T.; Khamassi, K.; Kharrat, M. Detection of the parasitic weed, Phelipanche ra-mosa in rapeseed fields in Tunisia. In Proceedings of the International Scientific Workshop on Parasitic Plants Oroban-che/Phelipanche spp. Organised by PRIMAII “ZeroParasitic” Project Tunis (INRAT), Tunis, Tunisia, 14–16 March 2023. [Google Scholar]
- Parker, C. The Parasitic Weeds of the Orobanchaceae. In Parasitic Orobanchaceae: Parasitic Mechanisms and Control Strategies; Joel, D.M., Gressel, J., Musselman, L.J., Eds.; Springer: Berlin/Heidelberg, Germany, 2013; pp. 313–344. [Google Scholar] [CrossRef]
- Trabelsi, I.; Abbes, Z.; Amri, M.; Kharrat, M. Study of some resistance mechanisms to Orobanche spp. Infestation in faba bean (Vicia faba L.) breeding lines in Tunisia. Plant Prod. Sci. 2016, 19, 562–573. [Google Scholar] [CrossRef]
- Fernández-Aparicio, M.; Delavault, P.; Timko, M.P. Management of Infection by Parasitic Weeds: A Review. Plants 2020, 9, 1184. [Google Scholar] [CrossRef]
- Boukteb, A.; Sakaguchi, S.; Ichihashi, Y.; Kharrat, M.; Nagano, A.J.; Shirasu, K.; Bouhadida, M. Analysis of Genetic Diversity and Population Structure of Orobanche foetida Populations from Tunisia Using RADseq. Front. Plant Sci. 2021, 12, 618245. [Google Scholar] [CrossRef]
- Martín-Sanz, A.; Malek, J.; Fernández-Martínez, J.M.; Pérez-Vich, B.; Velasco, L. Increased Virulence in Sunflower Broomrape (Orobanche cumana Wallr.) Populations from Southern Spain Is Associated with Greater Genetic Diversity. Front. Plant Sci. 2016, 7, 589. [Google Scholar] [CrossRef]
- Ahmad, N.; Tian, R.; Lu, J.; Li, G.; Sun, J.; Lin, R.; Zhao, C.; Zhou, C.; Chang, H.; Zhao, S.; et al. DNA fingerprinting and genetic diversity analysis in Asparagus officinalis L. cultivars using microsatellite molecular markers. Genet. Resour. Crop Evol. 2023, 70, 1163–1177. [Google Scholar] [CrossRef]
- Ahmad, N.; Tian, R.; Li, G.; Zhao, C.; Fan, S.; Sun, J.; Zhao, S.; Wang, X. Establishment of male-specific sequence-tagged site markers in Asparagus officinalis: An efficient tool for sex identification. Plant Breed. 2022, 141, 471–481. [Google Scholar] [CrossRef]
- Katzir, N.; Portnoy, V.; Tzuri, G.; Joel, D.M.; Castejón-Muñoz, M.J.T.; Genetics, A. Use of random amplified polymorphic DNA (RAPD) markers in the study of the parasitic weed Orobanche. Theor. Appl. Genet. 1996, 93, 367–372. [Google Scholar] [CrossRef] [PubMed]
- Brault, M.; Betsou, F.; Jeune, B.; Tuquet, C.; Sallé, G. Variability of Orobanche ramosa populations in France as revealed by cross infestations and molecular markers. Environ. Exp. Bot. 2007, 61, 272–280. [Google Scholar] [CrossRef]
- Ivanović, Ž.; Marisavljević, D.; Marinković, R.; Mitrović, P.; Blagojević, J.; Nikolić, I.; Pavlović, D. Genetic Diversity of Oroban-che cumana Populations in Serbia. Plant Pathol. J. 2021, 37, 512–520. [Google Scholar] [CrossRef] [PubMed]
- Román, B.; Alfaro, C.; Torres, A.M.; Moreno, M.T.; Satovic, Z.; Pujadas, A.; Rubiales, D. Genetic relationships among Oroban-che species as revealed by RAPD analysis. Ann. Bot. 2003, 91, 637–642. [Google Scholar] [CrossRef]
- Stoyanov, K.; Gevezova, M.; Denev, I. Identification of ISSR Markers for Studying the Biodiversity of Bulgarian Representa-tives of Genus Orobanche Subsection Minores. Biotechnol. Biotechnol. Equip. 2012, 26, 2743–2749. [Google Scholar] [CrossRef]
- Westwood, J.H.; Fagg, C. ISSR characterization of Orobanche minor populations in the US. In Proceedings of the 8th Interna-tional Parasitic Weeds Symposium, Durban, South Africa, 24–25 June 2004; p. 15. [Google Scholar]
- Abdalla, M.M.F.; Saleh, H.A.M.A.; Khater, M.A. Detection of genetic variations in Orobanche crenata using inter simple se-quence repeat (ISSR) markers. Bull. Natl. Res. Cent. 2020, 44, 139. [Google Scholar] [CrossRef]
- Abedi, S.; Darvishzadeh, R.; Bernousi, I.; Abdollahi Mandoulakani, B.; Hatami Maleki, H.; Shah, D. Genetic variability of Oro-banche aegyptiaca infesting tobacco in Iran by Bayesian analysis. Biologia 2014, 69, 1652–1659. [Google Scholar] [CrossRef]
- Gagne, G.; Roeckel-Drevet, P.; Grezes-Besset, B.; Shindrova, P.; Ivanov, P.; Grand-Ravel, C.; Vear, F.; Tourvieille de Labrouhe, D.; Charmet, G.; Nicolas, P. Study of the variability and evolution of Orobanche cumana populations infesting sunflower in different European countries. Theor. Appl. Genet. 1998, 96, 1216–1222. [Google Scholar] [CrossRef]
- Vaz Patto, M.C.; Díaz-Ruiz, R.; Šatović, Z.; Román, B.; Pujadas-Salvà, A.J.; Rubiales, D. Genetic diversity of Moroccan popula-tions of Orobanche foetida: Evolving from parasitising wild hosts to crop plants. Weed Res. 2008, 28, 179–186. [Google Scholar] [CrossRef]
- Belay, G.; Tesfaye, K.; Hamwieh, A.; Ahmed, S.; Dejene, T.; de Oliveira Júnior, J.O.L. Genetic Diversity of Orobanche crenata Populations in Ethiopia Using Microsatellite Markers. Int. J. Genom. 2020, 2020, 3202037. [Google Scholar] [CrossRef]
- Pineda-Martos, R.; Velasco, L.; Fernández-Escobar, J.; Fernández-Martínez, J.M.; Pérez-Vich, B. Genetic diversity of Orobanche cumana populations from Spain assessed using SSR markers. Weed Res. 2013, 53, 279–289. [Google Scholar] [CrossRef]
- Rolland, M.; Dupuy, A.; Pelleray, A.; Delavault, P. Molecular Identification of Broomrape Species from a Single Seed by High Resolution Melting Analysis. Front. Plant Sci. 2016, 7, 1838. [Google Scholar] [CrossRef] [PubMed]
- Bendaoud, F.; Kim, G.; Larose, H.; Westwood, J.H.; Zermane, N.; Haak, D.C. Genotyping-by-sequencing analysis of Orobanche crenata populations in Algeria reveals genetic differentiation. Ecol. Evol. 2022, 12, e8750. [Google Scholar] [CrossRef] [PubMed]
- Benharrat, H.; Veronesi, C.; Theodet, C.; Thalouarn, P. Orobanche species and population discrimination using intersimple sequence repeat (ISSR). Weed Res. 2002, 42, 470–475. [Google Scholar] [CrossRef]
- Fulton, T.M.; Chunwongse, J.; Tanksley, S.D. Microprep protocol for extraction of DNA from tomato and other herbaceous plants. Plant Mol. Biol. Report. 1995, 13, 207–209. [Google Scholar] [CrossRef]
- Bouhadida, M.; Jannet, R.; Abbes, Z.; Amri, M.; Kharrat, M. Analysis of Genetic Diversity of Orobanche foetida Population Para-sitizing Crops Legume. J. Agric. Vet. Sci. 2015, 8, 37–40. [Google Scholar] [CrossRef]
- Gilbert, J.E.; Lewis, R.V.; Wilkinson, M.J.; Caligari, P.D.S. Developing an appropriate strategy to assess genetic variabil-ity in plant germplasm collections. Theor. Appl. Genet. 1999, 98, 1125–1131. [Google Scholar] [CrossRef]
- Román, B.; Hernández, R.; Pujadas-Salvá, A.J.; Cubero, J.I.; Rubiales, D.; Satovic, Z. Genetic diversity in two variants of Oro-banche gracilis Sm. [var. gracilis and var. deludens (Beck) A. Pujadas] (Orobanchaceae) from different regions of Spain. Electron. J. Biotechnol. 2007, 10, 221–229. [Google Scholar] [CrossRef]
- Román, B.; Rubiales, D.; Torres, A.M.; Cubero, J.I.; Satovic, Z. Genetic diversity in Orobanche crenata populations from south-ern Spain. Theor. Appl. Genet. 2001, 103, 1108–1114. [Google Scholar] [CrossRef]
- Smith, J.S.C.; Chin, E.C.L.; Shu, H.; Smith, O.S.; Wall, S.J.; Senior, M.L.; Mitchell, S.E.; Kresovich, S.; Ziegle, J. An evaluation of the utility of SSR loci as molecular markers in maize (Zea mays L.): Comparisons with data from RFLPS and pedigree. Theor. Appl. Genet. 1997, 95, 163–173. [Google Scholar] [CrossRef]
- Powell, W.; Morgante, M.; Andre, C.; Hanafey, M.; Vogel, J.; Tingey, S.; Rafalski, A. The comparison of RFLP, RAPD, AFLP and SSR (microsatellite) markers for germplasm analysis. Mol. Breed. 1996, 2, 225–238. [Google Scholar] [CrossRef]
- Yeh, F.; Yang, R.; Boyle, T. User Manual for POPGENE; Version 1.31; Microsoft Window-Based Freeware for Population Genetic Analysis. A Joint Project Development by Francis C. Yeh and Rong-Cai Yang, University of Alberta and Tim Boyle, Centre for International Forestry Research; Science Publishers: Montpellier, France, 1999. [Google Scholar]
- Nei, M. Analysis of gene diversity in subdivided populations. Proc. Natl. Acad. Sci. USA 1973, 70, 3321–3323. [Google Scholar] [CrossRef] [PubMed]
- Nei, M. F-statistics and analysis of gene diversity in subdivided populations. Ann. Hum. Genet. 1977, 41, 225–233. [Google Scholar] [CrossRef]
- McDermott, J.M.; McDonald, B.A. Gene Flow in Plant Pathosystems. Annu. Rev. Phytopathol. 1993, 31, 353–373. [Google Scholar] [CrossRef]
- Peakall, R.; Smouse, P.E. GenAlEx 6.5: Genetic analysis in Excel. Population genetic software for teaching and research—An update. Bioinformatics 2012, 28, 2537–2539. [Google Scholar] [CrossRef]
- Perrier, X.; Jacquemoud-Collet, J.P. DARwin Software, Desktop Standalone Version. Available online: http://darwin.cirad.fr/ (accessed on 1 July 2023).
- Hammer, O.; Harper, D.; Ryan, P. PAST: Paleontological Statistics Software Package for Education and Data Analysis. Palaeon-tol. Electron. 2001, 4, 1–9. [Google Scholar]
- Earl, D.A.; Vonholdt, B. Structure Harvester: A website and program for visualizing STRUCTURE output and implementing the Evanno method. Conserv. Genet. Resour. 2012, 4, 359–361. [Google Scholar] [CrossRef]
- Evanno, G.; Regnaut, S.; Goudet, J. Detecting the number of clusters of individuals using the software STRUCTURE: A simula-tion study. Mol. Ecol. 2005, 14, 2611–2620. [Google Scholar] [CrossRef]
- Jakobsson, M.; Rosenberg, N.A. CLUMPP: A cluster matching and permutation program for dealing with label switching and multimodality in analysis of population structure. Bioinformatics 2007, 23, 1801–1806. [Google Scholar] [CrossRef] [PubMed]
- Rosenberg, N.A. distruct: A program for the graphical display of population structure. Mol. Ecol. Notes 2004, 4, 137–138. [Google Scholar] [CrossRef]
- Ennami, M.; Briache, F.Z.; Gaboun, F.; Abdelwahd, R.; Ghaouti, L.; Belqadi, L.; Westwood, J.; Mentag, R. Host differentiation and variability of Orobanche crenata populations from legume species in Morocco as revealed by cross-infestation and mo-lecular analysis. Pest Manag. Sci. 2017, 73, 1753–1763. [Google Scholar] [CrossRef] [PubMed]
- Román, B.; Alfaro, C.; Maria, T.A.; Šatović, Z.; Kharrat, M.; Pujadas, A. An analysis of genetic variation in natural populations of Orobanche foetida from Spain and Tunisia. In Proceedings of the 7th International Parasitic Weed Symposium, Nantes, France, 5–8 June 2001; pp. 57–60. [Google Scholar]
- Boeuf, F.J.J.A.P. Les Orobanches en tunisie. J. Agric. Prat. 1905, 5, 11–14. [Google Scholar]
- Rubiales, D.; Sadiki, M.; Román, B. First Report of Orobanche foetida on Common Vetch (Vicia sativa) in Morocco. Plant Dis. 2005, 89, 528. [Google Scholar] [CrossRef] [PubMed]
- Rubiales, D.; Fernández-Aparicio, M.; Rodríguez, M.J. First Report of Crenate Broomrape (Orobanche crenata) on Lentil (Lens culinaris) and Common Vetch (Vicia sativa) in Salamanca Province, Spain. Plant Dis. 2008, 92, 1368. [Google Scholar] [CrossRef]
Disclaimer/Publisher’s Note: The statements, opinions and data contained in all publications are solely those of the individual author(s) and contributor(s) and not of MDPI and/or the editor(s). MDPI and/or the editor(s) disclaim responsibility for any injury to people or property resulting from any ideas, methods, instructions or products referred to in the content. |
© 2023 by the authors. Licensee MDPI, Basel, Switzerland. This article is an open access article distributed under the terms and conditions of the Creative Commons Attribution (CC BY) license (https://creativecommons.org/licenses/by/4.0/).

