Article

New Approach for Process Capability Analysis Using Multivariate Quality Characteristics

by
Moath Alatefi
1,2,*,
Abdulrahman M. Al-Ahmari
1,2 and
Abdullah Yahia AlFaify
1,2
1
Industrial Engineering Department, College of Engineering, King Saud University, P.O. Box 800, Riyadh 11421, Saudi Arabia
2
Raytheon Chair for Systems Engineering, King Saud University, P.O. Box 800, Riyadh 11421, Saudi Arabia
*
Author to whom correspondence should be addressed.
Appl. Sci. 2023, 13(21), 11616; https://doi.org/10.3390/app132111616
Submission received: 9 September 2023 / Revised: 12 October 2023 / Accepted: 21 October 2023 / Published: 24 October 2023
(This article belongs to the Special Issue Decision Support Systems: Novel Applications and Future Perspectives)

Abstract

:
The evaluation of manufacturing processes aims to ensure that the processes meet the desired requirements. Therefore, process capability indexes are used to measure the capability of a process to meet customer requirements and/or engineering specifications. However, most of the manufacturing products have more than one quality characteristic (QC), in which case, the multivariate QCs should be evaluated together using a single capability index. The research in this article proposes a methodology for estimating the multivariate process capability index (PCI). First, the dimensions of the multivariate QCs are reduced into a new single variable using the proportion of the process specification region, by comparing each variable datapoint to its specification limits. Moreover, nonnormal data are transformed to normality using a root transformation algorithm. Then, a large data sample is generated using the parameters of the new variable. The generated data are compared to the specification limits to estimate the percent of nonconforming (PNC). Finally, the capability index of a given process datapoints is estimated using the PNC. Accordingly, managerial insights for the implementation of the proposed methodology in real industry are presented. The methodology was assessed by well-known multivariate samples from four different distributions, in which an algorithm was developed for generating these samples with their given correlations. The results show the effectiveness of the proposed methodology for estimating multivariate PCIs. Also, the results from this research outperform the previous published results in most cases.

1. Introduction

The variations of the manufacturing process have been investigated widely in order to evaluate the capability of the process to meet the desired specifications. In this regard, various techniques have been used, including design of experiments and statistical process control. Process capability analysis has been particularly helpful in this regard [1,2]. As industrial systems have advanced, process engineers have needed to thoroughly analyze and manage every aspect of their processes [3]. By using process capability analysis, we can assess manufacturing processes and make use of the resulting information to enhance the capabilities of the processes under investigation to meet the required specifications.
It is widely accepted that the majority of manufactured goods possess multiple quality characteristics (QCs) that are functionally correlated, indicating that they should be evaluated simultaneously. As a result, the assessment of product quality becomes more intricate with an increase in the number of QCs. Therefore, there is a need for identifying capability indices that can address the capabilities of nonnormal multivariate processes. For instance, Wang [4] conducted a process capability analysis for seven QCs of semiconductor products.
There is a significant amount of literature on the topic of multivariate process capability analysis, with several studies proposing different approaches. For example, Taam et al. [5] introduced the first multivariate capability index that employs process regions (PRs) and specification regions (SRs). Chen [6] developed the initial multivariate Cp that utilizes the proportion of nonconformance (PNC). Additionally, Shahriari et al. [7] conducted a process capability analysis to assess the effectiveness of multivariate quality characteristics (QCs). Braun [8] examined the forms of process regions (PRs) and specification regions (SRs) to create a novel process capability index (PCI). Castagliola et al. [9] analyzed bivariate process capabilities and produced two indices using the PNC. Bothe [10] developed a technique to calculate a multivariate C_pk index. Wang et al. [2] introduced a new index derived from C_p and C_pk using a principal component analysis (PCA) decomposition.
There are numerous other studies in the literature concerning multivariate capability analysis [4,11,12,13,14,15,16,17,18,19,20,21,22,23,24,25,26,27,28,29,30,31,32,33,34,35,36]. Wang and Chen [37] were the first to utilize principal component analysis (PCA) in process capability analysis. Das and Dwivedi [28] utilized the g and h multivariate process capability indices for nonnormal data, and their proposed index has been favorably compared to other indices in the literature. However, the calculation of this index involves complex computations. Ciupke [22] suggested a multivariate process capability index (PCI) that can be employed for both normal and nonnormal quality control (QC) processes. To evaluate multivariate nonnormal processes, he proposes the use of one-sided models to determine the Process Ratio (PR), which is then compared to the Specification Ratio (SR). Pan, Li, and Shih [20] built on the work of Pan and Lee [32] to introduce a multivariate nonnormal PCI. They estimated the original probability density function using a weighted standard deviation. Castagliola [38] defined the conventional PCIs (Cp and Cpk) based on the proportion of nonconforming (PNC).
Previous research in this field has primarily focused on PCIs for multivariate normal data, as evidenced by studies [9,39,40]. However, there have been some endeavors to expand the application of the proportion of nonconforming (PNC) to nonnormal data. Abbasi and Niaki [41] introduced a multivariate nonnormal PCI by utilizing the PNC concept. To normalize nonnormal data, they applied the root transformation method and subsequently used Monte Carlo simulation to estimate the PNC. Ahmad et al. [33] explored process capability analysis for multivariate nonnormal data using the proportion of nonconforming (PNC). They utilized the covariance distance (CD) to decrease the dimensionality of the multivariate Quality Control (QC) data. While many studies in the literature address nonnormal PCIs [9,11,42,43,44,45,46,47,48,49,50], only a few studies concentrate on multivariate nonnormal process capabilities. However, the number of these studies has been growing annually [4,11,25,27,43,51,52,53,54,55,56,57,58,59].
The majority of current multivariate Process Capability Indices (PCIs) rely on normality theory and assume that multivariate Quality Control (QC) data conform to a normal distribution. However, in reality, most QC data do not follow a normal distribution. Additionally, some proposed methods are only applicable in certain situations or are only suitable for a limited number of QCs and distributions [60]. Furthermore, the complexity of statistical calculations can hinder implementation [20]. Therefore, developing a robust multivariate PCI remains a significant research opportunity.
The existing methods for estimating the capabilities of nonnormal multivariate processes are limited, and therefore, exploring different approaches is a valuable avenue for research. This study aims to develop a multivariate capability index that considers the correlations among quality characteristics (QCs) and applies it to assess manufacturing processes. The proposed methodology is a general framework for the practitioners to evaluate their process based on multivariate QCs. Regardless of the distribution of the real data, this methodology is effective in estimating a multivariate process capability index (MPCI). The algorithm of this research includes checking normality using the skewness measure and then transforming the data into normality using the same measure. Also, it is worth noting that most products have more than one correlated QC, which should be evaluated together. This study presents an effective methodology for estimating the MPCI for real case data. The proposed methodology has been tested for its accuracy of estimation. MPCI estimation using the proposed methodology in this research is better than the algorithm from the literature in term of estimation accuracy, as presented in the discussion section. To calculate the multivariate capability index, the proposed method initially reduces the multi-dimensional data to a single variable by comparing the process data to the specifications and determining their relative values. Next, the proportion of nonconforming (PNC) data is used to estimate the process capability index.
The methodology of this research is presented in detail in Section 2. Section 3 describes the experiment procedures for applying the proposed method. The results of this research are presented in Section 4. Section 5 provides more discussions about the results along with comparing the results with another method from the literature. Finally, Section 6 provides managerial insights for implementing the proposed method for estimating MPI, and the research is concluded in Section 7.

2. Research Methodology

2.1. Proposed Methodology

The study follows a methodology that involves a series of steps to calculate an approximate PCI for multivariate nonnormal data, as illustrated in Table 1. The methodology starts by transforming collected data ( X i ) to normal distribution using root transformation method. The root transformation approach looks for a correct root (r) of right-skewed nonnormal data in which, when the data are brought up to the power r  ( X r ) , the skewness in the converted data distribution would be basically small. The bisection technique is used to calculate r’s value in accordance with the idea that a function switches its skewness sign as it goes through zero. The bisection approach can half interval between zero and one in successive iterations and finally identifies the root by evaluating the function in the midst of an interval and substituting whichever limit has the same sign of skewness.
Additionally, the technique is applied to produce the transformed specification limits ( U S L y ) by the same transformation equation, where Yi represents the transformed data and p is the number of QCs. In order to increase the similarity between all multivariate variables, the data of each variable are presented as a fraction of their specification limits. The transformed variables are then divided by their corresponding specification limits to form new relative variables and specifications. Also, specification limits are divided by themselves. Consequently, each variable or QC will have the same specification limits.
r i = Y i U S L y
where Y i is the transformed normal data of variable i, and U S L y is its upper specification limit. This will reveal the same specification limits for all variables, so then it could be treated as single variable. The relative variables are then averaged to one variable r ¯ .
r ¯ = r 2 + r 1 + + r p p
where p is the number of multivariate variables, and r ¯ is the average of each vector of the relative multivariate data.
The standard deviation of the multivariate data is used to generate a single variable with a large sample size. This is called pooled standard deviation, S P of Y i , which is used to generate a large sample from a normal distribution with the mean of r ¯ and S P . Generating the large sample size is performed to estimate the percent of nonconforming (PNC) data (fraction of data out of specification limit). PNC is then used:
S P = ( n 1 1 ) S 2 1 + n 2 1 S 2 2 + + ( n p 1 ) S 2 p n 1 + n 2 + + n p 2  
where p is the number of multivariate variables, n p is the sample size of variable p, and S 2 p is the variance of variable p. Then, based on the relative specification limits, the PNC of the generated sample is estimated to be used to estimate the MPCI. Finally, the following formula is used to estimate the process PCI for two sides limits:
C p = φ 1 ( 0.5 + 0.5 ( 1 P N C ) ) 3      
where C p is the process capability index, φ 1 is the inverse of the normal distribution, and PNC is the percent of nonconforming in the simulated data. Meanwhile, the one-sided process capability index is estimated by the following formula:
C p = φ 1 ( 1 P N C ) 3 .
There are two main assumptions for the proposed methodology to be valid:
-
First, the data should be normally distributed; thus, the proposed method consists of checking the normality assumption and transforming the nonnormal data into normal using the explained root transformation technique.
-
Second, the proposed multivariate process capability index is specific for correlated data. Consequently, unrelated multivariate variables could be individually investigated using a univariate capability index.

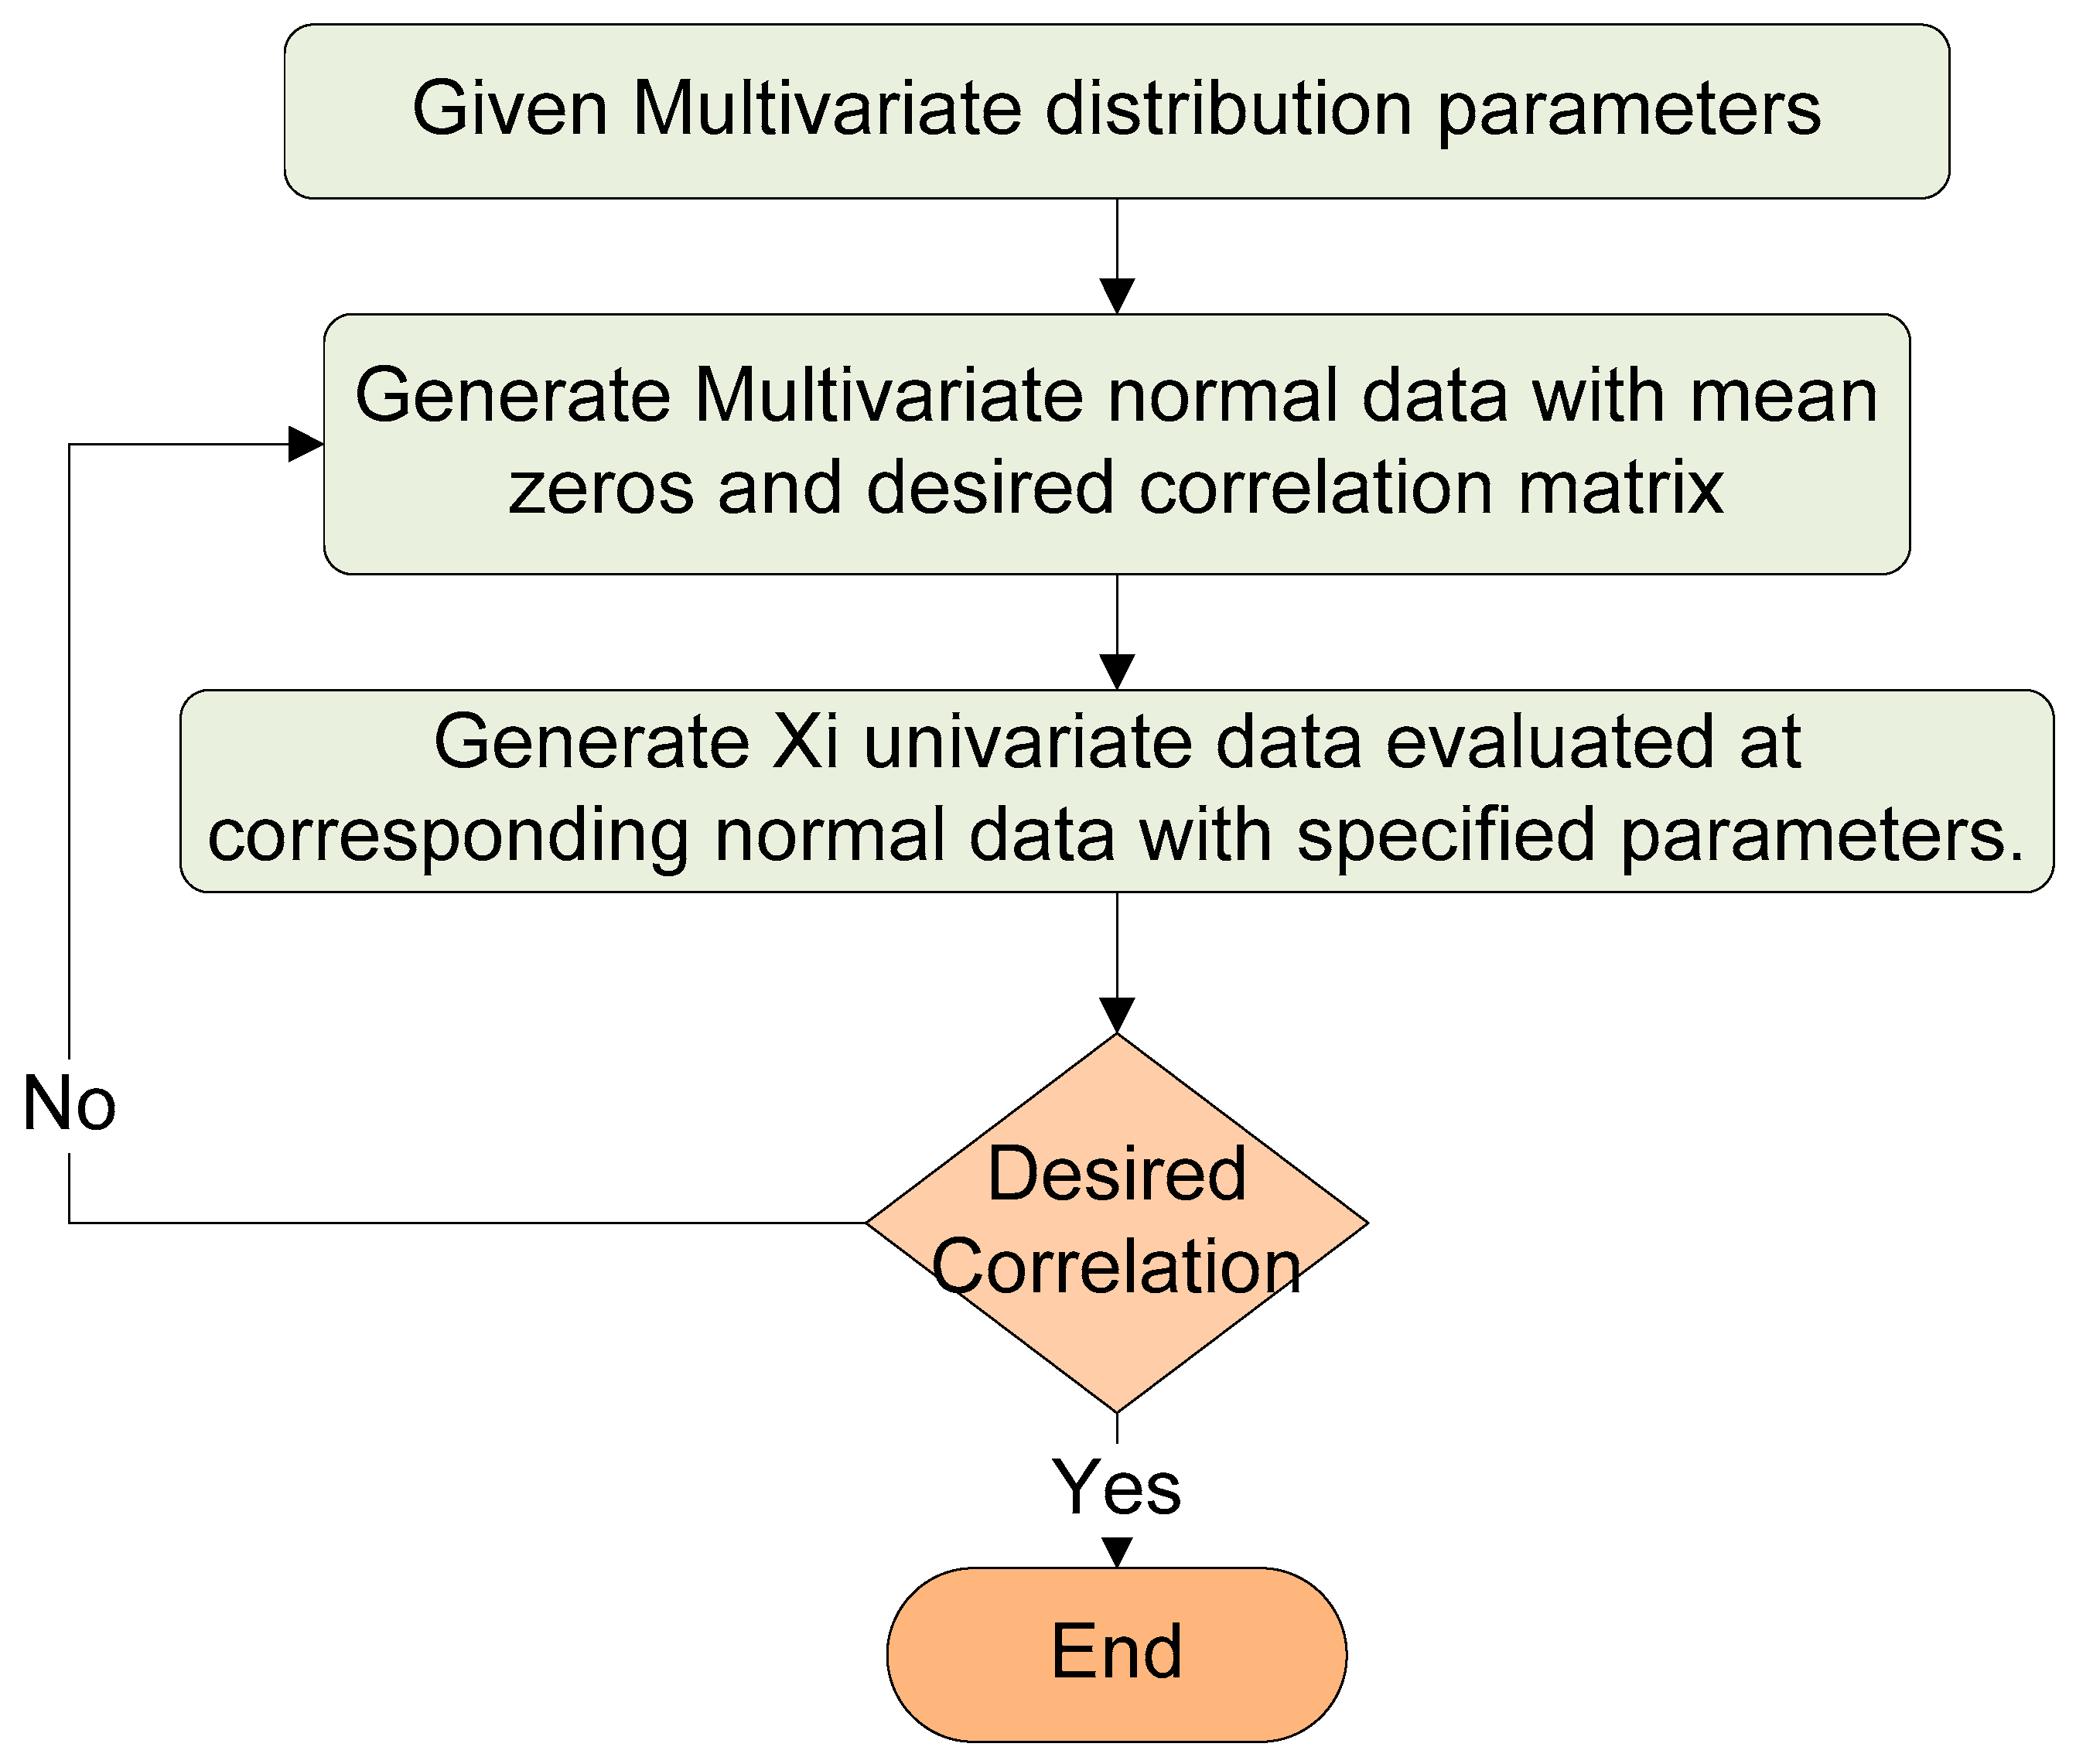
2.2. Evaluating the Proposed Methodology

To examine the effective estimation of the actual process capability index, the proposed method will be applied for theoretical distributions with a known actual process capability index. During the evaluation of the proposed methodology process, it is essential to provide multivariate nonnormal data with an arbitrary distribution and determined correlation. An algorithm has been developed that produces nonnormal multivariate data with the required correlation. Initially, random vectors of the multivariate normal distribution are generated, using the zero-mean vector and the covariance matrix that includes the desired correlation coefficients. Then, data are generated utilizing the inverse of the cumulative distribution function (CDF) for each nonnormal variable. The parameters of the desired nonnormal variable are used in the inverse CDF at the values of the normal distribution’s cumulative distribution function. The multivariate nonnormal data produced by these steps would thus have a specific distribution and correlation coefficients. The output correlation between the variables is, however, quite close to the required correlation and appears to vary somewhat across runs. As a result, the algorithm will go through multiple iterations until the tolerance between the intended and output correlation is reached.
Table 2 presents four different samples’ properties from three distributions. Also, the distribution type, the number of variables, specification limits, and parameters for each variable, correlation matrix, and actual PCI for each sample are presented. For example, the first sample is generated using gamma distribution, and it has two variables. The first variable has an upper specification limit equal to 13 and is generated using shape and scale parameters of 1 and 2, respectively. The second variable of this sample is generated using a shape parameter of 2 and scale parameter of 3, and its upper specification limit is 26. Also, the correlation coefficient of the first sample is 0.49, indicating a moderately positive correlation. Finally, this sample has an actual PCI of 0.89. The proposed method will be applied to the four samples in Table 2. Consequently, the proposed method’s performance is evaluated with different samples from different distributions.

3. Experiments

The experiment of this research starts by generating samples with multivariate data with the illustrated properties in Table 2. These samples are used to evaluate the performance of the proposed method. Each variable will be generated with specified parameters. However, the variables in each sample must have the given correlation coefficients.
It is essential for the validation procedure to generate multivariate data using theoretical random distribution parameters and specific correlations. The inverse transform method is used for this purpose. The inverse transform method is a statistical technique used to generate random numbers from a given probability distribution. It uses the cumulative distribution function (CDF) of the desired distribution to transform a uniform random variable into a random variable with the desired distribution.
For this purpose, a computer algorithm is used to generate the multivariate data with the desired correlation coefficients between variables (Figure 1). To begin, a set of random vectors is generated from the multivariate normal distribution, with a defined mean vector and covariance matrix. The number of vectors generated is equal to the desired sample size, and each vector has dimensions of 1 by p, where p represents the number of variables or quality characteristics. The mean vector is set to zero, and the desired correlation matrix represents the variance–covariance matrix between all variables that need to be generated. Next, for each variable X i , where i ranges from 1 to p, an n-by-1 vector is generated using the inverse of the desired cumulative distribution function (CDF). The inverse CDF uses the parameters of the corresponding X i at the values of the cumulative distribution function of the normal distribution. Despite this, the output correlation between variables is almost equal to the desired correlation, and it varies in each run of the previous procedures. Therefore, the algorithm is run for several iterations until the difference between the desired and output correlation is less than suggested tolerance ε.
Furthermore, the algorithm for generating multivariate data with the desired correlation is used to generate data from the four samples’ parameters in Table 2. To examine the performance of the suggested multivariate PCI with different sample sizes, four different sample sizes have been generated from each sample. The sample sizes are 50, 100, 500, and 1000. For example, one sample of two variables from the gamma distribution with a sample size of 50 has been generated.
Then, the generated data ( X i ) is transformed to normal distribution ( Y i ) . This is done by reducing the skewness of the data. Since a normal distribution has zero skewness, the skewness of the generated data samples must be reduced. There are some common methods for reducing skewness in data such as logarithmic transformation and square-root transformation. In this research, the root transformation is used to reduce the skewness of the data. Root transformation looks for an optimal root (r) such that if the data were raised to the power r ( X r ), the skewness in the resulting data distribution would be almost zero. For this purpose, a software code was developed to search for the optimal root that would reduce the skewness of a given variable datapoint ( X i ) . This code is based on the iterative search either until the skewness is reduced to around zero or after performing a given number of iterations without improvement. Also, the specification limits of a given variable are transformed using the same root.
The transformed variables and limits are then divided by their corresponding specification limits to form new relative variables and specifications. The resulting specification limits for all variables are the same. Therefore, the relative variables are averaged to form a single variable. In this way, the multivariate variables are dimensioned to univariate. The mean and standard deviations of the averaged relative data are estimated to be used in estimating the multivariate process capability index. Using the mean and standard deviation, data are generated from the normal distribution with a large sample size (n = 1,000,000). Each single datapoint is compared with the relative specification in which nonconforming data are counted. Then, the percentage of nonconforming (PNC) data is computed by dividing the nonconforming data by the sample size (n). Finally, the PNC is utilized to compute the PCI using Equation (4). Generating the normal data and computing the PCI is performed 1000 times before the software displays the average PCI. Ten replications are run to estimate the standard deviation of the estimated PCI.

4. Results

The results of this research are related to three main subjects. These subjects are the quality of generating multivariate data with a desired correlation, skewness reduction of the generated data, and the effectiveness of the proposed method in estimating the actual PCI. The generated data should meet both the given parameters and correlation coefficients. Figure 2 shows the distribution fitting of the generated data. One variable’s data from each distribution was fitted to show the ability of the software code (Matlab R2023a) to generate data with the desired distribution and parameters. The upper right and left graphs of Figure 2 are for the same variable generated from the gamma distribution with shape and scale parameters of one and two, respectively. The upper left graph is the density function, whereas the graph in the upper right corner is the cumulative density function of the same variable data. Also, one variable from both the Beta and Weibull distributions were plotted using the cumulative density function. All the fitted data show very close fit and parameters.
Furthermore, the correlation coefficients between generated variables in each sample should be the same as the reference data in Table 2. The correlation between variables has a significant effect on the estimation of the PCI; that is, the greater the positive correlation, the less variation there is between variables. Consequently, the correlation between generated variables in each sample is presented in Table 3. The results shows that the correlations between the generated variables and the actual correlations are very close to each other. However, the data were generated in four different sample sizes (50, 100, 500, and 1000), and the correlations of all different sample sizes are close to the actual correlation. It is noticed that the samples of two variables have more accurate correlations than those of three variables.
Moreover, estimating the PCI required the data to be normally distributed. In this regard, the results of applying root transformation for skewness reduction are presented here. Figure 3 shows the skewness of what was generated before and after applying root transformation. The results ensure the effectiveness of root transformation in reducing the skewness of the data. Most of the skewness of the data after transforming is close to zero. The most skewness of the generated data before transformation was associated with the first variable of the gamma bivariate sample. However, after transforming the data using the root transformation method, the skewness was reduced to almost zero. It is worth noting that these are samples of size 1000 data.
The ultimate goal of this research is to come up with a capability index that evaluates process capability through multivariate quality characteristics (QCs). Multivariate process capability analysis is conducted to evaluate the capability of a given process, which produces products with multivariate quality characteristics (QCs) to meet customer and/or engineering requirements. In this research, the process performance is measured using the process capability index, in which a process with a process capability index of one or more is considered capable of producing products with given specification limits, whereas a process capability index of less than one indicates that the process may produce products outside of the specification limits. That is because the process capability index divides the difference between the mean of the process by the three times of standard deviation, in which the three iterations of standard deviation are the normal tolerance for each process. By applying the proposed methodology, it is supposed that the resulting PCI reflects the true performance of the considered process. To measure the effectiveness of the proposed multivariate process capability, Table 4 shows the results of multivariate process capability indices for given distributions using the proposed method, along with their actual PCIs. Samples from gamma, Beta, and Weibull distributions have been used in this research. The results show that proposed methodology reveals multivariate PCIs close to the actual. The first sample consists of two variables, and the results of applying the proposed methodology on this data revealed multivariate PCIs around 0.9, depending on the sample size. The actual multivariate PCI of this sample is 0.89. It is noted that for this sample, the greater the sample size is, the closer the proposed multivariate PCI is to the actual. Also, the proposed multivariate PCIs for the other samples are close to the actual, either underestimated or overestimated, such as the sample of gamma distribution with three variables. However, the Beta distribution sample results are close to the actual multivariate PCI but all underestimated from the actual for all sample sizes. Finally, the results of the Weibull sample also show close results to the actual, especially for large samples. However, all the results of the Weibull samples are overestimated.

5. Discussion

The results of this research emphasize the significance of the proposed methodology in processing real data and estimating the process capability index of a given process through multivariate QCs. Generating special data that follow a specific distribution with specific parameters and a determined correlation is a very important research direction. Transforming this method into a software code would facilitate studying the effect of correlation in process capability analysis. This could be done by generating data from the same distribution with the same parameters and different levels of correlation. Also, combining the transformation method with generating data in one algorithm could be utilized to search for samples that could be transformed to normality easily. The part of skewness reduction in the algorithm could be combined in practice with other approaches that may enhance the other properties of normal distribution, such as bringing the mean, mode, and median close to each other.
The presented results in the previous section show that the proposed methodology has the ability to estimate multivariate PCIs precisely, since almost all the estimated multivariate PCIs are very close to the actual. Moreover, the proposed methodology in this research has been applied to bivariate samples and samples with three variables. Both types of samples showed high performance.
Furthermore, the samples investigated in this research have been studied in the literature using different methodologies. In this regard, Abbasi [41] estimated the multivariate PCIs of the same 16 samples used in this research. They presented a good estimation comparing to the actual PCIs. However, the results in this research outperform their results in most cases. Table 5 presents a comparison between our research results and results from previous research. Both studies revealed little variation from the actual PCIs. These variations are due to either overestimating or underestimating the actual PCIs. To present a clear comparison between the results from this research and the results from previous research, the mean absolute percentage error (MAPE) is computed for each sample for both approaches.
Mean absolute percentage error (MAPE) is a measure of estimation accuracy in statistics. It usually expresses the accuracy as a ratio defined by the formula:
M A P E = A P C I E P C I A P C I 100 %
where APCI is the actual MPCI, and EPCI is the estimated MPCI. MAPE can be interpreted as the average percentage error of the MPCI estimation compared to the actual values. A lower MAPE indicates a better estimation and a higher accuracy. MAPE is commonly used in model evaluation because of its very intuitive interpretation in terms of relative error. According to the MAPE measure, the research estimation of PCIs outperforms the previous results in 12 samples out of 16 samples. In particular, from eight samples of gamma distribution, the research estimation perform better in six samples, whereas PCI estimations of Beta distribution samples using this research approach are always better. Regarding the Weibull distribution samples, the approach of this research performs well with large samples.
The variations among the estimated multivariate PCIs are due to the associated randomness in the data. The randomness sources exist in different steps of the proposed methodology, starting with the data generation of the used data for evaluating the proposed methodology or for estimating the PNCs. The variations observed in multivariate data generation using the Monte Carlo simulation from one run to another depend on several factors, such as the number of samples drawn from the distribution. The larger the number of samples, the more accurate and representative the synthetic data will be of the true distribution. However, larger sample sizes also require more computational resources and time. Another factor is the random number generator used to draw the samples. The quality and reliability of the random number generator affect the randomness and independence of the samples. A poor random number generator may introduce bias or correlation in the synthetic data that is not present in the true distribution. Therefore, generating data from a specific random distribution with specific parameters many times will result in different data in each run.
Moreover, the proposed methodology involves randomness in terms of searching for the best root transformation. Each run may result in a different root for transforming the data and will generate different sample for comparing with the transformed specification limits. Consequently, slight differences of multivariate PCIs are experienced from different replications.

6. Managerial Insights

Multivariate process capability indices (MPCIs) are useful tools to evaluate the quality and performance of a manufacturing process that involves two or more correlated product characteristics. However, implementing MPCI in real-world contexts may face some challenges and constraints, such as:
  • Collecting and analyzing sufficient and representative data from the process. To calculate MPCI, one needs to have enough data from the process to estimate the parameters of the joint distribution and variation of the product characteristics. The data should also be representative of the normal operating conditions of the process, without any special causes of variation or outliers. Moreover, the data should be collected in a timely and efficient manner, using appropriate sampling techniques and measurement systems.
  • Communicating and interpreting the results of MPCI to stakeholders. MPCIs are numerical measures that quantify the capability of a multivariate process, but they may not be easy to understand or communicate to stakeholders who are not familiar with statistics or quality engineering. Therefore, it is important to present and interpret the results of MPCI in a clear and meaningful way, using graphical displays, tables, or verbal descriptions. For example, one can use scatterplots or contour plots to visualize the joint distribution and variation of the product characteristics, as well as the tolerance region and the process region. One can also use tables to compare different MPCIs or different processes based on their values or rankings. One can also use verbal descriptions to explain what MPCI mean in terms of proportion of nonconforming units or customer satisfaction.
These are some insights into how the proposed methodology could be practically implemented in manufacturing contexts, considering the real-world challenges and constraints. Furthermore, in the real industry, especially in manufacturing organizations, most of their products have more than one quality characteristics. Therefore, the practitioners need to evaluate their outputs using a single index that combine all the QCs of one product. Actually, the QCs of one product are often functionally correlated with each other, in which all QCs should be evaluated together. Consequently, this proposed methodology can help quality professionals and practitioners to evaluate their processes. Moreover, the proposed methodology suggests a way for transforming the nonnormal data into normality, as most of the real case data are not normally distributed. Generally, the proposed methodology in this research has provided a general framework for evaluating real case processes with multivariate data.

7. Conclusions

This research presents a general framework that leads to estimating process capability indexes for multivariate data. Multivariate data exists in a wide range in real industry applications. Most of the products have more than one characteristic that is critical to quality from customer and engineering specifications viewpoints, which leads investigators to collect multiple responses for the multi-quality characteristics. The collected multivariate data should be analyzed together due to their functional correlation. The presented framework in this paper provides solutions for most issues associated with multivariate data, including the normality assumption, dimension reduction, and performance evaluation using multivariate PCIs. Moreover, the proposed multivariate PCI’s effectiveness is justified through the implementation of multivariate data from different distributions with known multivariate PCIs. It is worth noting that the statistical correlation between the multivariate data affects the estimation of multivariate PCIs. Therefore, this paper applied an algorithm that generates multivariate data, with a determined correlation. Consequently, applying the proposed multivariate PCI algorithm on the generated data allows for examining how good the proposed is. In addition to generating samples from different distributions, different sample sizes from each sample were generated. In conclusion, the proposed multivariate PCI algorithm was applied for different samples from different distributions and different sample sizes. The results show the robustness of the proposed algorithm, which revealed multivariate PCIs close to the actual PCIs of the used samples for different distributions and different sample sizes. Finally, the research results indicate that the proposed multivariate PCI outperforms the previous published algorithm in most cases.

Author Contributions

Conceptualization, M.A. and A.M.A.-A.; methodology, M.A. and A.Y.A.; software, M.A.; validation, A.M.A.-A. and A.Y.A.; formal analysis, M.A.; investigation, M.A.; resources, M.A.; data curation, M.A.; writing—original draft preparation, M.A.; writing—review and editing, A.Y.A.; visualization, M.A.; supervision, A.M.A.-A. and A.Y.A.; project administration, A.M.A.-A. and A.Y.A.; funding acquisition, A.M.A.-A. and A.Y.A. All authors have read and agreed to the published version of the manuscript.

Funding

This study received funding from the Raytheon Chair for Systems Engineering. The authors are grateful to the Raytheon Chair for Systems Engineering for funding.

Data Availability Statement

The data used in this study are available in this article.

Conflicts of Interest

The authors declare no conflict of interest.

References

  1. Al-Refaie, A.; Bata, N. Evaluating measurement and process capabilities by GR&R with four quality measures. Measurement 2010, 43, 842–851. [Google Scholar]
  2. Wang, F.-K.; Du, T. Using principal component analysis in process performance for multivariate data. Omega 2000, 28, 185–194. [Google Scholar] [CrossRef]
  3. Hahn, G.J.; Hill, W.J.; Hoerl, R.W.; Zinkgraf, S.A. The impact of Six Sigma improvement—A glimpse into the future of statistics. Am. Stat. 1999, 53, 208–215. [Google Scholar]
  4. Wang, F. Quality evaluation of a manufactured product with multiple characteristics. Qual. Reliab. Eng. Int. 2006, 22, 225–236. [Google Scholar] [CrossRef]
  5. Taam, W.; Subbaiah, P.; Liddy, J.W. A note on multivariate capability indices. J. Appl. Stat. 1993, 20, 339–351. [Google Scholar] [CrossRef]
  6. Chen, H. A multivariate process capability index over a rectangular solid tolerance zone. Stat. Sin. 1994, 4, 749–758. [Google Scholar]
  7. Shahriari, H.; Hubele, N.; Lawrence, F. A multivariate process capability vector. In Proceedings of the 4th Industrial Engineering Research Conference, Institute of Industrial Engineers, Nashville, TN, USA, 24–25 May 1995. [Google Scholar]
  8. Braun, L.J. New Methods in Multivariate Statistical Process Control(MSPC). Diskuss. Des Fachgeb. Unternehm. 2001, 1–12. [Google Scholar]
  9. Castagliola, P.; Castellanos, J.-V.G. Capability indices dedicated to the two quality characteristics case. Qual. Technol. Quant. Manag. 2005, 2, 201–220. [Google Scholar] [CrossRef]
  10. Bothe, D.R. A capability index for multiple process streams. Qual. Eng. 1999, 11, 613–618. [Google Scholar] [CrossRef]
  11. Boyles, R.A. Process Capability With Asymmetric Tolerances. Commun. Stat.-Simul. Comput. 1994, 23, 615–643. [Google Scholar] [CrossRef]
  12. Davis, R.D.; Kaminsky, F.C.; Saboo, S.J. Process capability analysis for processes with either a circular or a spherical tolerance zone. Qual. Eng. 1992, 5, 41–54. [Google Scholar] [CrossRef]
  13. Yeh, A.B.; Bhattacharya, S. A robust process capability index. Commun. Stat.-Simul. Comput. 1998, 27, 565–589. [Google Scholar] [CrossRef]
  14. Veevers, A. Viability and capability indexes for multiresponse processes. J. Appl. Stat. 1998, 25, 545–558. [Google Scholar] [CrossRef]
  15. Dianda, D.F.; Quaglino, M.B.; Pagura, J.A. Impact of measurement errors on the performance and distributional properties of the multivariate capability index. AStA-Adv. Stat. Anal. 2018, 102, 117–143. [Google Scholar] [CrossRef]
  16. Peruchi, R.S.; Rotela Junior, P.; Brito, T.G.; Largo, J.J.J.; Balestrassi, P.P. Multivariate process capability analysis applied to AISI 52100 hardened steel turning. Int. J. Adv. Manuf. Technol. 2018, 95, 3513–3522. [Google Scholar] [CrossRef]
  17. Chatterjee, M.; Chakraborty, A.K. Unification of some multivariate process capability indices for asymmetric specification region. Stat. Neerl. 2017, 71, 286–306. [Google Scholar] [CrossRef]
  18. Dianda, D.F.; Quaglino, M.B.; Pagura, J.A. Distributional Properties of Multivariate Process Capability Indices under Normal and Non-normal Distributions. Qual. Reliab. Eng. Int. 2017, 33, 275–295. [Google Scholar] [CrossRef]
  19. Vasquez, M.; Ramirez, G.; Garcia, T. A multivariate process capability index based on non-conforming probability, an illustration about monitoring the quality of a clarified water loop. Ing. UC 2016, 23, 319–326. [Google Scholar]
  20. Pan, J.N.; Li, C.I.; Shih, W.C. New multivariate process capability indices for measuring the performance of multivariate processes subject to non-normal distributions. Int. J. Qual. Reliab. Manag. 2016, 33, 42–61. [Google Scholar] [CrossRef]
  21. Ciupke, K. Multivariate Process Capability Index Based on Data Depth Concept. Qual. Reliab. Eng. Int. 2016, 32, 2443–2453. [Google Scholar] [CrossRef]
  22. Ciupke, K. Multivariate Process Capability Vector Based on One-Sided Model. Qual. Reliab. Eng. Int. 2015, 31, 313–327. [Google Scholar] [CrossRef]
  23. Mondal, S.C. A study of multivariate process capability indices in manufacturing processes. In Proceedings of the 2015 IEEE International Conference on Industrial Engineering and Engineering Management (IEEM), Singapore, 6–9 December 2015; pp. 1382–1386. [Google Scholar]
  24. Pan, J.-N.; Huang, W.K.C. Developing New Multivariate Process Capability Indices for Autocorrelated Data. Qual. Reliab. Eng. Int. 2015, 31, 431–444. [Google Scholar] [CrossRef]
  25. Siman, M. Multivariate Process Capability Indices: A Directional Approach. Commun. Stat.-Theory Methods 2014, 43, 1949–1955. [Google Scholar] [CrossRef]
  26. Zhang, M.; Wang, G.A.; He, S.G.; He, Z. Modified Multivariate Process Capability Index Using Principal Component Analysis. Chin. J. Mech. Eng. 2014, 27, 249–259. [Google Scholar] [CrossRef]
  27. Tano, I.; Vannman, K. A Multivariate Process Capability Index Based on the First Principal Component Only. Qual. Reliab. Eng. Int. 2013, 29, 987–1003. [Google Scholar] [CrossRef]
  28. Das, N.; Dwivedi, P.S. Multivariate Process Capability Index: A Review and Some Results. Econ. Qual. Control 2013, 28, 151–166. [Google Scholar] [CrossRef]
  29. Bashiri, M.J.M.; Amiri, A. A New Multivariate Process Capability Index under Both Unilateral and Bilateral Quality Characteristics. Qual. Reliab. Eng. Int. 2012, 28, 925–941. [Google Scholar] [CrossRef]
  30. Niavarani, M.R.; Noorossana, R.; Abbasi, B. Three New Multivariate Process Capability Indices. Commun. Stat.-Theory Methods 2012, 41, 341–356. [Google Scholar] [CrossRef]
  31. Scagliarini, M. Multivariate process capability using principal component analysis in the presence of measurement errors. AStA-Adv. Stat. Anal. 2011, 95, 113–128. [Google Scholar] [CrossRef]
  32. Pan, J.N.; Lee, C.Y. New capability indices for evaluating the performance of multivariate manufacturing processes. Qual. Reliab. Eng. Int. 2010, 26, 3–15. [Google Scholar] [CrossRef]
  33. Ahmad, S.; Abdollahian, M.; Zeephongsekul, P.; Abbasi, B. Multivariate nonnormal process capability analysis. Int. J. Adv. Manuf. Technol. 2009, 44, 757–765. [Google Scholar] [CrossRef]
  34. Wen, D.C.; Lv, H. Multivariate Process Capability Index Based on the Additivity of Normal Distribution. In Proceedings of the 2008 4th International Conference on Wireless Communications, Networking and Mobile Computing, Dalian, China, 12–14 October 2008. [Google Scholar]
  35. Pearn, W.L.; Wang, F.K.; Yen, C.H. Multivariate capability indices: Distributional and inferential properties. J. Appl. Stat. 2007, 34, 941–962. [Google Scholar] [CrossRef]
  36. Wang, C.H. Constructing multivariate process capability indices for short-run production. Int. J. Adv. Manuf. Technol. 2005, 26, 1306–1311. [Google Scholar] [CrossRef]
  37. Wang, F.; Chen, J.C. Capability index using principal components analysis. Qual. Eng. 1998, 11, 21–27. [Google Scholar] [CrossRef]
  38. Castagliola, P. Evaluation of non-normal process capability indices using Burr’s distributions. Qual. Eng. 1996, 8, 587–593. [Google Scholar] [CrossRef]
  39. Pearn, W.L.; Shiau, J.J.H.; Tai, Y.T.; Li, M.Y. Capability Assessment for Processes with Multiple Characteristics: A Generalization of the Popular Index C-pk. Qual. Reliab. Eng. Int. 2011, 27, 1119–1129. [Google Scholar] [CrossRef]
  40. Shiau, J.J.H.; Yen, C.L.; Pearn, W.; Lee, W.T. Yield-related process capability indices for processes of multiple quality characteristics. Qual. Reliab. Eng. Int. 2013, 29, 487–507. [Google Scholar] [CrossRef]
  41. Abbasi, B.; Akhavan Niaki, S.T. Estimating process capability indices of multivariate nonnormal processes. Int. J. Adv. Manuf. Technol. 2010, 50, 823–830. [Google Scholar] [CrossRef]
  42. Clements, J.A. Process Capability Calculations For Non-Normal Distributions. Qual. Prog. 1989, 22, 95–97. [Google Scholar]
  43. Somerville, S.E.; Montgomery, D.C.J. Process capability indices and non-normal distributions. Qual. Eng. 1996, 9, 305–316. [Google Scholar] [CrossRef]
  44. Zimmer, L. Process Capability Indices in Theory and Practice. Technometrics 2000, 42, 206–207. [Google Scholar] [CrossRef]
  45. Deleryd, M. On the gap between theory and practice of process capability studies. Int. J. Qual. Reliab. Manag. 1998, 15, 178–191. [Google Scholar] [CrossRef]
  46. Wu, H.; Wang, J.; Liu, T. Discussions of the Clements-based process capability indices. In Proceedings of the 1998 CIIE National Conference; pp. 561–566. Available online: https://www.ciie.org/zbh/en/activities/thirdciie/agenda/ (accessed on 8 September 2023).
  47. Kotz, S.; Johnson, N.L. Process capability indices—A review, 1992–2000. J. Qual. Technol. 2002, 34, 2–19. [Google Scholar] [CrossRef]
  48. Liu, P.-H.; Chen, F.-L. Process capability analysis of non-normal process data using the Burr XII distribution. Int. J. Adv. Manuf. Technol. 2006, 27, 975–984. [Google Scholar] [CrossRef]
  49. Piao, C.; Zhi-Sheng, Y. A systematic look at the gamma process capability indices. Eur. J. Oper. Res. 2018, 265, 589–597. [Google Scholar]
  50. Li, C.-J.; Deng, W.-P.; Cao, Y.-Y.; Bao, Y. Process capability analysis in non-normality based on Box-Cox transformation and Johnson transformation. J. Qiqihar Univ. Nat. Sci. Ed. 2015. Available online: https://www.scinapse.io/papers/2383696946 (accessed on 8 September 2023).
  51. Bernardo, J.M.; Irony, T.Z.J. A general multivariate Bayesian process capability index. J. R. Stat. Society. Ser. D 1996, 45, 487–502. [Google Scholar] [CrossRef]
  52. Wang, F.-K.; Hubele, N.F.J. Quality evaluation using geometric distance approach. Int. J. Reliab. Qual. Saf. Eng. 1999, 6, 139–153. [Google Scholar] [CrossRef]
  53. Pal, S.J. Evaluation of nonnormal process capability indices using generalized lambda distribution. Qual. Eng. 2004, 17, 77–85. [Google Scholar] [CrossRef]
  54. Chen, K.-S.; Hsu, C.-H.; Wu, C.-C. Process capability analysis for a multi-process product. Int. J. Adv. Manuf. Technol. 2006, 27, 1235–1241. [Google Scholar] [CrossRef]
  55. Niaki, S.T.A.; Abbasi, B.J. Skewness reduction approach in multi-attribute process monitoring. Commun. Stat.-Theory Methods 2007, 36, 2313–2325. [Google Scholar] [CrossRef]
  56. Perakis, M.; Xekalaki, E. On the Implementation of the Principal Component Analysis–Based Approach in Measuring Process Capability. Qual. Reliab. Eng. Int. 2012, 28, 467–480. [Google Scholar] [CrossRef]
  57. Dharmasena, L.; Zeephongsekul, P. A new process capability index for multiple quality characteristics based on principal components. Int. J. Prod. Res. 2016, 54, 4617–4633. [Google Scholar] [CrossRef]
  58. Wang, S.; Wang, M.; Fan, X.; Zhang, S.; Han, R. A multivariate process capability index with a spatial coefficient. J. Semicond. 2013, 34, 026001. [Google Scholar] [CrossRef]
  59. Gu, K.; Jia, X.; Liu, H.; You, H. Yield-based capability index for evaluating the performance of multivariate manufacturing process. Qual. Reliab. Eng. Int. 2015, 31, 419–430. [Google Scholar] [CrossRef]
  60. Tiwari, V.; Singh, N. Process capability index for bivariate exponentially distributed quality characteristics and its sampling properties. Commun. Stat.-Theory Methods 2017, 46, 11099–11109. [Google Scholar] [CrossRef]
Figure 1. Generating multivariate data with desired correlation.
Applsci 13 11616 g001
Figure 2. Distribution fitting of generated data.
Applsci 13 11616 g002
Figure 3. Skewness of the generated data before and after root transformation.
Applsci 13 11616 g003
Table 1. Research methodology steps.
StepsDescriptionsComments
Step 1Collect the sample (X) by specifying the process, the number of its QCs (p), and the sample size (n).X consists of p QCs, and p  2 . Each QC consists of n sample size.
Step 2Compute transformed variable ( Y i ) using appropriate transformation method. Y i = Y i ( X i ) ; i = 1 ,   2 , , p .
Step 3Transform and standardize the specifications limits by the same parameters of step 2.Compute U S L z   a n d   L S L z .
Step 4Find relative variables ( r i ) by dividing each variable in Y i by corresponding specification limit. r i = Y i U S L y
Step 5Find the average of r i . r ¯ = r 2 + r 1 + + r n n
Step 6Compute pooled standard deviation of ( Y i ). S P = ( n 1 1 ) S 2 1 + ( n 2 1 ) S 2 2 n 1 + n 2 2
Step 7Generate large (N) sample normal distribution with mean of r ¯ and S P . N = T o t a l   #   o f   g e n e r a t e d   v e c t o r s .
Step 8Estimate portion of nonconforming (PNC). N N C = #   o f   d a t a   o u t   o f   U S L   &   L S L
P N C = N N C N .
Step 9Estimate PCI using PNC. C p = φ 1 ( 0.5 + 0.5 ( 1 P N C ) ) 3 .
Table 2. Actual PCI for known theoretical distributions [41].
DistributionVariableUSL α β CorrelationActual PCI
gamma X1 13 1 2 1 0.49 0.89
X2 26 2 3 0.49 1
gamma X1 130 5 7 1 −0.37 0.58 1.18
X2 58 6 3 −0.37 1 −0.28
X3 150 2 8 0.58 −0.28 1
Beta X1 0.99 2 5 1 0.79 1.12
X2 0.99 4 4 0.79 1
Weibull X1 7 2 2 1 0.28 0.58 1.28
X2 9 4 3 0.28 1 0.49
X3 10 6 6 0.58 0.49 1
Table 3. Comparison of correlation between generated variables with actual.
DistributionGammaGammaBetaWeibull
VariablesX1, X2X1, X2X1, X3X2, X3X1, X2X1, X2X1, X3X2, X3
Sample sizen = 500.491−0.3670.574−0.2840.7900.2880.5920.494
n = 1000.490−0.3650.582−0.2750.7900.2860.5760.494
n = 5000.491−0.3680.584−0.2810.7900.2930.5760.487
n = 10000.491−0.366−0.366−0.2650.7920.2930.5800.494
Actual correlation0.49−0.370.58−0.280.790,290.580.49
Table 4. Results of proposed multivariate process capability indices.
DistributionnUSL α β Correlation C P
MeanStdActual
gamma 50 0.932 0.000 0.89
100 13 1 2 1 0.49 0.895 0.000
500 26 2 3 0.49 1 0.872 0.006
1000 0.892 0.000
gamma 50 130 5 7 1 −0.37 0.58 1.155 0.001 1.18
100 58 6 3 −0.37 1 −0.28 1.2117 0.001
500 150 2 8 0.58 −0.28 1 1.1806 0.001
1000 1.2050 0.000
Beta 50 0.957 0.000 1.12
100 1 2 5 1 0.79 1.088 0.000
500 1 4 4 0.79 1 1.041 0.000
1000 1.102 0.001
Weibull 50 7 2 2 1 0.28 0.58 1.685 0.010 1.28
100 9 4 3 0.28 1 0.49 1.125 0.000
500 10 6 6 0.58 0.49 1 1.278 0.000
1000 1.284 0.000
Table 5. Comparing research results with previous results.
SampleResults[41]Actual
CpMAPECpMAPE
10.9324.7%0.8642.9%0.89
20.8950.6%0.8652.8%0.89
30.8722.0%0.8722.0%0.89
40.8920.2%0.8880.2%0.89
51.1552.1%1.2082.4%1.18
61.21172.7%1.2586.6%1.18
71.18060.1%1.1482.7%1.18
81.2052.1%1.1720.7%1.18
90.95714.6%0.88521.0%1.12
101.0882.9%110.7%1.12
111.0417.1%0.99711.0%1.12
121.1021.6%0.97512.9%1.12
131.68531.6%1.41110.2%1.28
141.12512.1%1.2981.4%1.28
151.2780.2%1.2671.0%1.28
161.2840.3%1.2971.3%1.28
Disclaimer/Publisher’s Note: The statements, opinions and data contained in all publications are solely those of the individual author(s) and contributor(s) and not of MDPI and/or the editor(s). MDPI and/or the editor(s) disclaim responsibility for any injury to people or property resulting from any ideas, methods, instructions or products referred to in the content.

