Article

Experimental Study on the Influence of Different Dam Body on the Sediment Interception and Discharge Capacity of the Cascade Permeable Dams

1
College of Energy and Power Engineering, Xihua University, Chengdu 610039, China
2
College of Water Resource and Hydropower, Sichuan University, Chengdu 610065, China
3
State Key Laboratory of Hydraulics and Mountain River Engineering, Sichuan University, Chengdu 610065, China
*
Author to whom correspondence should be addressed.
Appl. Sci. 2023, 13(20), 11607; https://doi.org/10.3390/app132011607
Submission received: 5 September 2023 / Revised: 11 October 2023 / Accepted: 22 October 2023 / Published: 23 October 2023

Abstract

:
Sediment deposition is an ecological and environmental problem faced by most water bodies. In view of the poor structural stability and unrepeatable use of existing permeable structures, this paper proposes a cascade permeable dam, which consists of four dam bodies. As the composition of the dam material is the key to sediment interception and discharge capacity, this study sets up two groups of dam material particle sizes for experiments. The results show that the sediment interception performance of the cascade permeable dam is good. When the dam material with a small particle size is selected, the percentage of intercepted sediment mass inside the four dam bodies is 75–89%. The interception sediment rate is much greater than that of the dam material with a large particle size, which tends to decline one by one along the flow direction. The discharge capacity of the dam gradually decreases with time, and there is an obvious decrease in the permeability coefficient of 1# dam. The results of this study provide programmatic support for reducing sediment entering shallow lakes and rivers, which can further optimize the structure design of permeable dams.

1. Introduction

Large amounts of sediment particles and pollutants are carried into lakes by hydraulic erosion and sediment transport, resulting in a rapid increase in the amount of sediment deposition [1]. Sediment deposition occurs in most lakes worldwide [2,3]. For example, the amount of sediment in Malawi Lake is up to 9.5 Mt/y [4], the silt sedimentation in Machang Lake has led to a rise in the lake bed [5], and the sedimentation in Pavanje River has caused heterogeneous streambed hydraulic conductivity change [6]. Massive sediment can increase water turbidity and reduce light projection, thus reducing lake biodiversity and damaging the ecosystem [7,8,9]. Sediments with a large water content contribute to the black odor and eutrophication of lakes through the continuous adsorption of organic salts, trace metals, and microplastics [10,11,12]. In addition, rainfall and surface runoff intensify the rate of soil erosion [13], which accelerates the process of sediment accumulation and depletion of the lake, eventually facing the consequences of being filled up or disappearing. Therefore, it is urgent to take appropriate measures to reduce the amount of sediment in lakes and rivers, to protect the water quality and ecological environment health [14,15].
There are many ways to control and capture the sediment in the flow [16]. Permeable structures are widely used for sediment control due to their simplicity and low cost [17]. Based on in situ purification techniques, the water quality of the lakes is improved mainly by physically filtering, depositing, infiltrating, and briefly storing water in front of the dam. Common permeable structures mainly include vegetative filter strips (VFS), check dams, and permeable dams [18,19], which are generally made of shrubs, bamboo, gravel, and concrete. When different plant densities, covers, and widths are selected, there are some differences in the sediment strapping efficiency of VFS [20,21,22]. Gharabaghi et al. and Yuan et al. suggested that VFS with a 3–6 m width is the most effective in removing sediment [23,24]. It is worth noting that the sediment-capturing efficiency of the VFS is strongly influenced by seasonal changes and rainfall intensity [25]. Check dams are one of the most effective engineering measures to intercept and retain sediment [26,27,28], which can promote the deposition of sediment by decreasing the runoff velocity [29,30]. Check dams include closed-type and open-type. Open check dams are designed to pass away part of the water and sediment, so they have a better filtering and sediment classification function [31]. Mishra et al. proposed that a check dam can reduce nearly 50% of the sediment output of a small watershed [32]. Zhan et al. pointed out that the construction of the check dam promoted the sediment deposition upstream, and thus decreased the sediment concentration and water turbidity at the intake [33]. Hassanli et al. proposed that using broken and angular dam material in a porous check dam’s construction improves the efficiency of the check dams for the retention of fine sediments [34]. However, the existing check dams are not effective in controlling the transport of sediment in natural rivers. And inappropriate site selection of check dams will decrease the capture and retention efficiency of sediment [35]. Permeable dams are widely used in the world and enjoy a long history [18]. Wang et al. investigated the effect of dams on nitrogen and phosphorus removal by constructing four sandstone dams in the Luan River, and the data collected in the field showed that the removal rates of total nitrogen and phosphorus reached 39.52% and 60.68% [36]. Yuan et al. pointed out that permeable dams not only remove nitrogen and phosphorus, but also can dissolve other organic matter [37]. Winterwerp et al. summarized the use of permeable dams around the world in the past 15 years, indicating that permeable dams can be used to capture sediment efficiently [18]. But bamboo permeable dams decompose easily and are complicated to maintain in later periods [19]. Based on the research and application of different permeable structures, permeable structures are faced with problems such as poor stability and difficulty in reuse after clogging. In summary, in order to effectively reduce the amount of sedimentation in the lakes and prevent structural damage to the dams, this paper proposes an assembled cascade permeable dam, including four dam bodies that mainly divide into three zones. Dam material is the key to intercept and adsorb sediment, so two groups of particle sizes of dam material are selected for physical experimental study. The main purpose is to study the following: (1) the response of the sediment interception and discharge capacity of the cascade permeable dam to the flow rate and sediment concentration, and (2) the variation in the hydraulic property of different dam bodies and zones on the cascade permeable dams. The research results can provide new technical support for the selection of sediment interception, which is of great significance for reducing sediment load in the lakes and improving the water quality.

2. Materials and Methods

2.1. Similarity Criterion and Parameter Calculation

Xinglong Lake in Chengdu City is an artificial lake built by the Luxi River. The total area of Xinglong Lake is about 4.5 million square meters, of which the water area is about 2.8 million square meters. The average water depth is about 2.5 m, and the width of the river channel is about 1.5 m. As shown in Figure 1, the river channel at the upstream inlet of Xinglong Lake (103°47′59″~104°15′34″ E, 30°13′38″~30°40′23″ N) in Chengdu City is taken as the geometrical shape and dimension of prototype, and relevant experimental design is carried out according to Froude similarity criterion. The geometrical parameters (L) and sediment parameters (d) follow the relationship in Formula (1).
λ L = L p o r t L m o d = 10 ,     λ d = λ v 2 λ h 2 λ γ s γ γ λ L 2
During the experimental process, the water level can be read and recorded frequently during the fixed intervals along the flume. According to the recorded dates, the parameters of relative water level and water level differences can be calculated directly by Formulas (2) and (3). The permeability coefficient is usually obtained by empirical, indoor, and field methods, etc. Since the experiments in this paper were carried out in a flat slope (i = 0), the permeability coefficient of the dam body can be obtained by Darcy’s Law [38], and the calculation formula is shown in (4). At the end of the experiments, the intercepted sediment in front of and inside each dam was collected and weighed after drying. By dividing the sediment mass at different locations by the total intercepted sediment mass in the cascade permeable dam, the percentage of intercepted sediment mass can be obtained. This value can be used to evaluate the sediment interception efficiency by each dam in the cascade permeable dam; the calculation formula is shown in (5).
Δ h j , t = H j , t H j , 0 ( j = 1 , 2 , 3 , 4 )
L D j , t = H j . t H j , t
k = 2 q s H j , t 2 H j + 1 , t 2
P = m M × 100
where j is the dam serial number, which is 1#, 2#, 3#, and 4# dam; t is the experimental time, t = 0 represents the initial condition, min; Δhj,t represents the relative water level in front of the j# dam, cm; Hj,t is the water level in front of the j# dam, cm; LDj,t represents the water level difference before and behind the j# dam, cm; H j t is the water level behind the j# dam, cm; k is the permeability coefficient of the dam, m/s; q is a single width flow discharge, m2/s; s is the thickness of dam, m; P is the percentage of intercepted sediment mass by the dam, dimensionless; m is the intercepted sediment mass at a certain location at the end of the experiments, g; M is the total intercepted sediment mass by the cascade permeable dam at the end of the experiments for each group, g.

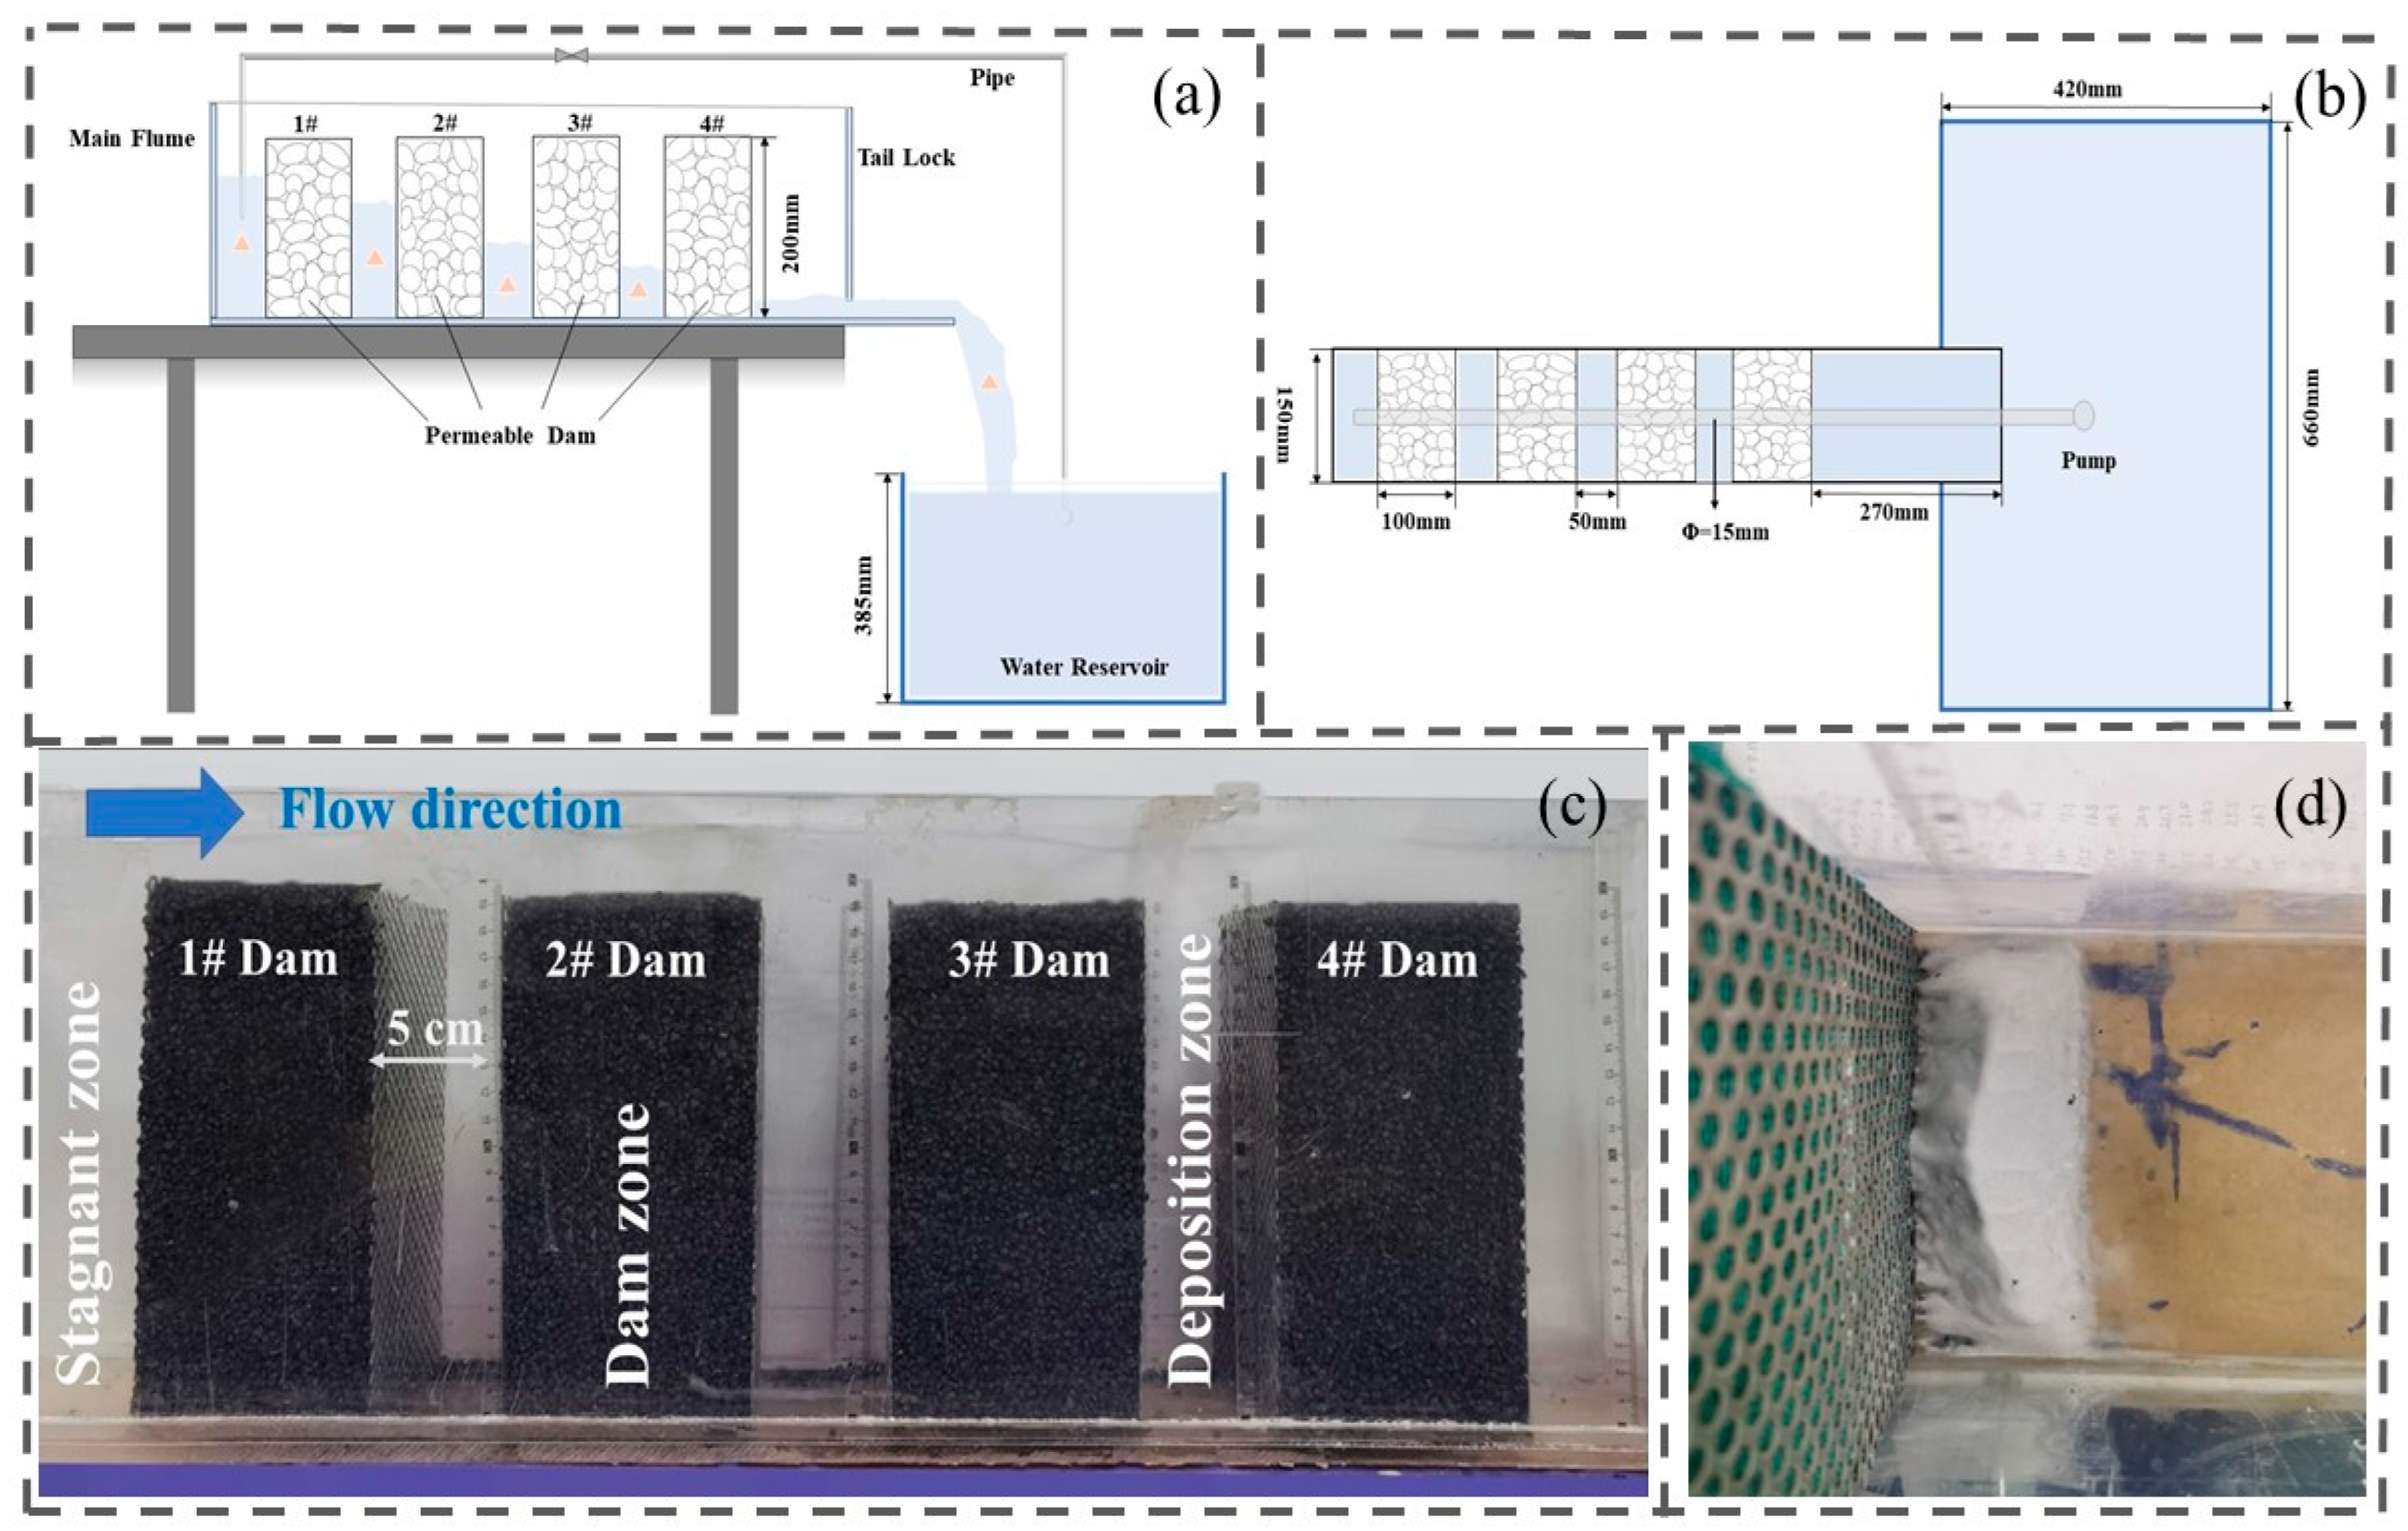
2.2. Experimental Setup

As shown in Figure 2, the experimental setup mainly consists of a main flume, a cascade permeable dam, and a water reservoir. The main dimension of the reservoir is 660 × 420 × 385 mm, to which quartz sand with a particle size of 0.05 mm was added to simulate the upstream water before the dam. The mixture in the reservoir was transported to the front of the main flume by a pump through a water pipe with an internal diameter of 15 mm, with a valve installed on the water pipe to stabilize the required discharge. The main flume made of Plexiglass is 900 × 150 × 250 mm, with a horizontal bottom. Four permeable dam bodies were placed in it, in the order of 1#, 2#, 3#, and 4# along the flow direction. The permeable dam is made of perforated steel plates filled with gravels of 1–2 and 3–5 mm, with dimensions of 100 × 150 × 200 mm. In this study, the zone in front of 1# dam is called the Stagnant zone, the zone between two adjacent dams is called the Deposition zone, and the interior of the four dam bodies is collectively called the Dam zone (see Figure 2c). During the filling process of dams, the gravel was compacted and the dry mass of the gravel was recorded to ensure that the porosity of the dam was close for each group and the dams were stable at all flow discharges. After the beginning of the experiments, water levels were recorded every 5 min and water samples of 50 mL were taken every 10 min from the main flume and reservoir. The turbidity was measured by HACH 2100Q turbidity meter. The triangle in Figure 2a marks the water sampling position in the experiments. In addition, samples were taken from the reservoir frequently and the turbidity was measured immediately, then quartz sand was added to the reservoir in time to maintain the required inflow sediment concentration.

2.3. Experimental Condition

We set up three groups discharging 300, 500, and 700 L/H, respectively, to simulate the inflow for experiments. The particle size of the sediment in Xinglong Lake is generally 0.025~0.12 mm, and quartz sand of 0.05 mm was selected by Formula (1) to replace sediment in this experiment. Since gravel is a common material in construction, gravels with particle sizes of 1–2 and 3–5 mm were finally selected as the dam material. The sediment concentration into the lake of 1.0, 1.5, and 2.0 g/L was selected for the flume experiments, which is similar to Soler et al.’s research [39]. In order to explore the effect of the dam particle sizes on the discharge capacity of the cascade permeable dam, nine influent conditions were set for the experiments, and the design of the working conditions is detailed in Table 1. In the pre-experiment, the water level in front of 1# dam rose by 2 and 3 cm, respectively, corresponding to a maximum of 875 and 185 min, at which point the water level change in front of 1# dam reached a stable trend, so the experiments under different conditions ended when the water level in front of 1# dam rose by 2 (D = 3–5 mm) and 3 (D = 1–2 mm) cm, respectively.

3. Results

The intercepted sediment mass was obtained by the static precipitation and drying method. During the experiments, the turbidity and water level along the flow direction were measured and recorded. The discharge capacity can be reflected by the relative water level, water level difference, and permeability coefficient. The corresponding parameters’ variation graphs along the flow direction under different working conditions are obtained, discussed, and analyzed.

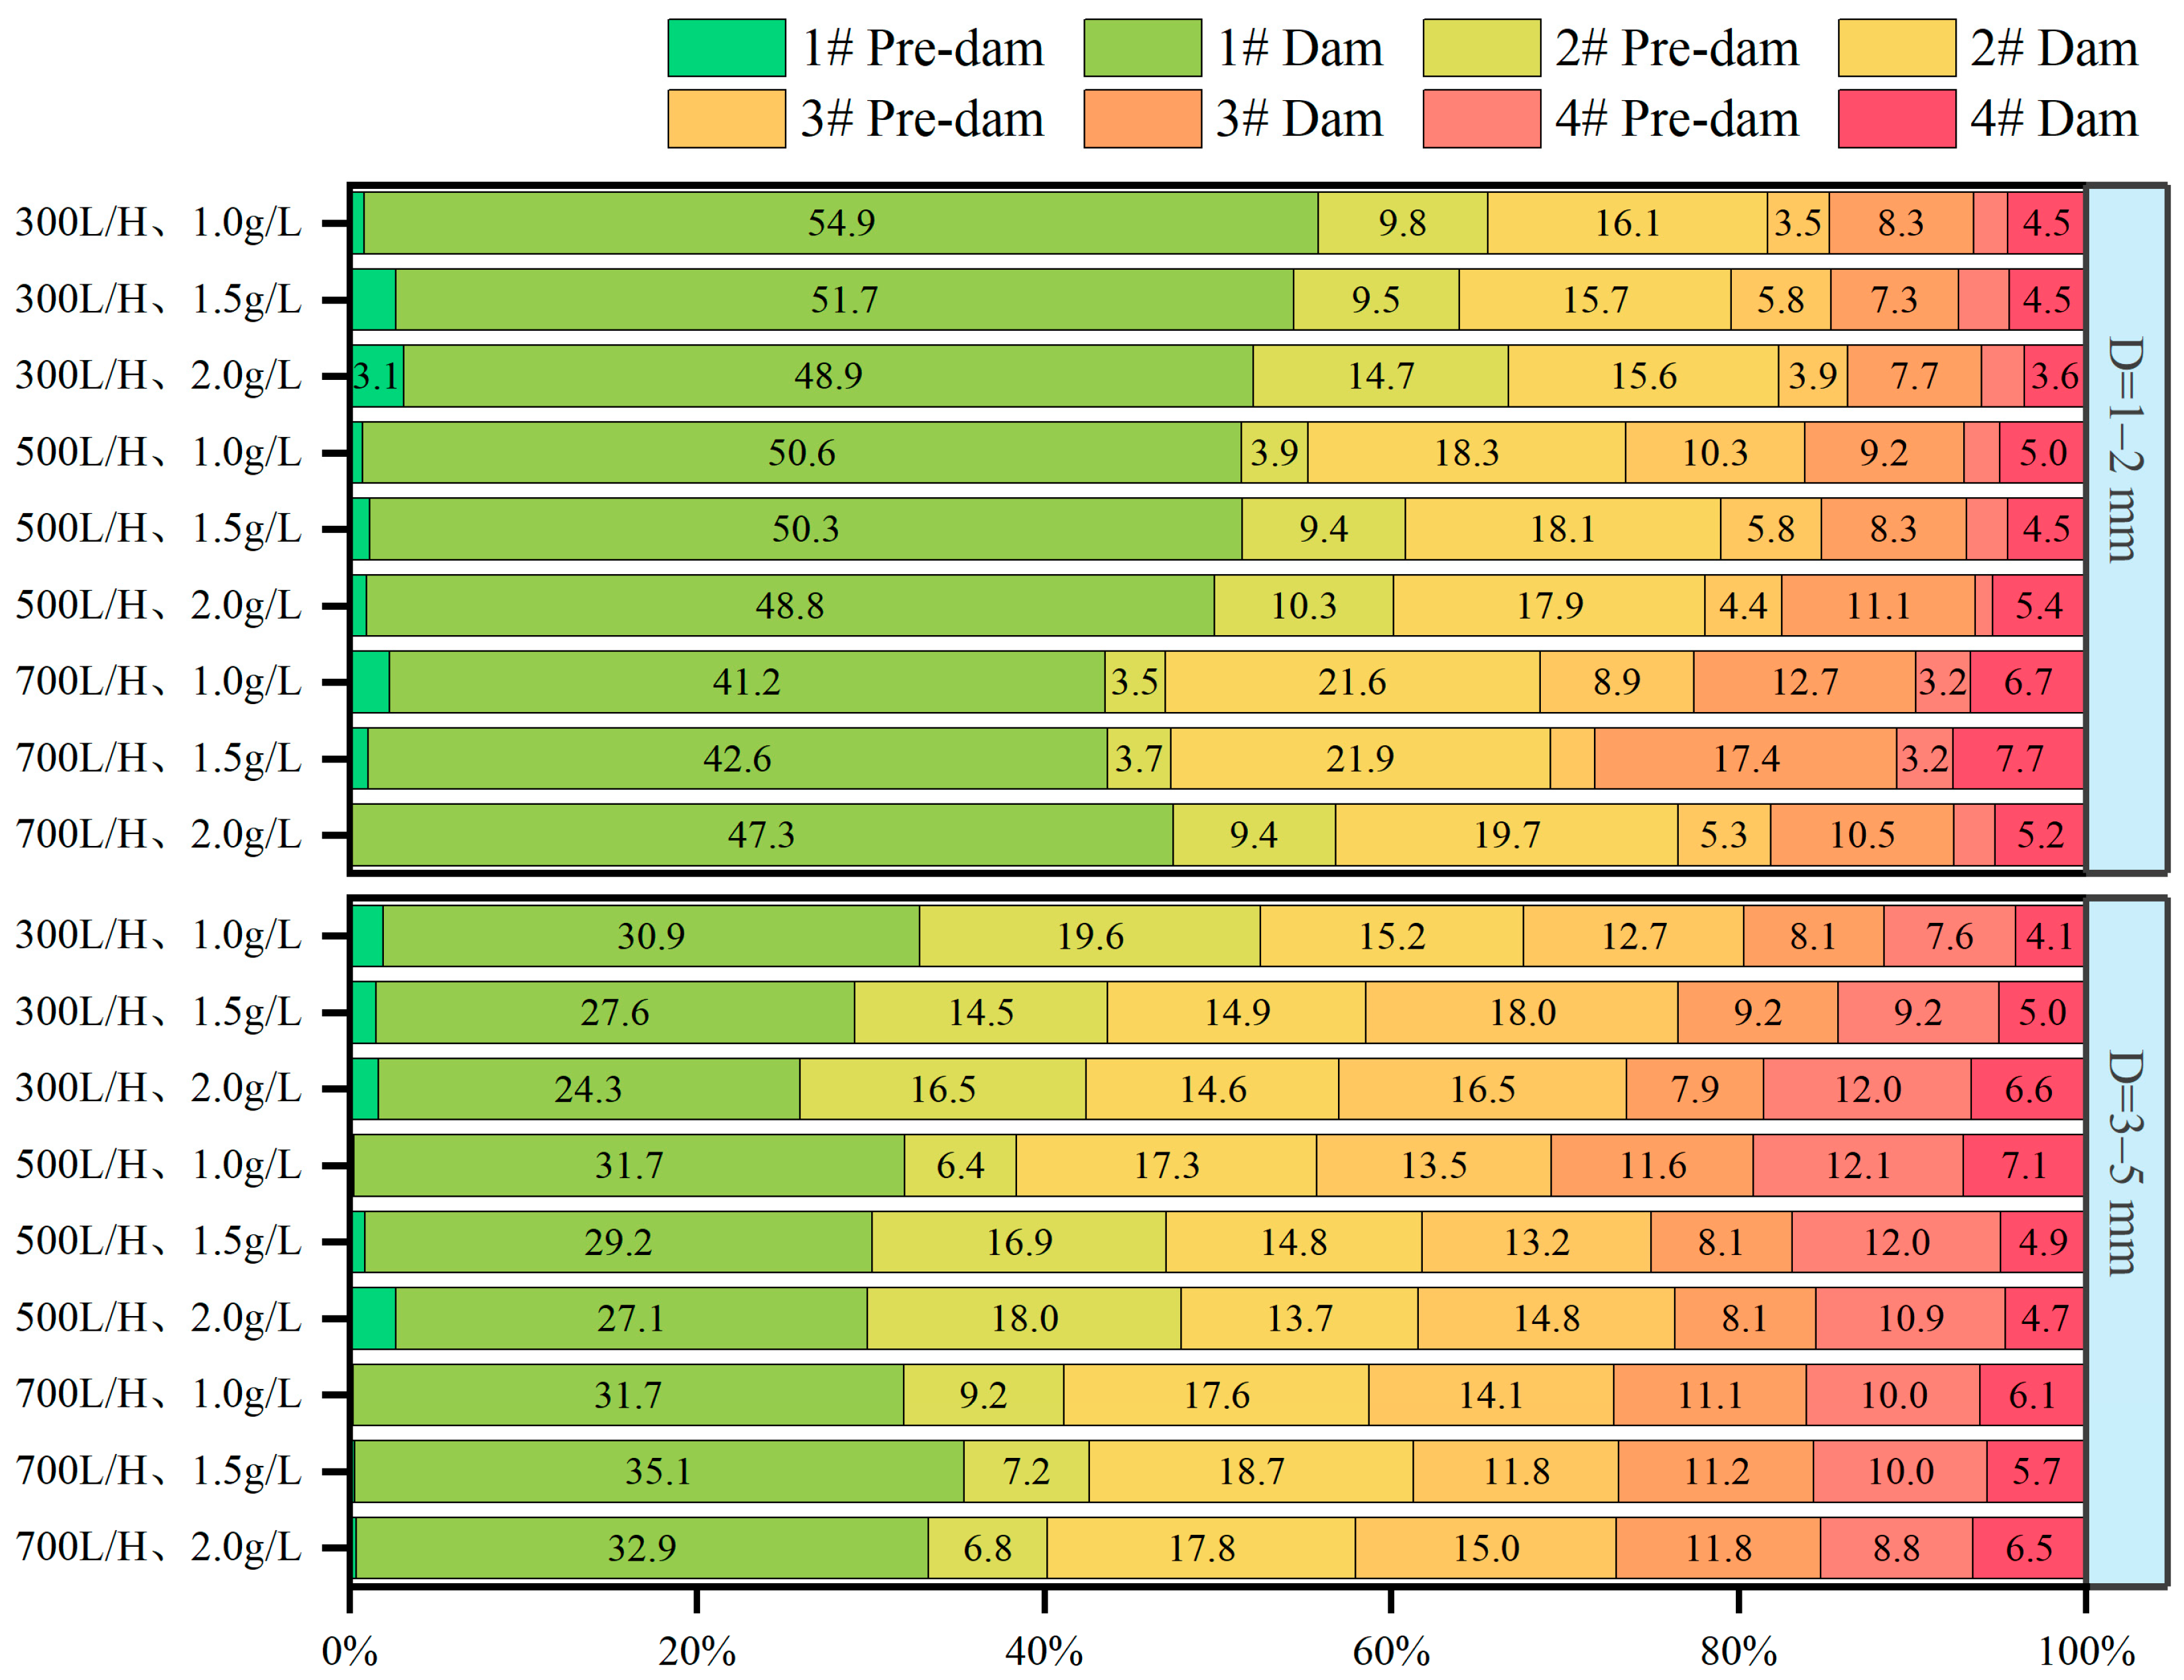
3.1. Percentage of Intercepted Sediment Mass

In order to compare the role of each dam in the sediment interception of the cascade permeable dam, the percentage of intercepted sediment mass along the flows was obtained by dividing the sediment mass inside each dam or in front of the dam by the total intercepted sediment mass by the cascade permeable dam at the end of the experiment (see Figure 3). In this experiment, the percentage of intercepted sediment mass by 1–4# dam with large and small particle sizes ranges from 24% to 35%, 15% to 19%, 8% to 12%, and 4% to 7%, and 41% to 55%, 16% to 22%, 7% to 17%, and 4% to 8%, respectively. The dates show that 1# dam plays a major role in sediment interception, and the interception efficiency of the dams decreases along the flow direction.
The permeable dam mainly realizes the sediment interception through physical filtration and dam material adsorption. For the small particle size, the pore is more likely to be blocked than the large particle size, and the sediment interception of the pore throat is more serious. Under different sediment concentrations, the overall percentage of intercepted sediment mass inside 2#, 3#, and 4# dam increases monotonically with the increases of the discharge. Under the same sediment concentrations, the percentage of intercepted sediment mass inside 1# dam and in front of 2# dam decreases monotonically with the increase of the discharge. At the discharge of 300 L/H, the flow velocity is relatively low, the sediment particles infiltrating into the dam interior will result in a transient equilibrium in the deposition of permeable dams. The percentage of intercepted sediment mass in 1#, 2#, and 4# dam decreases monotonically with increasing sediment concentration under the lower discharge. When the discharge increases to 700 L/H, the pore of the dam body is easily blocked as more sediment particles will be carried into the dam. The percentage of intercepted sediment mass inside 1# and in front of 2# dam increases monotonically with increasing sediment concentration, indicating that the sediment interception performance at this location is strongly influenced by the discharge. Under the highest discharge and large particle size, the percentage of intercepted sediment mass in 1# and 2# dam tends to increase first and then decrease with increasing sediment concentration, indicating that there is an upper limit to the sediment interception capacity of the dams for sediment-laden flow. When the sediment concentration is higher, the percentage of intercepted sediment mass inside 1# dam increases monotonically with increasing discharge, indicating that the first dam has a higher sediment interception capacity for a major flood.

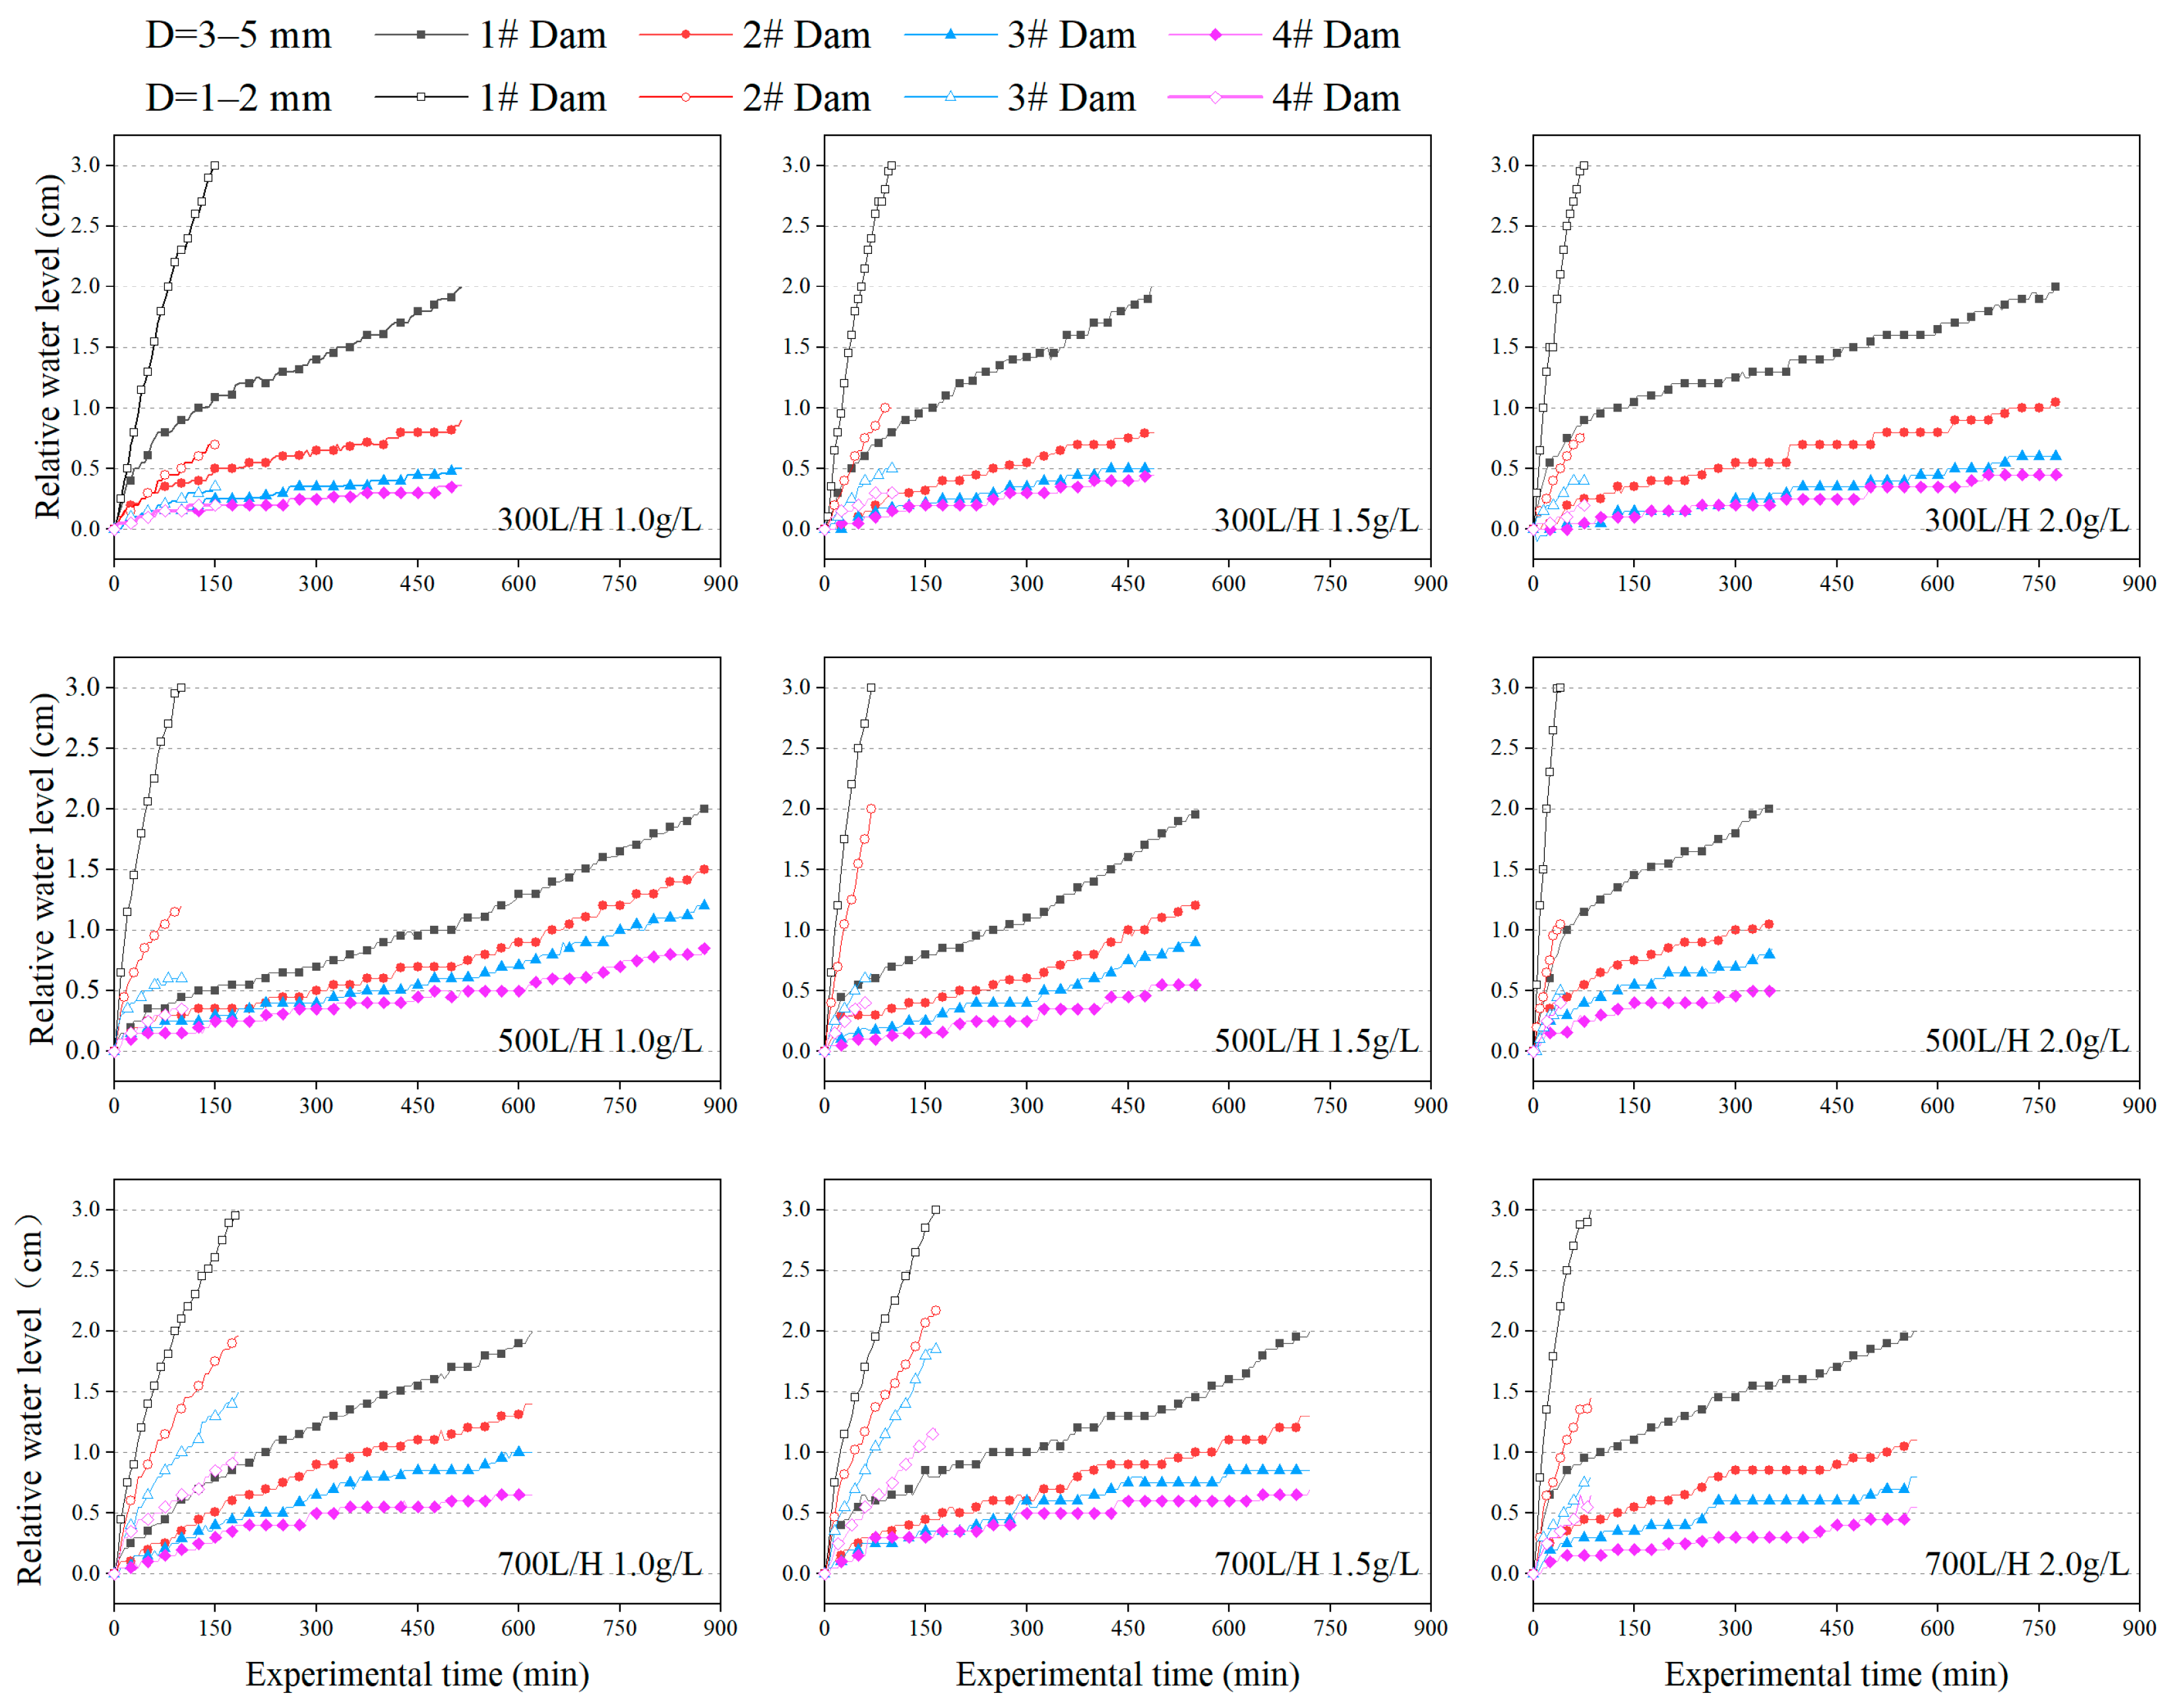
3.2. Relative Water Level

Water level management can be considered an effective method for ecological restoration of the lakes, and the use of dam materials with different particle sizes can effectively increase the water depth in front of the dam [40]. Figure 4 shows the variation of the pre-dam water level relative to the initial water level with time under various working conditions. Under the action of water flow, sediment particles block some pores of the dam and enhance the flow resistance of the dam, resulting in a different amplitude of increase in the water level in front of each dam. The duration of the experiments ranged from 355 to 875 min and 40 to 185 min for large and small particle sizes, respectively. The change range of the water level in front of 2#, 3#, and 4# dam with large and small particle sizes are 0.81–1.53, 0.53–1.20, and 0.36–0.85 cm and 0.70–2.17, 0.35–1.85, and 0.20–1.20 cm, respectively. Correspondingly, the water level rise rate in front of 1–4# dam is 0.14–0.34, 0.08–0.18, 0.05–0.14, and 0.03–0.08 cm/H (D = 3–5 mm) and 0.97–4.50, 0.28–1.71, 2.78–8.6, and 2.09–5.07 cm/H (D = 1–2 mm), respectively, with the amplitude and rise rate decreasing along the flow direction.
As the sediment-laden flow passes through the cascade permeable dam, the sediment mass intercepted in the dam and deposited between the adjacent dams reduces the amount of sediment recharge at the rear, reducing the rise in water level in front of the subsequent dams. For the cascade permeable dam with the large particle size, the rising slope of the water level in front of 2# and 3# dam is approximately equal under the same discharge at the end of the experiments. The rise amplitude of the water level decreases with increasing sediment concentration at higher discharge; notably, decreasing first and decreasing later at 300 L/H. At the end of the experiments, as the discharge increases, the relative water level in front of 2# dam increases monotonically, the water level in front of 3# dam increases first and then decreases, and the water level in front of 4# dam rises to a certain height and then fluctuates slightly within a certain range. For the small particle size, the relative water level in front of 2–4# dam rises monotonically with the increasing discharge. The change trend was first increasing and then decreasing with increasing sediment concentration. Under 700 L/H, the relative water level in front of the dams rises more obviously, and the water level difference between the front and behind of 1–4# dam reaches its maximum, which will be explained in the next chapter.

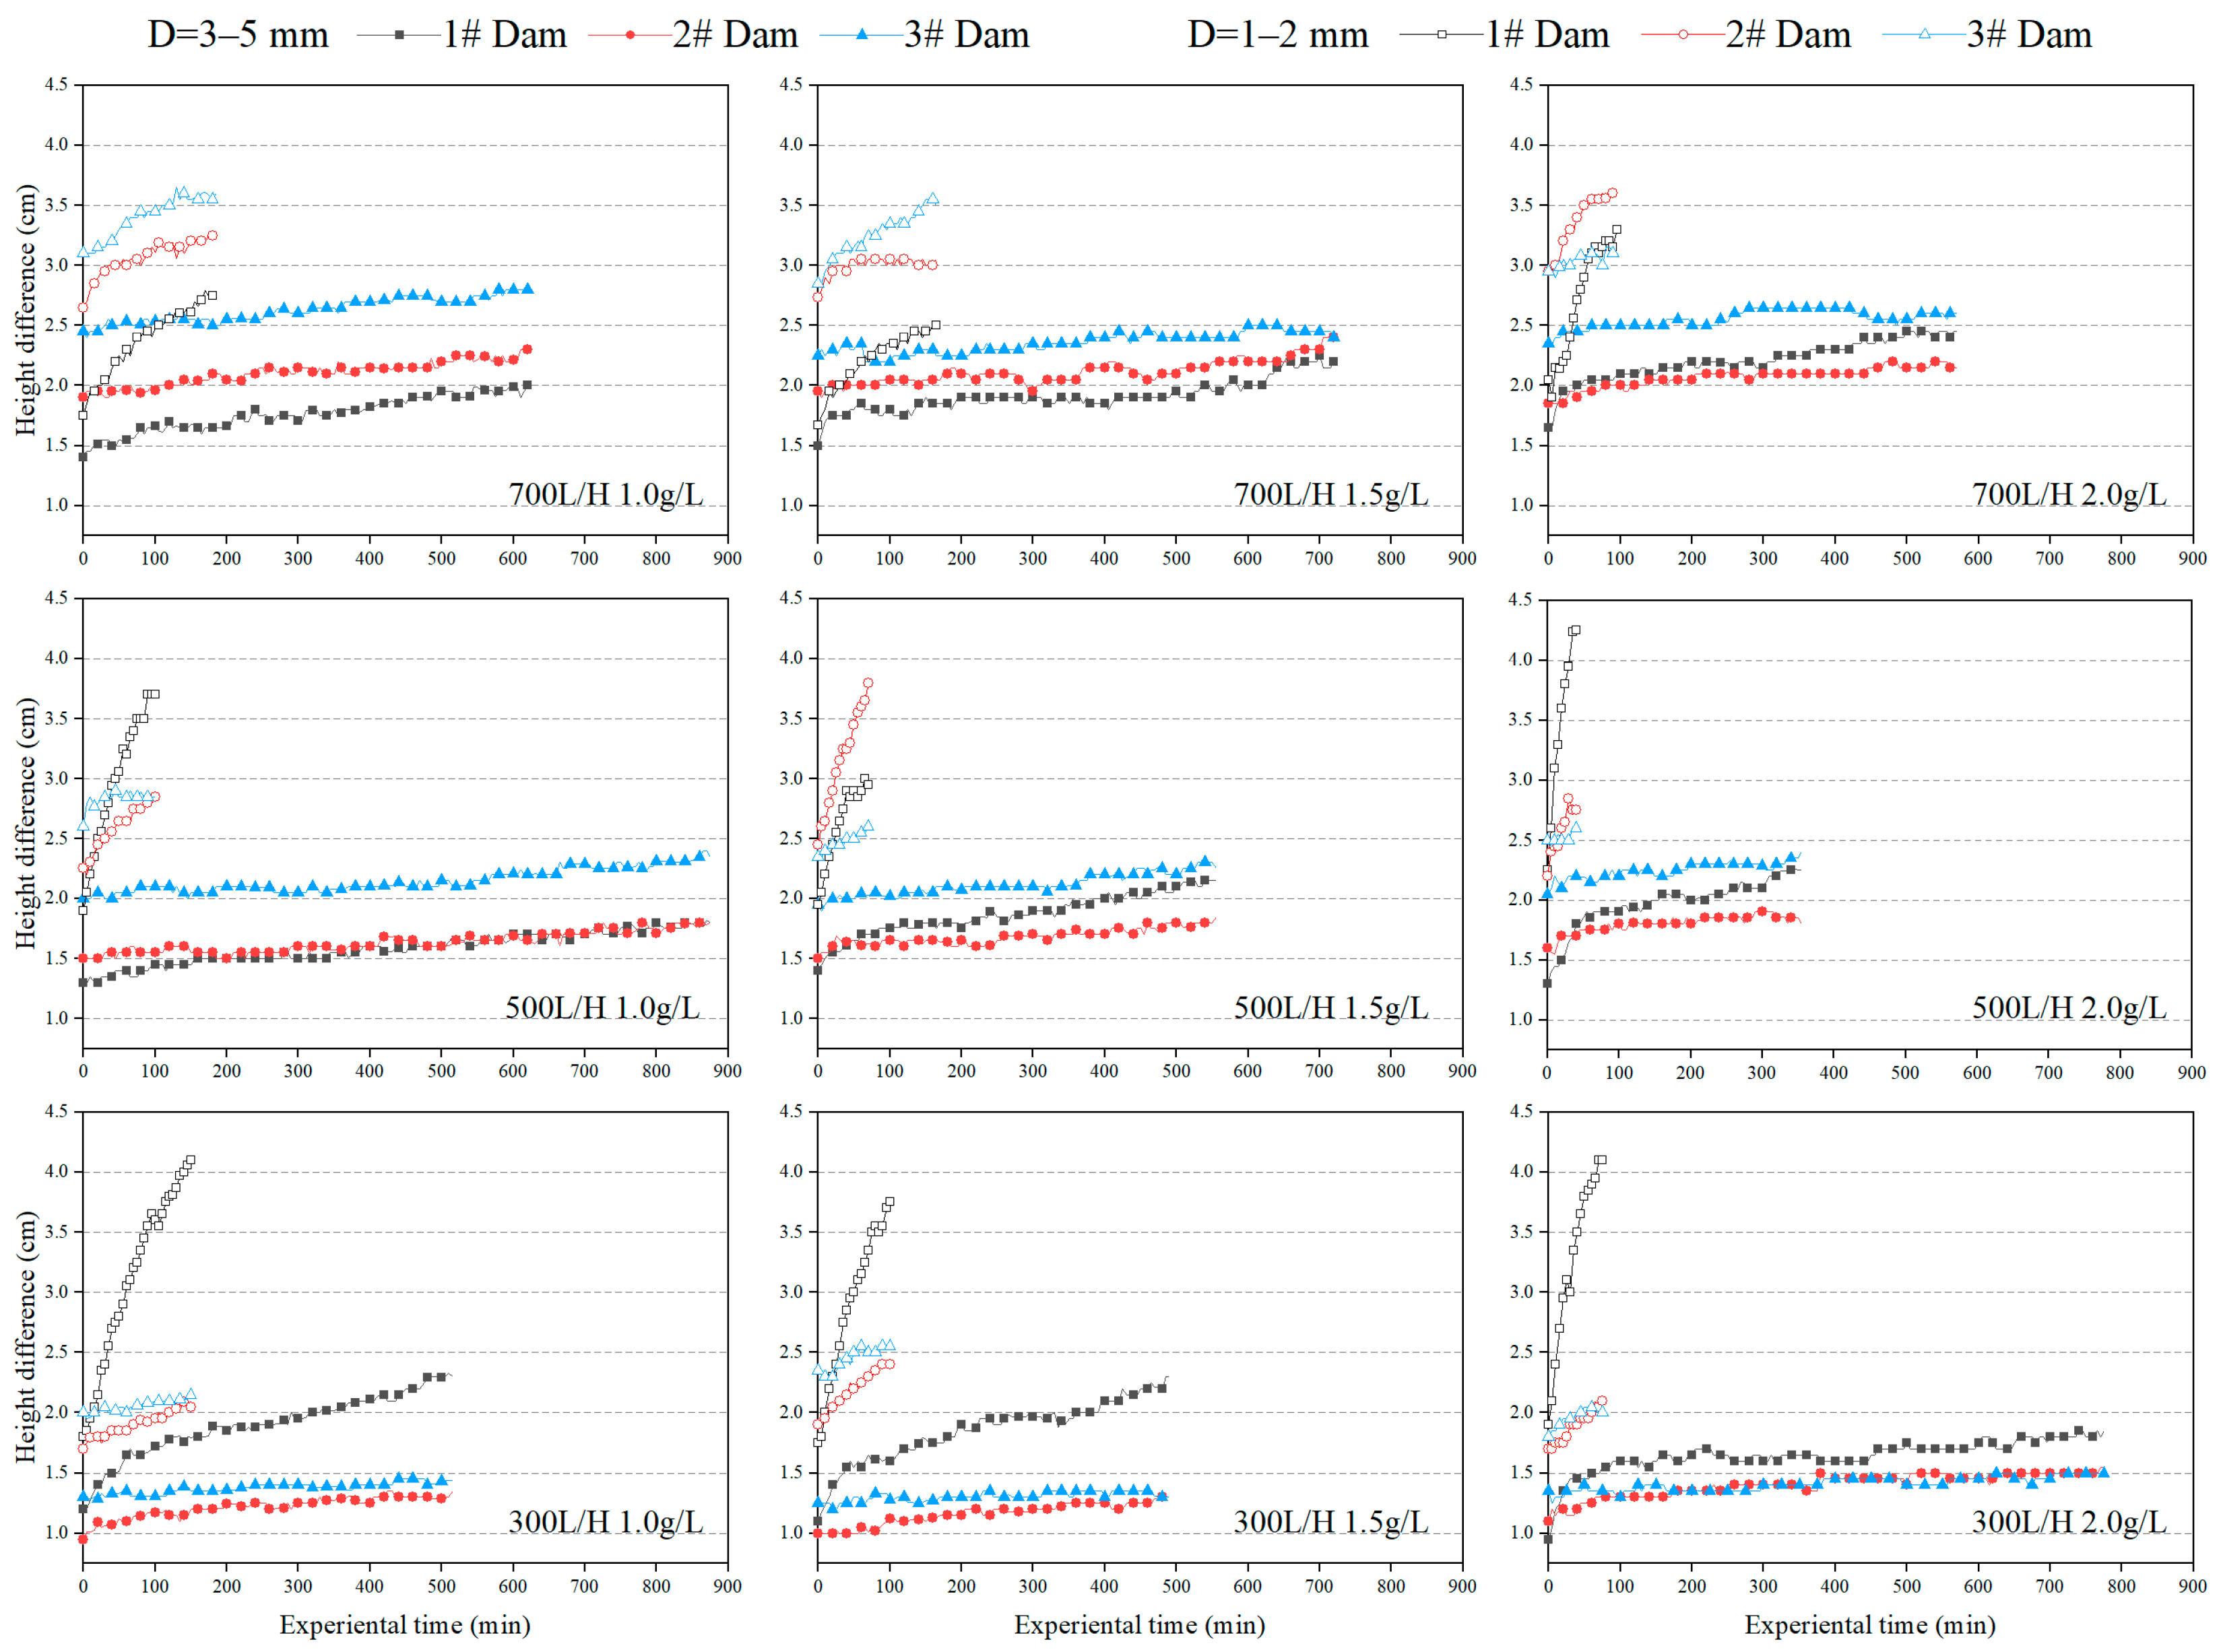
3.3. Water Level Difference

The discharge capacity of the cascade permeable dam can be reflected by the water level difference between the front and behind of the dam body. Where there is a larger water level difference, there is a lower discharge capacity. In order to compare the discharge capacity of the cascade permeable dam under different working conditions, curves of the relative water level difference of 1–3# dam were calculated, as shown in Figure 5. As the flow condition near the outlet is free flow, the water level behind the dam remains stable and the water level difference changes slightly, so 4# dam is not discussed. The overall trend of the water level difference of the cascade permeable dam with large and small particle sizes is increasing. At the end of the experiments, the water level differences of 1–3# dam are 1.80–2.45, 1.30–2.40, and 1.30–2.80 cm (D = 3–5 mm) and 2.50–4.25, 2.05–4.10, and 2.00–3.60 cm (D = 1–2 mm), respectively. Correspondingly, the change rates are 0.03–0.16, 0.02–0.05, and 0.01–0.06 cm/H and 0.31–3.00, 0.12–0.83, and 0.06–0.24 cm/H.
It is clear that the water level difference of dams with a small particle size rises more obviously and at a faster rate, mainly due to the smaller pore volume of the dams being easily blocked by sediment particles. For permeable dams with a small particle size, when the incoming discharge is small and the flow velocity is low, the sediment particles are more likely to penetrate into the interior of the dam, which weakens the permeability of the dam. The water level difference of 1# dam is the largest and the rate of rise is relatively fast, indicating that the permeability of 1# dam is poor under the smaller discharge. The water level difference of 1# dam decreases monotonically with increasing discharge under the same sediment concentration. At this time, a large number of sediment particles enter the subsequent dams with high velocity, causing the water level difference of 3# dam to rise monotonically with increasing discharge, indicating that the permeability of 3# dam is gradually increasing.
For the permeable dams with a large particle size, the water level difference of 2# and 3# dam increases with increasing discharge for the same sediment concentration, indicating that the permeability of 2# and 3# dam gradually decreases with increasing discharge, and the permeability of 3# dam is better than that of 2# dam, in general. When the discharge increases to 700 L/H, the change in the water level difference of 3# dam tends to decrease first and then increase with increasing sediment concentration, and this phenomenon is mainly caused by the increase in the hydrodynamic force.

3.4. Permeable Coefficient

The permeability coefficient is a comprehensive index of the permeability of a dam and is generally related to the particle size, shape, and porosity of the dam material [41,42]. As shown in Figure 6, there is a significant decrease in the permeability coefficient of the dams at the beginning of the experiments and it varies with time [43,44]. The permeability coefficient of 1# dam is always at a low level, indicating that the sediment deposition inside 1# dam is serious. At the end of the experiments, the permeability coefficient of 1–3# dam is 0.0408–0.0715, 0.0505–0.0830, and 0.0540–0.1031 m/s (D = 3–5 mm) and 0.0166–0.0361, 0.0221–0.0419, and 0.0309–0.0462 m/s (D = 1–2 mm), respectively. When sediment-laden flow passes through a cascade permeable dam, it will remain in the dam body for a certain period of time, and the sediment particles carried by flow will result in pore blockage of different degrees in the dams [45]. At the end of the experiments, the permeability coefficient of 1–3# dam with large and small particle size decreases by 37–51%, 21–39%, and 10–28%, and 40–56%, 23–41%, and 10–32%, respectively, indicating a gradual reduction in dam blockage along the flow direction.
For permeable dams with large particle sizes, the variation amplitude in the permeability coefficient of 1–3# dam decreases monotonically with increasing discharge at different sediment concentrations. Under the different discharges, the variation amplitude in the permeability coefficient of 1# dam increases monotonically with increasing sediment concentration, while 2# and 3# dam decrease monotonically. After a period of operation, more and more sediment accumulates inside the dams, and the sediment is compacted under the hydraulic action, causing a porosity decrease in the permeable dam body.
For the small particle size and at lower discharge, the variation amplitude of the permeability coefficient of 1# dam increases monotonically with increasing sediment concentration. At 1.0 g/L, the variation amplitude of the permeability coefficient of 1–3# dam increases monotonically with increasing discharge overall. Under the different discharge, the decreasing rate of the permeability coefficient of 1# and 2# dam with small particle size increases monotonically with increasing sediment concentration, which is consistent with the study of Alem et al. about the physical clogging of porous media with the variation pattern of permeability [46].

3.5. Turbidity

Turbidity is an index reflecting the water quality and can be used to assess the sediment deposition areas to a certain extent [47]. When the sediment-laden flows pass through a cascade permeable dam, sediment particles are deposited at different locations, resulting in differences in turbidity in the water behind the dam. By measuring the turbidity, a preliminary analysis is carried out to evaluate the effectiveness of the cascade permeable dam in water purification. As shown in Figure 7 and Figure 8, under different discharge conditions, the turbidity of different locations increases monotonically with increasing sediment concentration overall. By measuring the collected dates and building the corresponding scatter plot, the black linear model was fitted to a total turbidity removal rate in Figure 7 and Figure 8 [48,49].
In the experimental groups of the small particle size, the turbidity of the water before 1# dam is always the highest. Part of the sediment particles in the sediment-laden flows flocculates and infiltrates into the dam, resulting in a gradual decrease in turbidity values behind 1# dam. The turbidity removal rate of 1–4# dam is 2.7–21.8%, −4.1 to 16.3%, −5.7 to 11.9%, and −9.4 to 5.0%, respectively, indicating that each dam in the cascade permeable dam can purify the water and the turbidity removal rate is decreasing step by step. The turbidity removal rate of the whole cascade permeable dam ranges from 15.9% to 39.8%. In addition, the removal rate gradually decreases with time. At the sediment concentration of 2.0 g/L, the turbidity decreases significantly behind 1# and 2# dam under different discharge conditions, and decreases relatively little behind 3# and 4# dam. In this condition, the total turbidity removal rate of the cascade permeable dam tends to decrease and then increase with increasing discharge. The pore volume of the dam is large at the beginning of the experiments, and 1# dam shows more obvious fluctuations of turbidity value at 30 min, when the total turbidity removal rate varied between 18% and 37%. The 2#, 3#, and 4# dam shows a smaller change and more intersection in the turbidity value, which is mainly due to the impact-blocking impact cycle that occurs when the sediment inside the dams moves hydraulically, thus causing the turbidity to vary repeatedly.
The sediment adhering to the surface of the dam material causes local flow disturbances, resulting in irregular changes in the turbidity value. In the large particle size, the turbidity fluctuates more frequently behind the dam. At the beginning of the experiments, the turbidity value increases slightly under some working conditions. The water level in front of the dams decreases along the flow direction, and the deposited sediment carries out the secondary deposition distribution. At the end of the experiments, the turbidity at the outlet of the flume was significantly reduced, and the turbidity removal rate of 1–4# dam is −0.41 to 6.66%, −7.94 to 11.29%, −5.43 to 8.09%, and −5.56 to 13.44%, respectively. However, the turbidity values and the total turbidity removal rate of the dam always varied slightly within a certain range at different discharges, indicating a stable filtration effect of the permeable dam.

4. Discussion

Reducing the amount of sediment entering the lakes can reduce water turbidity [50] and promote the sustainable development of an ecological water environment. In this paper, an assembled cascade permeable dam is proposed for the river channel at the entrance of the lake. The process of sediment interception and discharge capacity change is investigated for different sediment concentrations and flow discharge.

4.1. Effect of Dam Material Particle Size on the Experimental Parameters

The particle size of the dam material affects the porosity and compaction density of the dams, resulting in different sediment depositions inside the pores of the dam body, which leads to differences in discharge capacity and sediment interception performance. From the analysis of the experimental results, it can be seen that the amplitude and rate of water level rise in front of the dams with a small particle size is greater than that of the dams with a large particle size, and they vary regularly with the discharge and sediment concentration. After the beginning of the experiments, the porosity of the dam gradually decreased, and the permeability coefficient of both large and small particle size dams decreased to different degrees.
For the small particle size, the difference between the turbidity at the inlet and outlet of the flume was larger and the total turbidity removal rate of the dam was higher than that of the large particle size. When the permeable dams are first put into use, the pore volume of the dam body is large and the sediment migration affects the change in the pore structure, resulting in differences in the intercepted sediment mass in each dam body of large and small particle sizes. As shown in Figure 9, the total mass of intercepted sediment in the permeable dam with a large particle size is significantly larger than that with a small particle size. Because the dams with a large particle size can work for a longer time and deal with a larger volume of flood, the amount of sediment deposition is affected by the charge [51].
In order to describe the sediment interception efficiency of the dams more directly, at the end of the experiments, the intercepted sediment mass in 1–4# dam was divided by the total water volume and the effective mass of the dam material in each dam to obtain the sediment interception rate (η) for comparison. As shown in Figure 10, the η of the small particle size is significantly greater than that of the large particle size, and decreases with increasing discharge. The η of 1# dam is significantly greater than that of the subsequent dams, and is greatly influenced by the sediment concentration. The difference in η between 2#, 3#, and 4# dam is smaller, especially at 700 L/H. Since the variation in the parameters for the small particle size is more regular and more in line with the expected results, only the relevant parameter variation of the permeable dams with the small particle size permeable dam will be covered in the following discussion.

4.2. Effect of Dam Bodies on the Experimental Parameters

Sediment transport in rivers is highly non-linear in time and space [52,53]. Under different experimental conditions, there will be different hydraulic parameters that vary along the cascade permeable dam bodies. For the small particle size, the water level in front of 1# dam is higher, which is about 56–89% of 1# dam height at the end of the experiment. The water level difference rises by 0.8–3.7 cm, and the permeability coefficient decreases by about 40–56%. The η of the dam reaches a maximum of 190 μg/(g/L) under Q = 300 L/H and C = 2.0 g/L. Under the action of the sediment-laden flow, the pore volume of 1# dam gradually decreases, reducing the sediment supply to the subsequent dams and causing the water level in front of 2–4# dam to rise by 38–74%, 26–63%, and 13–48% of the dam height. The rise in the water level difference of 2# and 3# dam is 0.3–2.4 cm and 0.1–2.5 cm, respectively. The decrease in coefficient of 2# and 3# dam is 23–41% and 10–32%, respectively. The turbidity removal rate of 1# dam ranged from 2.7% to 21.8%, and decreased instead of increasing due to the resuspension of sediment in the Deposition area. The removal rate of turbidity of 2–4# dam decreases step by step. At the beginning of the experiments, the sediment interception efficiency was good. As the experiment progressed, the pores of the dams were gradually blocked, and the overall η of the dam was η1 > η2 > η3 > η4. In summary, the more permeable dam bodies, the greater the total mass of intercepted sediment by the dams. But too many dams will reduce water fluidity, causing secondary damage to the lake water environment, as well as the unnecessary waste of construction and material costs.

4.3. Effectiveness of Sediment Retention in Different Areas

The cascade permeable dam designed in this paper contains four dam bodies, which are divided into three main zones: Stagnant zone, Deposition zone, and Dam zone. For the sediment-laden flow passing through the cascade permeable dam with a small particle size, different amounts of sediment accumulate in front of the dam, raising the water level in front of the dam. Part of the sediment particles will aggravate the degree of flocculation, then the flocculation will increase the amount of sediment blocked inside the dam, and thus decrease the permeability of the dam [54]. The sediment deposited in the Stagnant zone with a strong hydrodynamic force is constantly resuspended, so the amount of sediment deposited in this area is small and essentially negligible (≤3%) at the end of the experiments. The hydrodynamic conditions in the Deposition zone are relatively weak and the water body replacement is slow, so some of the sediment particles seeping through the dam are deposited and some seep into the next dam with the flow. The experimental data show that the percentage of intercepted sediment mass in the Dam zone and Deposition zone is 75–89% and 9–21%, respectively, indicating that the upstream inflow sediment was mainly deposited in the Dam zone. The amount of sediment deposited gradually decreased with the increase in the serial number of dam bodies [55].

5. Conclusions

Large amounts of sediment deposition are one of the main causes of the lake water environment destruction, and permeable dams have been shown to be an effective way of controlling sediment and purifying water. This paper proposes a cascade permeable dam with two sets of dam materials of different particle sizes, and the variation in hydraulic parameters, turbidity, and sediment interception efficiency under different sediment concentrations and discharges are obtained by physical experiments, and the following conclusions are drawn:
(1)
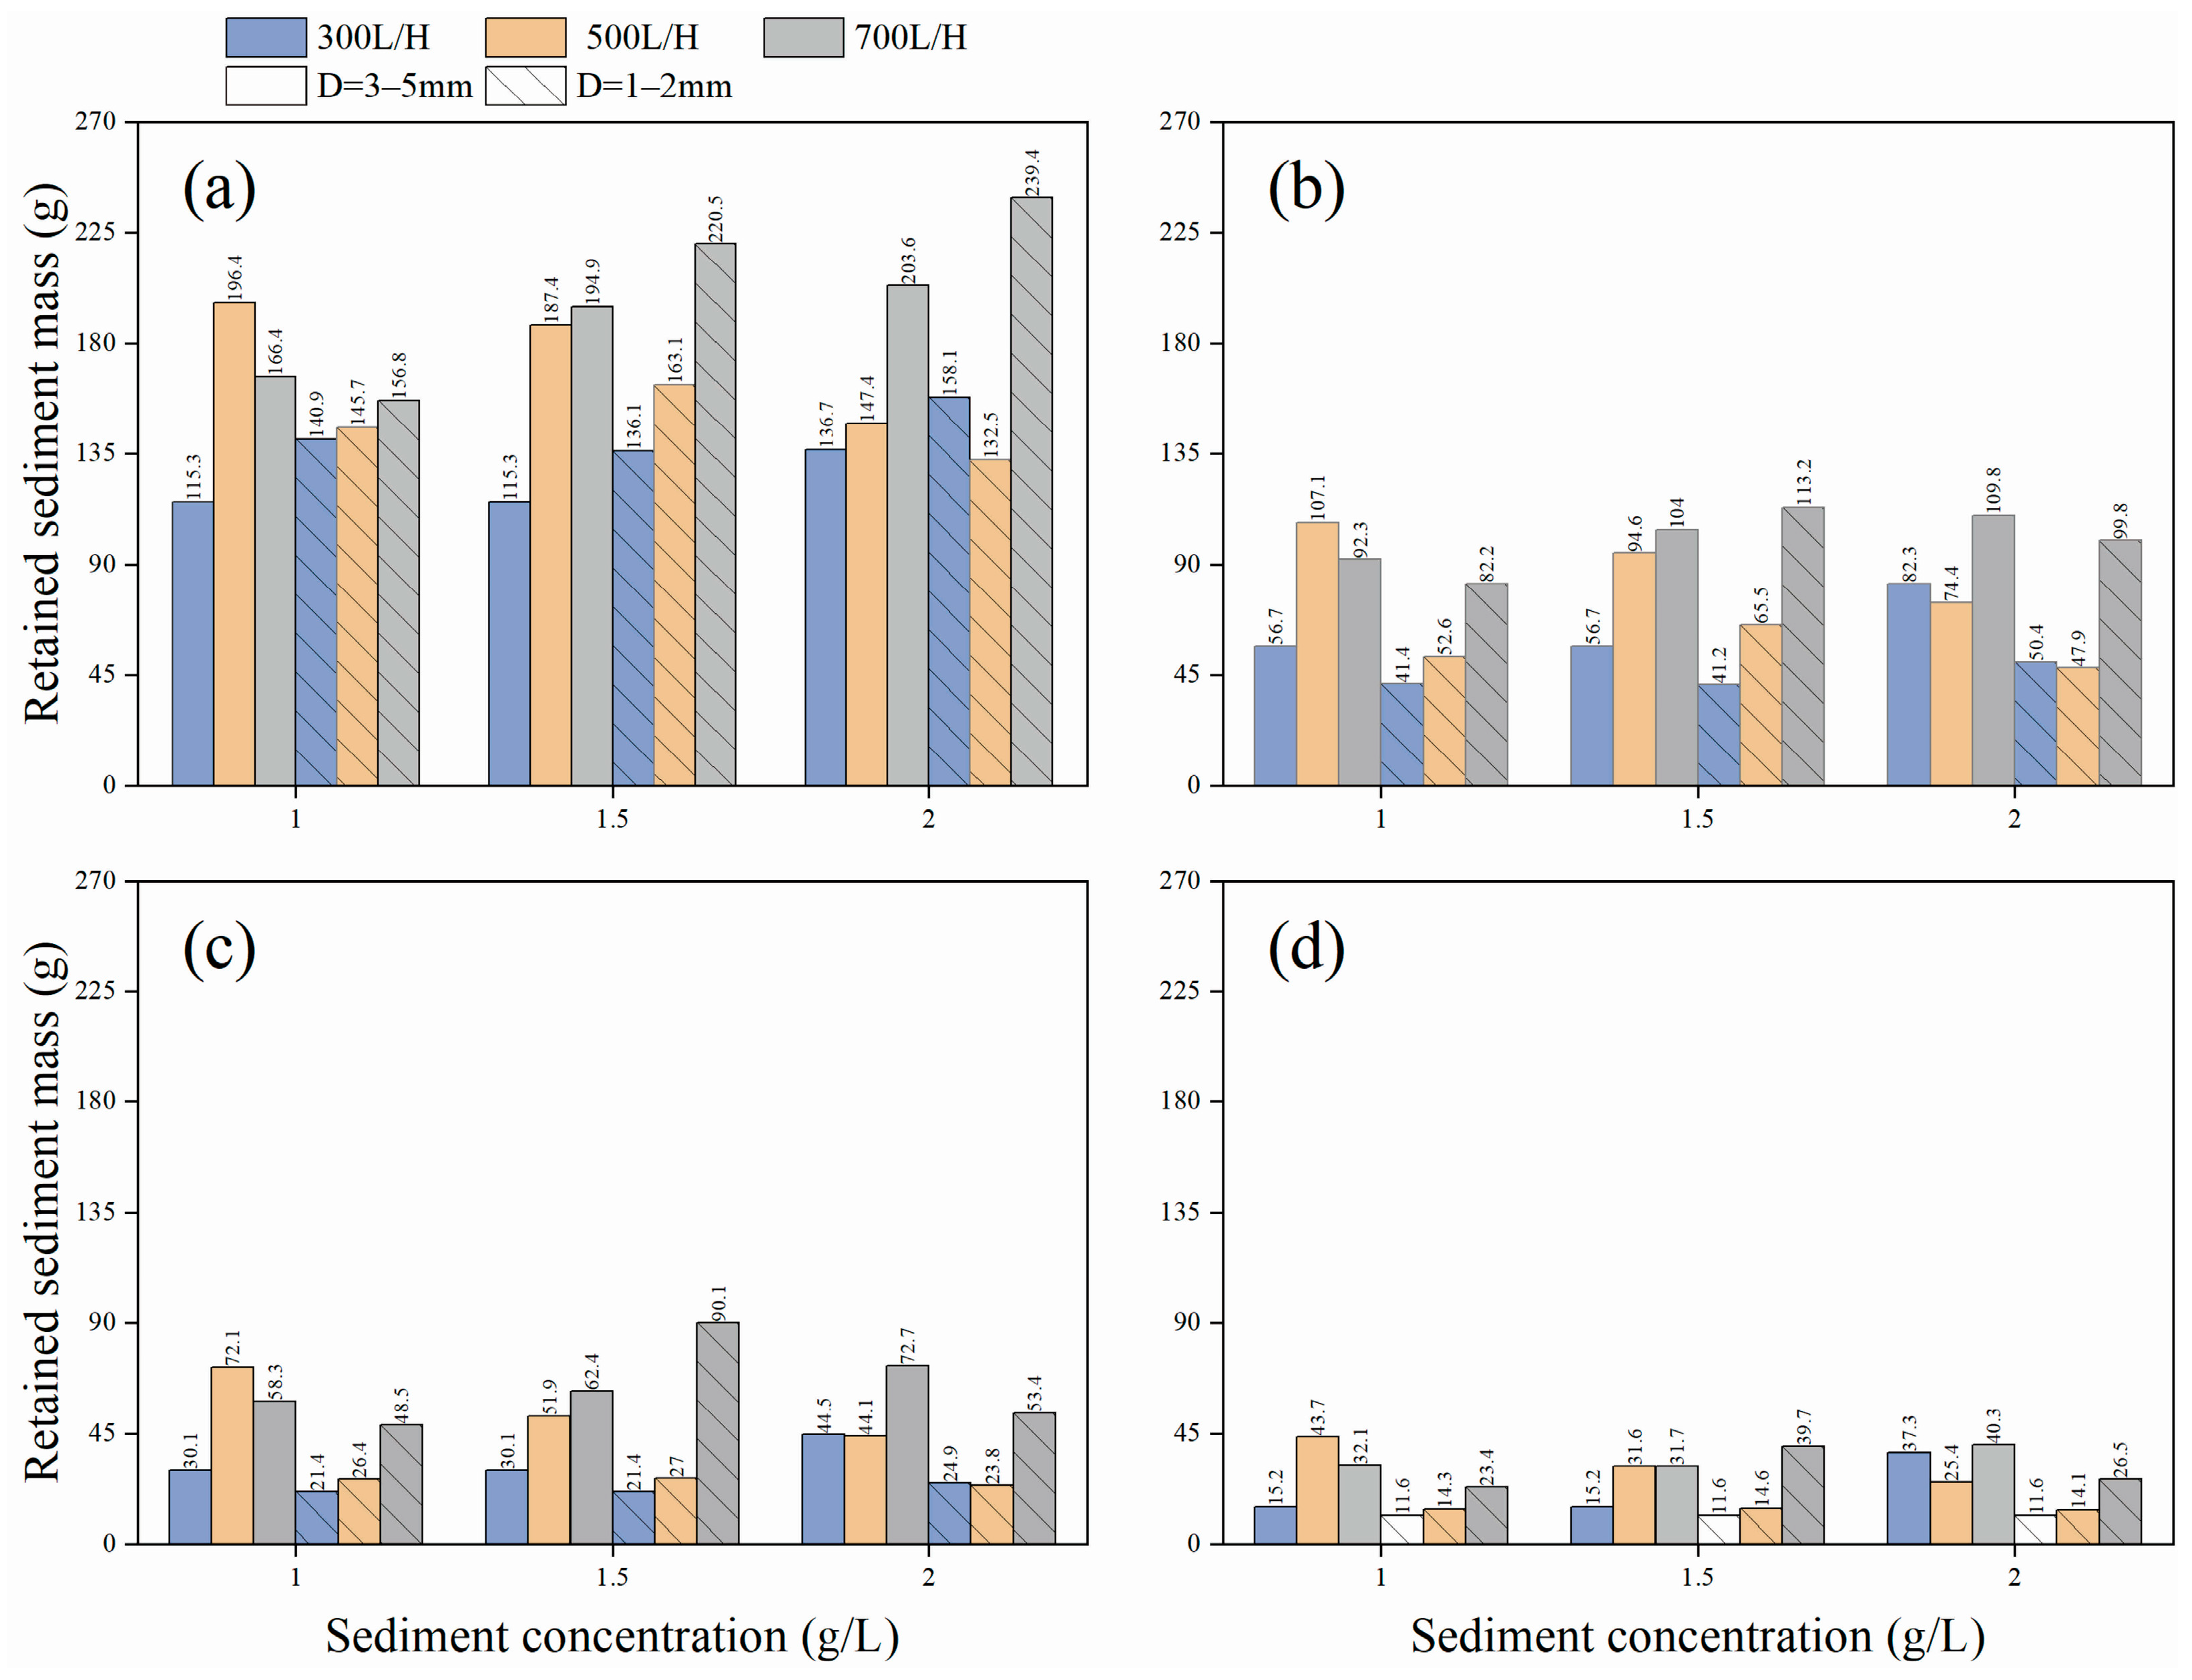
Cascade permeable dams can effectively reduce the amount of sediment entering the lake. When D = 1–2 mm, the percentage of intercepted sediment mass in the Dam zone ranged from 75% to 89%, which was significantly greater than that in the Stagnant zone (≤3%) and Deposition zone (9–21%). When D = 3–5 mm, the percentage of intercepted sediment mass in the Dam zone ranged from 53% to 70%, which was also greater than that in the Stagnant zone (≤3%) and Deposition zone (29–45%), indicating that the Dam zone has a better sediment interception performance.
(2)
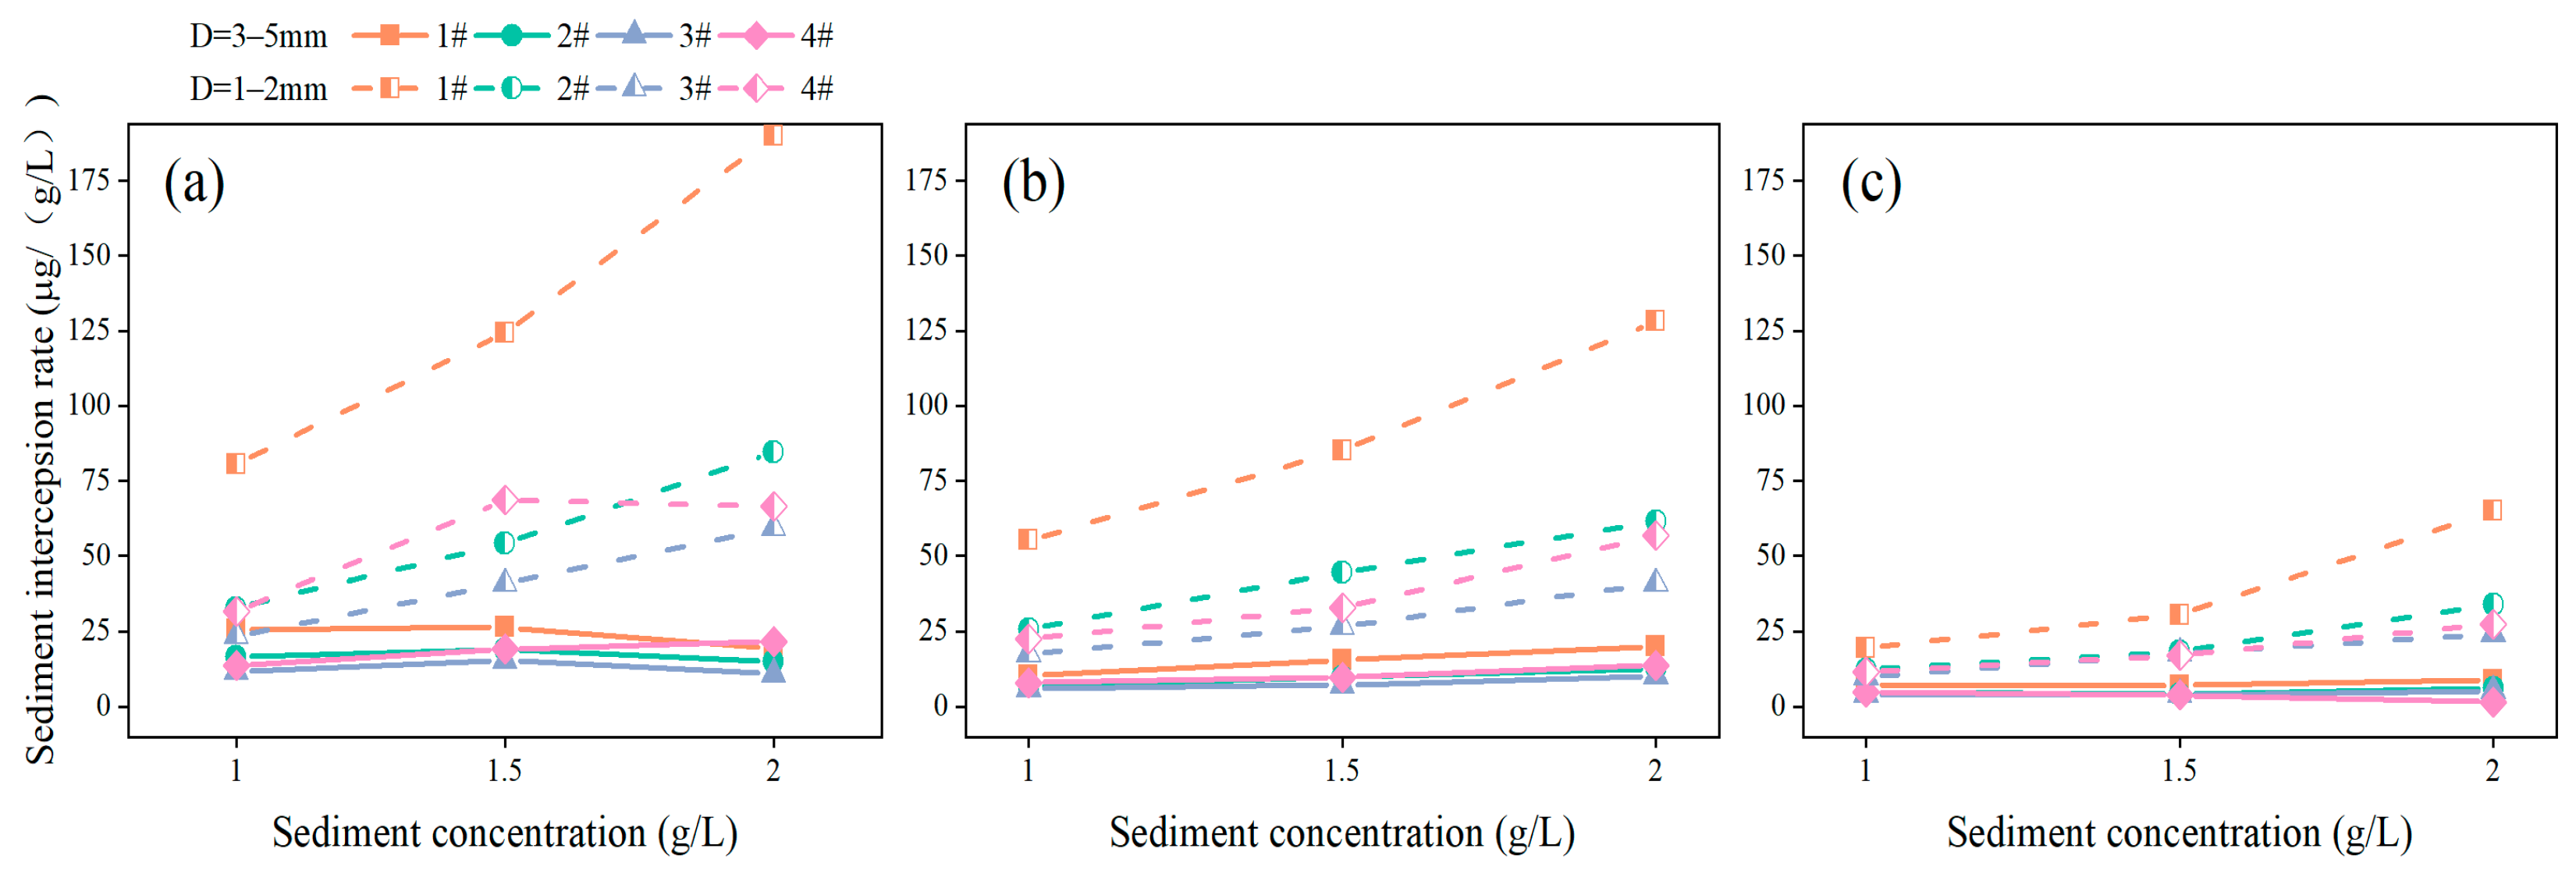
The cascade permeable dam with a small particle size has larger water level differences and weaker discharge capacity. The sediment interception rate (η) of the cascade permeable dam with a small particle size is much higher than that with a large particle size, and is positively correlated with the sediment concentration. As the upstream dam reduces the sediment supply to the subsequent dams, the η of the dams in the same group of experiments is η1 > η2 > η3 > η4, indicating that 1# dam has the best sediment interception efficiency.
(3)
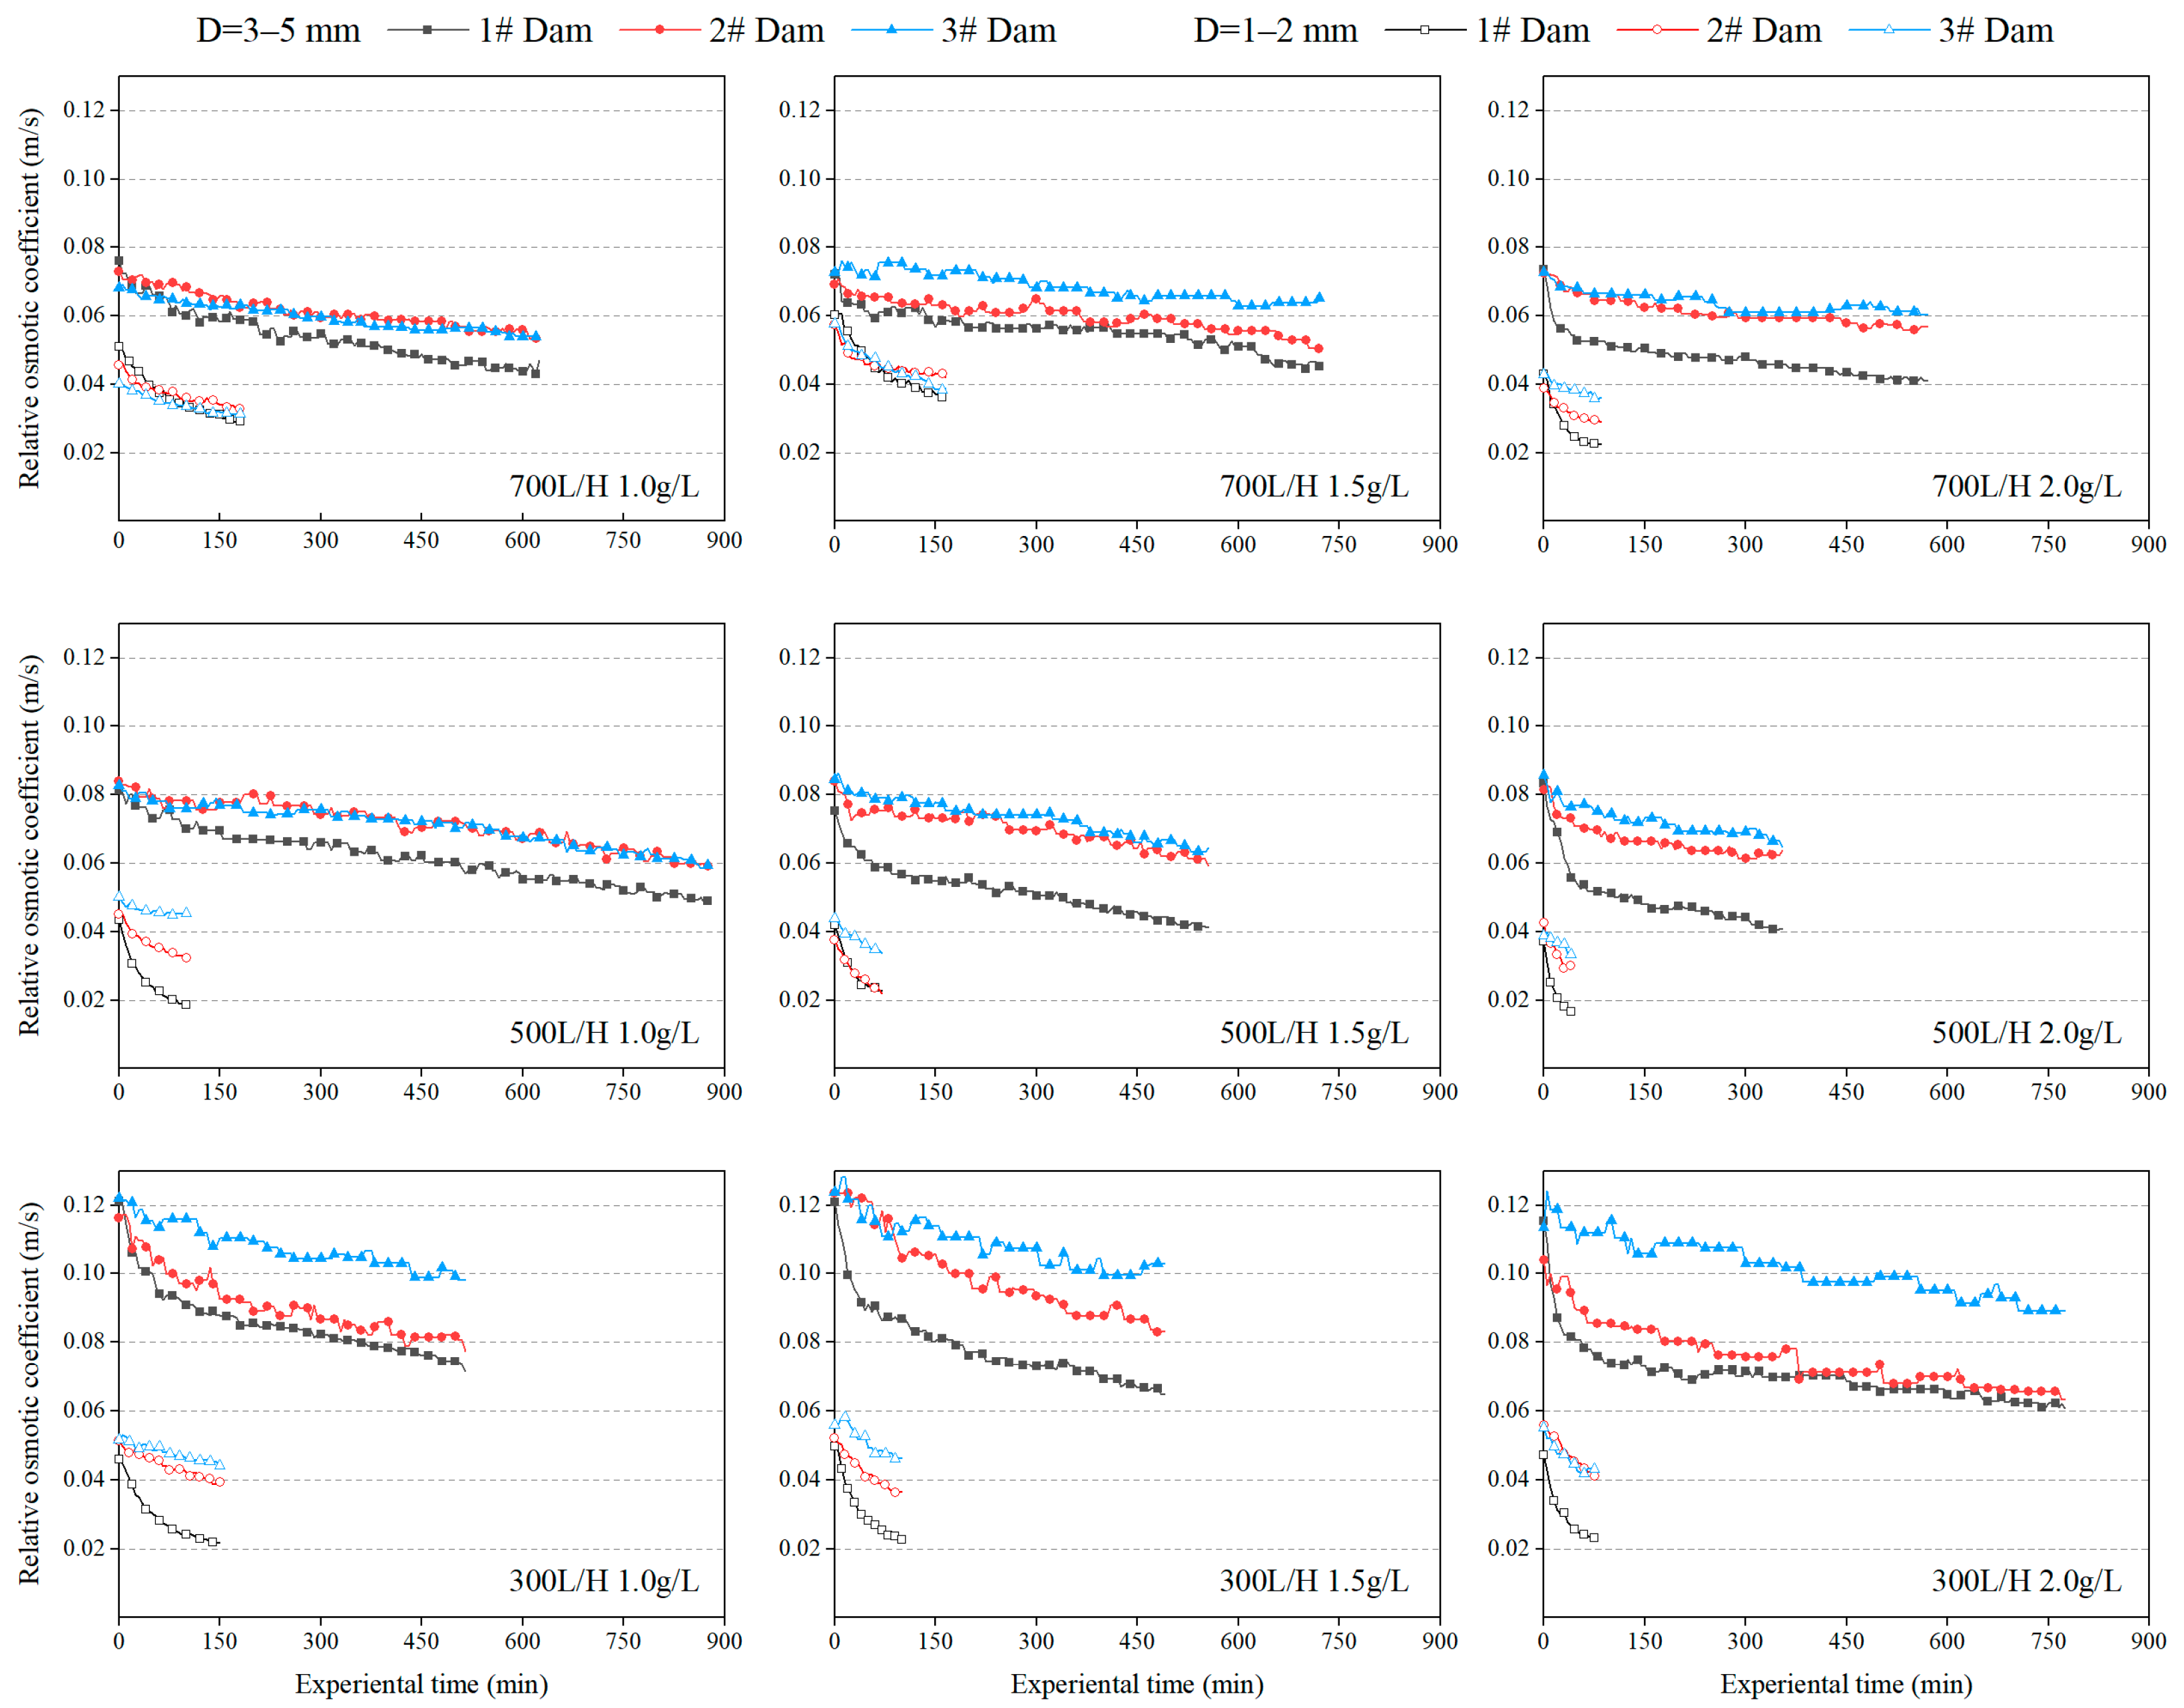
As the pores of the dam bodies are continuously blocked by sediment particles, the permeability coefficient (k) of the dam body gradually decreases with time. The smaller the particle size of the dam material, the smaller the permeability coefficient of the dam body. The permeability coefficient of the dam body with large and small particle sizes shows a variation of Δk1 > Δk2 > Δk3 overall, indicating that the discharge capacity of the cascade permeable dam gradually decreases.
(4)
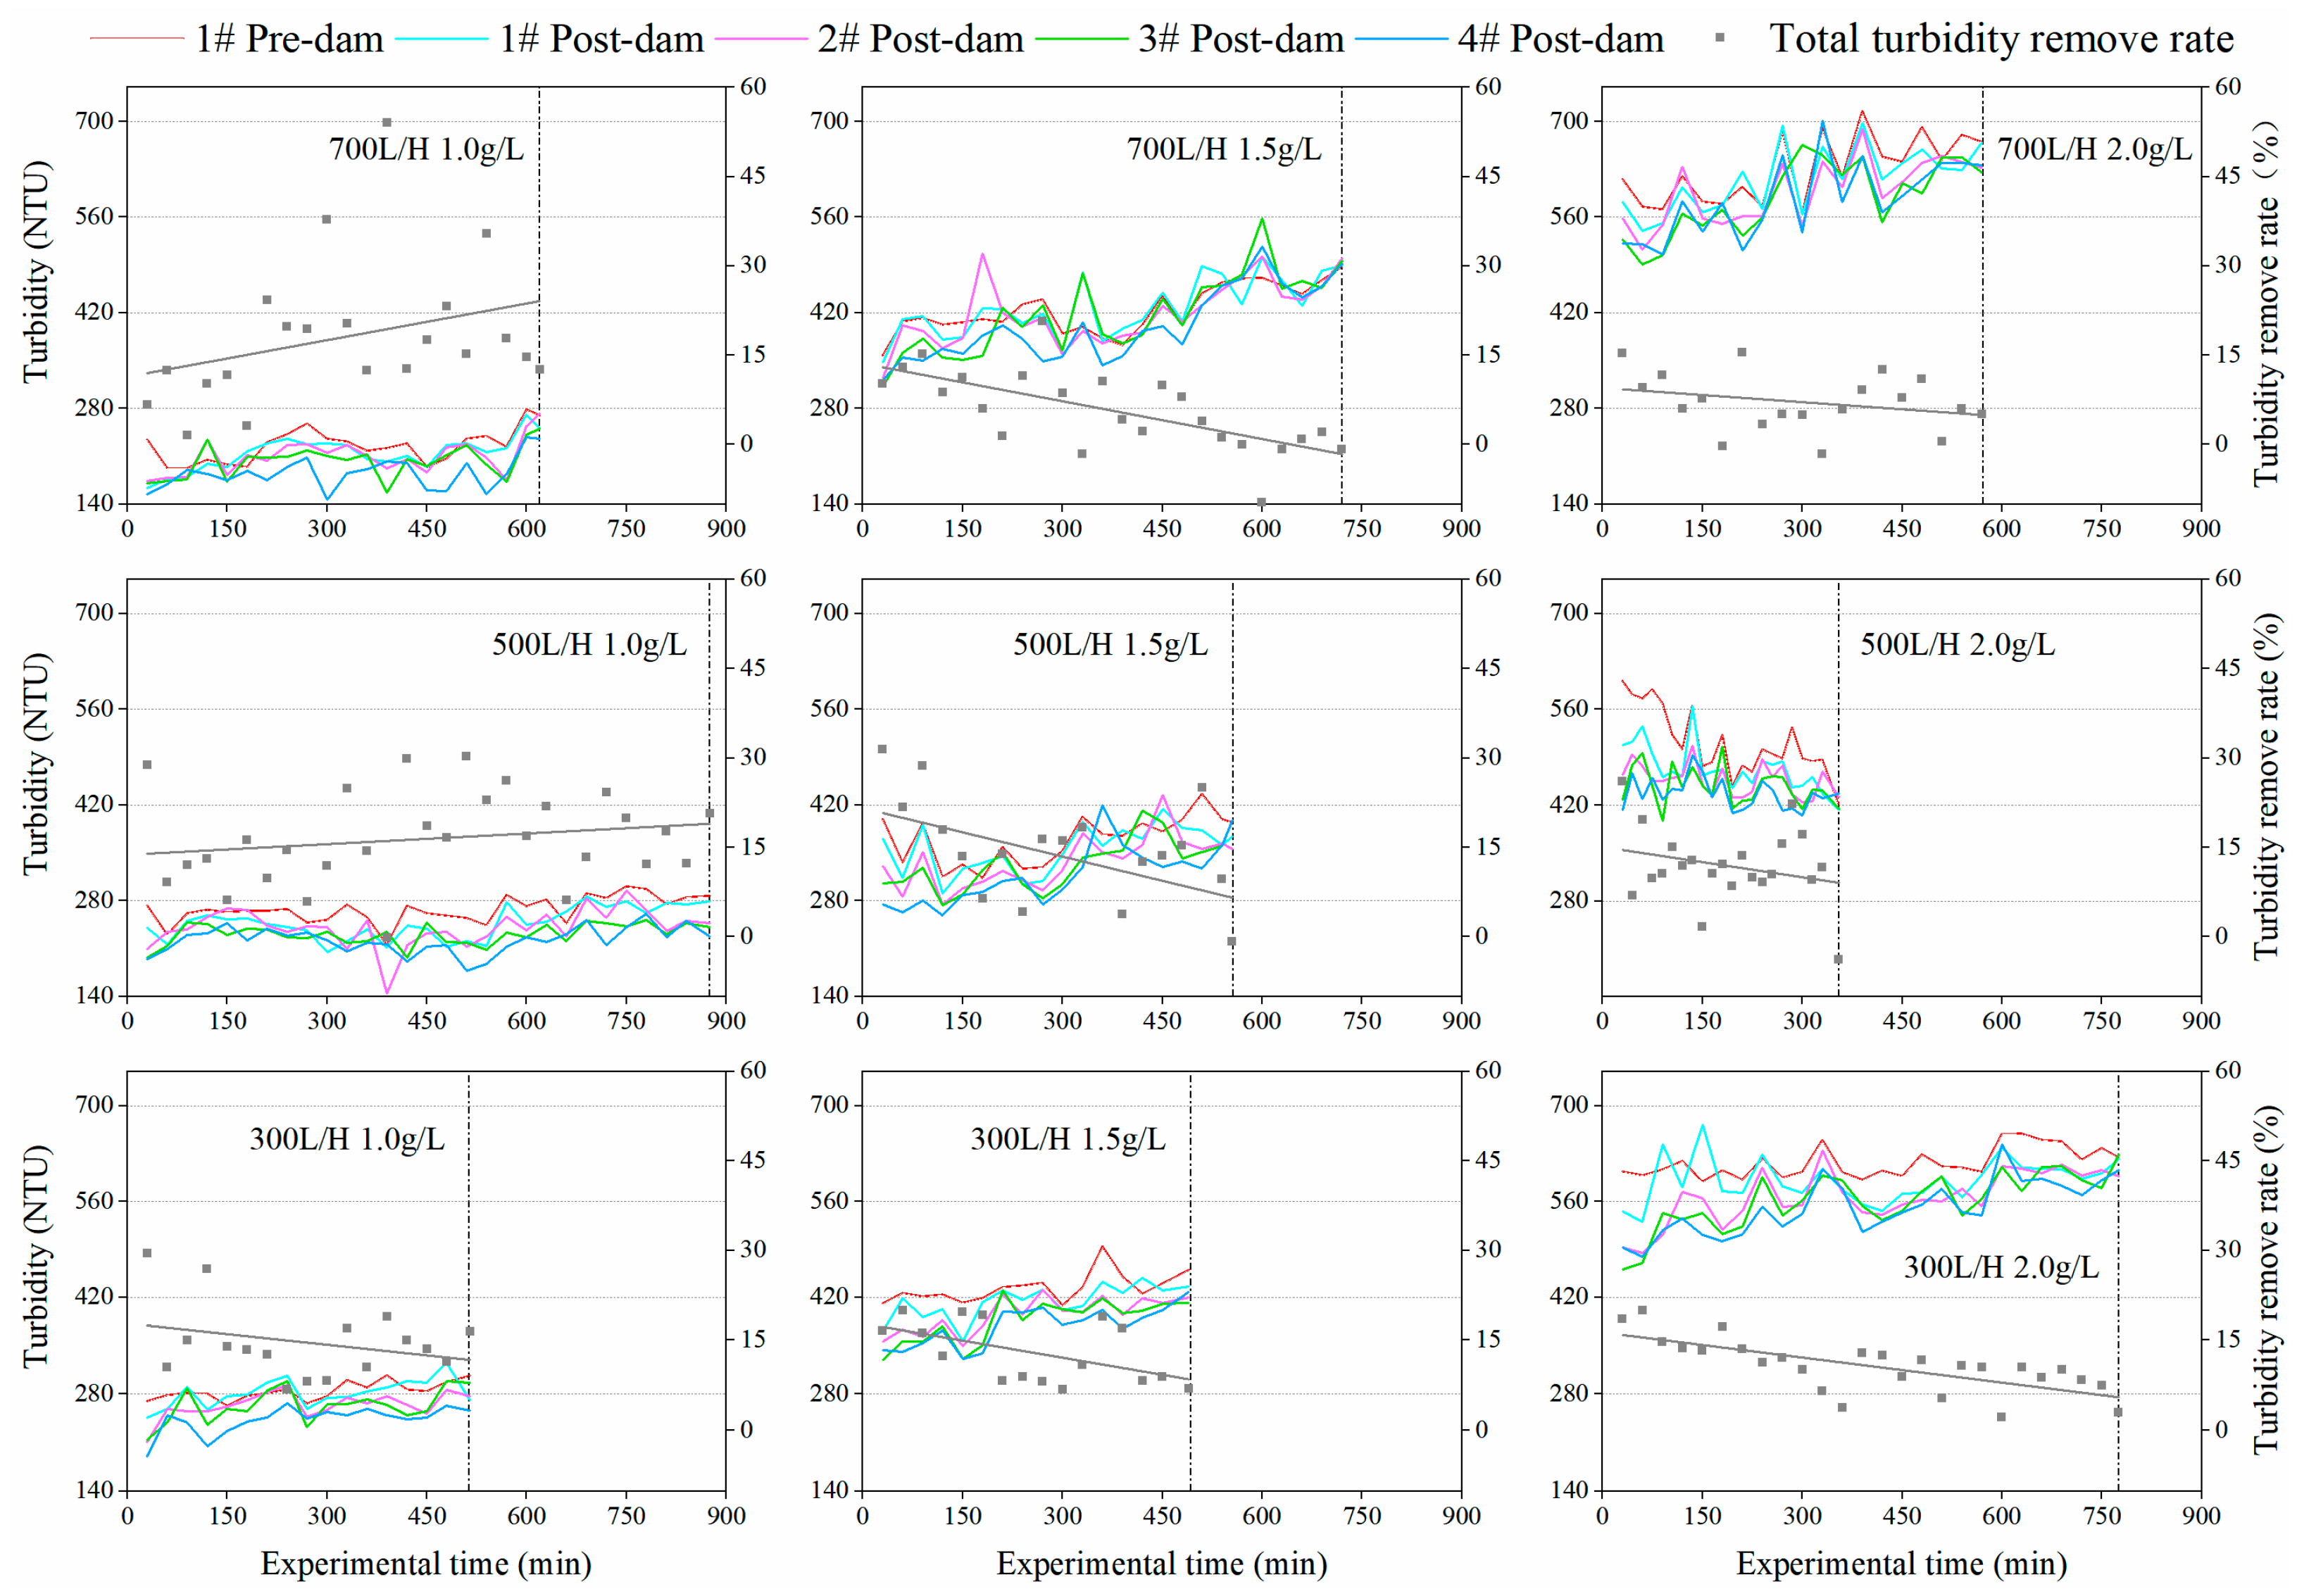
Both the turbidity removal rate and the intercepted sediment mass in the cascade permeable dam are positively correlated with the number of dams. For 4# dam, the lower the water level in front of the dam, the smaller the effective volume of the dam body, and the less optimistic sediment interception efficiency. The percentage of the sediment interception mass of the cascade permeable dam is only 3.6–7.7%. Therefore, in the actual engineering application, the number of dam bodies of the cascade permeable dam should be reasonably designed.
In this study, only the effect of the sediment concentration and discharge were considered. In fact, the spacing, thickness, and number of the dams in a cascade permeable dam can also affect the sediment deposition rate and infiltration pattern. The effect of dam thickness and spacing on the sediment interception efficiency of cascade permeable dams should be further explored.

Author Contributions

Conceptualization, J.L. and H.Z.; methodology, J.L., H.Z. and L.P.; validation, J.C.; formal analysis, J.L.; investigation, N.L. and M.W.; resources, H.Z.; data curation, J.C.; writing—original draft preparation, J.L.; writing—review and editing, H.Z. and L.P.; visualization, J.L.; supervision, H.Z.; software, J.L.; project administration, H.Z.; funding acquisition, H.Z. All authors have read and agreed to the published version of the manuscript.

Funding

This work was supported by Key R&D Program of Sichuan Provincial Science and Technology Department (2022YFG0016).

Institutional Review Board Statement

Not applicable.

Informed Consent Statement

Not applicable.

Data Availability Statement

The data in figures and tables used to support the findings of this study are included herein.

Acknowledgments

We thank Bo Yu of Xihua University and Yi Long of Sichuan Water Conservancy College for providing us with helpful discussion and instruction on topics related to this work.

Conflicts of Interest

The authors declare no conflict of interest.

References

  1. De Vente, J.; Posen, J. Predicting soil erosion and sediment yield at the basin scale: Scale issues and semi-quantitative models. Earth-Sci. Rev. 2005, 71, 95–125. [Google Scholar] [CrossRef]
  2. Milliman, J.D.; Syvitski, J.P.M. Geomorphic/Tectonic Control of Sediment Discharge to the Ocean: The Importance of Small Mountainous Rivers. J. Geol. 1992, 100, 525–544. [Google Scholar] [CrossRef]
  3. Giambastiani, Y.; Giusti, R.; Gardin, L.; Cecchi, S.; Lannuccilli, M.; Romanelli, S.; Bottai, L.; Ortolani, A.; Gozzoni, B. Assessing Soil Erosion by Monitoring Hilly Lakes Silting. Sustainability 2022, 14, 5649. [Google Scholar] [CrossRef]
  4. Tan, M.X.; Scholz, C.A. Source-to-sink response to high-amplitude lake level rise driven by orbital-scale climate change: An example from the Pleistocene Lake Malawi (Nyasa) Rift, East Africa. Sedimentology 2021, 68, 3494–3522. [Google Scholar] [CrossRef]
  5. Fei, J. Water level change of Lake Machang in eastern China over 1814–1902 CE. Clim. Past 2022, 18, 649–655. [Google Scholar] [CrossRef]
  6. Naganna, S.R.; Deka, P.C. Variability of streambed hydraulic conductivity in an intermittent stream reach regulated by Vented Dams: A case study. J. Hydrol. 2018, 562, 477–491. [Google Scholar] [CrossRef]
  7. Chapman, J.M.; Proulx, C.L.; Veilleux, M.A.; Levert, C.; Bliss, S.; Andre, M.; Lapointe, N.W. Clear as mud: A meta-analysis on the effects of sedimentation on freshwater fish and the effectiveness of sediment-control measures. Water Res. 2014, 56, 190–202. [Google Scholar] [CrossRef] [PubMed]
  8. Jones, J.I.; Murphy, J.F.; Collins, A.L.; Sear, D.A.; Naden, P.S.; Armitage, P.D. The Impact of Fine Sediment on Macro-Invertebrates. River Res. Appl. 2012, 28, 1055–1071. [Google Scholar] [CrossRef]
  9. Donohue, I.; Molinos, J.G. Impacts of increased sediment loads on the ecology of lakes. Biol. Rev. 2009, 84, 517–531. [Google Scholar] [CrossRef]
  10. Cao, J.X.; Sun, Q.; Zhao, D.H.; Xu, M.Y.; Shen, Q.S.; Wang, D.; Wang, Y.; Ding, S.M. A critical review of the appearance of black-odorous waterbodies in China and treatment methods. J. Hazard. Mater. 2020, 385, 121511. [Google Scholar] [CrossRef] [PubMed]
  11. Wu, J.W.; Zhong, X.J.; Yang, L.L. Study on characteristics of the sediment release in Chaohu Lake. IOP Conf. Ser. Earth Environ. Sci. 2021, 692, 042071. [Google Scholar] [CrossRef]
  12. Xu, S.Y.; Lu, J.; Chen, L.C.; Luo, W.G.; Zhu, S.L. Experiment on Sediment Ammonia Nitrogen Release of Chaohu Lake in Varying Hydrodynamic Disturbance. Sustainability 2023, 15, 1581. [Google Scholar] [CrossRef]
  13. Pal, S.C.; Chakrabortty, R.; Roy, P.; Chowdhuri, I.; Das, B.; Saha, A.; Shit, M. Changing climate and land use of 21st century influences soil erosion in India. Gondwana Res. 2021, 94, 164–185. [Google Scholar] [CrossRef]
  14. Brils, J. Sediment Monitoring under the EU Water Framework Directive. J. Soils Sediments 2004, 4, 72–73. [Google Scholar] [CrossRef]
  15. Förstner, U.P.N. Owens, Sustainable management of sediment resources. Vol. 4: Sediment management at the river basin scale. J. Soils Sediments 2008, 8, 212–213. [Google Scholar] [CrossRef]
  16. Chakrapani, G.J. Factors controlling variations in river sediment loads. Curr. Sci. India 2005, 88, 569–575. [Google Scholar]
  17. Shang, Q.Q.; Xu, H.; Li, G.B. Overview of Research on the Influence of Permeable Structures. Appl. Mech. Mater. 2013, 405–408, 2115–2122. [Google Scholar] [CrossRef]
  18. Winterwerp, J.C.; Albers, T.; Anthony, E.J.; Friess, D.A.; Mancheno, A.G.; Moseley, K.; Muhari, A.; Naipal, S.; Noordermeer, J.; Oost, A.; et al. Managing erosion of mangrove-mud coasts with permeable dams-lessons learned. Eco. Eng. 2020, 158, 106078. [Google Scholar] [CrossRef]
  19. Pranchai, A.; Jenke, M.; Berger, U. Well-intentioned, but poorly implemented: Debris from coastal bamboo fences triggered mangrove decline in Thailand. Mar. Pollut. Bull. 2019, 146, 900–907. [Google Scholar] [CrossRef] [PubMed]
  20. Abu-Zreig, M.; Rudra, R.P.; Whiteley, H.R. Validation of a vegetated filter strip model (VFSMOD). Hydrol. Process. 2001, 15, 729–742. [Google Scholar] [CrossRef]
  21. Zhao, C.H.; Gao, J.E.; Zhang, M.J.; Wang, F.; Zhang, T. Sediment deposition and overland flow hydraulics in simulated vegetative filter strips under varying vegetation covers. Hydrol. Process. 2016, 30, 163–175. [Google Scholar] [CrossRef]
  22. Jin, C.X.; Ronkens, M.J.M. Experimental studies of factors in determining sediment trapping in vegetative filter strips. Trans. ASAE 2001, 44, 277–288. [Google Scholar] [CrossRef]
  23. Gharabaghi, B.; Rudra, R.B.; Goel, P.K. Effectiveness of Vegetative Filter Strips in Removal of Sediments from Overland Flow. Water Qual. Res. J. Can. 2006, 41, 275–282. [Google Scholar] [CrossRef]
  24. Yuan, Y.P.; Bingner, R.L.; Locke, M.A. A Review of effectiveness of vegetative buffers on sediment trapping in agricultural areas. Ecohydrology 2009, 2, 321–336. [Google Scholar] [CrossRef]
  25. Champion, P.D.; Tanner, C.C. Seasonality of macrophytes and interaction with flow in a New Zealand lowland stream. Hydrobiologia 2000, 441, 1–12. [Google Scholar] [CrossRef]
  26. Xu, X.; Zhang, H.; Zhang, O. Development of check-dam systems in gullies on the Loess Plateau, China. Environ. Sci. Policy 2004, 7, 79–86. [Google Scholar] [CrossRef]
  27. Zhao, G.; Kondolf, G.M.; Mu, X.; Han, M.; He, Z.; Rubin, Z.; Wang, F.; Gao, P.; Sun, W. Sediment yield reduction associated with land use changes and check dams in a catchment of the Loess Plateau, China. Catena 2017, 148, 126–137. [Google Scholar] [CrossRef]
  28. Polyakov, V.O.; Nichols, M.H.; Mcclaran, M.P.; Nearing, M.A. Effect of check dams on runoff, sediment yield, and retention on small semiarid watersheds. J. Soil Water Conserv. 2014, 69, 414–421. [Google Scholar] [CrossRef]
  29. Mekonnen, M.; Keesstra, S.D.; Stroosnijder, L.; Baartman, J.; Maroulis, J. Soil Conservation through Sediment Trapping: A Review. Land Degrad. Dev. 2014, 26, 544–556. [Google Scholar] [CrossRef]
  30. Schwindt, S.; Franca, M.J.; Reffo, A.; Schleiss, A.J. Sediment traps with guiding channel and hybrid check dams improve controlled sediment retention. Nat. Hazards Earth Syst. Sci. 2018, 18, 647–668. [Google Scholar] [CrossRef]
  31. Piton, G.; Recking, A. Design of sediment traps with open check dams. I: Hydraulic and Deposition Processes. J. Hydraul. Eng. 2016, 142, 04015045. [Google Scholar] [CrossRef]
  32. Mishra, A.; Froebrich, J.; Gassman, P.W. Evaluation of the Swat Model for assessing sediment control structures in a small watershed in India. Soil Water Div. 2006, 50, 469–477. [Google Scholar] [CrossRef]
  33. Zhang, R.Y.; Wu, B.S. Environmental impacts of high water turbidity of the Niulan River to Dianchi Lake water diversion project. J. Environ. Eng. 2019, 146, 05019006. [Google Scholar] [CrossRef]
  34. Hassanli, A.M.; Nameghi, A.E.; Beecham, S. Evaluation of the effect of porous check dam location on fine sediment retention (a case study). Environ. Monit. Assess. 2009, 152, 319–326. [Google Scholar] [CrossRef] [PubMed]
  35. Rahmati, O.; Ghasemieh, H.; Samadi, M.; Kalantrai, Z.; Tiefenbacher, J.P.; Nalivan, O.A.; Cerda, A.; Ghiasi, S.S.; Darabi, H.; Haghighi, A.T.; et al. TET: An automated tool for evaluating suitable check-dam sites based on sediment trapping efficiency. J. Clean. Prod. 2020, 266, 122051. [Google Scholar] [CrossRef]
  36. Wang, H.C.; Wang, D.T.; Bao, Z.; Zhou, X.S. Analysis on Nitrogen and Phosphorus Removal of Sand Stone Dam in River. In Proceedings of the International Conference on Energy Development and Environmental Protection (EDEP), Nanjin, China, 17–19 August 2018. [Google Scholar]
  37. Yuan, D.H.; Bai, M.H.; He, L.S.; Zhou, Q.; Kou, Y.Y.; Li, J.Q. Removal performance and dissolved organic matter biodegradation characteristics in advection ecological permeable dam reactor. Environ. Technol. 2022, 44, 2288–2299. [Google Scholar] [CrossRef] [PubMed]
  38. Muccino, J.C.; Gray, W.G.; Ferrand, L.A. Toward an improved understanding of multiphase flow in porous media. Rev. Geophys. 1998, 36, 401–422. [Google Scholar] [CrossRef]
  39. Soler, M.; Colomer, J.; Folkard, A.; Serra, T. Particle size segregation of turbidity current deposits in vegetated canopies. Sci. Total Environ. 2020, 703, 134784. [Google Scholar] [CrossRef] [PubMed]
  40. Wei, Y.; Xu, M.X.; Li, R.Q.; Zhang, L.P.; Deng, Q.L. Estimating the ecological water levels of shallow lakes: A case study in Tangxun Lake, China. Sci. Rep. 2020, 10, 5637. [Google Scholar] [CrossRef]
  41. Cabalar, A.F.; Akbulut, N. Effects of the particle shape and size of sands on the hydraulic conductivity. Acta Geotech. Slov. 2016, 13, 82–93. [Google Scholar]
  42. Xu, S.L.; Zhu, Y.Z.; Cai, Y.Q.; Sun, H.L.; Cao, H.T.; Shi, J.Q. Predicting the permeability coefficient of polydispersed sand via coupled CFD–DEM simulations. Comput. Geotech. 2022, 144, 104634. [Google Scholar] [CrossRef]
  43. Ochi, J.; Vernoux, J.F. A two-dimensional network model to simulate permeability decrease under hydrodynamic effect of particle release and capture. Transp. Porous Media 1999, 37, 303–325. [Google Scholar] [CrossRef]
  44. Tang, Y.; Yao, X.; Chen, Y.; Zhou, Y.; Zhu, D.; Zhang, Y.; Peng, Y. Experiment research on physical clogging mechanism in the porous media and its impact on permeability. Granul. Matter 2020, 22, 37. [Google Scholar] [CrossRef]
  45. Berni, C.; Herrero, A.; Camenen, B. Computations of trapping coefficient for fine sediment infiltration. In Proceedings of the 36th IAHR Word Congress, Deleft, The Netherlands, 28 June 2015. [Google Scholar]
  46. Alem, A.; Ahfir, N.D.; Elkawafi, A.; Wang, H.Q. Hydraulic Operating Conditions and Particle Concentration Effects on Physical Clogging of a Porous Medium. Transp. Porous Media 2014, 106, 303–321. [Google Scholar] [CrossRef]
  47. Rakhuba, A.V.; Shmakova, M.V. Mathematical modelling of water turbidity in the water body. In Proceedings of the IOP Conference Series: Earth and Environmental Science, Perm, Russia, 30 May 2019. [Google Scholar] [CrossRef]
  48. Horowits, A.J.; Clarke, R.T.; Merten, G.H. The effects of sample scheduling and sample numbers on estimates of the annual fluxes of suspended sediment in fluvial systems. Hydrol. Process. 2015, 29, 531–543. [Google Scholar] [CrossRef]
  49. Cox, N.J.; Warburton, J.; Armstrong, A.; Hollliday, V.J. Fitting concentration and load rating curves with generalized linear models. Earth Surf. Process. Land. 2008, 33, 25–39. [Google Scholar] [CrossRef]
  50. Fang, N.F.; Shi, Z.H.; Chen, F.X.; Zhang, H.Y.; Wang, Y.X. Discharge and suspended sediment patterns in a small mountainous watershed with widely distributed rock fragments. J. Hydrol. 2015, 528, 238–248. [Google Scholar] [CrossRef]
  51. Itoh, T.; Horiuchi, S.; Mizuyama, T.; Kaitsuka, K. Hydraulic model tests for evaluating sediment control function with a grid-type Sabo dam in mountainous torrents. Int. J. Sediment Res. 2013, 28, 511–522. [Google Scholar] [CrossRef]
  52. Onderka, M.; Krein, A.; Wrede, S.; Martinez-Carreras, N.; Hoffmann, L. Dynamics of storm-driven suspended sediments in a headwater catchment described by multivariable modeling. J. Soils Sediments 2012, 12, 620–635. [Google Scholar] [CrossRef]
  53. Bracken, L.J.; Turnbull, L.; Wainwright, J.; Bogaart, P. Sediment connectivity: A framework for understanding sediment transfer at multiple scales. Earth Surf. Process. Land. 2015, 40, 177–188. [Google Scholar] [CrossRef]
  54. Vercruysse, K.; Grabowski, R.C.; Rickson, R.J. Suspended sediment transport dynamics in rivers: Multi-scale drivers of temporal variation. Earth-Sci. Rev. 2017, 166, 38–52. [Google Scholar] [CrossRef]
  55. Yang, Z.Z.; Duan, X.W.; Huang, J.C.; Dong, Y.F.; Zhang, X.B.; Liu, J.; Yang, C. Tracking long-term cascade check dam siltation: Implications for debris flow control and landslide stability. Landslides 2021, 18, 3923–3935. [Google Scholar] [CrossRef]
Figure 1. Study Area—the Xinglong Lake in Luxi River (The red dot represents the location of cascade permeable dam).
Applsci 13 11607 g001
Figure 2. Schematic diagram of the experimental setup: (a) Side view; (b) Top view; (c) Layout of the cascade permeable dam; (d) Sediment interception in pre-dam.The triangle in (a) marks the water sampling position in the experiments.
Applsci 13 11607 g002
Figure 3. Percentage distribution of intercepted sediment mass by a permeable dam along the flow direction.
Applsci 13 11607 g003
Figure 4. Variation curve of the relative water in front of each dam.
Applsci 13 11607 g004
Figure 5. Curves of the water level difference of the dams along the flow direction.
Applsci 13 11607 g005
Figure 6. Variation curve of the permeable coefficient of 1–3# dam body.
Applsci 13 11607 g006
Figure 7. Turbidity variation curve at different locations in the main flume and at the outlet for small particle size (the black line is the fitted curve for the total turbidity removal rate).
Applsci 13 11607 g007
Figure 8. Turbidity variation curve at different locations in the main flume and at the outlet for large particle size (the black line is the fitted curve for the total turbidity removal rate).
Applsci 13 11607 g008
Figure 9. Distribution of the intercepted sediment mass along the flow direction: (a) 1# Dam; (b) 2# Dam; (c) 3# Dam; (d) 4# Dam.
Applsci 13 11607 g009
Figure 10. Sediment interception rate along the flow direction: (a) Q = 300 L/H; (b) Q = 500 L/H; (c) Q = 700 L/H.
Applsci 13 11607 g010
Table 1. Experimental working conditions.
RunD 1 (mm)Q 1 (L/H)C 1 (g/L)RunD 1 (mm)Q 1 (L/H)C 1 (g/L)
11–2 (Small particle size)3001.0103–5 (Large particle size)3001.0
23001.5113001.5
33002.0123002.0
45001.0135001.0
55001.5145001.5
65002.0155002.0
77001.0167001.0
87001.5177001.5
97002.0187002.0
1 The D, Q, and C refer to gravel particle size, discharge rate, and sediment concentration, respectively.
Disclaimer/Publisher’s Note: The statements, opinions and data contained in all publications are solely those of the individual author(s) and contributor(s) and not of MDPI and/or the editor(s). MDPI and/or the editor(s) disclaim responsibility for any injury to people or property resulting from any ideas, methods, instructions or products referred to in the content.

