Abstract
Along with the recent development of artificial intelligence technology, convergence services that apply technology are undergoing active development in various industrial fields. In particular, artificial intelligence-based object recognition technologies are being widely applied to the development of intelligent analysis services based on image data and streaming video data. As such, in the port yard, these object recognition technologies are being used to develop port safety services in smart ports. Accidents are a frequent occurrence in port yards due to misaligned loading of ship containers. In order to prevent such accidents, various studies using artificial intelligence technology are underway. In this paper, we propose a real-time shipping container accident inference edge system that can analyze the ship container’s loading status from a safety point of view to prevent accidents in advance. The proposed system includes the collection of video data of the ship container, inferring the safety level of the alignment status of the ship container, and transmitting the inference results for the safety level. In this paper, the proposed inference model is implemented with YOLOv3, YOLOv4 and YOLOv7 networks and can be used in video monitoring to realize the accurate classification and positioning of three different safety levels (safe, caution, and danger) in real time. In the performance evaluation, the detection accuracy of the inference model implemented with the YOLOv4 network was greater than 0.95. Its performance was also significantly better than that of the inference model implemented with the YOLOv3 and YOLOv7 networks. Although it was slightly inferior to the YOLOv4 network in terms of the accuracy, the inference model implemented with the YOLOv3 network had a faster inference speed than the model implemented with the YOLOv4 and YOLOv7 networks. Because of the port safety scenario, in which the inference accuracy is more important than the inference speed, we applied the YOLOv4 algorithm to the inference model of the system.
1. Introduction
Since the Fourth Industrial Revolution, ICT convergence services based on IoT technology and artificial intelligence technologies have been actively developed in various industrial domains [1,2,3]. Artificial intelligence (AI) is defined as the intelligence of machines or software that develops and studies these intelligent machines. Intelligent analysis systems based on image and video data are being developed to provide insight into industrial sites and allow them to be monitored in real time. In addition, AI-based object recognition technology and IoT-based real-time image data collection technology are being actively applied to analyze field conditions in industrial environments. For example, a smart port is currently being developed in the port yard through adapting 5G, IoT, and AI technologies [4,5]. In this context, a smart port refers to a sensor device that can monitor facilities in the port through the IoT, collecting facility status information as real-time data through the sensor device and analyzing the collected data by using artificial intelligence to determine the on-site situation. This refers to the port environment to which intelligent technology that can determine the facility status is applied [6]. In addition, it aims to provide an efficient logistics system, eco-friendly energy management, and intelligent port safety services in smart ports [7,8,9,10].
In this paper, we focus on exploring potential intelligent port safety services, among various other intelligent port services. Looking at the recent solutions to intelligent port safety services, solutions applying object recognition technology are being actively developed to prevent the increasing number of accidents that are occurring in port yards [11]. Since the port yard has a regional characteristic of strong wind, if the shipping containers are misaligned, then shipping containers may collapse due to strong winds. Therefore, to prevent such accidents, there is a need for an intelligent system that can monitor the alignment status of shipping containers in real time and predict container collapses. In this paper, we propose a real-time shipping container accident inference edge system (RSCAIES) which can monitor the alignment status of shipping containers in real time and analyze the alignment status of these containers to prevent accidents caused by the misalignment status of shipping containers at the edge environment. The proposed RSCAIES consists of three main functions: a shipping container data collection function used to monitor the alignment status of ship containers in the port yard, a deep learning-based safety level estimation function that can infer the safety levels of shipping containers based on their alignment status, and a management function that can store and display the inferred safety level results and monitor the safety accident at the port yard based on the inferred results in real time. In particular, the deep learning-based safety level estimation function predicts the accident risk level through the shipping container data acquired in real time. In this paper, in order to implement a deep learning-based safety level estimation function, we divide the classification criteria of the alignment states of shipping containers into three classes: safe, caution, and danger. In addition, we propose a safety level estimation model based on the YOLOv3 [12], YOLOv4 [13], and YOLOv7 [14] algorithms, which can classify three safety levels according to the classification criteria. The safety level estimation model is implemented to run on an edge server at the port yard, and the inference results are sent to the port management platform using the management function.
This paper studies the solution that can support intelligent port safety services and prevent accidents by inferring a safety level and monitoring the alignment status of shipping containers in the port yard. The main contributions of this paper are as follows:
- A real-time shipping container accident inference edge system using an artificial intelligence technology is investigated. In the existing works, there is no container accident inference system. However, the proposed system has the advantage of being able to monitor the status and risk of container accidents in real time. The proposed system also consists of a shipping container data collection function, a deep learning-based safety level estimation function, and a port yard management function.
- A deep learning-based safety level estimation method is proposed to infer the safety levels of shipping containers. The proposed deep learning-based safety level estimation method is implemented using the YOLOv4 algorithm and is able to infer the safety levels according to the safety classification criteria based on the alignment status of shipping containers.
- A real-world dataset related to the alignment status of shipping containers was collected, and a safety level estimation model was trained and optimized based on this dataset. The optimized inference model was used as a safety-level estimation model for the proposed system to improve its performance.
The rest of this paper is organized as follows. Section 2 presents the related works, and Section 3 proposes the RSCAIES architecture and the safety level inference model for accident risk based on YOLOv3, YOLOv4, and YOLOv7 networks to predict the safety accident level of the alignment of shipping containers in detail. In Section 4, the performance evaluation of the proposed RSCAIES and inference model is presented. Finally, this paper is concluded in Section 5.
2. Related Works
This chapter examines trends in object detection algorithms. In addition, we analyze an object detection algorithm suitable for classifying shipping container accidents. Object detection algorithms are defined as the process of learning the features of the object, detecting the features within a given image, and classifying the location and class of the object. Objects should be identified even if they are mixed with other objects rather than simply classifying and localizing them.
Object Detection Method
The existing object detection method is separate from traditional detection techniques such as the Histogram of Oriented Gradients (HOG) [15] and Deformable Parts Model (DPM) [16] algorithms and deep learning-based detection techniques. The HOG is an algorithm that detects formulaic objects by converting the regional gradient direction information of an image into a histogram to express its shape. It has the advantage of strong noise, as it performs calculations in units of cells rather than pixels. The DPM is an algorithm that detects an object in a block of a bounding box using a template filter. As the operation is performed through the sliding window, many bounding boxes are generated, and the detection process is complicated. Along with the mentioned algorithms, traditional detection techniques have the disadvantage of having limited applications that can be applied and fewer classes that can be classified. In contrast, deep learning-based detection techniques are combined with deep learning algorithms to overcome the shortcomings of traditional detection techniques. As a result, this method is applicable to various applications and showed good performance in classifying many classes. Deep learning object detection algorithms are divided into two types. One is a two-stage method, in which regional proposal and classification are processed sequentially. These methods include R-CNN [17], Fast R-CNN [18], and Faster R-CNN [19] as representative algorithms. R-CNN is a model that uses a CNN, which classifies objects in a two-stage method, and a regional proposal algorithm to locate an object’s bounding boxes, and it uses a linear support vector machine (SVM) [20] to extract features and classify them into classes based on CNN operations. However, the disadvantage is that it takes a lot of inference time to carry out CNN operations on all the regions of interest (ROIs) obtained using the regional proposal algorithm. Faster R-CNN was proposed to compensate for the shortcomings that result from the long inference times of R-CNN. Since the selective search is computed outside the CNN, bottlenecks occur at the ROI generation stage. Faster R-CNN has eliminated the selective search while inheriting the structure of the existing Fast R-CNN. It is an object detection algorithm that improves on the slow speed by using a region proposal network (RPN) that infers ROIs from feature maps and an ROI pooling layer that generates fixed-size feature vectors. Figure 1 shows the architecture of Faster R-CNN.
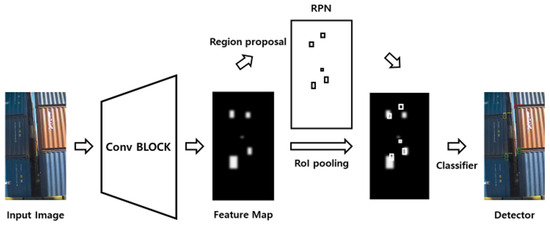
Figure 1.
Architecture of Faster R-CNN.
The other method is a one-stage method, in which regional proposal and classification are processed simultaneously. This involves the YOLO series of algorithms and the SSD algorithm. The YOLO algorithm is used to predict the class and location of an object in an image. This algorithm is also suitable for detecting objects in real time, with a faster computational speed compared with Faster R-CNN. The YOLO algorithm proposes a new approach to incorporating a structure and finding objects by predicting the bounding boxes in an image, and it has a simplified pipeline and fewer computations, enabling inference speeds fast enough for real-time systems while using contextual information to reduce background errors. However, the initial YOLO model has the disadvantage of not detecting small objects or predicting multiple objects as a group due to spatial constraints. It also suffers from localization errors. In the next version of the model, YOLOv2, using anchor boxes to predict objects is proposed to improve the low recall performance. This allows the YOLOv2 model to achieve a significant increase in recall performance. This is because k-means clustering and a sigmoid activation function are applied along with the anchor boxes. In addition, the size of the input image can be varied while removing fully connected layers in the YOLOv2 model. Thus, the YOLOv2 model can balance speed and accuracy for the purpose of the task. The YOLOv3 model consists of 53 convolution layers and 23 residual blocks, and it uses darknet-53, FPN for the neck, and YOLO for the head as the backbone network. However, the YOLOv3 model does not improve performance more than the YOLOv2 model. YOLOv3 shows a high FPS speed at the time when using the graphics processing unit (GPU) while maintaining accuracy. Table 1 shows the performance comparison between YOLOv3 and previous algorithms.

Table 1.
Comparison of YOLOv3, RetainNet, FRCN, SSD, and R-FCN [13].
Finally, the YOLOv4 model uses CSPDarknet-53, which combines Cross Stage Partial Network (CSPNet) with Darknet-53 as its backbone network. Although similar in structure to the YOLOv3 model, it combines techniques such as Bag of Freebies (BOF) and Bag of Specials (BOS) to improve the speed and accuracy. Spatial pyramid pooling (SPP) was used to compress the features of the image without distortion to preserve information, and PAN was used instead of a feature pyramid network (FPN) to reduce the flow of information and preserve low-level information. The result was robust real-time performance and improved performance for small objects. Compared with YOLOv3, YOLOv4 increased the AP by 10% and FPS by 12%. Also, the YOLO model has been used for objection detection in a range of applications. Ref. [21] presented a system for monitoring litter in rivers using object recognition technology and unmanned aerial vehicles (UAVs). This system has several advantages, namely preventing the pollution of riverbanks with litter and enabling the management of hard-to-reach areas. The YOLOv5 algorithm and scale-invariant feature transform (SIFT) were used for the litter detection model. Ref. [22] developed a framework based on visuals to prevent heatstroke fatalities in confined vehicles. The mechanism identifies individuals or animals present inside a vehicle and communicates with the caregiver via notifications in case of their absence from the car. For interior detection, an artificial intelligence model was created, utilizing NanoDet, YOLOv6, and YOLOv7. Ref. [23] proposed an assistive system based on the Artificial Intelligence of Things (AIoT) framework to provide convenience to blind people. The system is based on smart glasses and a lightweight network based on YOLOv5, which is capable of detecting external objects and surrounding objects such as books. Ref. [24] proposed a system for tracking and classifying objects in a warehouse by combining YOLOv5 for object detection with Deep Simple Online and Real-Time Tracking (DeepSORT) to classify people, goods, and environments. The algorithm demonstrated its robustness and efficiency in a multi-object tracking (MOT) challenge. Ref. [25] proposed a method which models the bounding box of YOLOv3 with Gaussian parameters and redesigns the loss function to lower the rate of false positives in object detection algorithms for autonomous driving. This method significantly reduces false positives (FPs) and increases true positives (TPs), resulting in an improvement in the mAP by 3.09 and 3.5 on the Karlsruhe Institute of Technology and Toyota Technological Institute (KITTI) and Berkeley DeepDrive (BDD) datasets, respectively. Demonstrating real-time detection performance, it achieved a high inference rate of 42 FPS. Ref. [26] introduced a new loss function for bounding box regression that provides optimization for both bounding box transformation and localization variance. The use of localization variance enables the merging of neighboring boxes during non-maximum suppression, which improves the localization performance. In [27], the authors presented a dynamic DETR that combines a dynamic encoder utilizing different types of convolutions with an ROI-based decoder. This strategy effectively overcame the limitations associated with small object feature loss and a slow training speed, which were previously problematic in the learning process. Furthermore, additional experimentation revealed a 3.6-fold improvement in the mAP. A novel neural network-based system for object detection, called AdaDet, was introduced in [28]. It uses random variables to measure the uncertainty of object outcomes, estimating the reliability of the detection results. AdaDet also allows an early exit for objects with high detection accuracy, reducing the computational inference cost. In [29], a new dynamic head framework was utilized to efficiently integrate several self-attention mechanisms and considerably enhance the representational capabilities of the head of an object detection network effectively. The proposed technique was applied to the ResNeXt-DCN backbone and delivered a state-of-the-art algorithm, achieving a performance of a 54.0 average precision score without any additional computational burden.
3. Proposed Real-Time Shipping Container Accident Inference Edge System
In this section, we propose the overall structure of a real-time shipping container accident inference edge system that can predict accidents caused by the misalignment of shipping containers. The proposed edge system includes safety classification criteria and an accident prediction model.
3.1. Overall Structure of a Real-Time Shipping Container Accident Inference Edge System
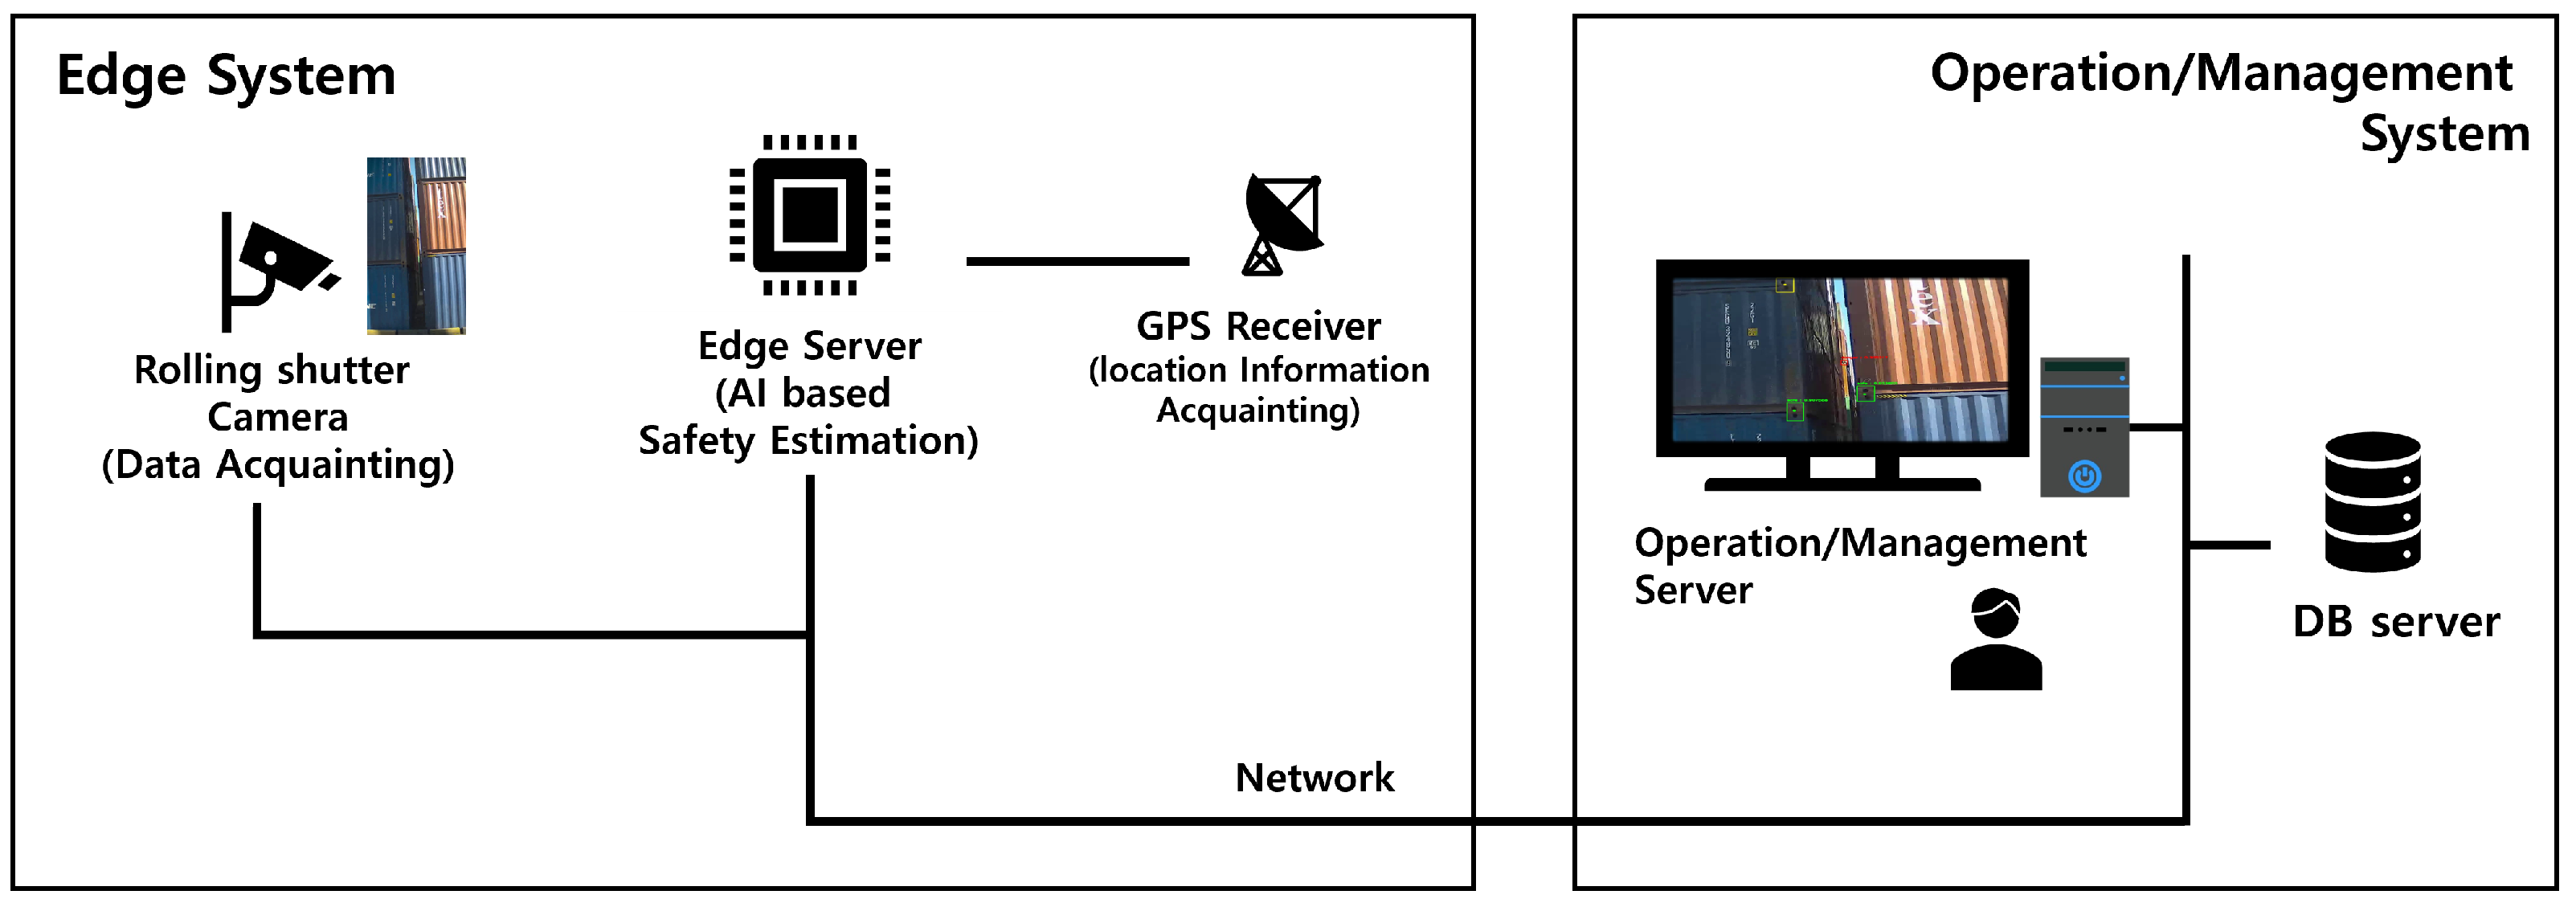
Figure 2 shows the overall structure of the Real-Time Shipping Container Accident Inference Edge System (RSCAIES). The RSCAIES consists of two parts: the edge system and the operation and management system. The edge system includes a rolling shutter camera, an edge server with an AI-based safety level estimation function, and a GPS receiver. The role of each component of the edge system is described in Table 2. We used an Nvidia Jetson AGX Xavier kit to implement the edge system. The OS installation was provided by Ubuntu-based Nvidia. To install the CUDA, cuDNN, and TRT, we began by installing the Jetpack package version 4.6.4. The edge systems were a server environment with Ubuntu 18.04 OS, 32 GB of DDR4 memory, and a 512 core Nvidia Volta GPU with a tensor core, and they provided the objection detection and inference service. The edge system plays a role in classifying the level of the shipping container’s alignment safety by inferring the alignment status of the shipping containers from the data of the shipping containers in the port yard acquired with the camera, while the operation and management system stores the classification results received from the edge system in the server, displays the result to the user, and takes action based on the results. The operation and management system included the DB server and an operation and management server. The role of each component of the operation and management system is described in Table 3.
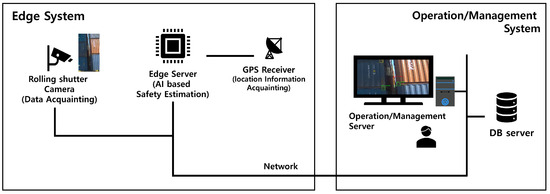
Figure 2.
Overall structure of a real-time shipping container accident inference edge system.
Table 2.
The role of each component of the edge system.
Table 3.
The role of each component of the operation and management system.
3.2. Service Flow
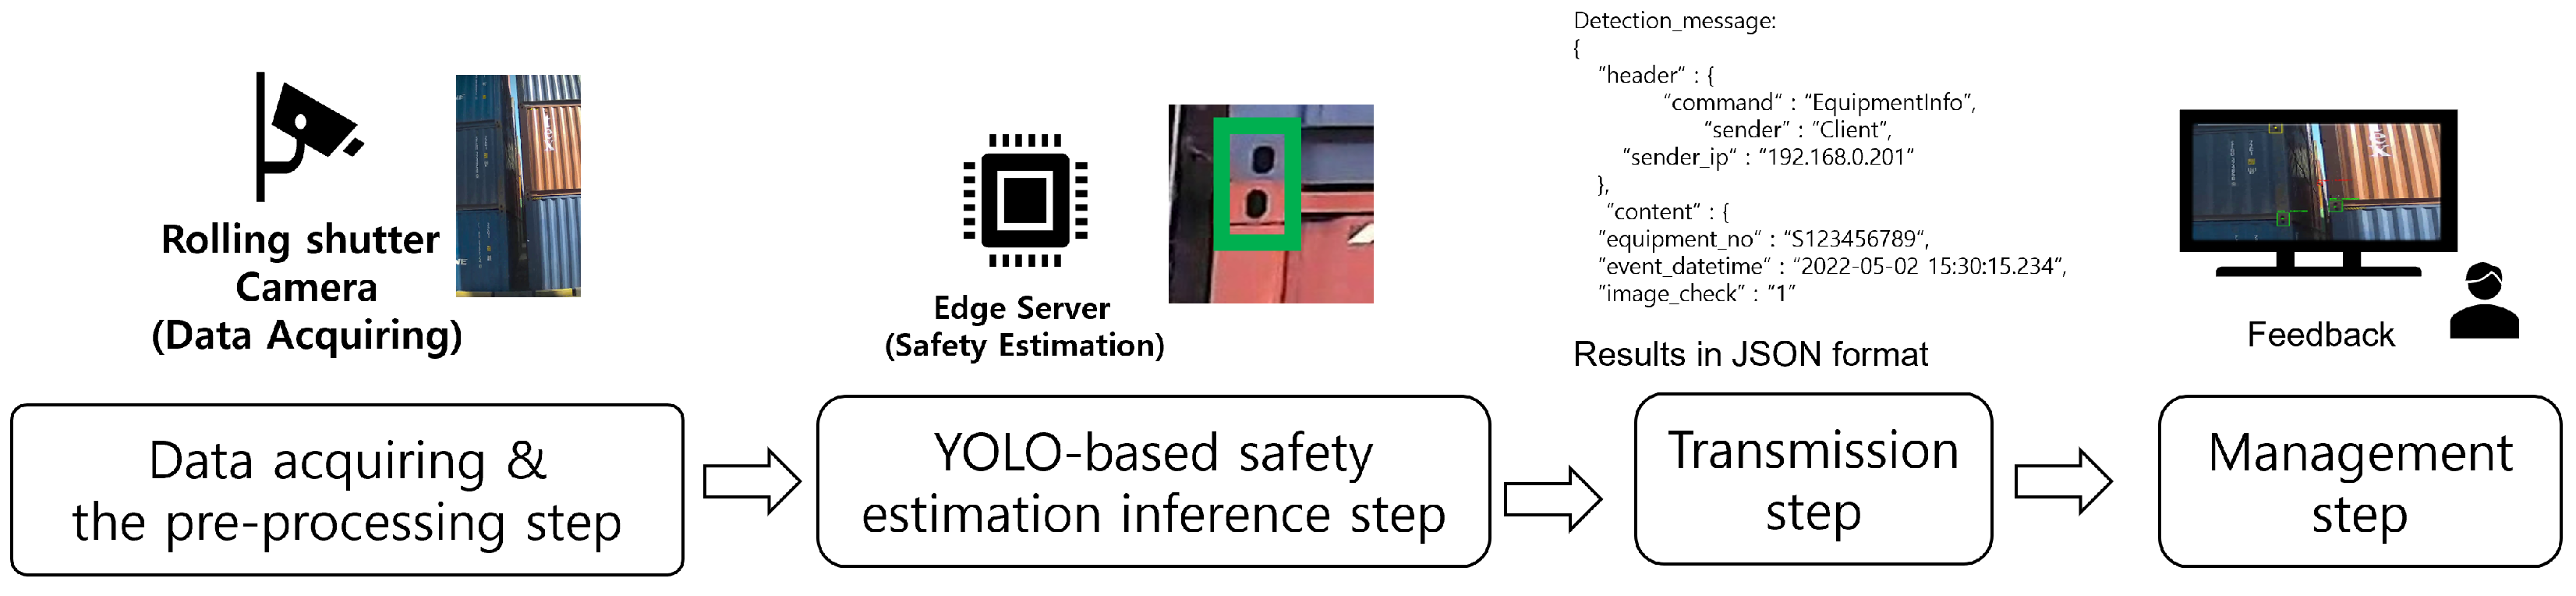
The RSCAIES is divided into three parts in the service flow: the data acquaintance and preprocessing step, the YOLO-based safety level estimation inference step, and the transmission and management step. Figure 3 shows the overall service flow of the RSCAIES.

Figure 3.
Overall service flow of the RSCAIES.
First, data acquisition and the preprocessing step involve obtaining the shipping container image from the rolling shutter camera and dividing it into frames. The location information of the image is also obtained from the GPS receiver. The next step is the YOLO-based safety level estimation inference step. This is the process of inferring the safety level-based shipping container alignment status using the YOLO algorithm. This process sequentially receives the divided shipping container alignment status images, converts the 1920 × 1080 images to a size of 416 × 416, and divides it into 7 × 7 grids. For each grid, a bounding box is generated, and the NMS algorithm is applied to generate a bounding box for shipping container corner casting. And for each grid, the conditional class probability is obtained to infer the safety level class in each bounding box. The next step is the transmission step. This is the process of transmitting the result for classifying the safety level to the management and DB server. This process generates a JSON file and an image file based on the inference result for each frame. The generated files are converted to a binary form and transmitted via HTTP. The last step is the management step. The management step displays the results to the user with the transmitted JSON file and image file and monitors the result for the user. The operator then takes action on the results.
3.3. Safety Classification Criteria and a Deep Learning-Based Safety Level Estimation Method
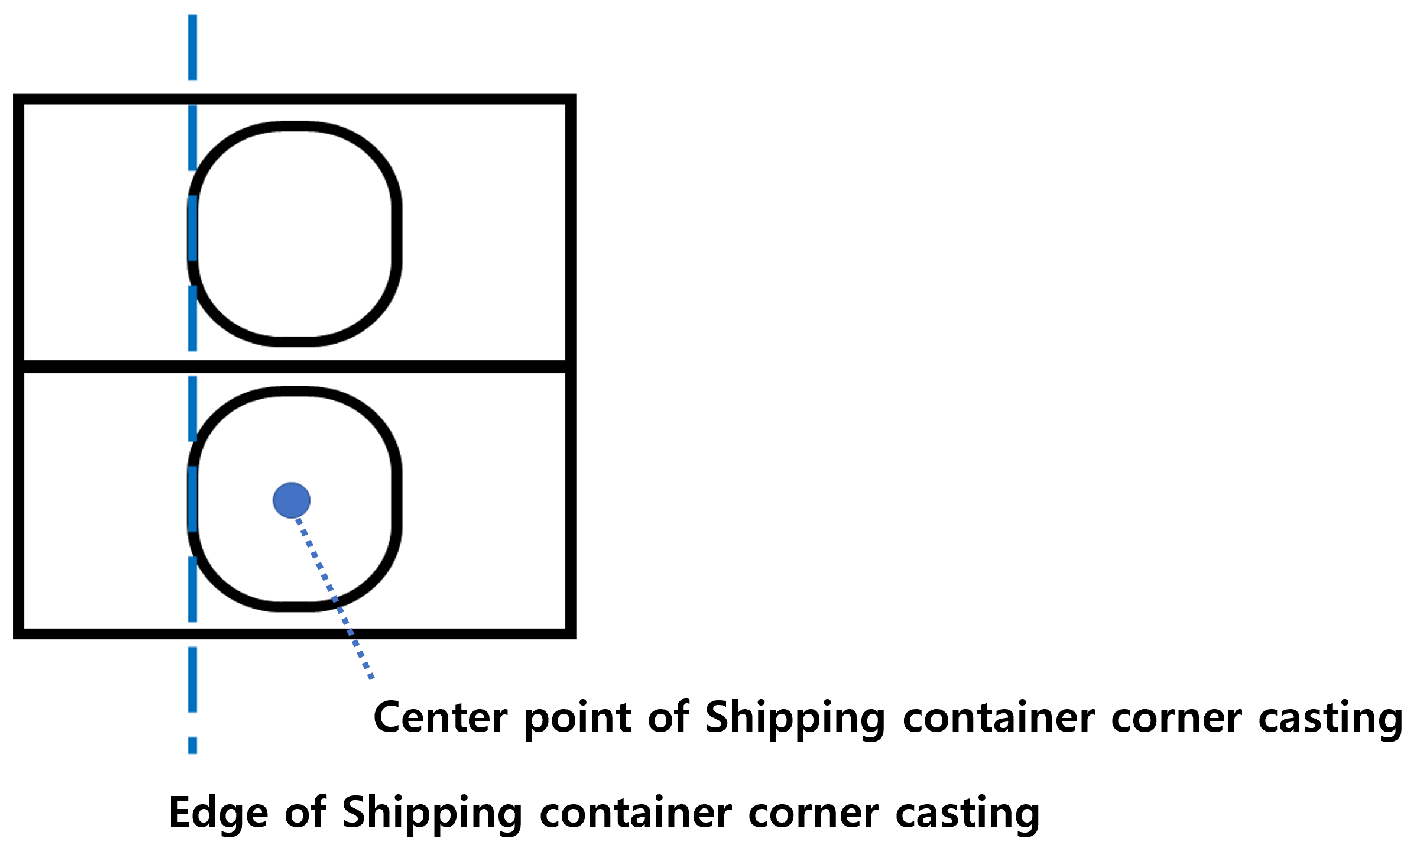
In this paper, the safety classification criteria of the container alignment status are classified into three safety levels (safe, caution, and danger) based on the degree of error in the upper and lower shipping container corner castings. For Europe, the degree of error is defined for an error range of up to 25∼35 mm [30]. Therefore, considering the international standard regulation for shipping container corner casting, ISO 1161 [31], and the shipping container alignment status in the port, we defined the three safety levels as follows. As shown in Figure 4, to estimate the degree of error, we used the edge of the lower shipping container corner casting as the baseline. And the degree of error was determined using the difference between the edge of the upper shipping container corner casting and the edge of the lower shipping container corner casting.
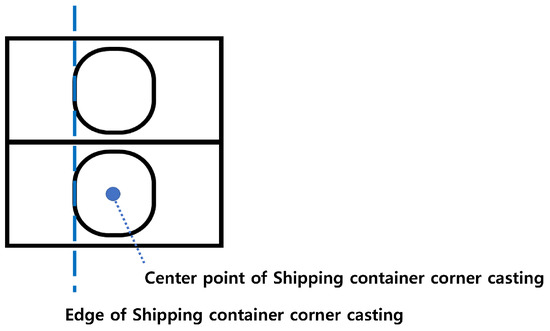
Figure 4.
Baseline for the estimation of the safety level.
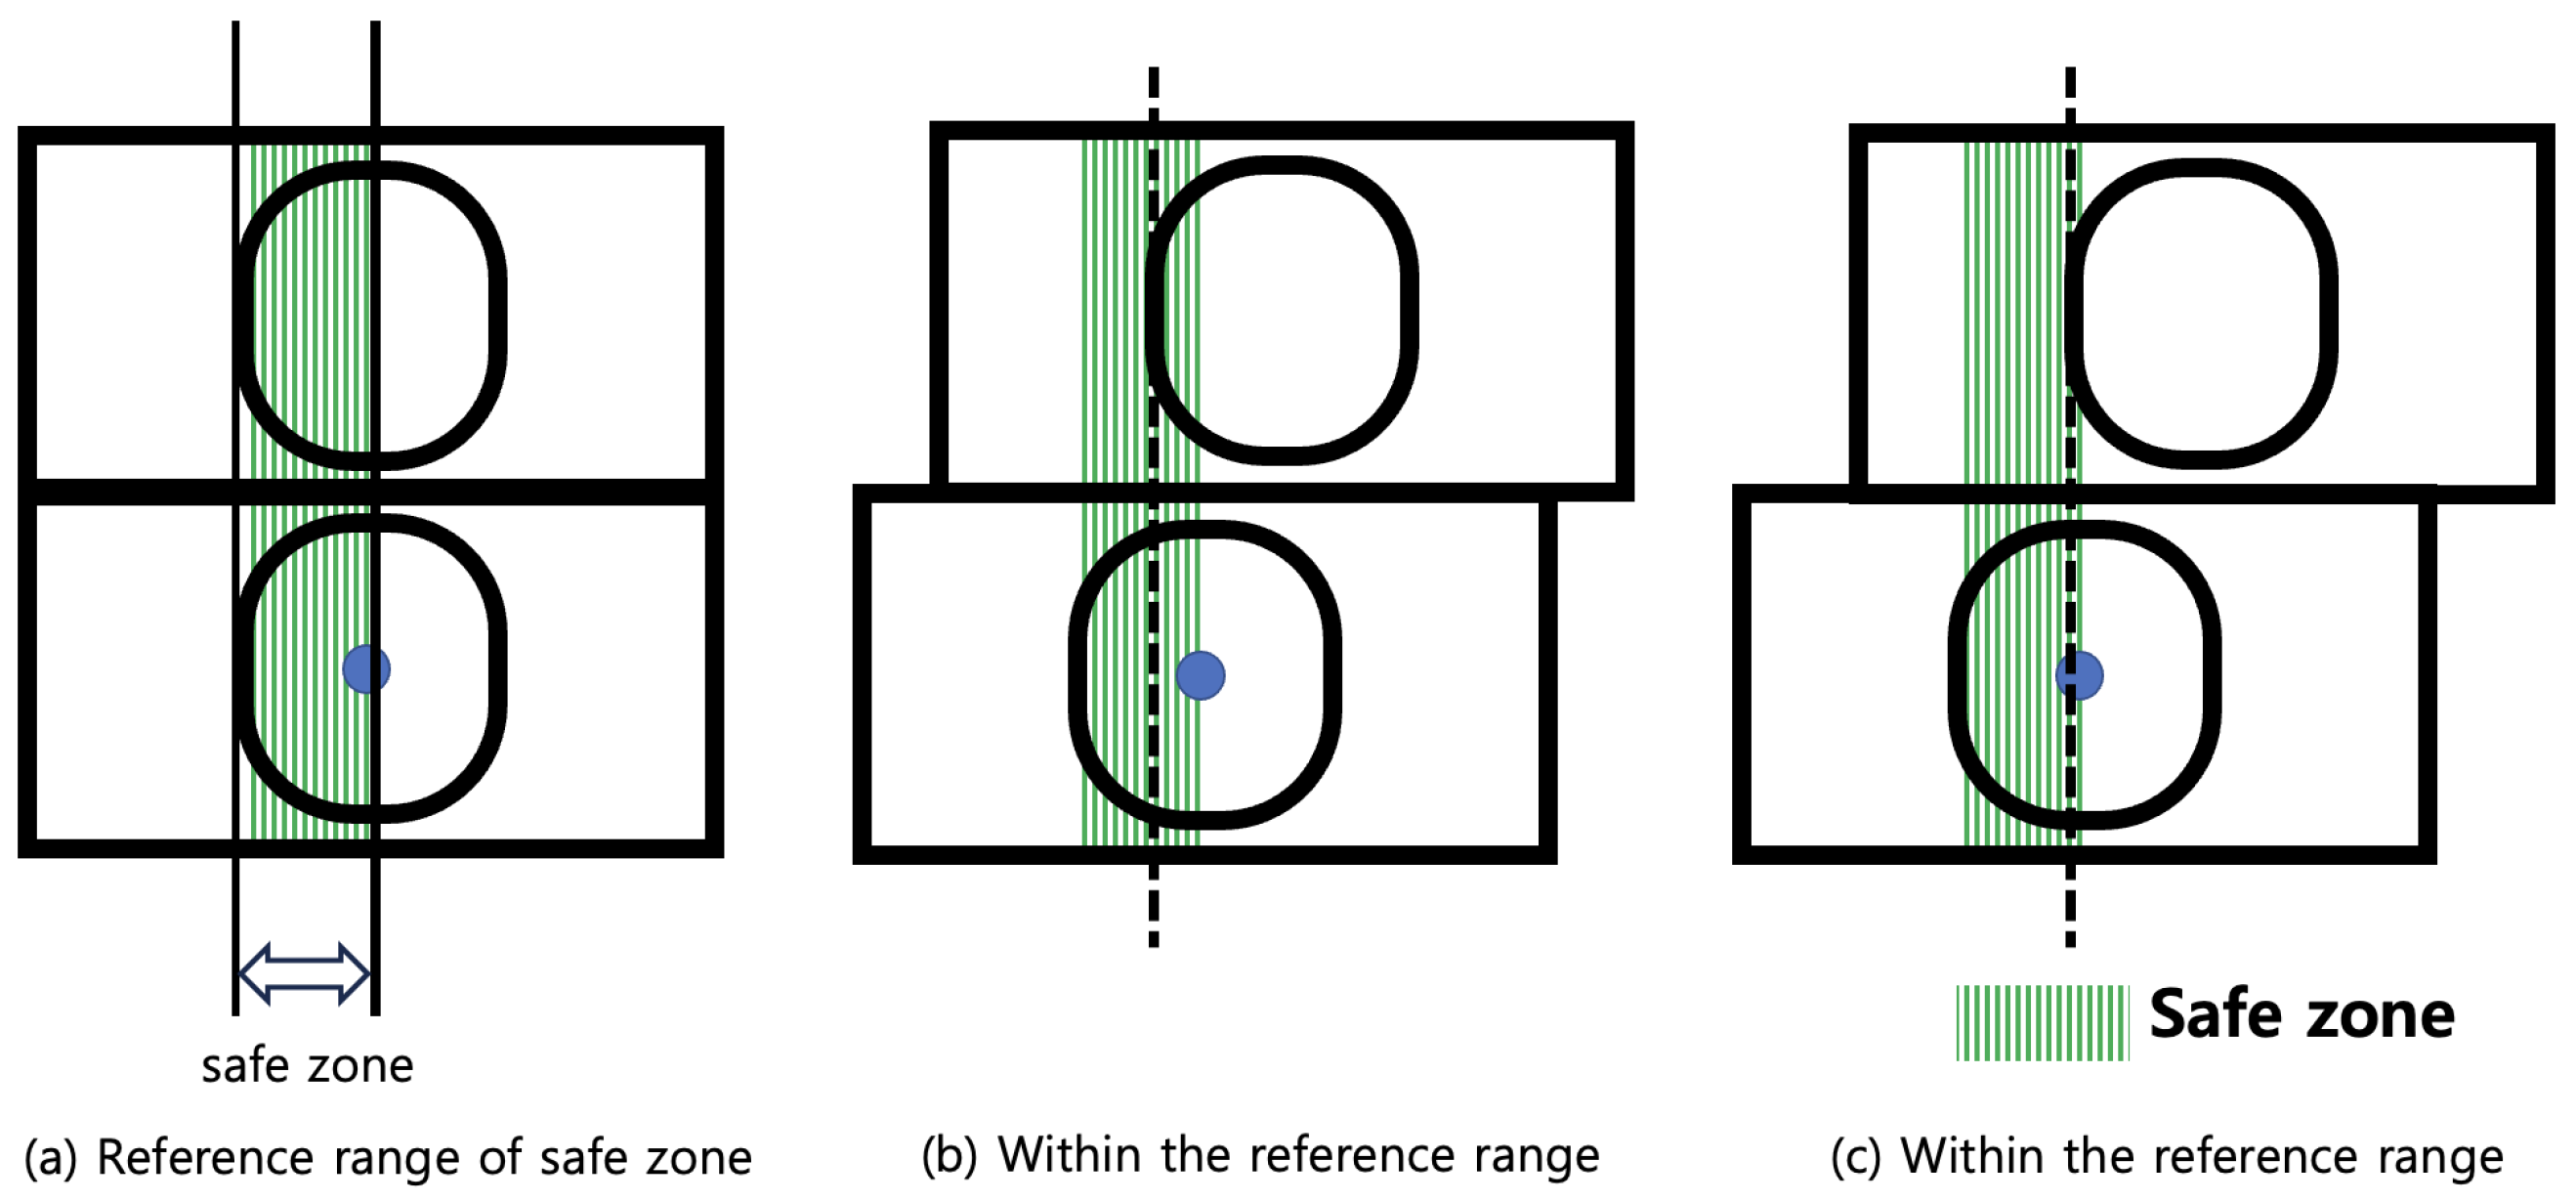
Firstly, the classification criteria for a safe class of the shipping container alignment status are as follows. Figure 5 shows the safe zone defined for the classification of a safe class. According to ISO 1161, when the difference between the left edge of the upper shipping container corner casting and the left edge of the lower shipping container corner casting is from 0 mm to 25.4 mm, the shipping container alignment status is declared to be safe. Considering the above criteria, we define that the safe zone is set as the zone between the left edge and the center of the lower shipping container corner casting. Therefore, the left edge of the upper shipping container corner casting is included in the zone of the classification criteria as a safe class. Figure 5 shows the example of the shipping container alignment status being classified as the safe class.
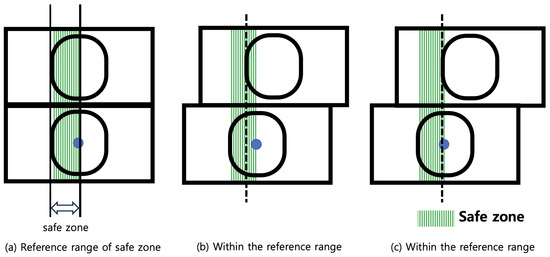
Figure 5.
Safe zone defined for the classification as the safe class and the related example.
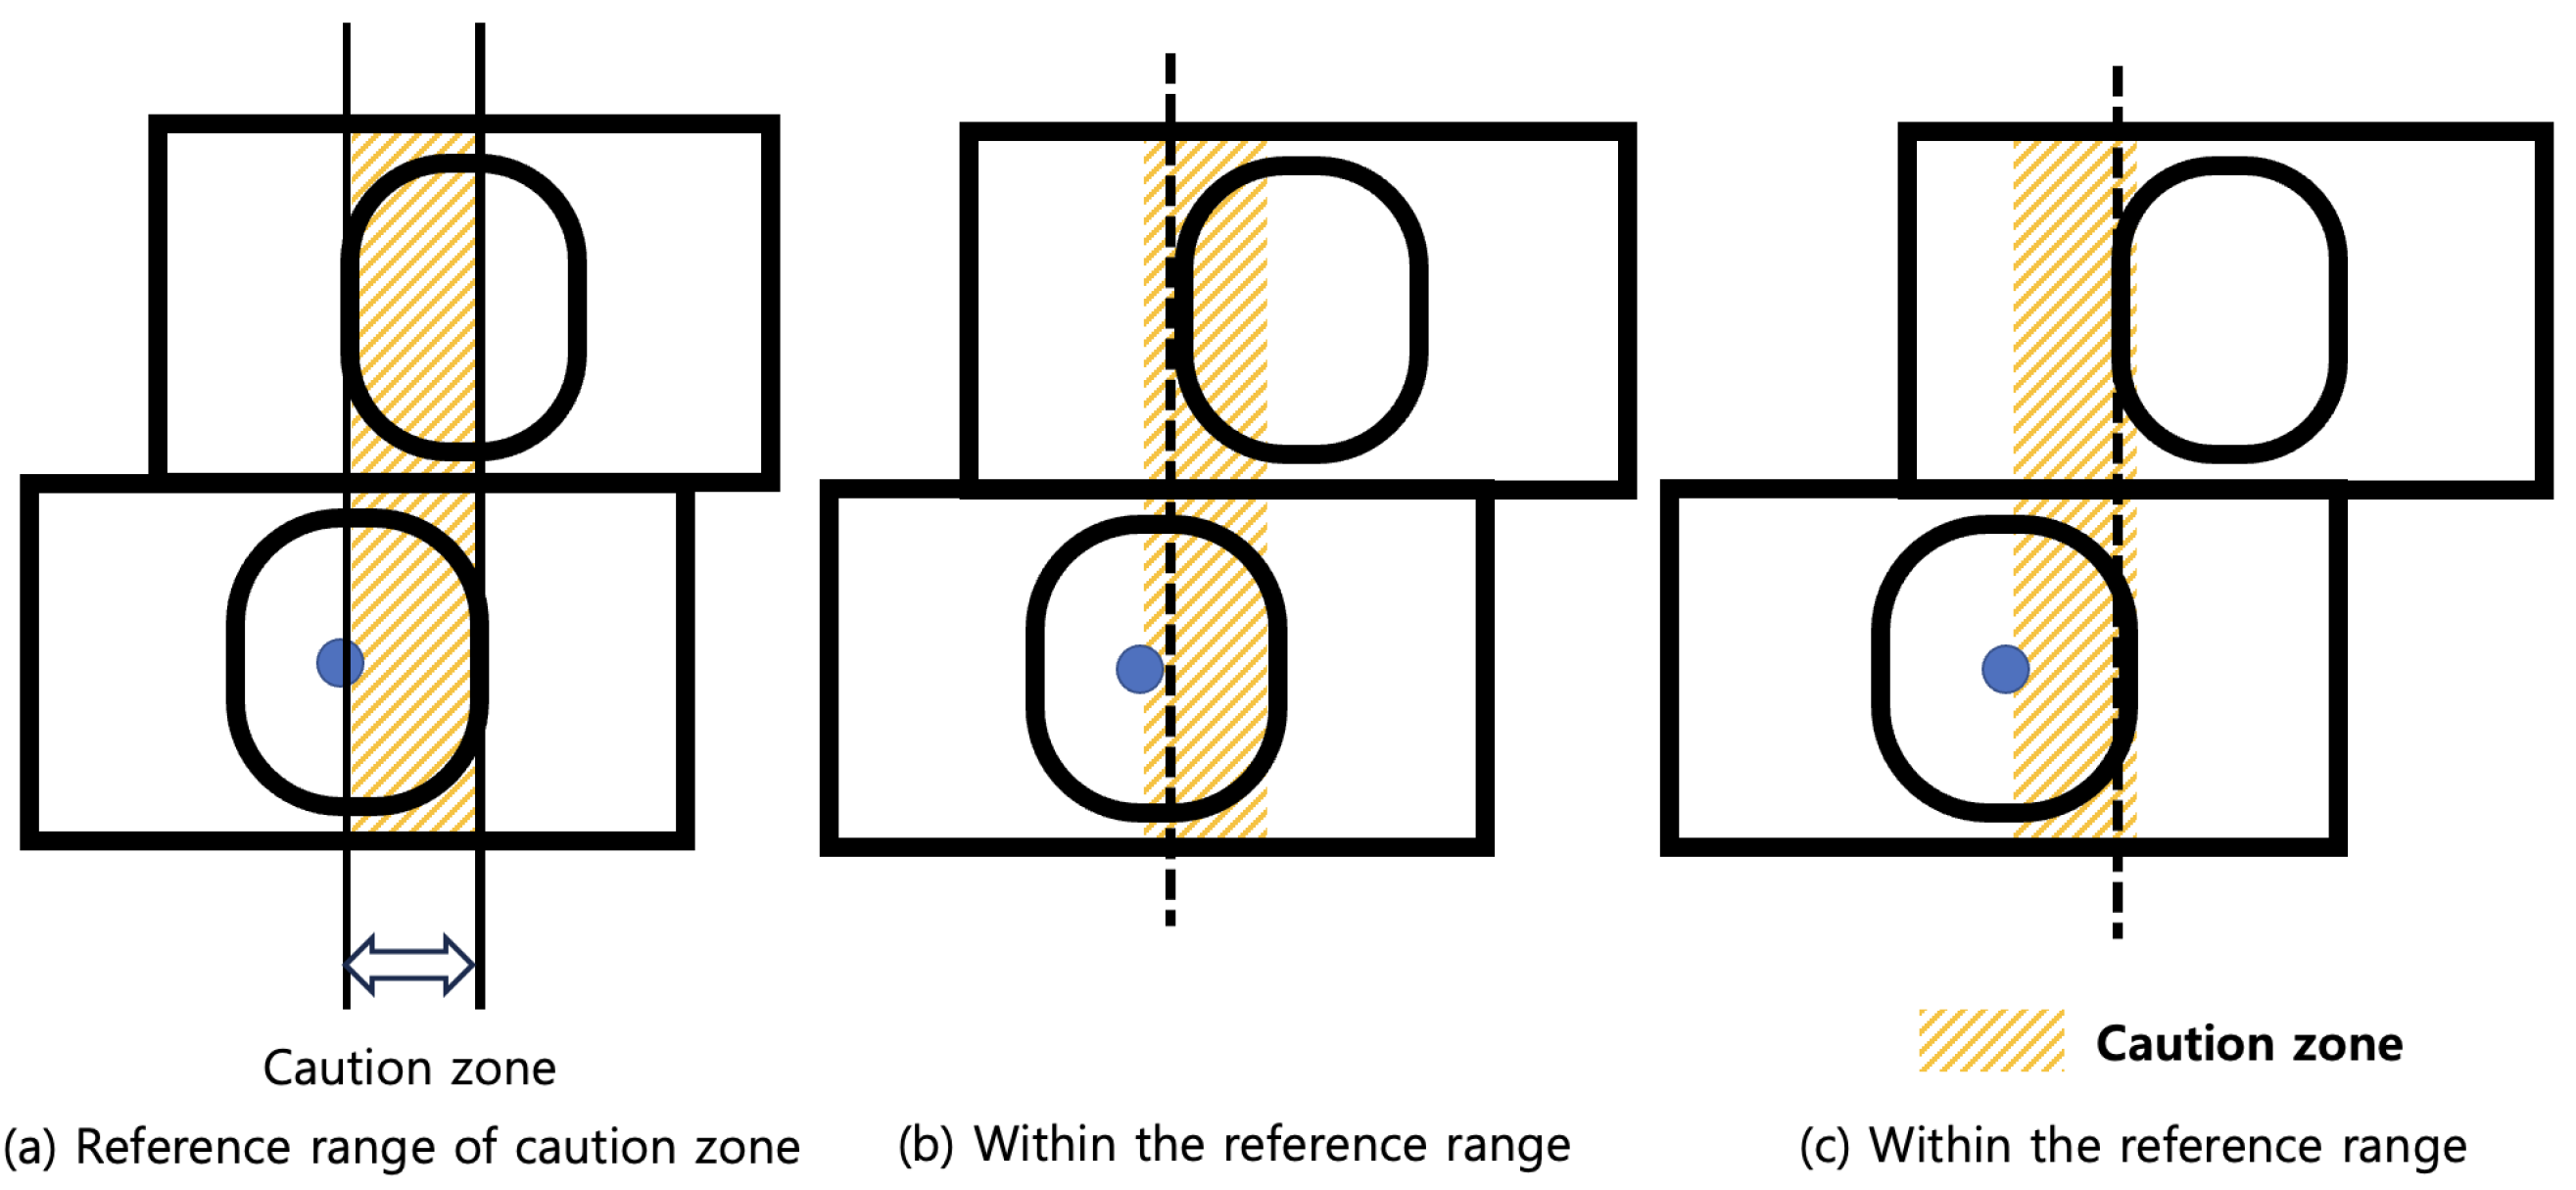
Secondly, Figure 6 shows the classification criteria and an example of the caution class. According to ISO 1161, when the difference between the left edge of the upper shipping container corner casting and the left edge of the lower shipping container corner casting is between 25.5 mm and 51 mm, the shipping container alignment status is declared as caution. Considering the above criteria, we define that the caution zone is set as the zone between the center and the right edge of the lower shipping container corner casting. Therefore, the left edge of the upper shipping container corner casting is included in the zone of the classification criteria as the caution class. Figure 6 shows an example of the shipping container alignment status being classified as the caution class.
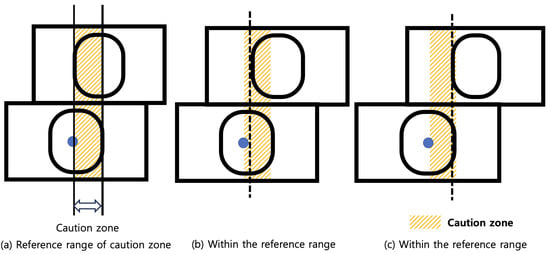
Figure 6.
Caution zone defined for classification as the caution class and a related example.
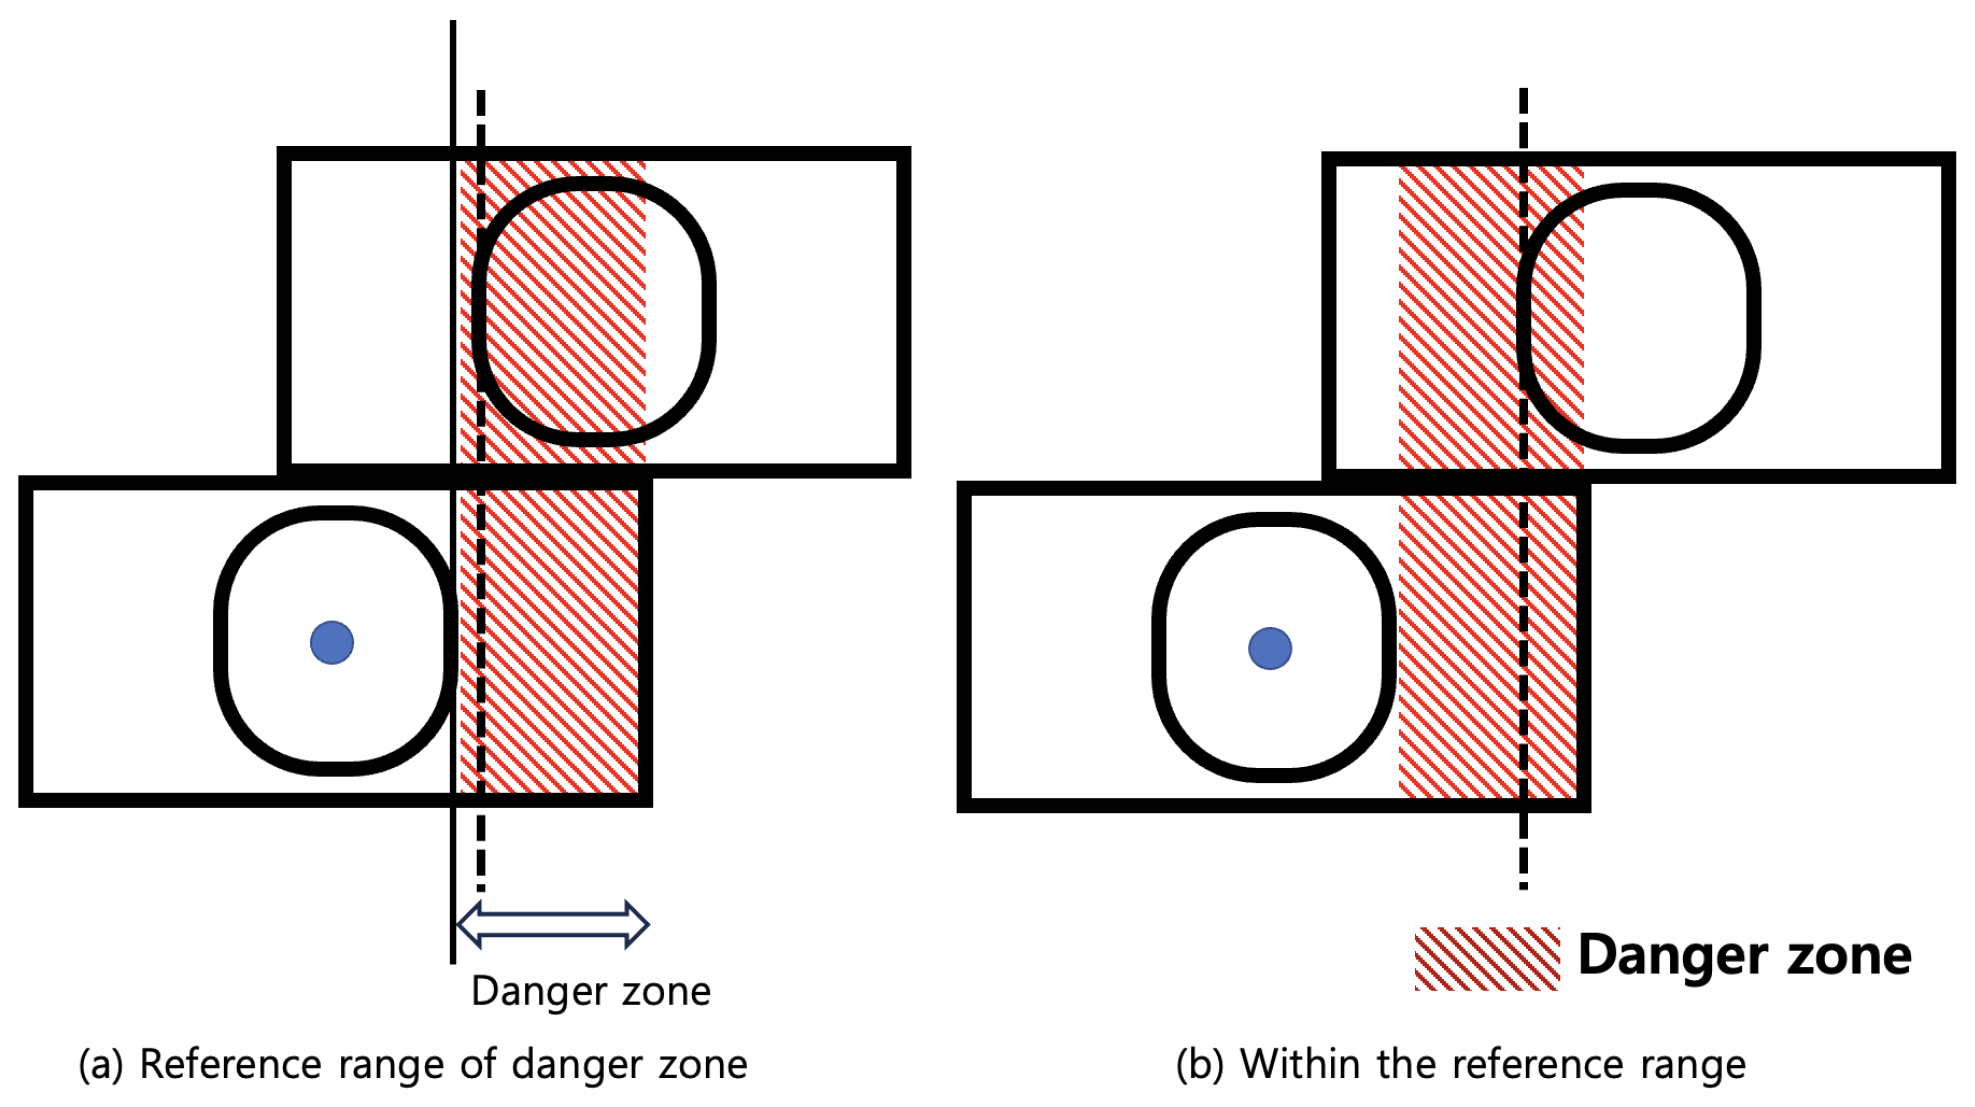
Finally, the classification criteria of the danger class is shown in Figure 7. According to ISO 1161, the difference between the left edge of the upper shipping container corner casting and the left edge of the lower shipping container corner casting must be more than 52 mm. Therefore, as shown in Figure 7, the zone of the danger class is set as the right side of the right edge of the lower shipping container. If the left edge of the upper shipping container corner casting is located in the zone of the classification criteria for the danger class, then it is classified as the danger class.

Figure 7.
Danger zone defined for classification as the danger class and a related example.
3.4. Transmission Message and Dashboard in Operation and Management
This subchapter defines the method and message structure for transmitting the results of container accident risk classification. The communication between the edge server, which is an AI-based safety evaluation system, and the operation and management server and DB server uses the HTTP protocol based on TCP/IP communication. In addition, the edge server transmits the inference results in the message, and the communication method is set to send the message after establishing a connection with the server. Figure 8 shows the basic message structure. The message consists of a message-length field that allows us to input the length information of the message content field and a message content field that allows us to input the risk assessment results and images used in the assessment. In addition, as shown in Figure 8, the risk assessment result generated by the AI-based inference model is sent by inputting the binary information and the length value of the JSON file into the text area field as well as the length information of the image area field and the image value to be stored in the image area field into the image area field.
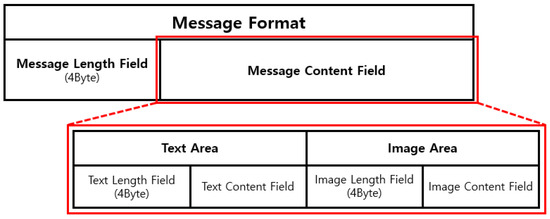
Figure 8.
Message structure.
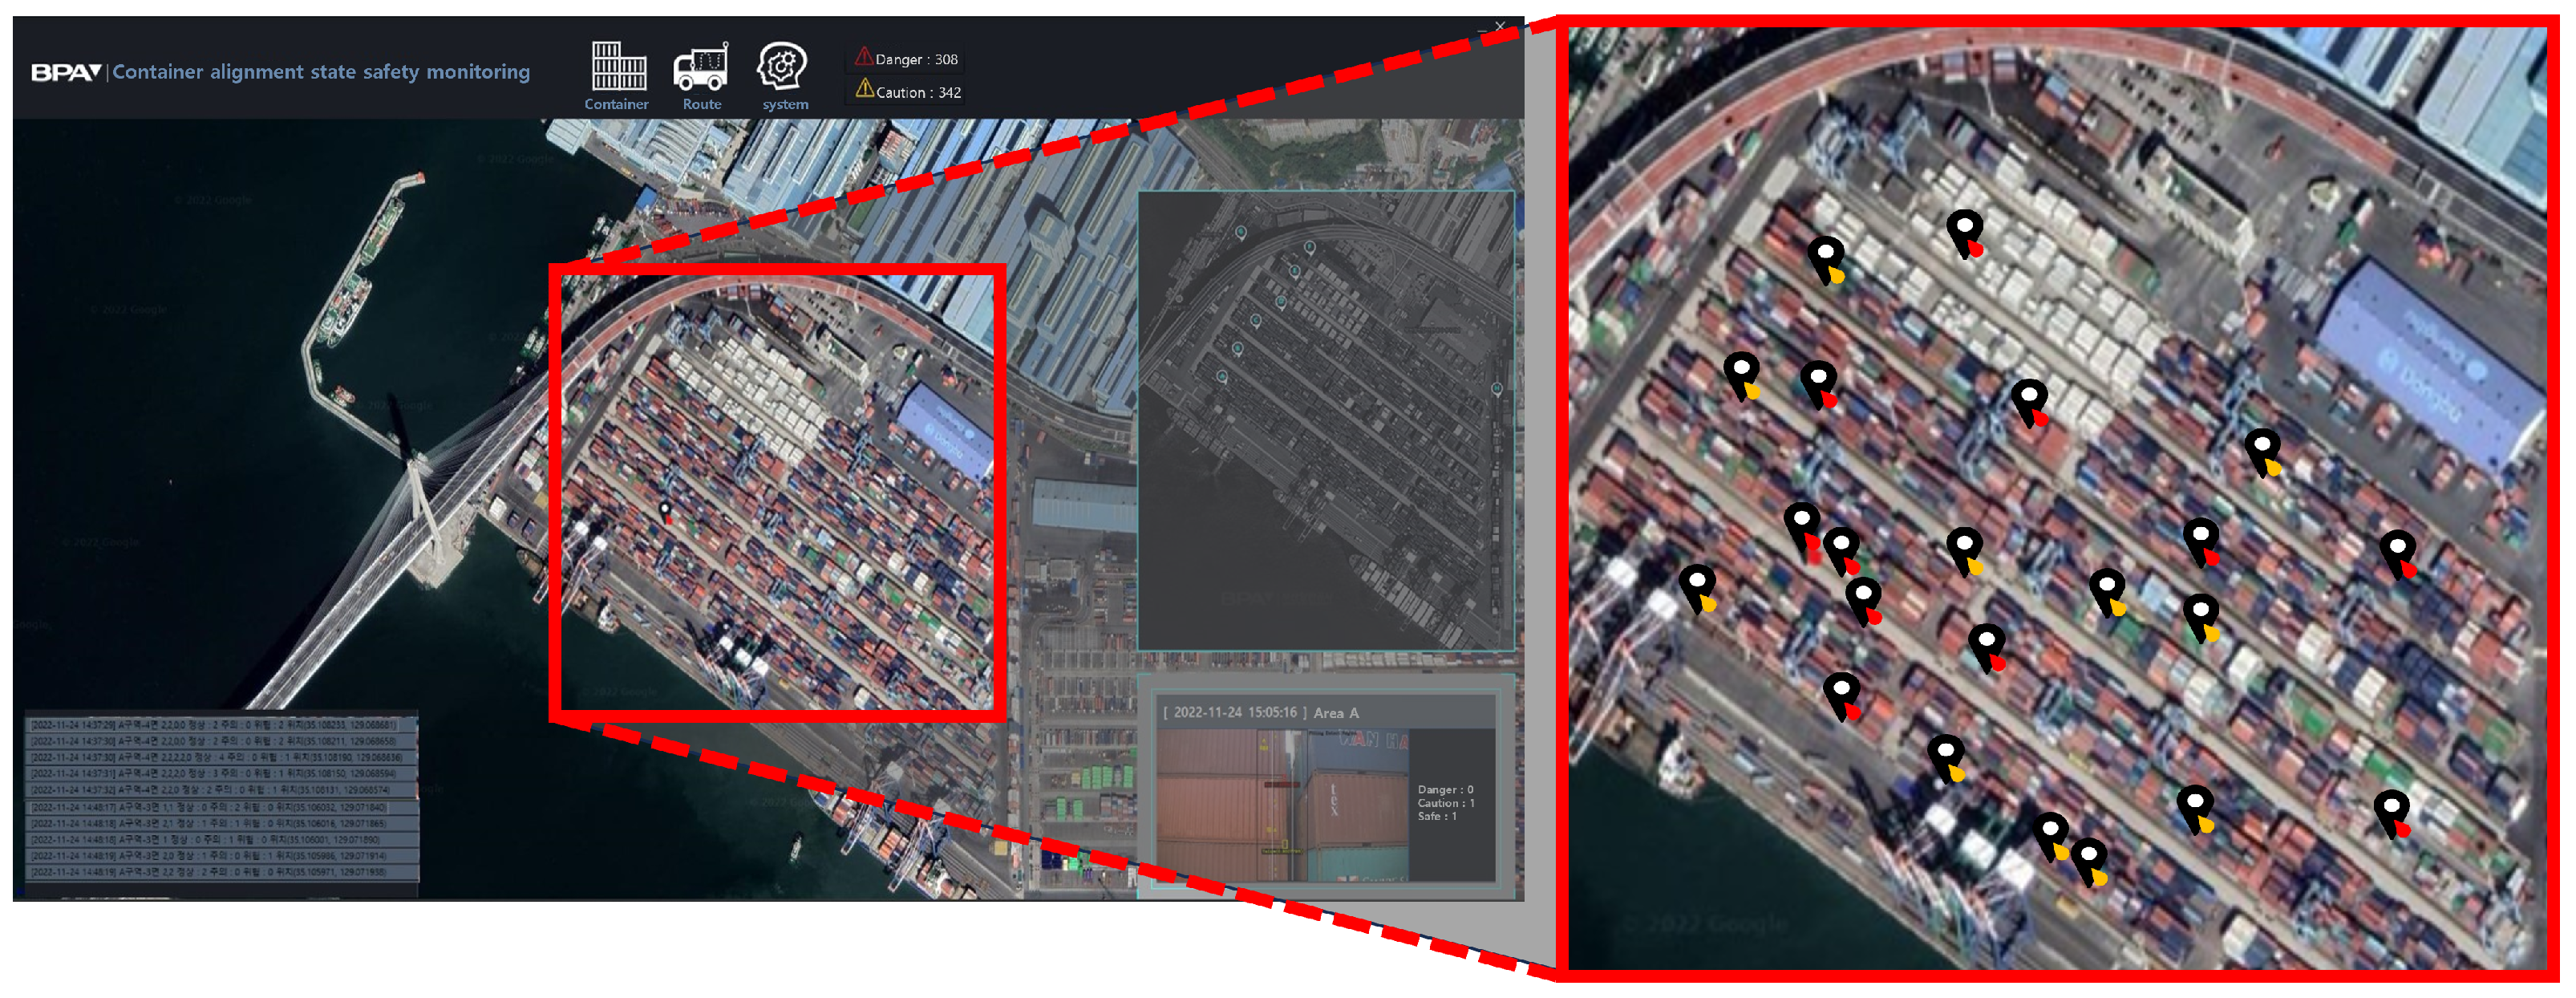
Figure 9 shows the dashboard in the operation and management server of the RSCAIES. The operation and management server displays dangerous areas and safe areas based on the risk assessment results and location information inferred and transmitted by the edge server at the location of the containers in the port, and it utilizes the results to prevent container accidents.

Figure 9.
Dashboard screen.
4. Experimental Evaluation
4.1. Dataset
In this paper, to train the inference model and evaluate its performance, we acquired a shipping container alignment state dataset through the mobile video surveillance system at the container terminal near Busan, Republic of Korea, considering the target scenarios related to shipping container accidents. A total of 79,423 images 1290 × 1080 in size, with an average of 6 holes per image, were used for the training set, the validation set, and the test sets. The simple images from the dataset are shown in Figure 10. We used LabelImg software (HumanSignal. 2018. LabelImg(version 1.8.1). San Francisco) to label all the images with the corner casting of container and convert the label information into a standard format for the YOLOv4 training.
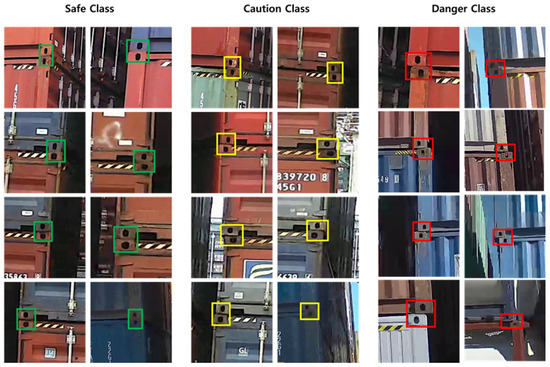
Figure 10.
Sample images and labels.
The acquired total images consisted of a safe class, a caution class, and a danger class, and there were several classes in one image with each class, with a ratio of 5.2:2.7:2.1, as shown in Table 4. The dataset was divided into a 70:15:15 ratio of the training set, validation set, and test set, as shown in Table 5.
Table 4.
Each class distribution.
Table 5.
Dataset distribution.
4.2. Evaluation Indicators and Inference Models
To properly evaluate the proposed inference model, we used the following three evaluation indicators (EIs): object detection accuracy, classification accuracy, and inference time. Each performance indicator used the metrics addressed in Table 6.
Table 6.
Method of estimating each evaluation indicator (EI).
The accuracy of the object detection is the ratio of correctly classified traffic flow samples to the total number of samples, which is represented by the following equation:
Here, we list four common variables. The binary confusion matrix is shown in Table 7. The coordinate axes represent two properties of the label: ‘True’ and ‘False’. If both the actual and predicted labels are ‘True’, then we call this case true positive (). If both the actual and predicted labels are ‘False’, then we call it true negative (). False negative () is when the actual label is ‘True’ and the predicted label is ‘False’. False positive () is the opposite.
Table 7.
Confusion matrix in the example of the safe class.
Next, to evaluate the classification accuracy, we estimated the precision, recall, and F1 score. Precision is a measure of the ratio of positive, correctly predicted classes to the total number of positive classification predictions, depicted as in the following equation:
Recall measures the ratio of the actual positive, correctly predicted traffic classes as in the following equation:
The measures the average of precision and recall as in the following equation:
Finally, to evaluate the inference time as the time cost of the inference model, we measured the frames per second (FPS) through the real embedded device (NVIDIA Jetson AGX Xavier(Nvidia. 2021. jetpack (version 4.6.4). Ubuntu. Nvidia)) used as the edge device for the proposed real-time shipping container accident inference system. To implement the inference model in order to classify the alignment status of shipping containers and then infer a container accident, we used YOLOv3, YOLOv4, and YOLOv7 as the learning algorithms. The total inference models consisted of six models: YOLOv3 with 416 pixels, YOLOv3 with 640 pixels, YOLOv4 with 416 pixels, YOLOv4 with 640 pixels, YOLOv7 with 416 pixels, and YOLOv7 with 640 pixels. The hyperparameters used to train each model are listed in Table 8.
Table 8.
Input parameter applied to each model for the learning algorithm.
4.3. Evaluation Results
In this subsection, we evaluate the performance of the proposed inference models combined with the YOLOv3, YOLOv4, and YOLOv7 algorithms, which can classify the alignment status of shipping containers and infer container accidents. We also compare six models: YOLOv3 with 416 pixels (Model_1), YOLOv3 with 640 pixels (Model_2), YOLOv4 with 416 pixels (Model_3), YOLOv4 with 640 pixels (Model_4), YOLOv7 with 416 pixels (Model_5), and YOLOv7 with 640 pixels (Model_6). Firstly, to evaluate the object detection accuracy, we used Equation (1), and the results of these experiments are presented in Table 9. The results demonstrate that the models with an image resolution value of 640 × 640 × 3 achieved better accuracy than the models with an image resolution value of 416 × 416 × 3. The average accuracy of Model_4 reached 92.5%, showing high accuracy compared with the other models.
Table 9.
Object detection accuracy of each model.
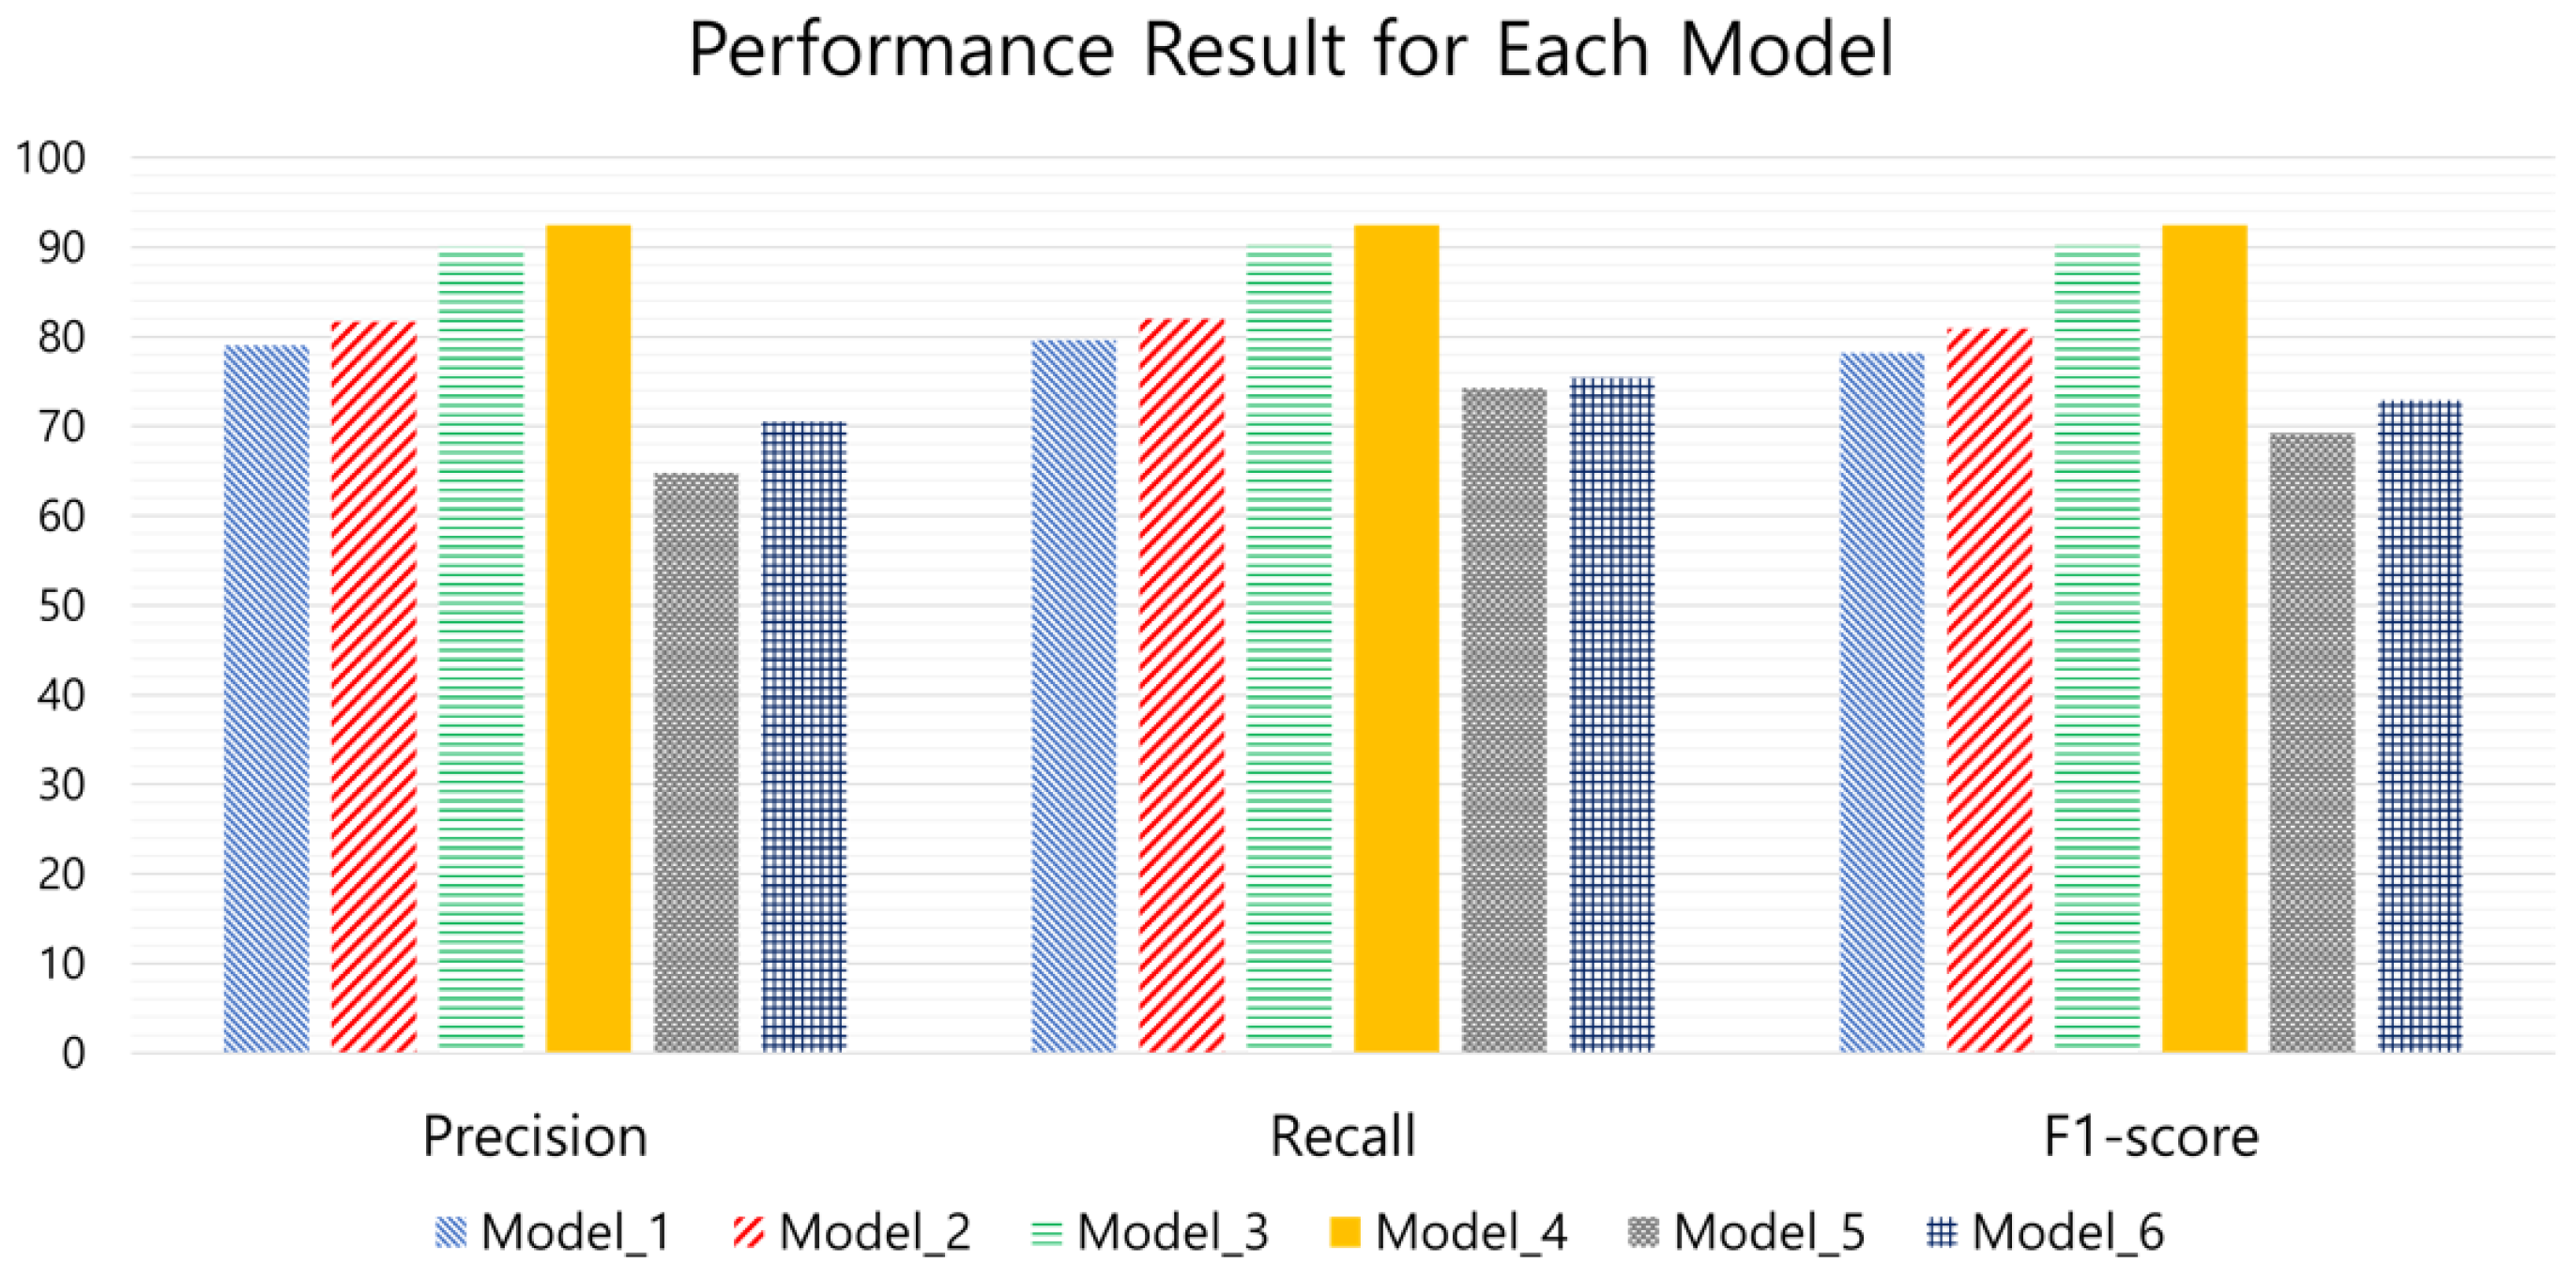
The results for the F1 score, precision, and recall for each inference model (IoU = 0.5) are shown in Figure 11 and Table 10. As shown in the results, for precision, model_4 performed better than the other models with a score of 92.5%. model_6 achieved a score of 70.5%, model_5 achieved a score of 64.8%, model_3 achieved a score of 90.1%, model_2 achieved a score of 81.7%, and model_1 achieved a score of 79.0%. For recall, model_4’s best score was 92.5%, while model_6 achieved a score of 75.4%, model_5 achieved a score of 74.3%, model_3 achieved a score of 90.2%, model_2 achieved a score of 81.7%, and model_1 achieved a score of 79.0%. For the F1 score, model_4 performed better than the other models, with a score of 92.5%; model_6 achieved a score of 72.9%; model_5 achieved a score of 69.2%; model_3 achieved a score of 90.2%; model_2 achieved a score of 80.9%; and model_1 achieved a score of 78.2%. Based on these results, it is clear that model_4 outperformed the other models in all the performance metrics calculated and that the YOLOv7-based models were unable to recognize small objects efficiently. Table 11 shows the mean scores for precision, recall, and F1 score performance, with an IoU range from 0.5 to 0.9.

Figure 11.
Precision, recall, and F1 score performance of each model.
Table 10.
Precision, recall, and F1 score performance of each model (IoU = 0.5).
Table 11.
Average precision, average recall, and average F1 score performance of each model (IoU = 0.5∼0.9).
The precision, recall, and F1 score for each class of each model are shown in Table 12, Table 13, Table 14, Table 15, Table 16 and Table 17. The precision, recall, and F1 score per traffic class using model_1 are listed in Table 12. The results demonstrate that the caution class had the lowest measurements among the class labels, with a precision of 0.74, recall of 0.46, and F1 score of 0.57. Thus, the amount of sample data affected the classification performance, because the caution class had fewer samples than the other classes. The results also reveal that the safe class achieved the best classification performance of all models. We also see that model_4 had the best overall performance for all classifications.
Table 12.
Classification performance of model_1.
Table 13.
Classification performance of model_2.
Table 14.
Classification performance of model_3.
Table 15.
Classification performance of model_4.
Table 16.
Classification performance of model_5.
Table 17.
Classification performance of model_6.
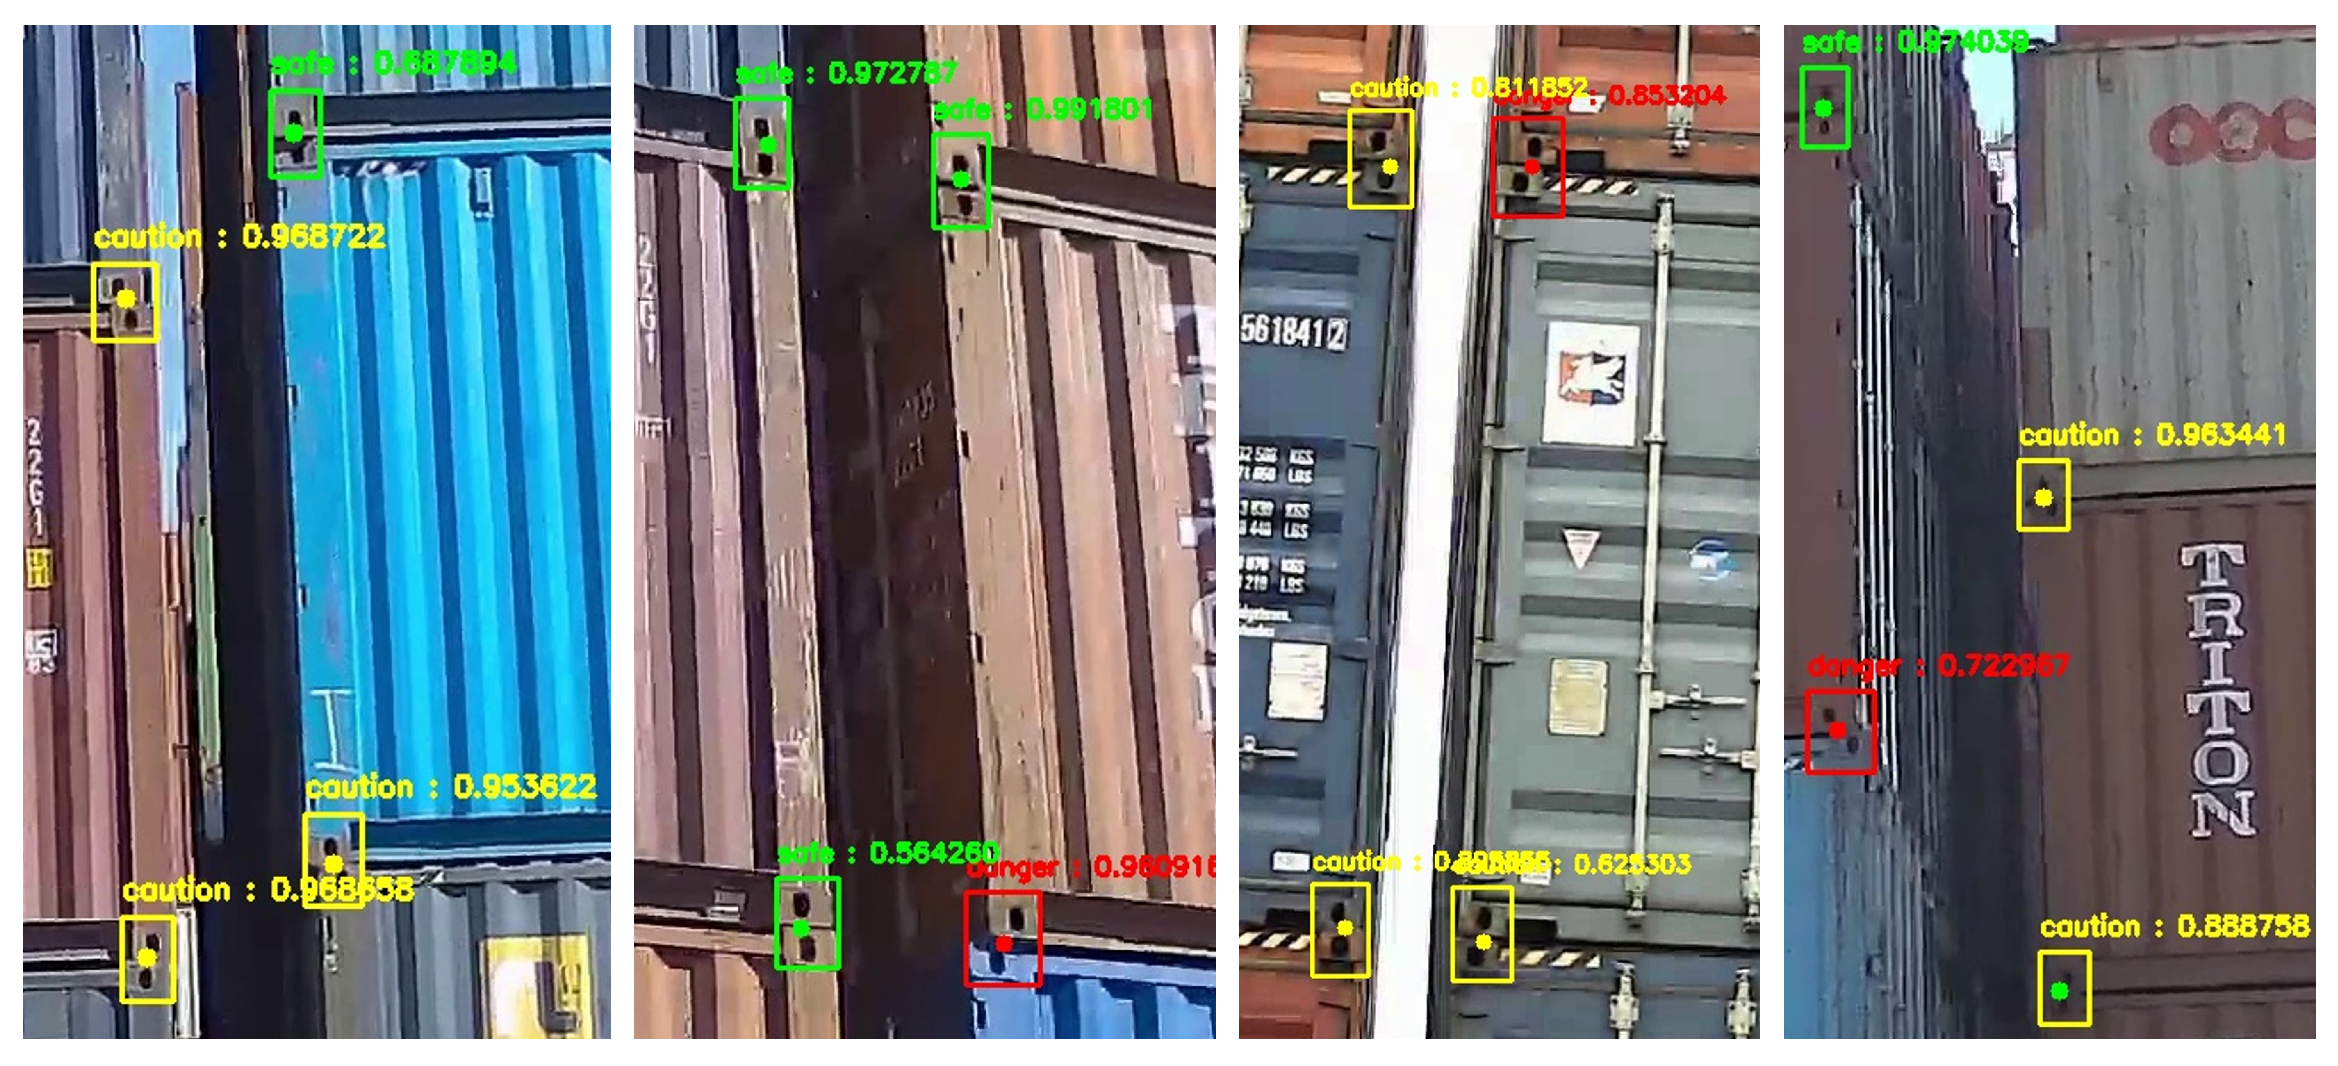
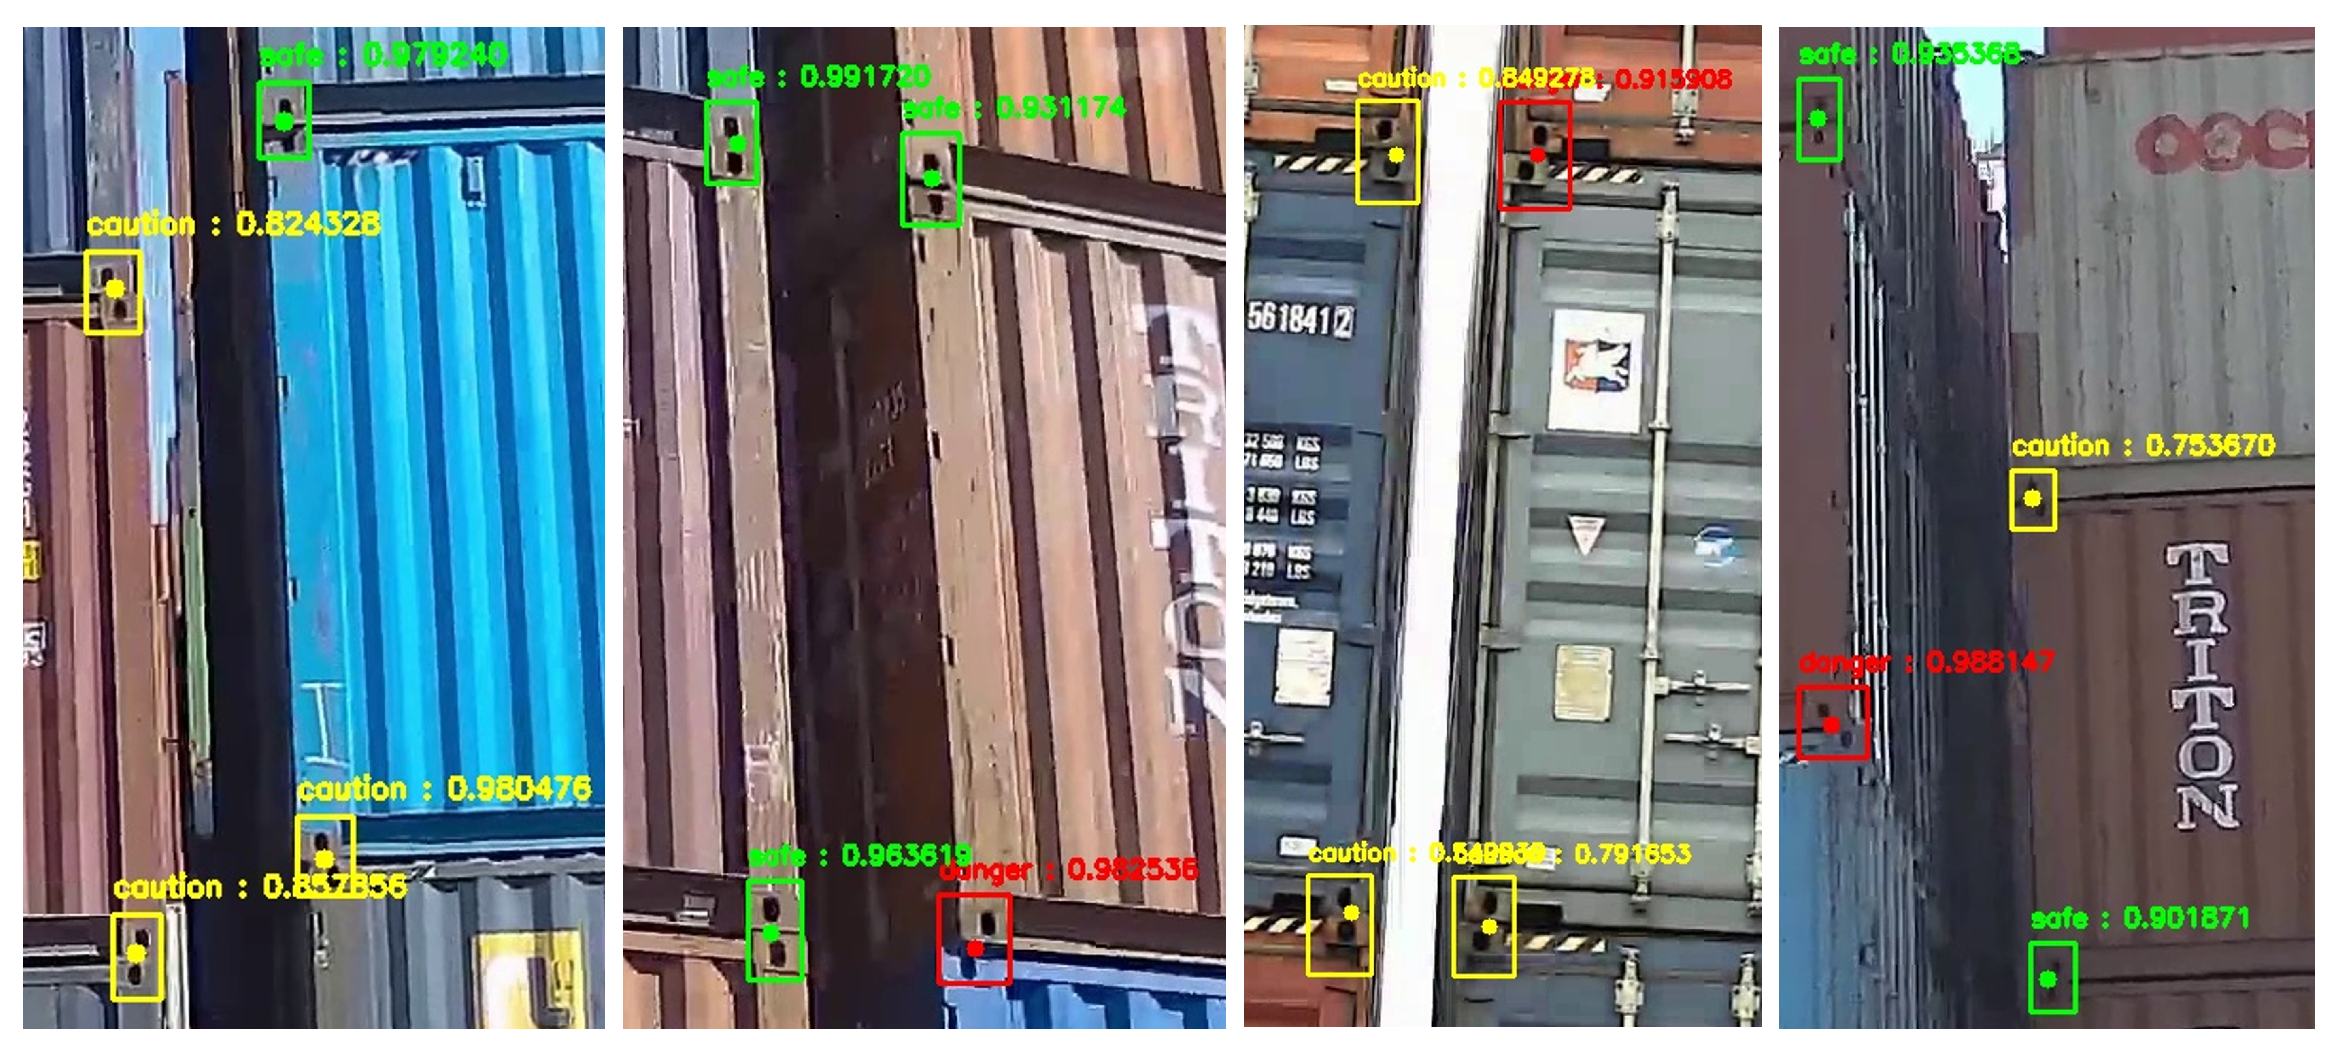
The recognition results for model_1 (Figure 12), model_2 (Figure 13), model_3 (Figure 14), and model_4 (Figure 15) are shown in Figure 12, Figure 13, Figure 14 and Figure 15. model_4 had better recognition accuracy than model_1, model_2, and model_3. In each model’s recognition result image, there are boxes and a central dot. The box is the result of detecting the corner casting in the container and classifying the safety level, and the dot shows the safety level classified by the user before learning. As shown in the figures, different algorithms of each model achieved different performance results. In particular, model_3 and model_4, which used the YOLOv4 algorithm, showed accurate safety classification for detecting the corner castings of containers. On the other hand, model_1 and model_2, which used the YOLOv3 algorithm, showed errors in safety classification. Therefore, the proposed system uses model_4 with the YOLOv4 algorithm as a candidate model for safety level estimation because it is important to accurately detect the corner casting of a container and accurately classify the accident risk.
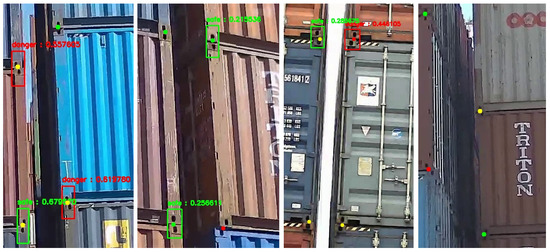
Figure 12.
Recognition results of model_1.
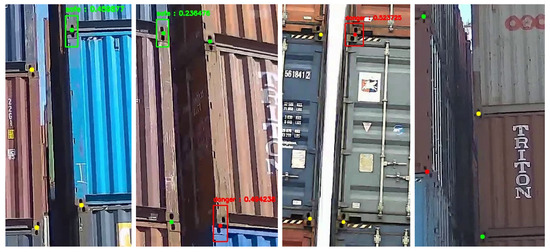
Figure 13.
Recognition results of model_2.
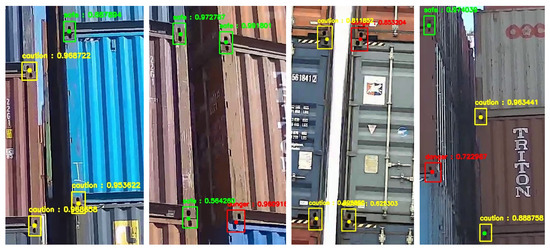
Figure 14.
Recognition results of model_3.

Figure 15.
Recognition results of model_4.
Finally, to evaluate the inference time of each model and determine the detection efficiency, we measured the frames per second (FPS) through the real embedded device (NVIDIA Jetson AGX Xavier) used as the edge device in our real-time shipping container accident inference system. Video data of 8 min 32 s were used for the test. The FPS results are shown in Table 18. The average FPS results show that the difference was more closely related to the resolution of the input image than to the learning algorithm used. Therefore, model_1 and model_3 with an input image resolution of 416 pixels achieved higher FPS results than the models with an input image resolution of 640 pixels. In addition, in terms of learning algorithms, model_1 and model_2, which used the YOLOv3 algorithm, performed better than model_3 and model_4, which used the YOLOv4 algorithm.
Table 18.
FPS of each model.
5. Conclusions
This paper describes a real-time shipping container accident inference edge system which can monitor a ship container’s loading status in real time and analyze it from a safety point of view in order to prevent accidents related to misaligned loading. In the proposed system, an inference model based on the YOLOv4 algorithm is used to realize the accurate safety classification of three types of safety levels (including safe, caution, and danger). In the performance evaluation, this inference model applied to the system showed accurate object detection and recognition performance, with 95% safe detection, 87% caution detection, and 94% danger detection. The FPS performance also obtained an evaluation value of 5.9. Numerous experiments have verified its effectiveness and performance. In future works, we plan to extend our inference model with several new methods to optimize its performance and develop a model with a fast inference speed that can handle multiple sessions. Our main focus will be on achieving higher accuracy when detecting tiny objects and recognition accuracy while reducing the inference time. In addition, we will strive to further optimize the trade-off between speed and accuracy.
Author Contributions
Conceptualization, J.Y. and Y.-U.S.; methodology, software, validation, and formal analysis, S.-W.K. and S.-Y.O.; writing—review and editing, J.Y., J.J. and S.-Y.O. All authors have read and agreed to the published version of the manuscript.
Funding
This work was supported in part by the Institute for Information and Communications Technology Planning and Evaluation (IITP) through the Korean government (Ministry of Science and ICT (MSIT)) under Grant 2020-0-00116 and the Korea Innovation Foundation (INNOPOLIS) grant funded by the Korean government (MIST) (2020-DD-UP-0281-03-210).
Institutional Review Board Statement
Not applicable.
Informed Consent Statement
Not applicable.
Data Availability Statement
Not applicable.
Conflicts of Interest
The authors declare no conflict of interest.
Abbreviations
The following abbreviations are used in this manuscript:
| AI | Artificial intelligence |
| BOF | Bag of Freebies |
| BOS | Bag of Specials |
| BS | Base station |
| CNN | Convolution neural network. |
| CSP | Cross Stage Partial |
| DPM | Deformable parts model |
| EI | Evaluation indicator |
| FPN | Feature pyramid network |
| FPS | Frames per second |
| GPS | Global positioning system |
| GPU | Graphics processing unit |
| HOG | Histogram of Oriented Gradients |
| JSON | JavaScript Object Notation |
| PAN | Path aggregtion network |
| R-CNN | Regions with Convolutional Neural Networks |
| ROI | Region of interest |
| RPN | Region proposal network |
| RSCAIES | Real-Time Shipping Container Accident Inference Edge System |
| SPP | Spatial pyramid pooling |
| SVM | Support vector machine |
| YOLO | You only look once |
References
- Khan, J.I.; Khan, J.; Ali, F.; Ullah, F.; Bacha, J.; Lee, S. Artificial Intelligence and Internet of Things (AI-IoT) Technologies in Response to COVID-19 Pandemic: A Systematic Review. IEEE Access 2022, 10, 62613–62660. [Google Scholar] [CrossRef]
- Esenogho, E.; Djouani, K.; Kurien, A.M. Integrating Artificial Intelligence Internet of Things and 5G for Next-Generation Smartgrid: A Survey of Trends Challenges and Prospect. IEEE Access 2022, 10, 4794–4831. [Google Scholar] [CrossRef]
- Sodhro, A.H.; Gurtov, A.; Zahid, N.; Pirbhulal, S.; Wang, L.; Rahman, M.M.U. Toward Convergence of AI and IoT for Energy-Efficient Communication in Smart Homes. IEEE Internet Things J. 2021, 8, 9664–9671. [Google Scholar] [CrossRef]
- Yang, Y.; Zhong, M.; Yao, H.; Yu, F.; Fu, X.; Postolache, O. Internet of things for smart ports: Technologies and challenges. IEEE Instrum. Meas. Mag. 2018, 21, 34–41. [Google Scholar] [CrossRef]
- Kuo, S.Y.; Huang, X.R.; Chen, L.B. Smart ports: Sustainable smart business port operation schemes based on the Artificial Intelligence of Things and blockchain technologies. IEEE Potentials 2022, 41, 32–37. [Google Scholar] [CrossRef]
- Lee, T.H. Smart port policy trend of europe and singapore and its political implications. J. Korea Port Econ. Assoc. 2020, 36, 77–90. [Google Scholar] [CrossRef]
- Durán, C.A.; Fernández-Campusano, C.A.; Carrasco, R.; Vargas, M.; Navarrete, A. Boosting the Decision-Making in Smart Ports by Using Blockchain. IEEE Access 2021, 9, 128055–128068. [Google Scholar] [CrossRef]
- Nishimura, E. Yard Arrangement Problem with the External Truck Arrival. In Proceedings of the 2021 IEEE International Conference on Industrial Engineering and Engineering Management (IEEM), Singapore, 13–16 December 2021; pp. 88–92. [Google Scholar] [CrossRef]
- Parise, G.; Parise, L.; Martirano, L.; Chavdarian, P.B.; Su, C.; Ferrante, A. Wise Port and Business Energy Management: Port Facilities, Electrical Power Distribution. IEEE Trans. Ind. Appl. 2016, 52, 18–24. [Google Scholar] [CrossRef]
- Yau, K.A.; Peng, S.; Qadir, J.; Low, Y.; Ling, M.H. Towards Smart Port Infrastructures: Enhancing Port Activities Using Information and Communications Technology. IEEE Access 2020, 8, 83387–83404. [Google Scholar] [CrossRef]
- Kim, J.H.; Kim, J.; Lee, G.; Park, J. Machine Learning-Based Models for Accident Prediction at a Korean Container Port. Sustainability 2021, 13, 9137. [Google Scholar] [CrossRef]
- Joseph, R.; Farhadi, A. Yolov3: An incremental improvement. arXiv 2018, arXiv:1804.02767. [Google Scholar]
- Bochkovskiy, A.; Wang, C.; Liao, H.M. Yolov4: Optimal speed and accuracy of object detection. arXiv 2020, arXiv:1804.02767. [Google Scholar]
- Wnag, C.; Bocjkovskiy, A.; Liao, H.M. YOLOv7: Trainable bag-of-freebies sets new state-ofthe-art for real-time object detectors. arXiv 2022, arXiv:2207.02696. [Google Scholar]
- Dalal, N.; Triggs, B. Histograms of oriented gradients for human detection. In Proceedings of the 2005 IEEE Computer Society Conference on Computer Vision and Pattern Recognition (CVPR’05), San Diego, CA, USA, 20–25 June 2005; Volume 1, pp. 886–893. [Google Scholar] [CrossRef]
- Girshick, R.; Iandola, F.; Darrell, T.; Malik, J. Deformable part models are convolutional neural networks. In Proceedings of the IEEE Conference on Computer Vision and Pattern Recognition, Boston, MA, USA, 7–12 June 2015; pp. 437–446. [Google Scholar] [CrossRef]
- Girshick, R.; Donahue, J.; Darrell, T.; Malik, J. Rich feature hierarchies for accurate object detection and semantic segmentation. In Proceedings of the IEEE Conference on Computer Vision and Pattern Recognition, Columbus, OH, USA, 23–28 June 2014; pp. 580–587. [Google Scholar] [CrossRef]
- Girshick, R. Fast R-CNN. In Proceedings of the IEEE International Conference on Computer Vision, Santiago, Chile, 7–13 December 2015; pp. 1440–1448. [Google Scholar] [CrossRef]
- Ren, S.; He, K.; Girshick, R.; Sun, J. Faster r-cnn: Towards real-time object detection with region proposal networks. IEEE Trans. Pattern Anal. Mach. Intell. 2015, 39, 1137–1149. [Google Scholar] [CrossRef] [PubMed]
- Tang, Y. Deep learning using linear support vector machines. arXiv 2013, arXiv:1306.0239. [Google Scholar]
- Chiang, C.-H.; Juang, J.-G. Application of UAVs and Image Processing for Riverbank Inspection. Machines 2023, 11, 876. [Google Scholar] [CrossRef]
- Wang, C.; Wang, C.; Wang, L.; Wang, J.; Liao, J.; Li, Y.; Lan, Y. A Lightweight Cherry Tomato Maturity Real-Time Detection Algorithm Based on Improved YOLOV5n. Agronomy 2023, 13, 2106. [Google Scholar] [CrossRef]
- Li, J.; Xie, L.; Chen, Z.; Shi, L.; Chen, R.; Ren, Y.; Wang, L.; Lu, X. An AIoT-Based Assistance System for Visually Impaired People. Electronics 2023, 12, 3760. [Google Scholar] [CrossRef]
- Xie, T.; Yao, X. Smart Logistics Warehouse Moving-Object Tracking Based on YOLOv5 and DeepSORT. Appl. Sci. 2023, 13, 9895. [Google Scholar] [CrossRef]
- Choi, J.; Chun, D.; Kim, H.; Lee, H.J. Gaussian yolov3: An accurate and fast object detector using localization uncertainty for autonomous driving. In Proceedings of the IEEE International Conference on Computer Vision, Seoul, Republic of Korea, 27 October–2 November 2019; pp. 502–511. [Google Scholar] [CrossRef]
- He, Y.; Zhu, C.; Wang, J.; Savvides, M.; Zhang, X. Bounding box regression with uncertainty for accurate object detection. In Proceedings of the IEEE International Conference on Computer Vision, Long Beach, CA, USA, 15–20 June 2019; pp. 2888–2897. [Google Scholar] [CrossRef]
- Dai, X.; Chen, Y.; Yang, J.; Zhang, P.; Yuan, L.; Zhang, L. Dynamic DETR: End-to-end object detection with dynamic attention. In Proceedings of the 2021 IEEE/CVF International Conference on Computer Vision (ICCV), Montreal, BC, Canada, 11–17 October 2021; pp. 2968–2977. [Google Scholar] [CrossRef]
- Yang, L.; Zheng, Z.; Wang, J.; Song, S.; Huang, G.; Li, F. An Adaptive Object Detection System based on Early-exit Neural Networks. IEEE Trans. Cogn. Dev. Syst. 2023, 10, 1–14. [Google Scholar] [CrossRef]
- Dai, X.; Chen, Y.; Xiao, B.; Chen, D.; Liu, M.; Yuan, L.; Zhang, L. Dynamic head: Unifying object detection heads with attentions. In Proceedings of the IEEE/CVF Conference on Computer Vision and Pattern Recognition, Nashville, TN, USA, 20–25 June 2021; pp. 7373–7382. [Google Scholar] [CrossRef]
- Stacking on Ground and Terminal Operation with Freight Containers. Available online: https://wiki.unece.org/display/TransportSustainableCTUCode/5%09Stacking+on+ground+and+terminal+operation+with+freight+containers (accessed on 14 September 2023).
- ISO Standard 1161. Available online: https://www.iso.org/standard/65553.html (accessed on 11 September 2023).


Disclaimer/Publisher’s Note: The statements, opinions and data contained in all publications are solely those of the individual author(s) and contributor(s) and not of MDPI and/or the editor(s). MDPI and/or the editor(s) disclaim responsibility for any injury to people or property resulting from any ideas, methods, instructions or products referred to in the content. |
© 2023 by the authors. Licensee MDPI, Basel, Switzerland. This article is an open access article distributed under the terms and conditions of the Creative Commons Attribution (CC BY) license (https://creativecommons.org/licenses/by/4.0/).