Article

Modeling and Optimization of Processes for Craft Beer Production: Malt Mixture Modeling and Mashing Optimization for Lager Beer Production

Department of Wine and Beer Technology, University of Food Technologies, 26 Maritza Boulevard, 4002 Plovdiv, Bulgaria
*
Author to whom correspondence should be addressed.
Appl. Sci. 2023, 13(20), 11554; https://doi.org/10.3390/app132011554
Submission received: 13 September 2023 / Revised: 4 October 2023 / Accepted: 20 October 2023 / Published: 22 October 2023

Abstract

:
Beer ranks third in terms of consumption worldwide, and its technology is constantly being improved and perfected. The boom in craft brewing has led to the production of thousands of new types of beer, but most often without scientific justification of the technological decisions made. This paper discusses the approaches to the modeling of the composition of the malt mixture and the mode of lager beer production. A special cubic simplex-lattice design with two replications was used to model the mixture with three malt types: Pilsner, Caramel Pils and Caramel Munich type 2. Models for the main brewing characteristics, i.e., wort extract and color, as well as models for the biological parameters of the mash, i.e., phenolic compound content and antioxidant potential, were developed using different methods. Multi-objective optimization was carried out and a specific mixture was developed for the production of lager beer. The influence of acidulated malt, lactic acid and CaCl2 additions on the extract yield and malt mash filtration time were established through one-factor experiments. The extract and fermentable sugar yield during individual pauses in the mashing mode was studied with a view to its optimization.

1. Introduction

Beer ranks third in the world in terms of consumption, its annual production constantly increasing. In recent years, this has been due to the so-called craft revolution, or the production of new styles and types of beer. According to the latest data, more than 3000 new beer types appear worldwide annually [1,2,3].
The craft industry produces beverages that are ready for direct consumption in a short period of time, since no biological stabilization processes (e.g., filtration or pasteurization) are carried out. This, in turn, leads to the preservation of the biological profile of the beverage [4]. The production of this type of assortment itself is most often empirical, without accurate scientific knowledge of the processes and without strict control over the technological processes [4,5]. These manufacturing flaws very often lead to the lack of reproducible organoleptic profiles [4,6].
The main raw materials for beer production are water, barley malt, hops and brewer’s yeast [7,8]. The craft industry also uses wheat malt, oats, rice, corn, rye, amaranth, quinoa and others [9,10,11,12,13,14,15,16,17,18,19], as well as a number of herbs [20,21], flowers [22] and fruits [23,24]. The craft industry is also the driving force for the use of new yeast strains, including non-Saccharomyces yeasts, due to their rich enzyme profile and the possibility of obtaining products with organoleptic profiles different from the traditional ones [25,26,27]. New types of beer also require the use of different varieties of hops that would ensure the different organoleptic profile of the finished product [28,29].
Despite the wide range of raw materials and products that can be used for beer production, lager types of beverages still dominate consumer preferences. Therefore, the efforts of craft breweries are also focused on the development of such beer types.
An interesting aspect in the brewing industry in recent years has been the provision of a certain biological value of the wort that can guarantee the functional properties of the finished beverage [30,31]. The biological value of beer ensues from a number of components: the phenolic compounds and melanoidins in malt, which have antioxidant potential, the phenolic compounds and humulones in hops, which also have an antioxidant effect, the vitamins produced by yeast cells during fermentation, etc. [20,21,24,28,30,31]. The addition of fruits, essential oils and herbs to the wort and to the beer, respectively, as well as the inclusion of new types of grain and pseudo-grain raw materials, increase the biological potential of the beverage [5,9,20,21,24,28,30,31].
In our previous work, various principles for modeling beer production processes were considered, with particular attention paid to the methods used for the modeling of malt mixtures [32]. A similar approach to malt mixture modeling was discussed in [33,34]. Modeling a mixture using mathematical–statistical methods makes it possible to evaluate the individual influence of each of its components and to apply multi-target optimization, which can have different final goals, such as extract, color, biological value, etc. [32].
The aim of the present work was to optimize the lager beer production modes for lager beer production in craft breweries. In the first part of the work, the efforts were focused on the optimization of the malt mixture and the mashing mode, in order to achieve the maximum extract yield and obtain wort with a certain biological value.

2. Materials and Methods

2.1. Raw Materials and Ingredients

Pilsner malt (P), Caramel Pils malt (CP), Caramel Munich type 2 malt (CM2) and Acidulated malt (AM), produced by BestMalz, Heidelberg, Germany, were used in the present study [35]. Analytical grade CaCl2 and lactic acid were also used.

2.2. Mixture Design and Statistical Data Processing

A randomized and enlarged special cubic simplex-lattice design with two replications was used to model the malt mixtures (augment design; Table 1).

2.3. Determination of the Main Characteristics of Wort

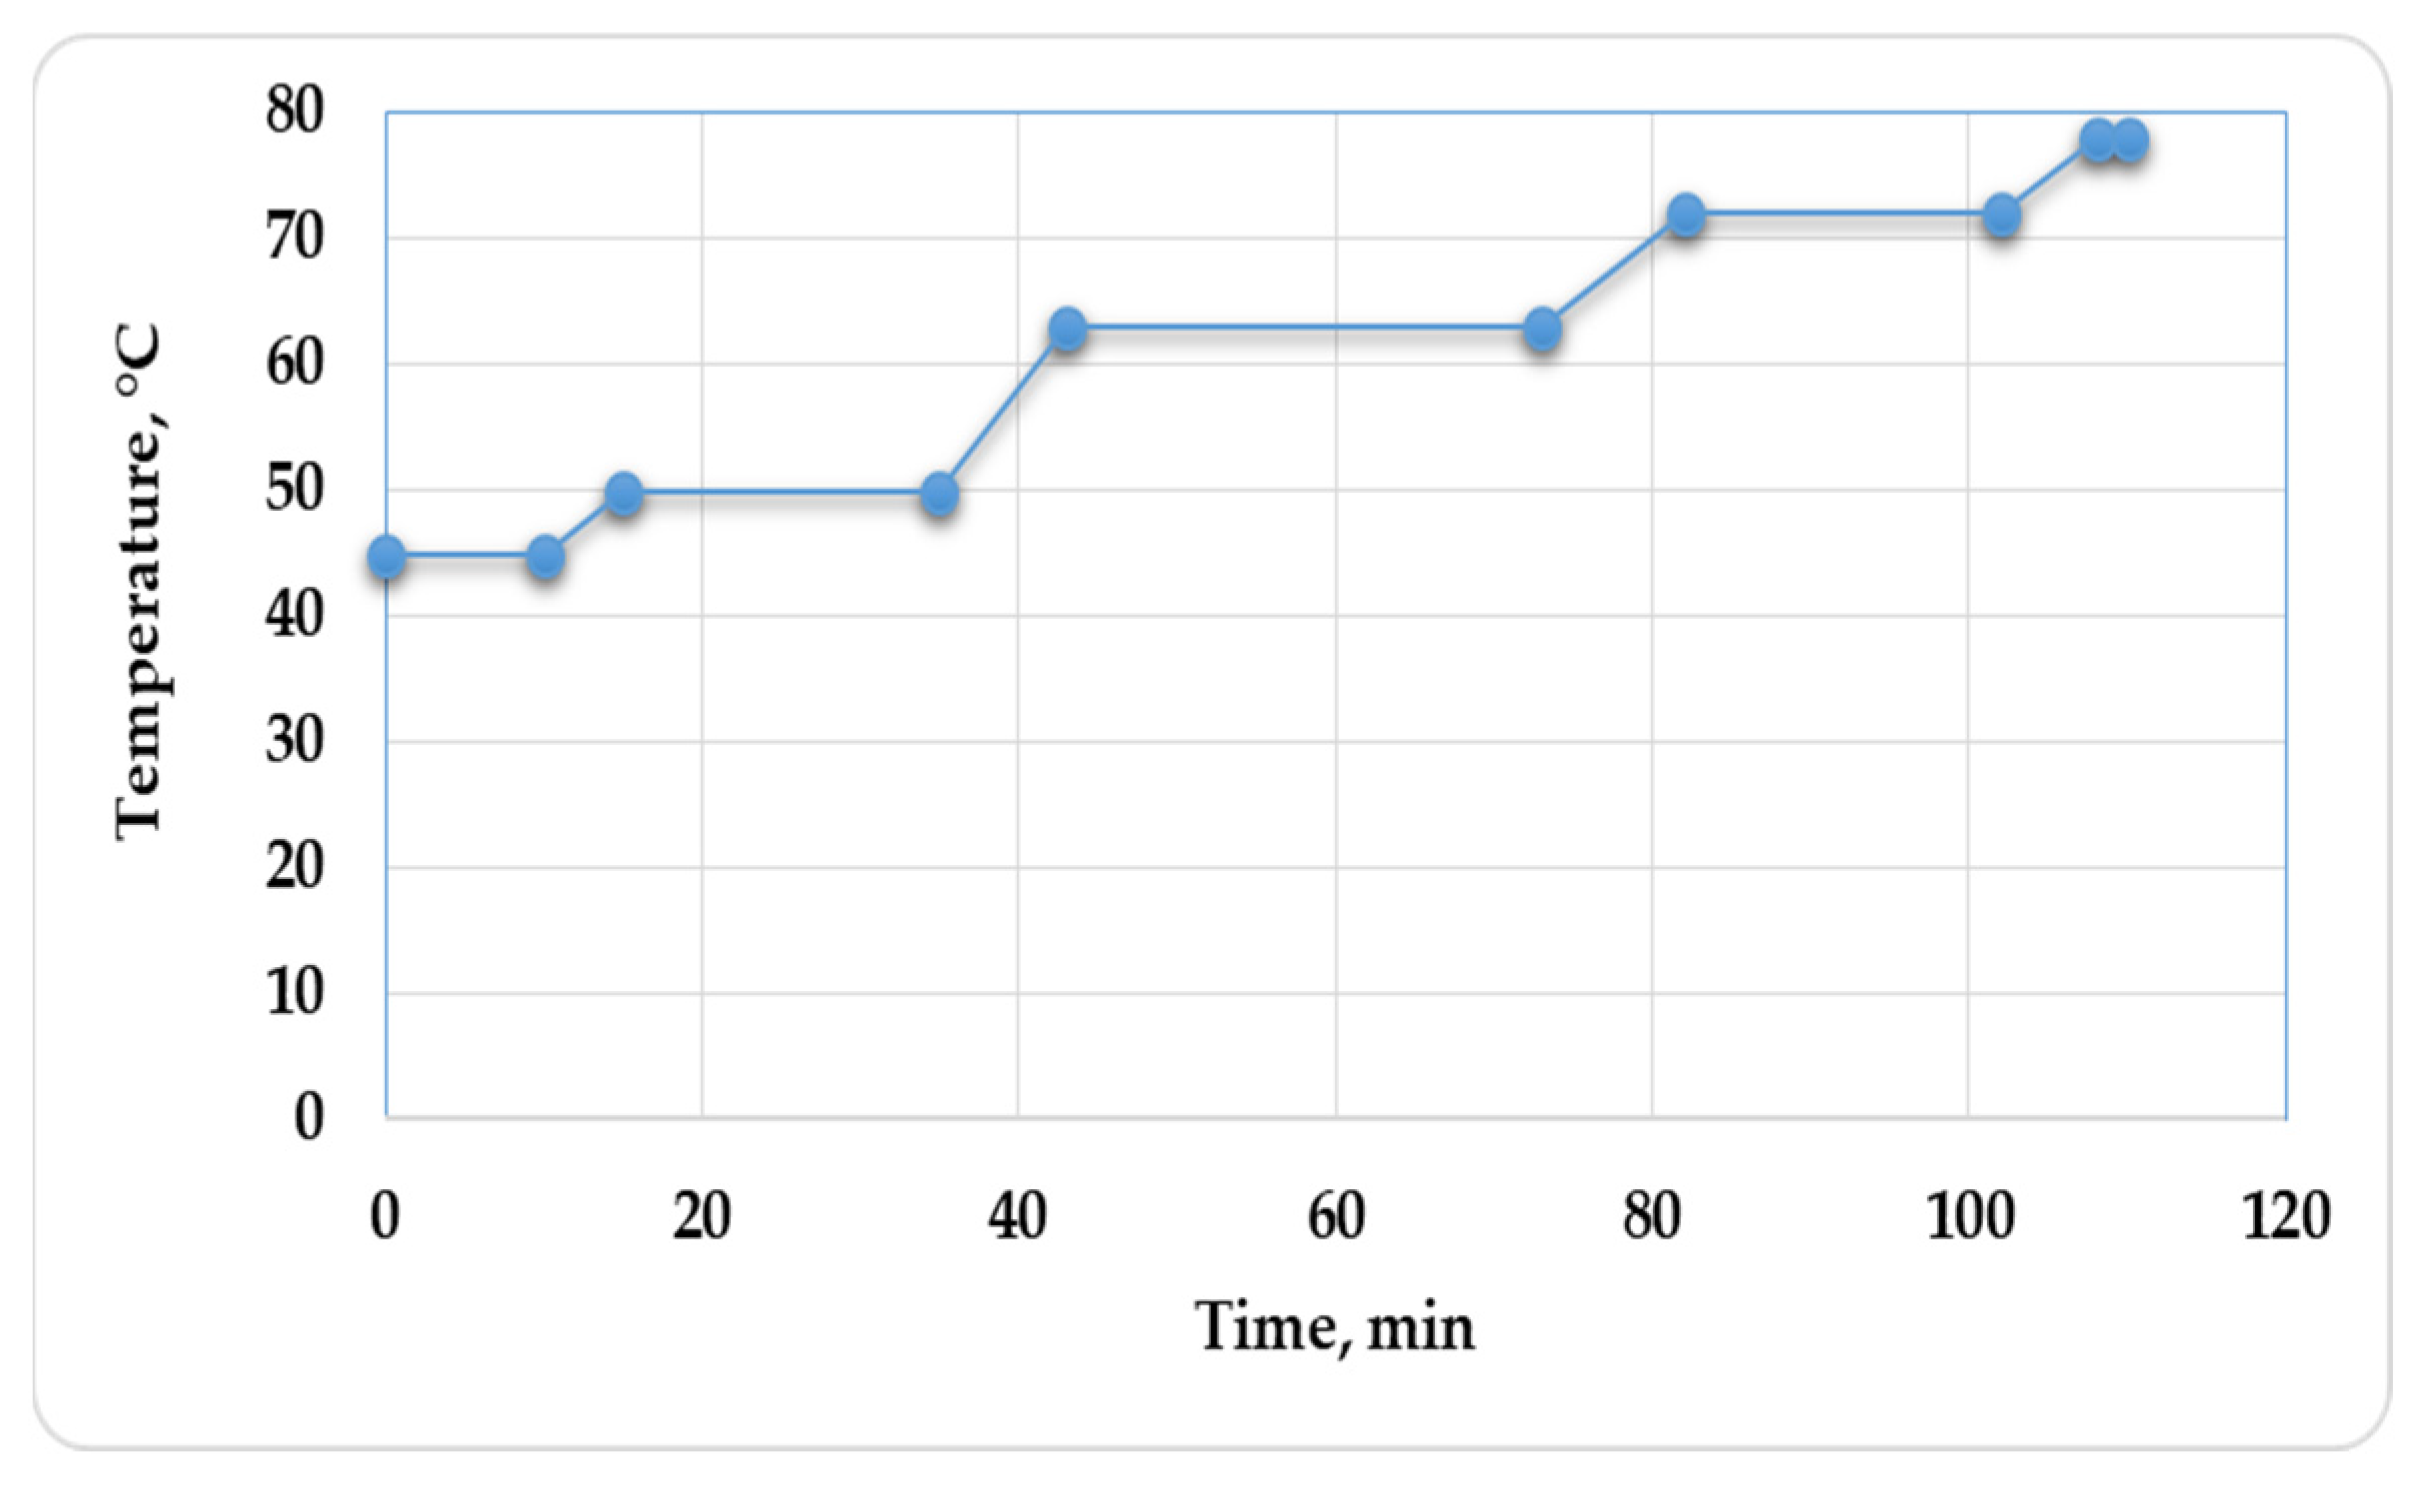
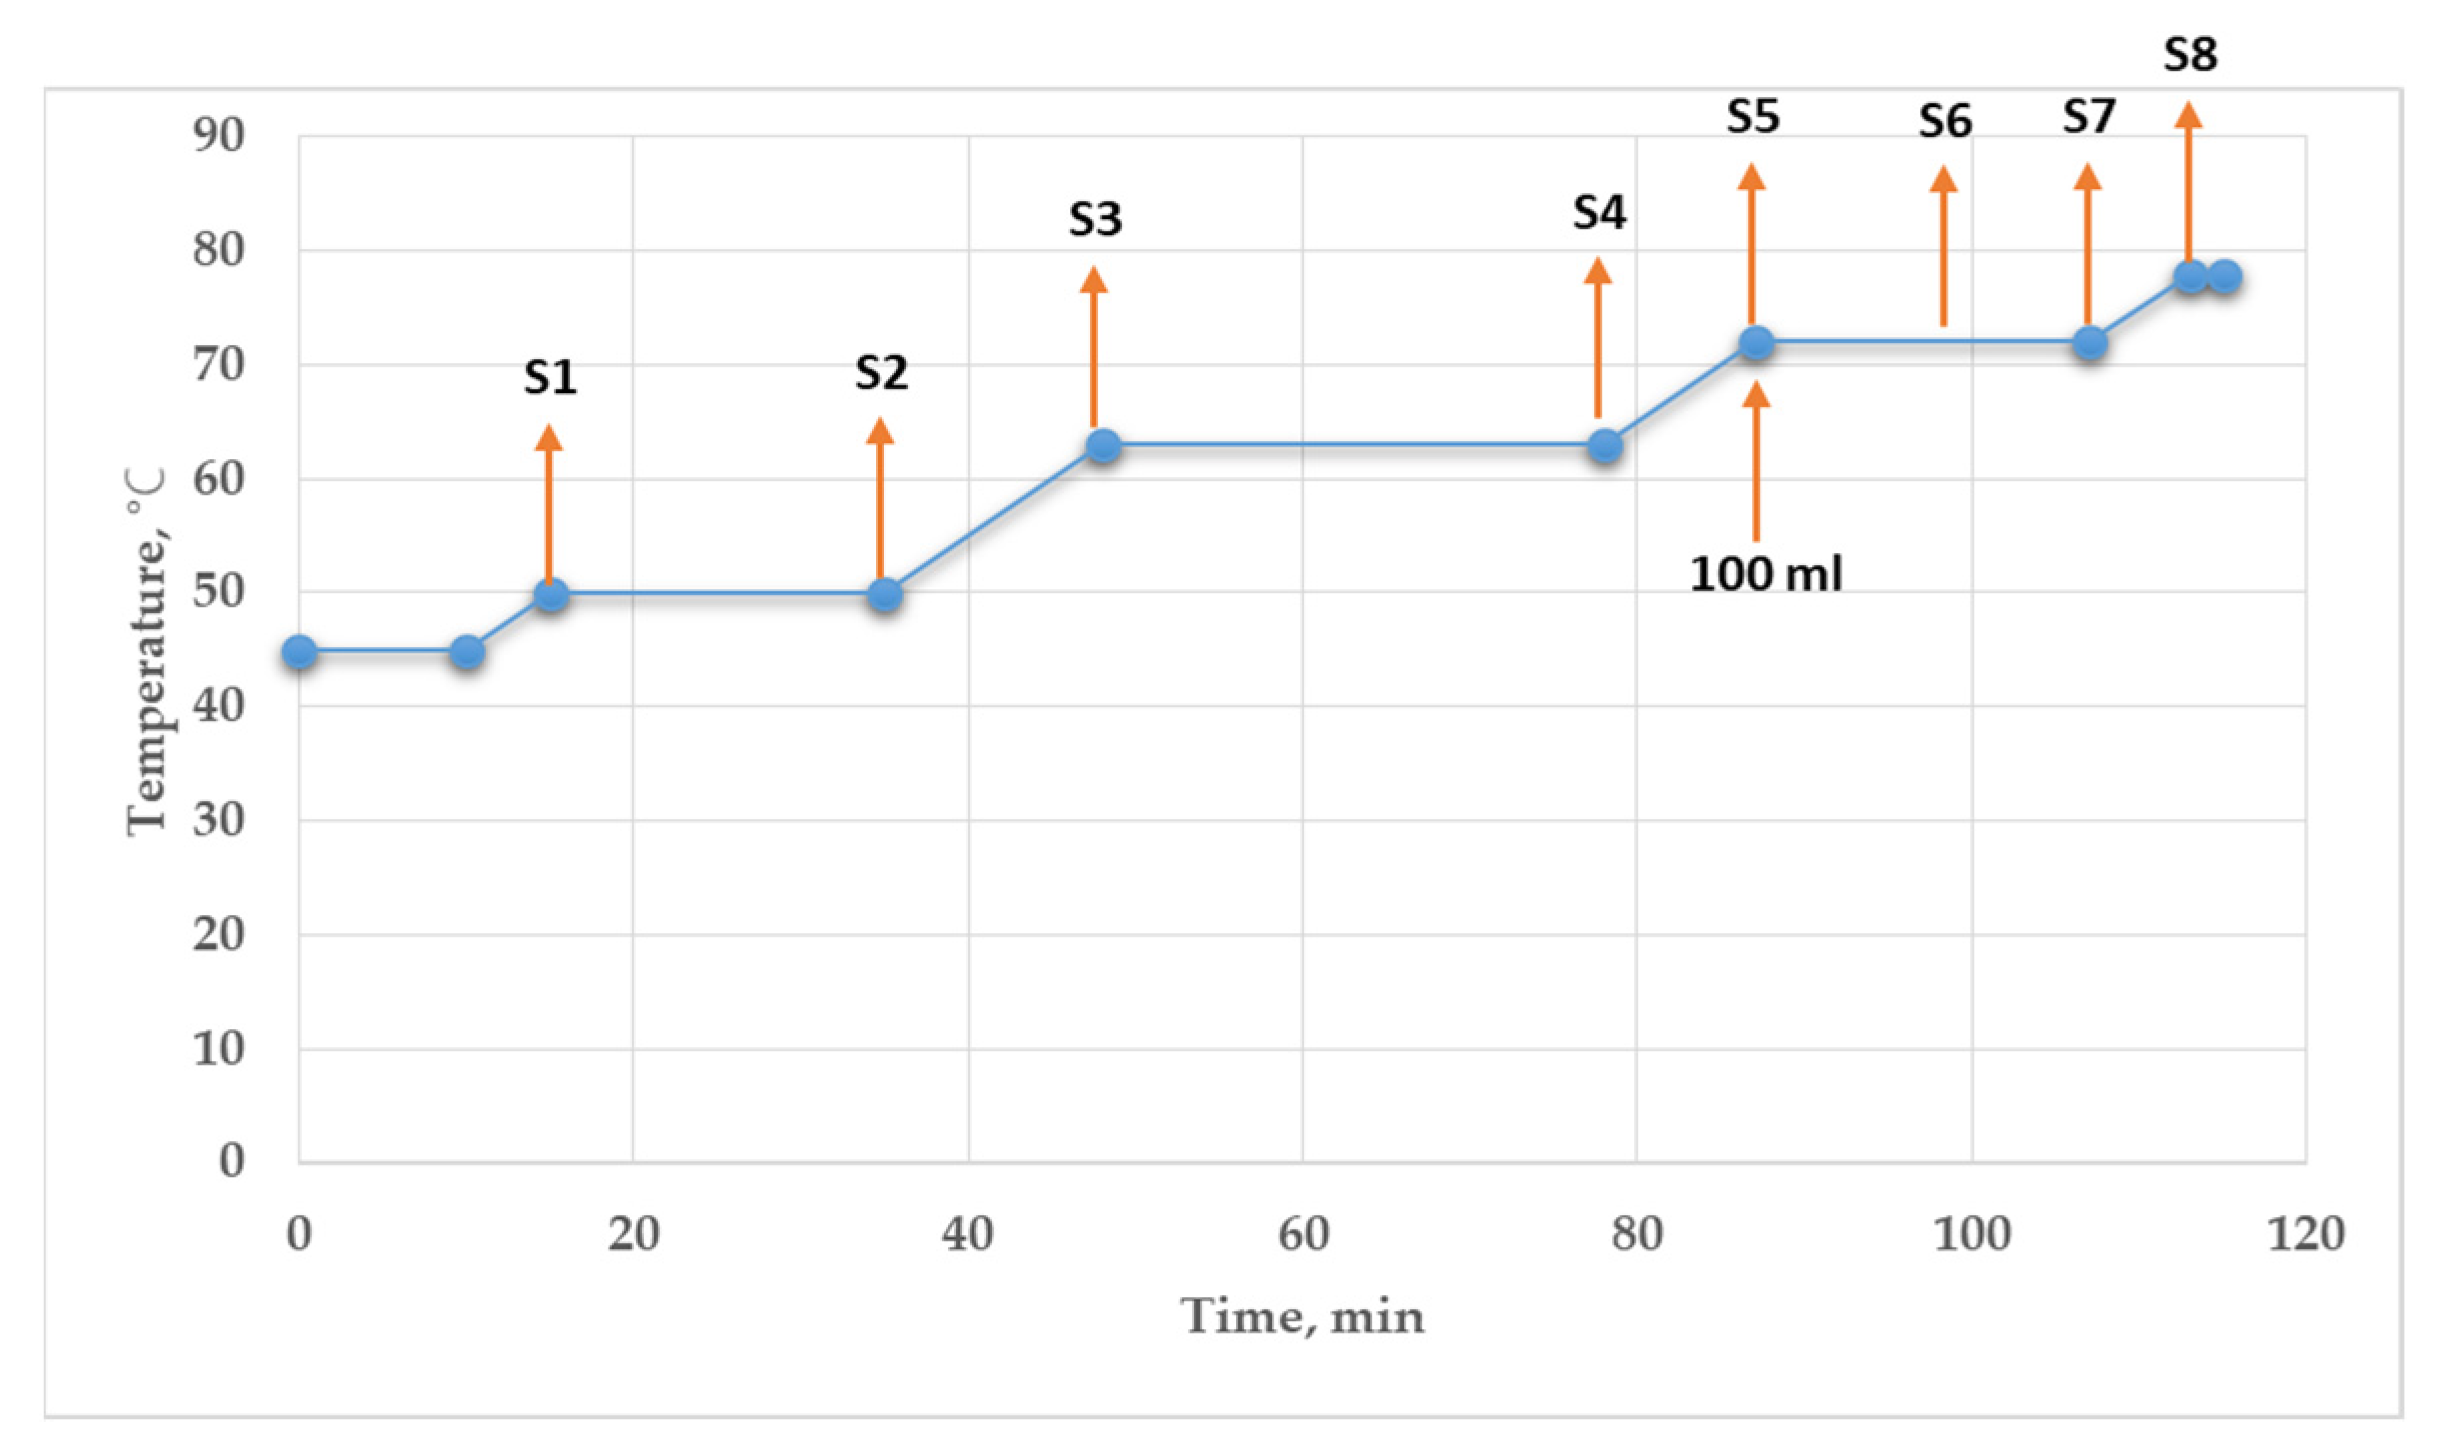
2.3.1. Mashing Method

Mashing was conducted according to the mode presented in Figure 1. A 50 g amount of milled malt or malt mixture, according to Table 1, was mixed with 175 mL of water (demineralized water) at 45 °C. The mash was continually stirred. The mashing was carried out according to congress method 4.5.1 of the European Brewing Convention [36]. The mash was filtered hot.

2.3.2. Wort Analysis

The wort extract’s pH, color and attenuation limit were determined according to the methods of the European Brewery Convention [36].

2.4. Extraction, Determination of Phenolic Compounds and Antioxidant Activity

The extraction and the determination of the phenolic compounds and the antioxidant potential of the different wort types was carried out according to the methods presented in Shopska et al., 2022 [30,34].

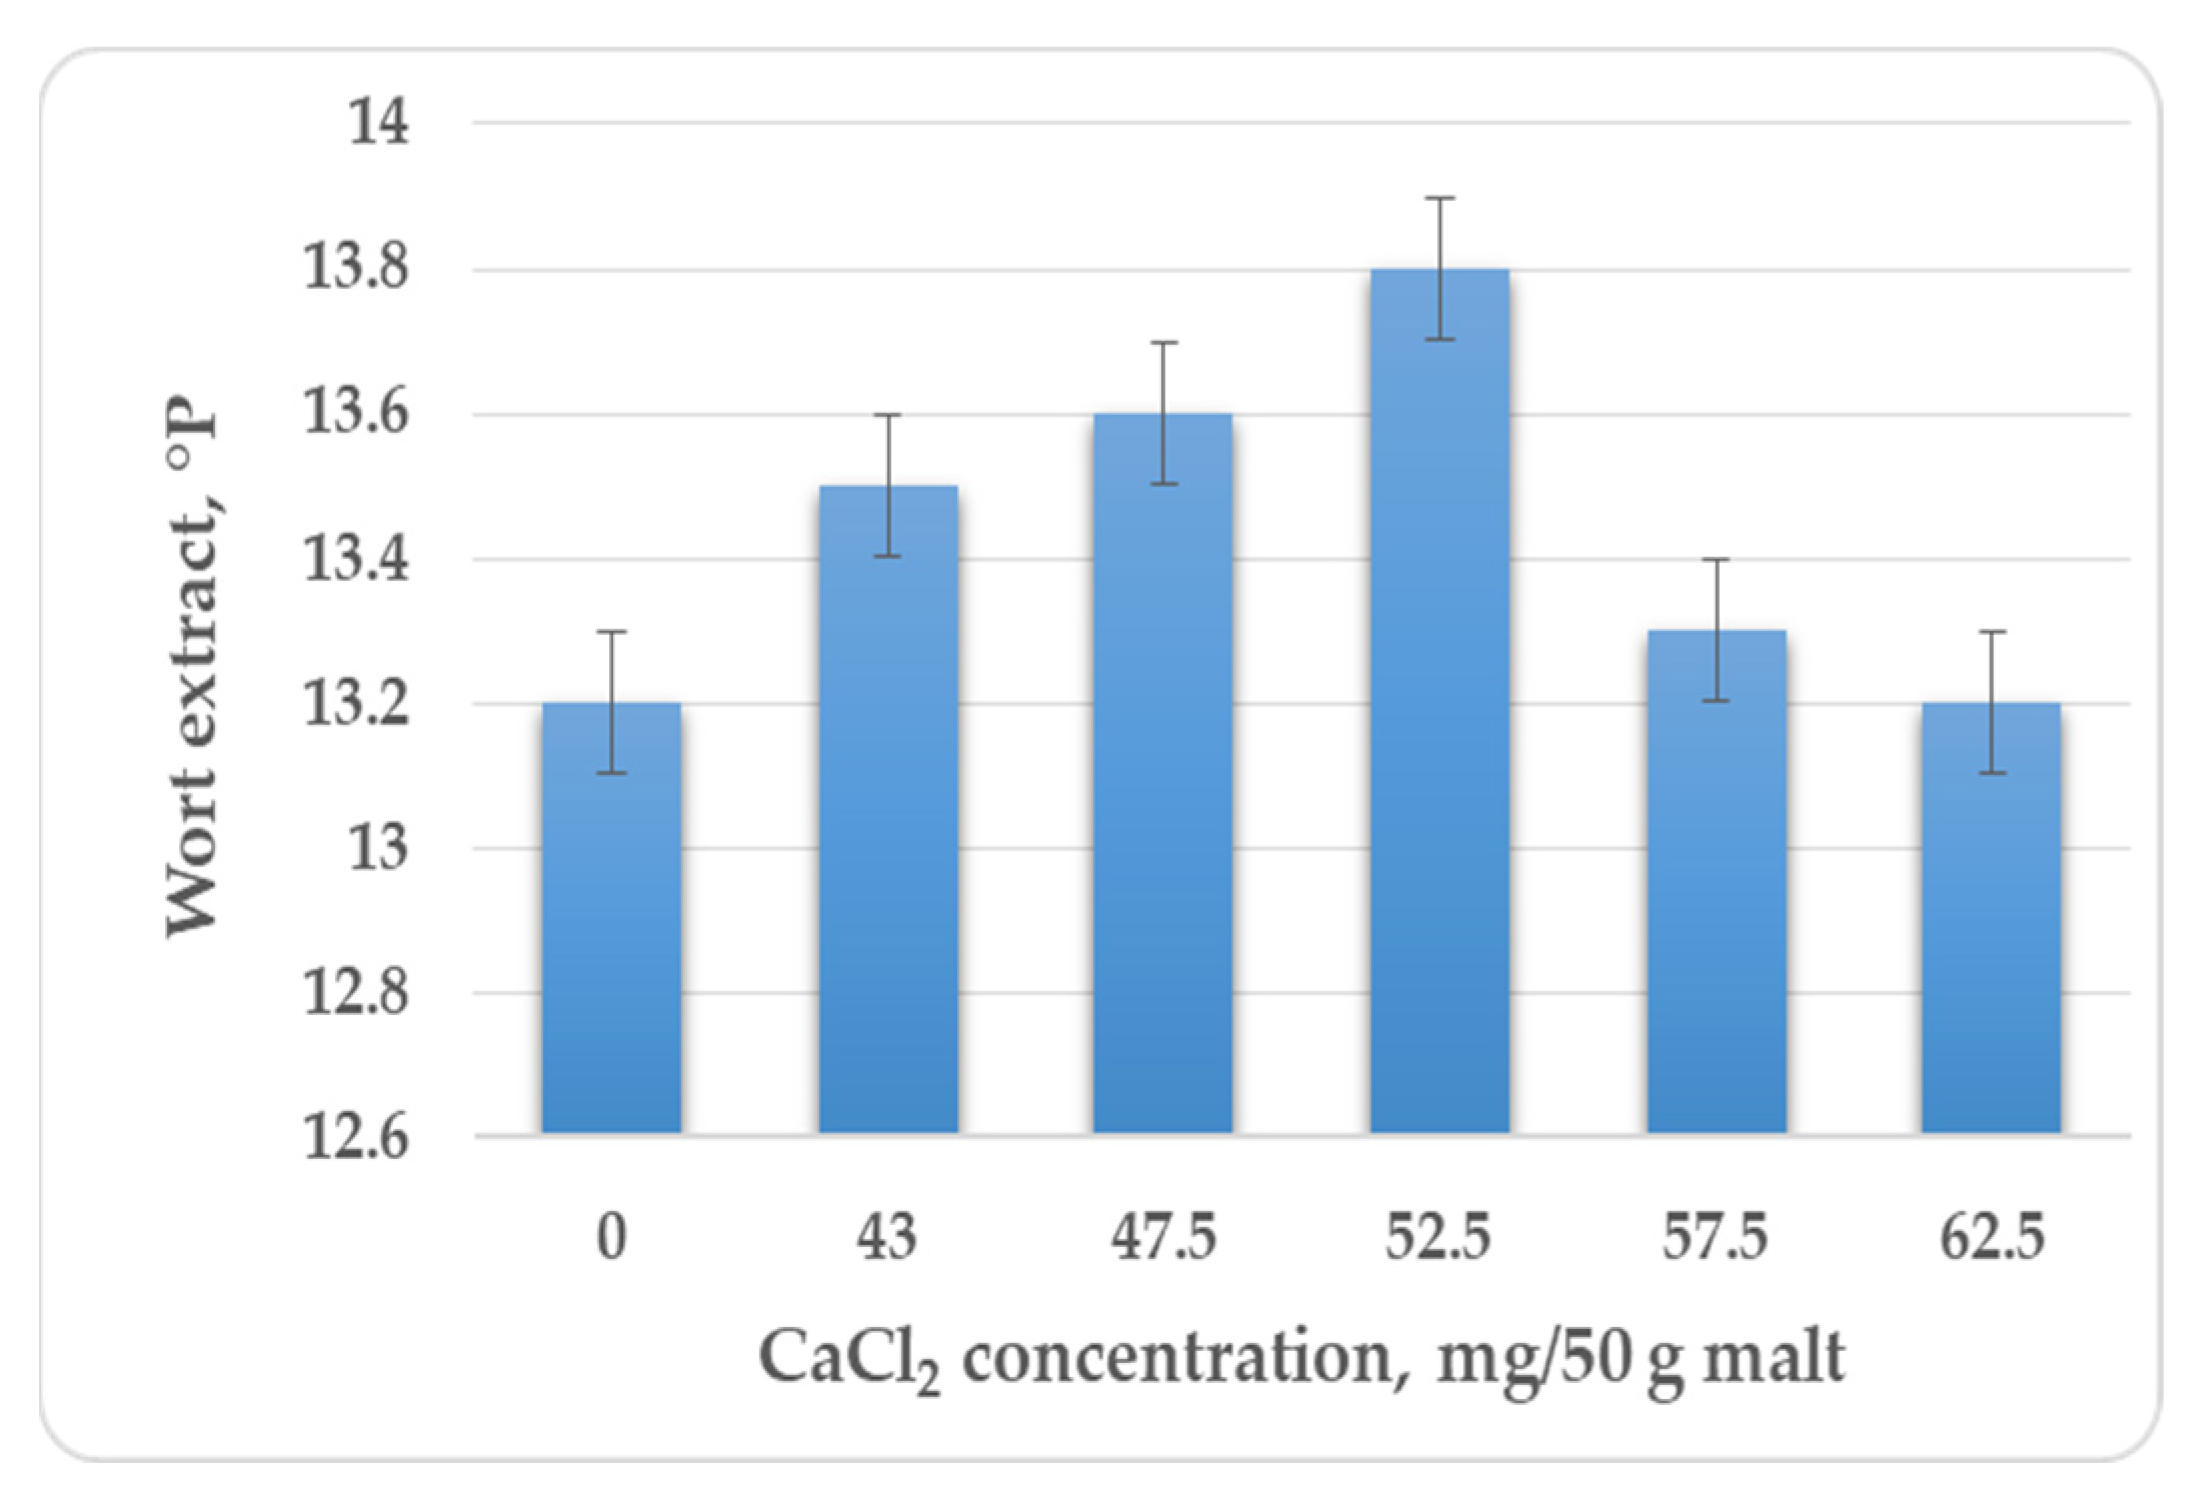
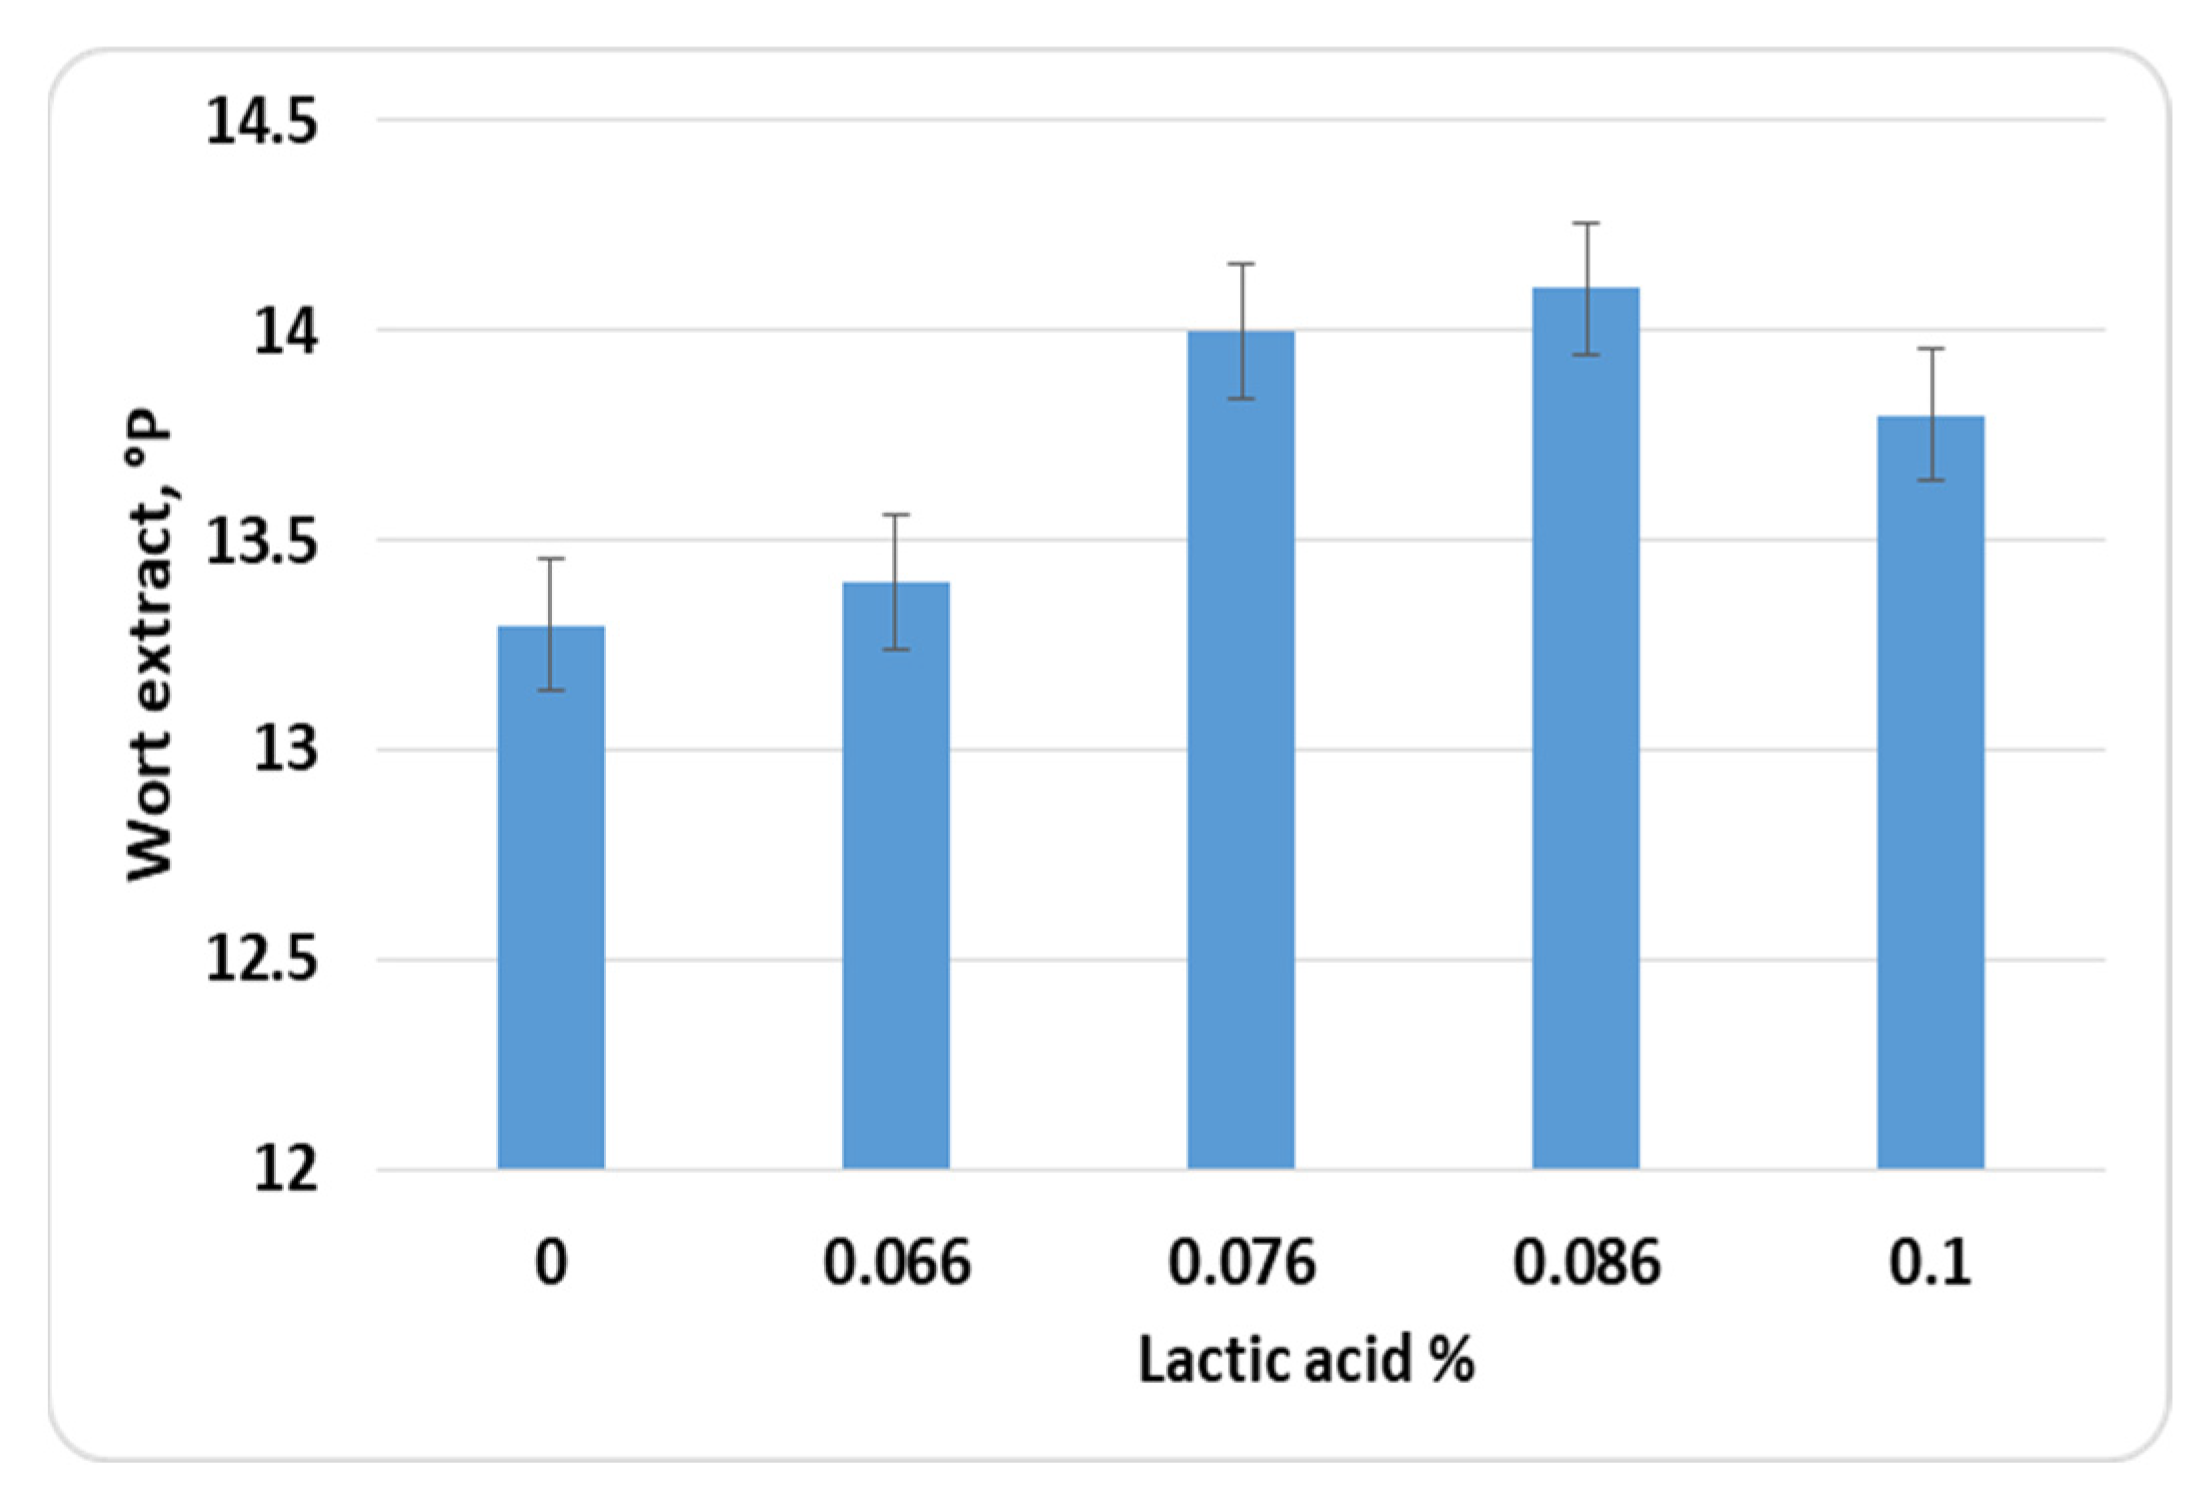
2.5. Investigation of the Influence of the Additions of Acidulated Malt, CaCl2 and Lactic Acid on the Wort Extract Yield

A single-factor experiment was conducted to study the influence of the addition of acidulated malt, CaCl2 and lactic acid on the wort extract yield.
CaCl2 was dosed in amounts of 43 mg/50 g of malt grist, 47.5 mg/50 g of malt grist and 52.5 mg/50 g of malt grist. The target function of the study was once again the wort extract obtained at the end of the mashing process, which was carried out according to the mode presented in Figure 1. Lactic acid was dosed in amounts of 0.066%, 0.076%, 0.086% and 0.1% of the malt amount. The target value of the study was the extract of the obtained wort at the end of the mashing process, carried out according to the mode presented in Figure 1.
Acidulated malt replaced some of the Pilsner malt in the optimized blend in the following percentages: 1%, 2%, 3%, 4%, 4.5%, 5%, 5.5%, and 6%. The acidulated malt amount was calculated on the basis of the total amount in the malt mixture. In this particular study, the total malt amount in the malt mixture was 50 g. The target value of the research was the wort extract obtained at the end of the mashing process, which was carried out according to the mode presented in Figure 1.

2.6. Optimizing the Mashing Mode

To optimize the mashing mode, an HPLC analysis of the fermentable sugars (glucose, fructose, maltose and sucrose) in the wort was carried out, and the samples were taken at certain points of the mashing mode (Figure 2). The HPLC analysis of the sugars was carried out under the conditions described previously in Ivanov et al., 2016 [37].

3. Results and Discussion

3.1. Modeling and Optimization of the Malt Mixture

3.1.1. Modeling of the Malt Mixture

Three malt types, Pilsner malt (P), Caramel Pils malt (CP) and Caramel Munich type 2 malt (CM2), were selected for the present study on the basis of previous studies. The choice was also based on existing recipes for the production of lager beer. The malt mixture was modeled using a special cubic simplex-lattice design with two replications. The choice of an estimation method was related to the possibility of exploring a larger part of the factor space due to the small number of independent variables. The results of the options presented in Table 1 have been shown in Table 2. The response surfaces for the investigated indicators have been summarized in Figure 3. The mathematical models obtained have been presented in Equations (1) to (7). The data from the statistical processing of the models have been presented as Supplementary Material. All mathematical models described the experimental data with very high accuracy, with correlation coefficients ranging from 72% to 99% (see Equations (1) to (7)).
The extract of the obtained wort changed within relatively narrow limits, following a tendency to decrease with an increase in the CM2 malt content in the mixture. This was due to the lower enzyme activity of the special malts due to their production method [30]. The color of the wort obtained increased with the increase in the content of CP and CM2 malts in the mixture. CP and CM2 have higher color intensity, which is also reflected in the color of the resultant wort. The trend observed was due to the higher initial color of both malt types, with CM2 malt (with a higher color intensity) having a stronger influence. Similarly, the trends observed here can be explained by the CM2 malt production method [30].
Extract = 11.59 ∗ CM2 + 12.24 ∗ CP + 13.38 ∗ P + 0.48 ∗ CM2 ∗ CP + 2.41 ∗ CM2 ∗ P − 1.39 ∗ CP ∗ P + 8.51 ∗ CM2 ∗ CP ∗ P − 1.46 ∗ CM2 ∗ CP ∗ (CM2-CP) + 5.40 ∗ CM2 ∗ P ∗ (CM2-P) + 0.016 ∗ CP ∗ P ∗ (CP-P)R2 = 84.42%  (1)
Color = 202.55 ∗ CM2 + 5.31 ∗ CP + 4.56 ∗ P − 2.07 ∗ CM2 ∗ CP + 250.51 ∗ CM2 ∗ P + 5.26 ∗ CP ∗ P + 696.16 ∗ CM2 ∗ CP ∗ P − 225.8 ∗ CM2 ∗ CP ∗ (CM2-CP) + 494.51 ∗ CM2 ∗ P ∗ (CM2-P) − 62.75 ∗ CP ∗ P ∗ (CP-P)R2 = 72.55%  (2)
FC = 1648.86 ∗ CM2 + 493.93 ∗ CP + 405.93 ∗ P − 44.90 ∗ CM2 ∗ CP + 101.249 ∗ CM2 ∗ P + 74.87 ∗ CP ∗ P + 847372 ∗ CM2 ∗ CP ∗ P − 300.10 ∗ CM2 ∗ CP ∗ (CM2-CP) − 8.07 ∗ CM2 ∗ P ∗ (CM2-P) + 9.70 ∗ CP ∗ P ∗ (CP-P)R2 = 99.01%  (3)
DPPH = 1092.63 ∗ CM2 + 296.18 ∗ CP + 307.36 ∗ P + 168.04 ∗ CM2 ∗ CP − 118.51 ∗ CM2 ∗ P − 33.87 ∗ CP ∗ P + 781.14 ∗ CM2 ∗ CP ∗ P + 142.38 ∗ CM2 ∗ CP ∗ (CM2-CP) − 344.28 ∗ CM2 ∗ P ∗ (CM2-P) − 77.48 ∗ CP ∗ P ∗ (CP-P)R2 = 99.39%  (4)
FRAP = 1923.31 ∗ CM2 + 645.62 ∗ CP + 693.71 ∗ P + 251.49 ∗ CM2 ∗ CP − 374.23 ∗ CM2 ∗ P − 197.41 ∗ CP ∗ P − 19.62 ∗ CM2 ∗ CP ∗ P − 139.56 ∗ CM2 ∗ CP ∗ (CM2-CP) − 1552.8 ∗ CM2 ∗ P ∗ (CM2-P) − 185.26 ∗ CP ∗ P ∗ (CP-P)R2 = 97.92%  (5)
CUPRAC = 8060.23 ∗ CM2 + 2378.72 ∗ CP + 1699.62 ∗ P + 808.62 ∗ CM2 ∗ CP − 683.99 ∗ CM2 ∗ P + 1143.41 ∗ CP ∗ P + 5470.74 ∗ CM2 ∗ CP ∗ P + 1566.78 ∗ CM2 ∗ CP ∗ (CM2-CP) − 1513.8 ∗ CM2 ∗ P ∗ (CM2-P) − 1618.35 ∗ CP ∗ P ∗ (CP-P)R2 = 99.55%  (6)
ABTS = 8496.27 ∗ CM2 + 2503.56 ∗ CP + 2252.9 ∗ P + 1149.24 ∗ CM2 ∗ CP + 2729.06 ∗ CM2 ∗ P − 286.41 ∗ CP ∗ P − 4825.9 ∗ CM2 ∗ CP ∗ P + 3448.93 ∗ CM2 ∗ CP ∗ (CM2-CP) + 5978.78 ∗ CM2 ∗ P ∗ (CM2-P) − 508.107 ∗ CP ∗ P ∗ (C-P)R2 = 83.37%  (7)
As is known from the literature, wort has significant biological potential, which is due to a number of components extracted from malt: phenolic compounds, melanoidins, reductones and others [30,31]. In the present study, we analyzed the content of phenolic compounds, determined by the Folin–Ciocâlteu method, as well as the wort antioxidant potential, using four main methods: DPPH, FRAP, CUPRAC and ABTS. The data in Figure 3c show that the phenolic compound content increased linearly with the increase in the amounts of CP and CM2 malts in the blend. In most cases, malt drying at high temperatures, or malt roasting aimed at higher color intensity, leads to the release of phenolic compounds from the matrix and their easier extraction into the wort. This, together with the melanoidins, which also have antioxidant potential, increases the wort biological activity [30,31]. In the present study, the data showed that the wort had high antioxidant potential, which followed the analogous trend for phenolic compounds: an increase in the biological activity with the increase in the CP and CM2 amounts. In terms of biological activity, CM2 malt had stronger influence, since it was more heavily roasted and therefore contained more melanoidins, which had a direct impact on the activity. Analogous trends were found in Shopska et. al., 2022 [34].

3.1.2. Malt Mixture Optimization

Based on the results obtained, it was necessary to select objective functions for the optimization of the malt mixture. The data showed that CM2 malt had the strongest influence on the biological activity, but at the same time, it had a rather negative influence on the wort extract. A series of preliminary analyses (results are not shown) demonstrated that, in order to obtain beer that met lager standards (color up to about 12 EBC units), it was necessary to minimize the content of highly colored malt. Therefore, the wort extract and its color were chosen as optimization target functions.
Multi-parameter optimization was used to optimize the mixture, the results of which have been shown in Figure 4 and in Table 3. The optimization was carried out in order to maximize the wort extract and to obtain wort color equal to eight EBC units. The optimized mixture had high biological potential (Table 3) and could also be used for the production of functional wort-based beverages.

3.2. Investigation of the Effect of the Addition of Acidulated Malt, Lactic Acid and CaCl2 on the Extract Yield

As a fully enzymatic process, mashing is affected by factors such as temperature, pH and substrate concentration. In this regard, when optimizing the mashing modes, the influence of various additives on the pH of the malt mixture, and hence, on the yield of extractive substances, is most often studied. Single-factor experiments, where the temperature factor is fixed according to the selected mixing mode, are usually used [7].

3.2.1. Addition of CaCl2 and Lactic Acid

The results of these studies have been shown in Figure 4 and Figure 5.
The addition of CaCl2 in doses up to 52.5 mg/50 g of malt mixture had a positive effect on the extract yield (Figure 5). The calcium ions had a positive influence on the enzyme activity, increasing the stability of α-amylase, lowering the pH (i.e., the zone of the pH optimum for the respective enzymes was reached) and improving yeast cell growth during fermentation, etc. The chloride ions affected the organoleptic profile of the beer. Calcium dichloride is frequently found in combination with carbonates and sulfates; therefore, it was necessary to dose it separately at the beginning of the mashing [7,38]. In this case, the wort pH decreased slightly (from 0.05 to 0.1 unit), which was the reason for the relatively weak influence of the additive.
Lactic acid dosing is another approach to correcting the wort pH and reaching the optimum pH for the respective enzymes. In this case, there are requirements that the lactic acid should be of biological origin; hence, breweries most often produce lactic acid concentrate from wort or add lactic acid obtained by cultivating different cultures of lactic acid bacteria [7]. The effect of the lactic acid addition has been shown in Figure 6. The increase in the lactic acid dose provoked a decrease in the wort pH from 5.7 to 5.4 to 5.5, which, in turn, was favorable for the enzyme activity and led to an increase in the wort extract by 0.8–0.9 °P. As the dose of lactic acid increased, the extract yield started to decrease, the wort viscosity changed and the mash lautering became more difficult.

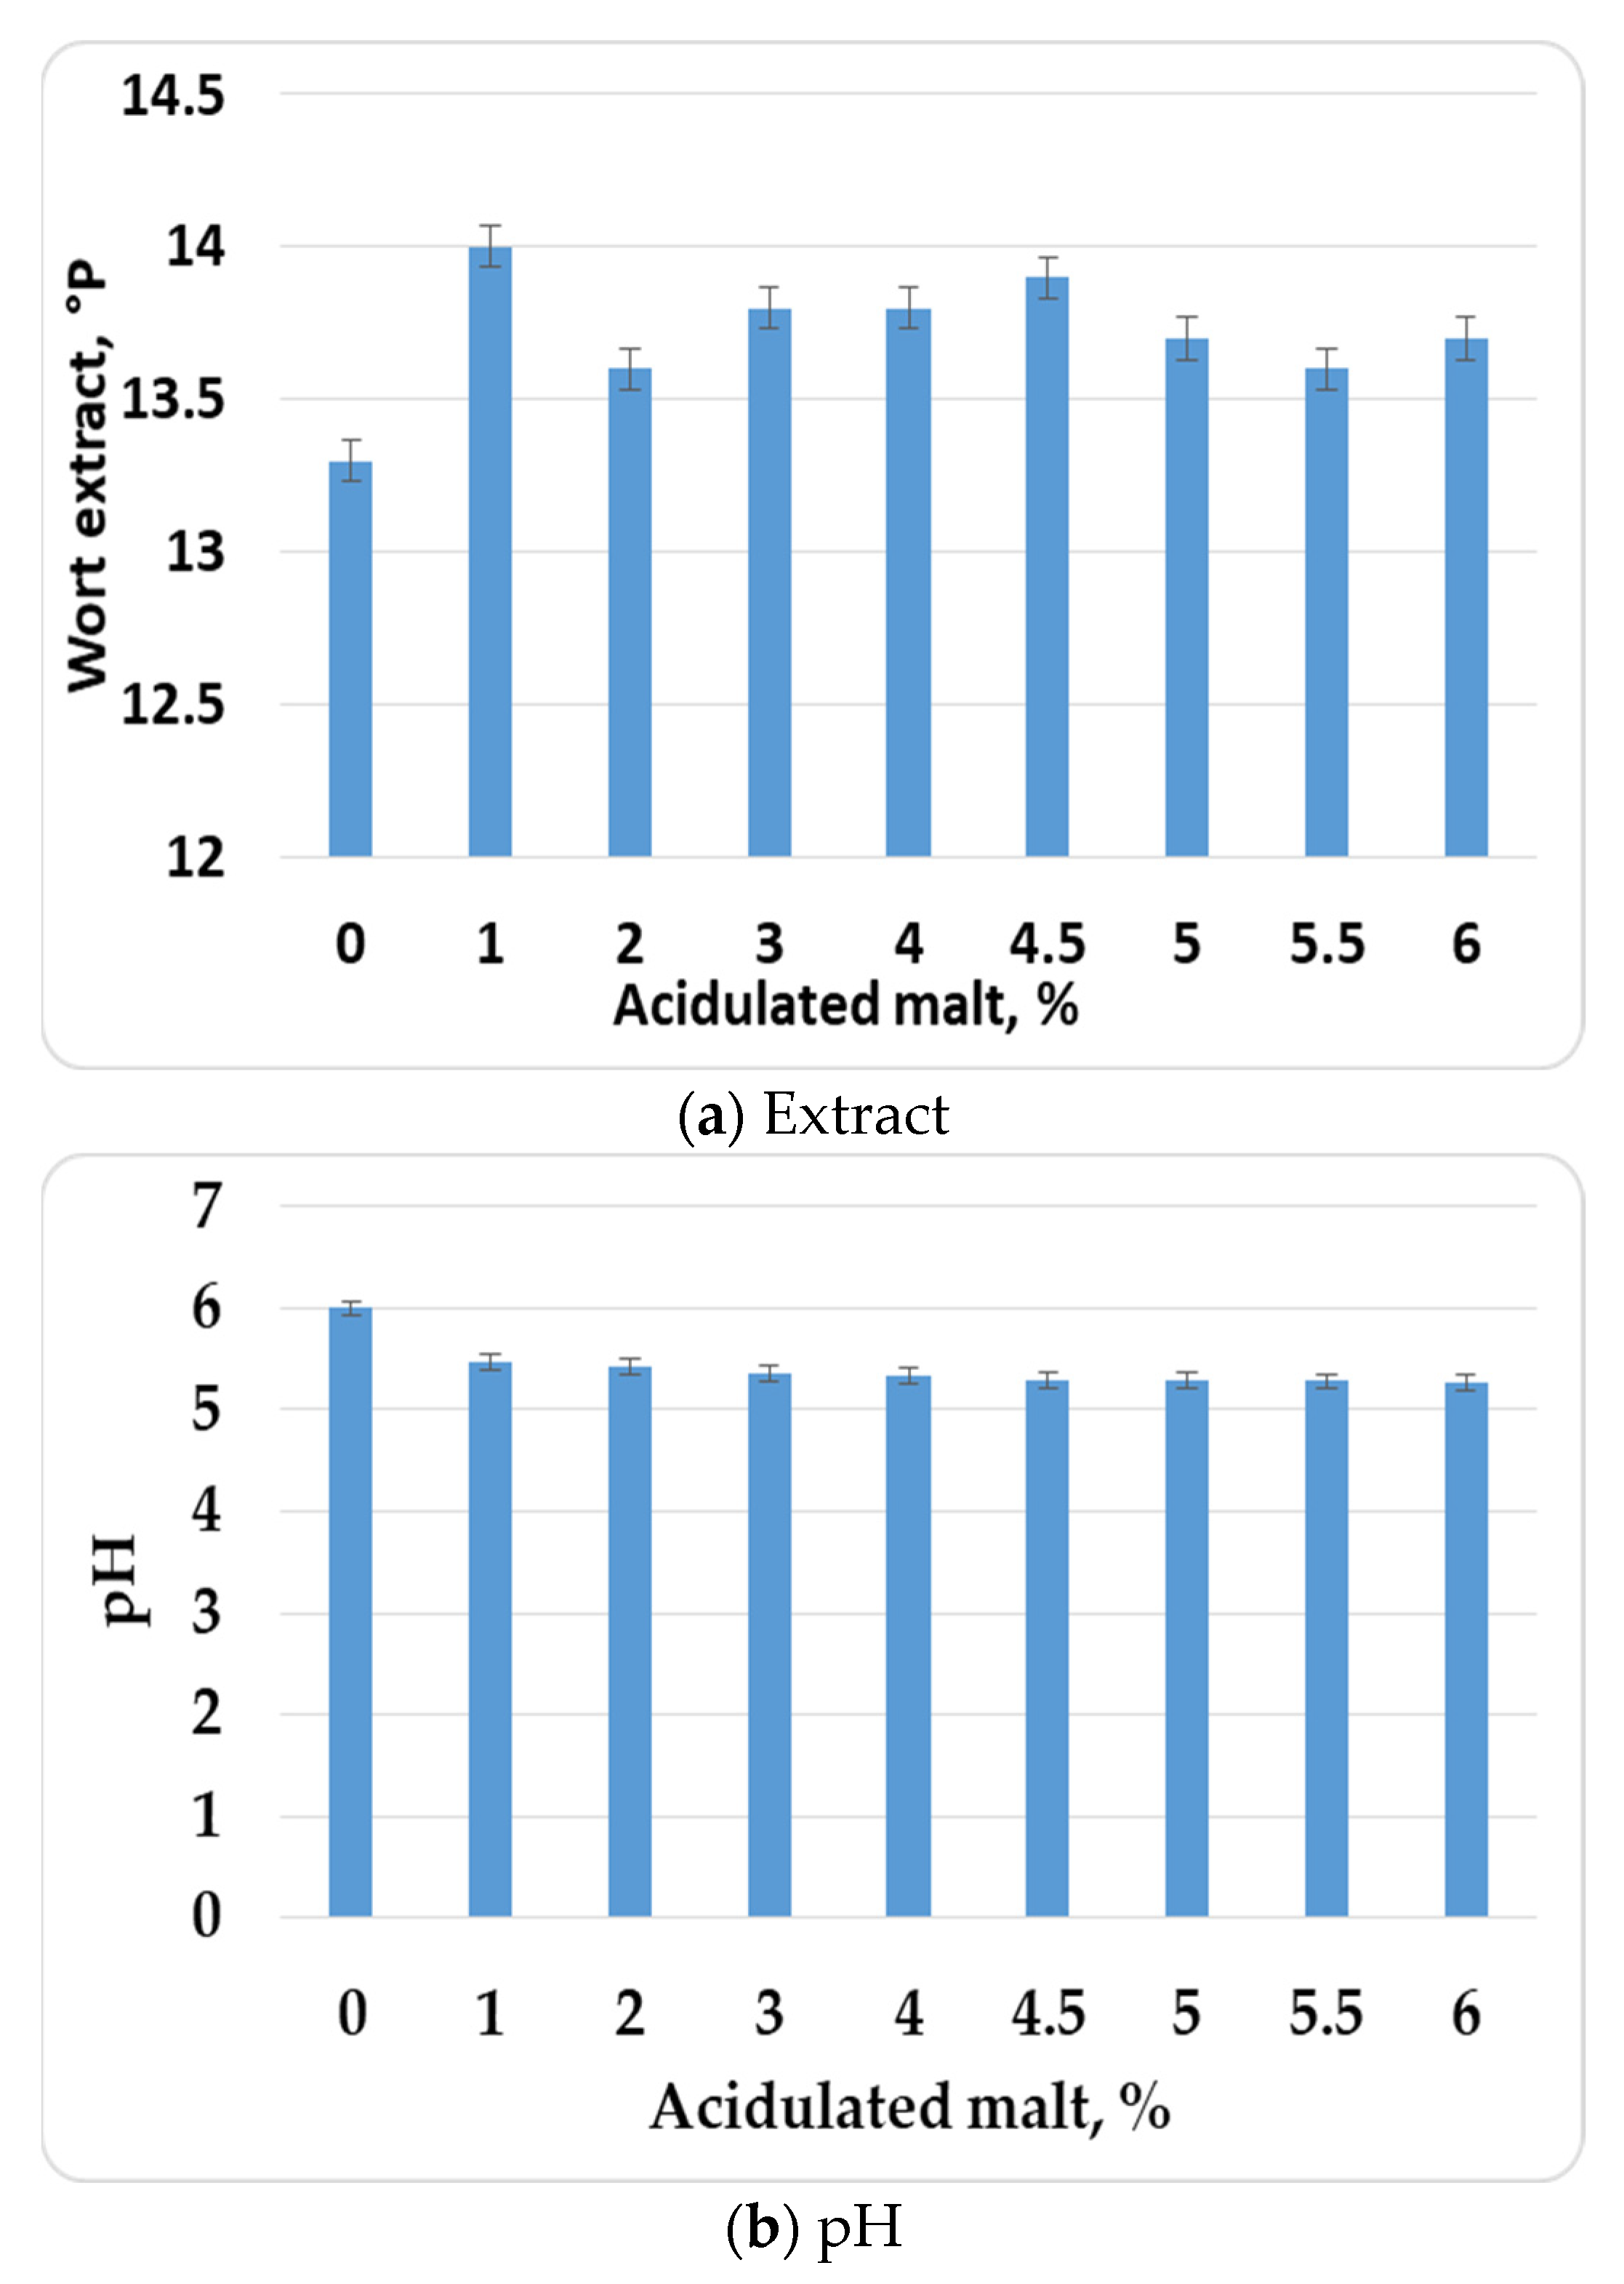
3.2.2. Addition of Acidulated Malt

Another method of acidifying the wort and reaching the optimum pH values for the individual enzymes involved in the mashing process is the use of acidulated malts. Acidulated malts are produced under special technological modes of steeping, germination and drying, or by applying lactic acid bacteria cultures during the germination process [7]. In this way, organic acids (mainly lactic acid) accumulate in them, and when replacing part of the malt (2% to 10% of the total malt) amount, they can adjust the pH of the mash within the limits of the optimum pH for the enzymes [7]. In the present work, part of the Pilsen malt was replaced with sour malt, and the optimum CaCl2 amount was added to the mash. The results have been summarized in Figure 7. The data showed that, in this particular case, the addition of acidulated malt, at the amount of 1% of the malt meal, increased the extract content by 0.8 °P. A slight decrease in the extract with the increase in the acidulated malt amount was observed, which was due to the deviation from the optimum pH for the enzyme groups involved in the mashing process.

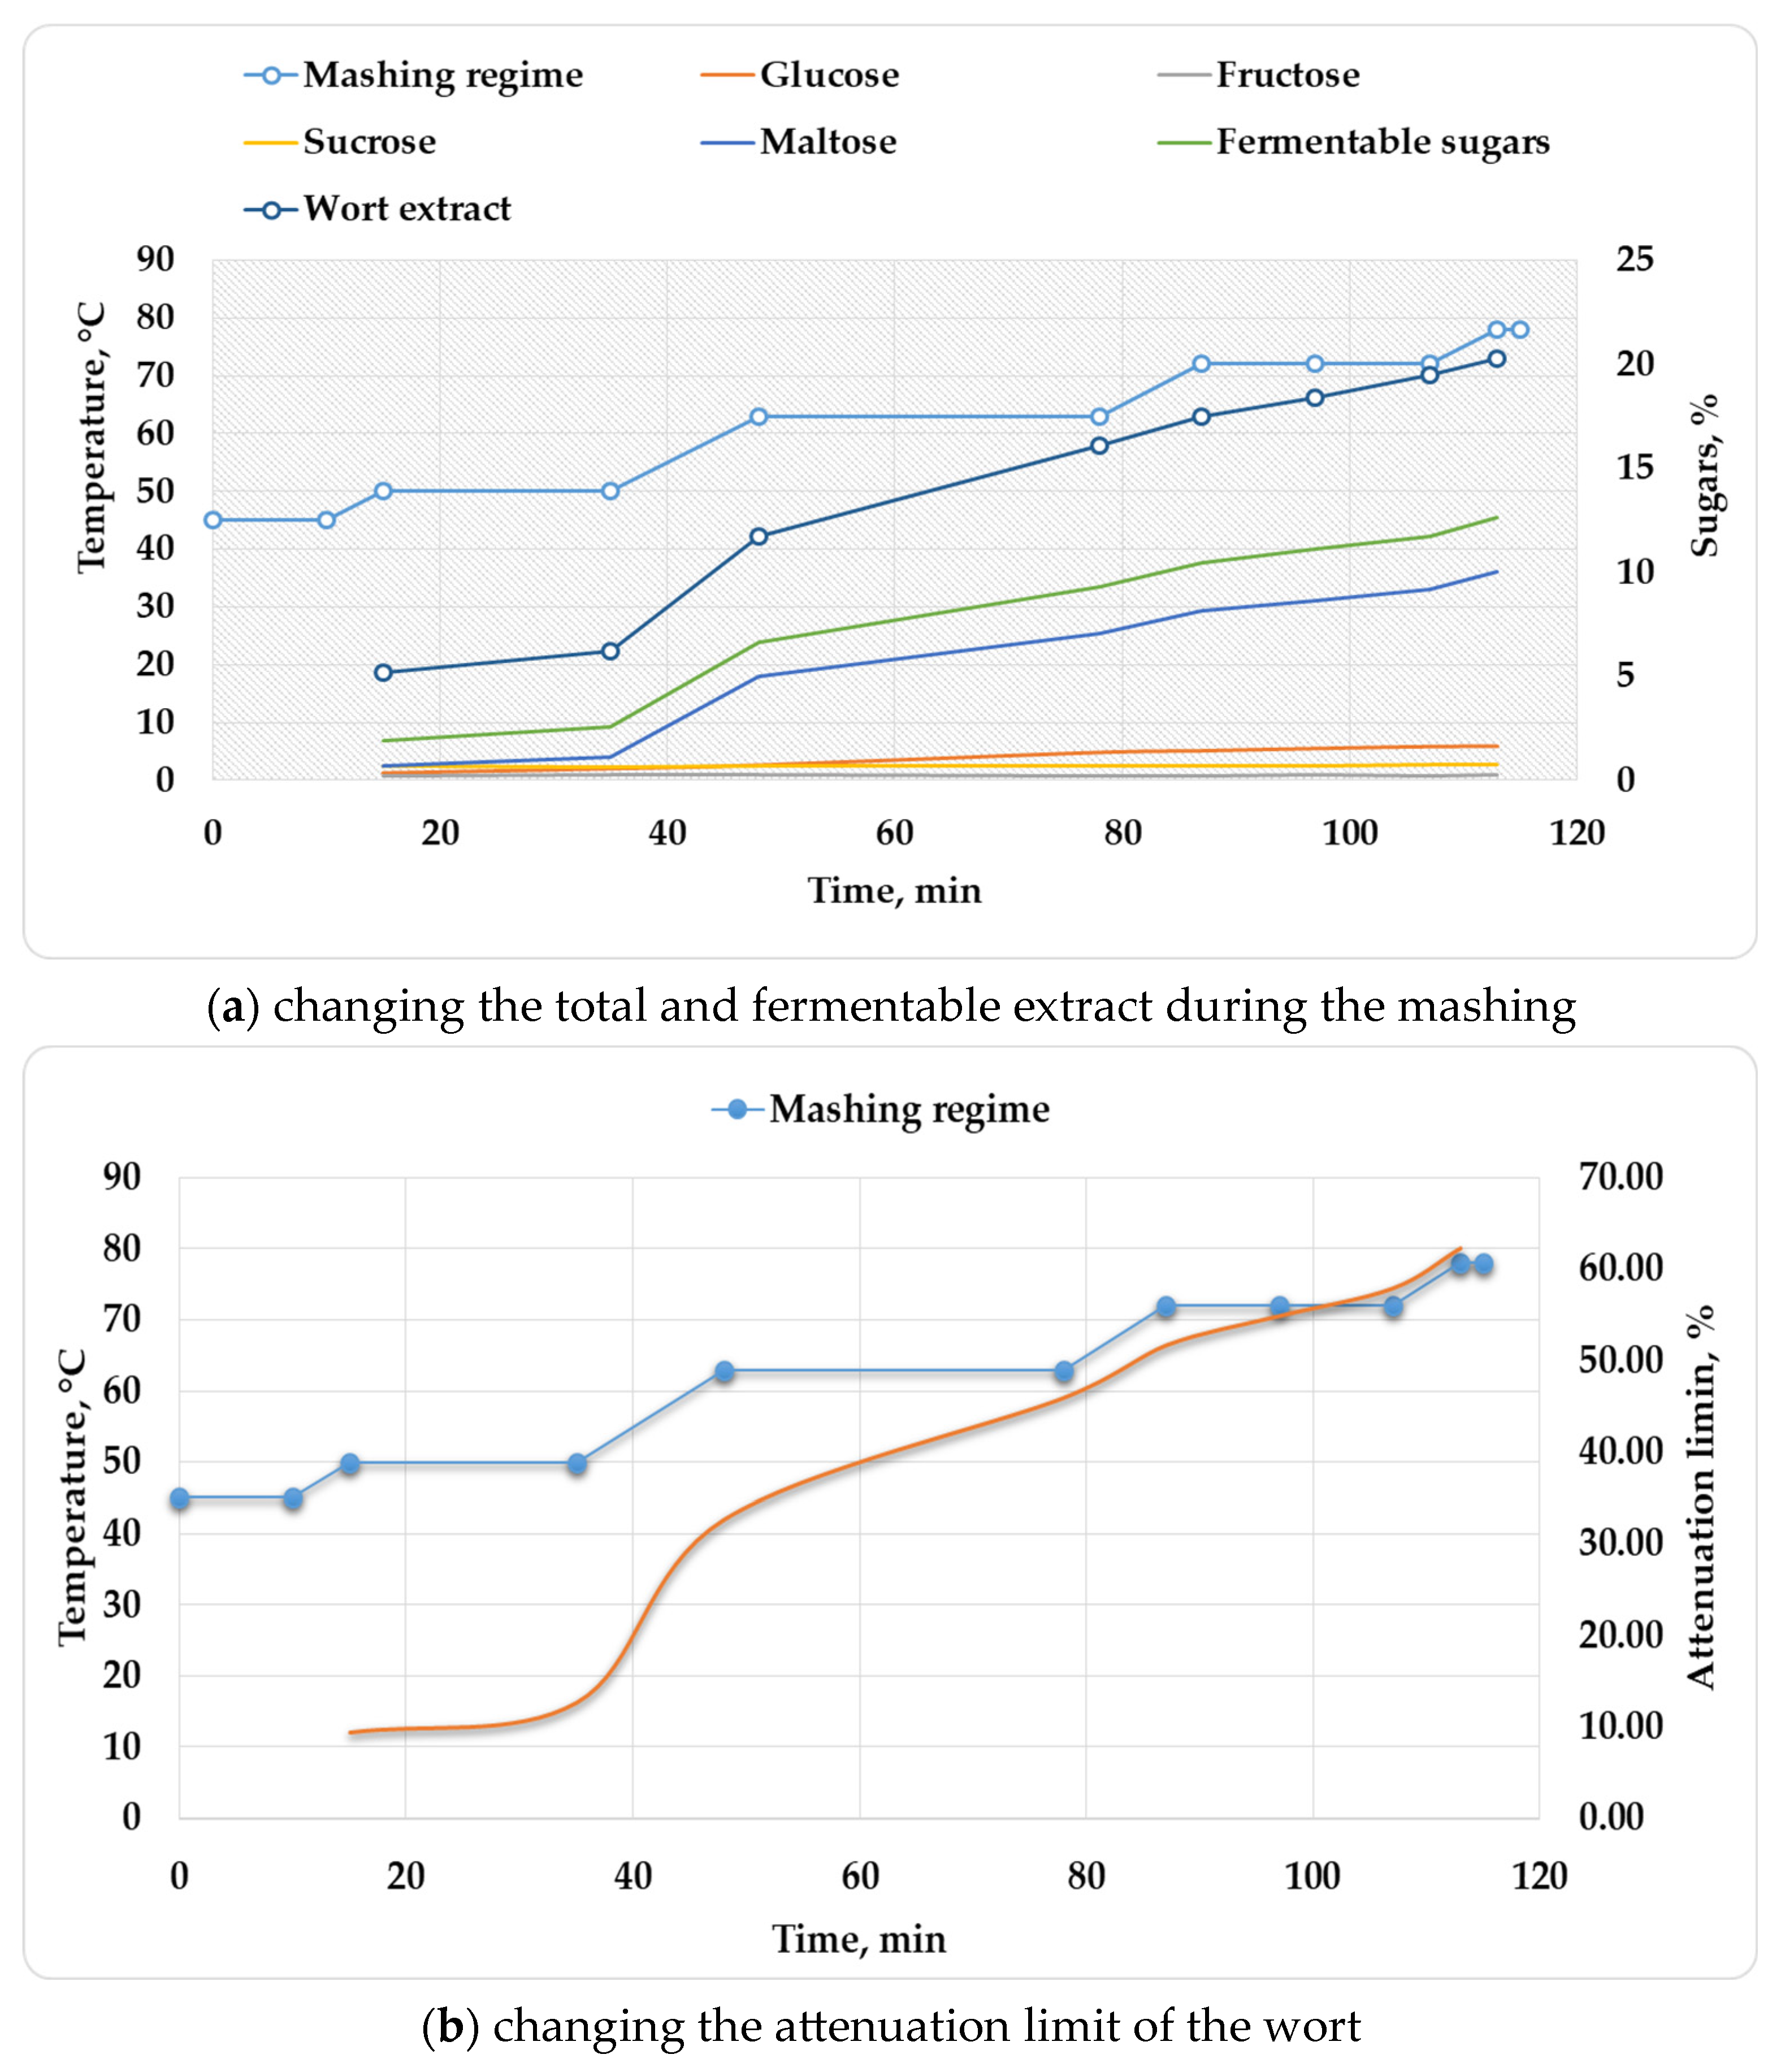
3.3. Optimizing the Mashing Mode

The following version of an optimized malt mixture with the addition of CaCl2 and acidulated malt was selected on the basis of the results obtained: Pilsner malt: 92.6%, Caramel Pils: 5.2%, Caramel Munich 2: 1.2%, acidulated malt: 1%, CaCl2: 52.5 mg/50 g of malt. With the malt mixture and the corresponding additives thus selected, the influence of individual pauses on the production of the fermentable extract (represented by the fermentable sugars glucose, fructose, sucrose and maltose) was investigated, according to the methodology presented in Figure 2. The results have been summarized in Figure 8.
The data in Figure 8 show that the fermentable extract accumulated linearly within the two pauses for the action of the amylolytic enzymes. The main sugar forming this extract was maltose. Glucose was the second most important one, and sucrose and fructose had little influence on the total fermentable extract amount. It was interesting that at the end of the mashing, the wort fermentation degree (calculated on the basis of the representatives of fermentable sugars studied) was about 62%, with 80% expected, which corresponded to standard lager wort. The wort fermentation rate (determined relative to the final wort extract) followed the linear trend characteristic of the fermentable extract (Figure 8b).
As we have already noted, the accumulation of fermentable sugars in the specific fermentation mode during the pauses at 63 °C and 72 °C followed a linear trend (Figure 9). The coefficient in front of x (time) should be regarded as the rate of extract formation during the two pauses. In this case, the extract was formed at a rate of 0.1337 °P/min. This indicator could also be used as an indirect assessment of the diastatic strength of the malt, which is known to be in direct correlation with the β-amylase activity [7]. The free member represents the accumulated amount of extract at the beginning of the mashing process. It can be seen that about ¼ of the total wort extract accumulated at the beginning of the brewing and during the 50 °C pause. At the current stage of development of the industry, and especially in craft breweries, there is a tendency towards skipping the proteolytic 50 °C pause, relying on the occurrence of malt starch hydrolysis only in one extended pause at 63 °C. Perhaps such a process is justified from an energy consumption point of view; however, the formation of wort with a qualitative and quantitative composition of the extract suitable for fermentation occurs during each of the pauses; hence, we cannot recommend this kind of mashing mode. The resultant regression equation (Figure 9) can also be used to compare the extract formation rates when comparing different brewing modes for beer production.
As a result of the overall modeling process, a malt mixture was developed and a mashing mode was proposed for obtaining a light lager beverage. The next step that lies ahead is the selection of a yeast strain and the optimization of the fermentation mode, in order to obtain beer with the desired organoleptic profile.

4. Conclusions

A systematic approach to the optimization of the malt mixture and the mashing mode, aimed at obtaining light lager beer, was applied in the present work. As a result of the mixture optimization process and the study of the effects of various additives, the following optimum mixture was obtained: Pilsner malt: 92.6%, Caramel Pils: 5.2%, Caramel Munich 2: 1.2%, acidulated malt: 1% and CaCl2: 52.5 mg/50 g of malt. The biological value of the wort was also established through the phenolic compound content and the antioxidant potential, determined using four different methods. The wort was found to have significant potential and could therefore be also used to obtain functional beverages. The biological potential of the wort was largely determined by the more strongly colored Caramel Pils and Caramel Munich 2.
A dependency was proposed for determining the rate of extract formation during mashing. This dependency was based on the accumulation of fermentable sugars during the individual fermentation pauses.
The wort thus obtained will be tested with different yeast strains for the production of beer with a guaranteed organoleptic profile.

Supplementary Materials

The following supporting information can be downloaded at: https://www.mdpi.com/article/10.3390/app132011554/s1, ANOVA for malt mixture optimization.

Author Contributions

Conceptualization, G.K. and A.I.; methodology, G.K.; software, G.K.; validation, G.K.; formal analysis, A.I. and K.I.; investigation, A.I. and K.I.; resources, G.K.; data curation, G.K.; writing—original draft preparation, A.I. and K.I.; writing—review and editing, G.K.; visualization, A.I.; supervision, G.K.; project administration, G.K.; funding acquisition, G.K. All authors have read and agreed to the published version of the manuscript.

Funding

This research was funded by the Ministry of Education and Science of the Republic of Bulgaria under the project “Strengthening the research excellence and innovation capacity of University of Food Technologies—Plovdiv, through the sustainable development of tailor-made food systems with programmable properties“, as part of the European Scientific Networks National Programme funded by the Ministry of Education and Science of the Republic of Bulgaria (agreement № Д01-288/07.10.2020) and under the national program “Young scientists and postdoctoral fellows 2” of the Ministry of Education and Science of the Republic of Bulgaria.

Institutional Review Board Statement

Not applicable.

Informed Consent Statement

Not applicable.

Data Availability Statement

Not applicable.

Conflicts of Interest

The authors declare no conflict of interest.

References

  1. Hernández-Mora, Y.N.; Verde-Calvo, J.R.; Malpica-Sánchez, F.P.; Escalona-Buendía, H.B. Consumer Studies: Beyond Acceptability—A Case Study with Beer. Beverages 2022, 8, 80. [Google Scholar] [CrossRef]
  2. Violino, S.; Figorilli, S.; Costa, C.; Pallottino, F. Internet of beer: A review on smart technologies from mash to pint. Foods 2020, 9, 950. [Google Scholar] [CrossRef]
  3. Available online: https://www.brewersassociation.org/statistics-and-data/national-beer-stats/ (accessed on 2 September 2023).
  4. Villacreces, S.; Blanco, C.A.; Caballero, I. Developments and characteristics of craft beer production processes. Food Biosci. 2022, 45, 101495. [Google Scholar] [CrossRef]
  5. Aquilani, B.; Laureti, T.; Poponi, S.; Secondi, L. Beer choice and consumption determinants when craft beers are tasted: An exploratory study of consumer preferences. Food Qual. Prefer. 2015, 41, 214–224. [Google Scholar] [CrossRef]
  6. Basso, R.F.; Alcarde, A.R.; Portugal, C.B. Could non-Saccharomyces yeasts contribute on innovative brewing fermentations? Food Res. Int. 2016, 86, 112–120, ISSN 0963-9969. [Google Scholar] [CrossRef]
  7. Kunze, W. Technology Brewing and Malting, 5th ed.; VLB: Berlin, Germany, 2008; p. 946. [Google Scholar]
  8. Meussdoerffer, F.; Zarnkow, W. Starchy raw materials. In Handbook of Brewing: Processes, Technology, Markets; Eslinger, H.M., Ed.; Wiley-VCH Verlag GmbH & Co. KGaA: Weinheim, Germany, 2009; pp. 43–83. [Google Scholar] [CrossRef]
  9. Yorke, J.; Cook, D.; Ford, R. Brewing with unmalted cereal adjuncts: Sensory and analytical impacts on beer quality. Beverages 2021, 7, 4. [Google Scholar] [CrossRef]
  10. Bogdan, P.; Kordialik-Bogacka, E. Alternatives to malt in brewing. Trends Food Sci. Technol. 2017, 65, 1–9. [Google Scholar] [CrossRef]
  11. Embashu, W.; Nantanga, K.K.M. Malts: Quality and phenolic content of pearl millet and sorghum varieties for brewing non-alcoholic beverages and opaque beers. Cereal Chem. 2019, 96, 765–774. [Google Scholar] [CrossRef]
  12. Klose, C.; Mauch, A.; Wunderlich, S.; Thiele, F.; Zarnkow, M.; Jacob, F.; Arendt, E.K. Brewing with 100% oat malt. J. Inst. Brew. 2011, 117, 411–421. [Google Scholar] [CrossRef]
  13. Wang, Y. Malting Conditions for Evaluation of Rye Cultivars; North Dakota State University of Agriculture and Applied Science: Fargo, ND, USA, 2017. [Google Scholar]
  14. Wang, Y.; Jin, Z.; Barr, J.; Gillespie, J.; Simsek, S.; Horsley, R.D.; Schwarz, P.B. Micro-malting for the quality evaluation of rye (Secale cereale) genotypes. Fermentation 2018, 4, 50. [Google Scholar] [CrossRef]
  15. Adetunji, A.I.; Khoza, S.; de Kock, H.L.; Taylor, J.R.N. Influence of sorghum grain type on wort physico-chemical and sensory quality in a whole-grain and commercial enzyme mashing process. J. Inst. Brew. 2013, 119, 156–163. [Google Scholar] [CrossRef]
  16. De Meo, B.; Freeman, G.; Marconi, O.; Booer, C.; Perretti, G.; Fantozzi, P. Behaviour of malted cereals and pseudocereals for gluten-free beer production. J. Inst. Brew. 2011, 117, 541–546. [Google Scholar] [CrossRef]
  17. Kordialik-Bogacka, E.; Bogdan, P.; Pielech-Przybylska, K.; Michałowska, D. Suitability of unmalted quinoa for beer production. J. Sci. Food Agric. 2018, 98, 5027–5036. [Google Scholar] [CrossRef] [PubMed]
  18. Zarnkow, M.; Kessler, M.; Burberg, F.; Kreisz, S.; Back, W. Gluten free beer from malted cereals and pseudocereals. In Proceedings of the European Brewing Convention Congress, Prague, Czech Republic, 14–19 May 2005; Fachverlag Hans Carl: Nűrnberg, Germany, 2005; pp. 104/1–104/8. [Google Scholar]
  19. Fujita, A.; Simsek, S.; Schwarz, P.B. Observations on the Malting of Ancient Wheats: Einkorn, Emmer and Spelt. Fermentation 2020, 6, 125. [Google Scholar] [CrossRef]
  20. Pluháčková, H.; Gregor, T.; Boško, R.; Běláková, S.; Svoboda, Z.; Benešová, K. Fortification of beer with extracts of the selected czech medicinal herbs and plants. Kvas. Prum. 2020, 66, 314–319. [Google Scholar] [CrossRef]
  21. Đorđević, S.; Popović, D.; Despotović, S.; Veljović, M.; Atanacković, M.; Cvejić, J.; Nedović, V.; Leskošek-Čukalović, I. Extracts of medicinal plants as functional beer additives. Chem. Ind. Chem. Eng. Q 2016, 22, 301–308. [Google Scholar] [CrossRef]
  22. Available online: https://www.craftbeer.com/news/flower-power-brewing-with-summers-blossoms (accessed on 2 September 2023).
  23. Zapata, P.J.; Martínez-Esplá, A.; Gironés-Vilaplana, A.; Santos-Lax, D.; Noguera-Artiaga, L.; Carbonell-Barrachina, A.A. Phenolic, volatile, and sensory profiles of beer enriched by macerating quince fruits. LWT 2019, 103, 139–146. [Google Scholar] [CrossRef]
  24. Zhao, X.; Yin, Y.; Fang, W.; Yang, Z. What happens when fruit married with beer? Int. J. Gastron. Food Sci. 2023, 32, 100716. [Google Scholar] [CrossRef]
  25. Capece, A.; Romaniello, R.; Siesto, G.; Romano, P. Conventional and non-conventional yeasts in beer production. Fermentation 2018, 4, 38. [Google Scholar] [CrossRef]
  26. Sannino, C.; Mezzasoma, A.; Buzzini, P.; Turchetti, B. Non-conventional yeasts for producing alternative beers. In Non-Conventional Yeasts: From Basic Research to Application; Sibirny, A., Ed.; Springer: Cham, Switzerland, 2019; pp. 361–388. [Google Scholar]
  27. Budroni, M.; Zara, G.; Ciani, M.; Comitini, F. Saccharomyces and non-Saccharomyces starter yeast. In Brewing Technology; Kanauchi, M., Ed.; INTECH: Rijeka, Croatia, 2017; pp. 81–100. [Google Scholar]
  28. González-Salitre, L.; González-Olivares, L.G.; Basilio-Cortes, U.A. Humulus lupulus L. a potential precursor to human health: High hops craft beer. Food Chem. 2023, 405, 134959. [Google Scholar] [CrossRef]
  29. Oladokun, O.; James, S.; Cowley, T.; Dehrmann, F.; Smart, K.; Hort, J.; Cook, D. Perceived bitterness character of beer in relation to hop variety and the impact of hop aroma. Food Chem. 2017, 230, 215–224. [Google Scholar] [CrossRef] [PubMed]
  30. Shopska, V.; Denkova-Kostova, R.; Dzhivoderova-Zarcheva, M.; Teneva, D.; Denev, P.; Kostov, G. Comparative study on phenolic content and antioxidant activity of different malt types. Antioxidants 2021, 10, 1124. [Google Scholar] [CrossRef] [PubMed]
  31. Carvalho, D.O.; Correia, E.; Lopes, L.; Guido, L.F. Further insights into the role of melanoidins on the antioxidant potential of barley malt. Food Chem. 2014, 160, 127–133. [Google Scholar] [CrossRef] [PubMed]
  32. Shopska, V.; Denkova-Kostova, R.; Kostov, G. Modeling in Brewing—A Review. Processes 2022, 10, 267. [Google Scholar] [CrossRef]
  33. Kostov, G.; Shopska, V.; Denkova-Kostova, R.; Ivanova, K. Mixture modeling as a way for optimization of wort in beer production. In Proceedings of the European Council for Modelling and Simulation, Florence, Italy, 20–23 June 2023; pp. 186–193. [Google Scholar] [CrossRef]
  34. Shopska, V.; Teneva, D.; Denkova-Kostova, R.; Ivanova, K.; Denev, P.; Kostov, G. Modelling of Malt Mixture for the Production of Wort with Increased Biological Value. Beverages 2022, 8, 44. [Google Scholar] [CrossRef]
  35. BestMalz Catalog. Available online: https://bestmalz.de/ (accessed on 20 April 2021).
  36. Analytica (Version 2019)—European Brewing Convention. Available online: https://brewup.eu/ebcanalytica (accessed on 20 August 2023).
  37. Ivanov, K.; Petelkov, I.; Shopska, V.; Denkova, R.; Gochev, V.; Kostov, G. Investigation of mashing modes for low-alcohol beer production. J. Inst. Brew. 2016, 122, 508–516. [Google Scholar] [CrossRef]
  38. Bernstein, L.; Willox, I.C. Water. In The Practical Brewer; Broderick, H.M., Ed.; Master Brewers Association of the Americas: Madison, WI, USA, 1977; pp. 13–20. [Google Scholar]
Figure 1. Mashing mode.
Applsci 13 11554 g001
Figure 2. Scheme for the mashing mode optimization. (S: sample point).
Applsci 13 11554 g002
Figure 3. Response surface for different target functions, “,” denotes decimal point.
Applsci 13 11554 g003
Figure 4. Multi-target optimization of the malt mixture, “,” denotes decimal point.
Applsci 13 11554 g004
Figure 5. Investigation of the influence of CaCl2.
Applsci 13 11554 g005
Figure 6. Investigation of the influence of lactic acid.
Applsci 13 11554 g006
Figure 7. Investigation of the influence of the addition of acidulated malt.
Applsci 13 11554 g007
Figure 8. Changing the total and fermentable extract during mashing.
Applsci 13 11554 g008
Figure 9. Rate of extract formation during mashing.
Applsci 13 11554 g009
Table 1. Content of the different malts in the malt mixtures in coded and real levels.
Pilsner (P)Caramel Pils (CP)Caramel Munich Type 2 (CM2) Pilsner (P)Caramel Pils (CP)Caramel Munich Type 2 (CM2)
%g
10.3330.0000.66716.670.0033.33
21.0000.0000.00050.000.000.00
30.3330.3330.33316.6716.6716.67
40.1670.1670.6678.338.3333.33
50.0001.0000.0000.0050.000.00
60.6670.0000.33333.330.0016.67
70.0000.6670.3330.0033.3316.67
80.6670.3330.00033.3316.670.00
90.0000.0001.0000.000.0050.00
100.1670.6670.1678.3333.338.33
110.6670.1670.16733.338.338.33
120.0000.3330.6670.0016.6733.33
130.3330.6670.00016.6733.330.00
140.3330.3330.33316.6716.6716.67
151.0000.0000.00050.000.000.00
160.6670.3330.00033.3316.670.00
Table 2. Extract, color, phenolic compound content and antioxidant activity of the individual experimental variants.
VariantExtractColorFCDPPHFRAPCUPRACABTS
°PEBC Unitsmg/dm3μmol TROLOX/dm3
113.070247.5001274.080781.9101313.5405621.6707783.310
213.5905.750397.600333.360688.5401682.7802266.760
312.930200.000896.530597.670953.1304488.3305850.640
412.740142.5001214.900840.0401403.1306216.1107007.420
512.2409.330496.580294.980644.7902388.3302488.950
612.96082.500830.920561.4801140.6303860.5604180.850
712.31090.000902.350586.7001113.5404377.2204216.120
812.4308.250415.460310.330651.0402460.5602164.490
911.600205.0001651.6301091.1801919.7908076.6708432.240
1012.43035.000667.650451.810913.5403238.3303807.010
1112.84040.000660.510478.130932.2903055.0003785.850
1211.740135.0001241.430876.2301551.0406421.1107317.780
1312.36010.900500.660287.300578.1302293.8902192.700
1412.88097.500937.350581.2201115.6304416.1103066.390
1513.1908.480419.540280.720694.7901721.6702227.970
1612.9609.300474.130287.300657.2902199.4402287.920
2,2-diphenyl-1-picrylhydrazyl (DPPH); 2,2-azinobis-(3-ethylbenzothiazoline-6-sulfonate (ABTS); ferric reducing ability of plasma (FRAP); cupric reducing antioxidant capacity (CUPRAC)
Table 3. Optimized malt mixture.
FactorLowHighOptimum, %Optimum, g
Factors
Pilsner0.01.093.646.8
Caramel Pils0.01.05.22.6
Caramel Munich 20.01.01.20.6
Optimum responses/calculated/
ColorEBC8.0-
Extract°P13.22-
FCmg/dm3925.24-
DPPHμmol TROLOX/dm3320.69-
FRAP767.07-
CUPRAC1922.62-
ABTS2472.58-
Disclaimer/Publisher’s Note: The statements, opinions and data contained in all publications are solely those of the individual author(s) and contributor(s) and not of MDPI and/or the editor(s). MDPI and/or the editor(s) disclaim responsibility for any injury to people or property resulting from any ideas, methods, instructions or products referred to in the content.

