Article

Experimental Study on Macroscopic Mechanical Characteristics and Microscopic Pore Structure Evolution of Soil–Rock Mixture under Repeated Freeze–Thaw Cycles

1
School of Resources and Safety Engineering, Central South University, Changsha 410083, China
2
Sinosteel Maanshan Mine Research Institute Co., Ltd., Maanshan 243000, China
*
Authors to whom correspondence should be addressed.
Appl. Sci. 2023, 13(20), 11504; https://doi.org/10.3390/app132011504
Submission received: 2 October 2023 / Revised: 14 October 2023 / Accepted: 16 October 2023 / Published: 20 October 2023
(This article belongs to the Special Issue Structural Mechanics in Materials and Construction)

Abstract

:
The response characteristics of the mesostructure and macro-characteristics of the soil–rock mixture under repeated freeze–thaw action have an important influence on the safety and stability of the dump slope in low-temperature environments. In order to further understand the multi-scale response behavior of a soil–rock mixture under freeze–thaw cycles, this paper carried out indoor freeze–thaw cycles, uniaxial compression, and electrochemical impedance spectroscopy tests on a soil–rock mixture taken from a graphite mine dump in Jixi City, Heilongjiang Province, China. Combined with the simulation calculation of discrete element numerical software (PFC2D 7.0), the effects of freeze–thaw cycling on electrochemical impedance spectrometry (EIS) mesoscopic parameters, uniaxial compressive strength, and crack propagation of soil–rock mixtures were analyzed. The intrinsic relationship between mesoparameters and macroscopic mechanical properties was established. The results showed that as the number of freeze–thaw cycles increases from 0 to 15, the mesopores inside the soil–rock mixture gradually increase, and the angular similarity of distribution characteristics increases by 5.25%. The uniaxial compressive strength and the peak secant modulus increase exponentially with the increase in the number of freeze–thaw cycles, the uniaxial compressive strength decreases by 47.62%, and the peak secant modulus decreases by 75.87%. The peak strain and pore compaction stage showed an exponential increase and an increasing trend, respectively, and the peak strain increased from 2.115% to 4.608%. The failure mode was basically similar in different cycles; the failure cracks extended from the corners to the middle and lower parts before the failure finally occurred. The types of failure cracks were mainly tensile cracks, followed by tensile shear cracks and the fewest compression shear cracks. The similarity and uniaxial compressive strength conformed to a good linear relationship with the number of freeze–thaw cycles, with the uniaxial compressive strength decreasing linearly with the increase in similarity.

1. Introduction

The dump slope is a giant soil–rock mixture slope formed by artificial accumulation of waste rock blocks and topsoil of different radii during mining activities. The stability of the project has an important impact on the efficiency and economic effect of mineral resources exploitation. The bearing unit of dump engineering (soil–rock mixture) is a complex and uneven loose geotechnical medium material composed of block stone, fine-grained soil, and pores, and its mechanical properties are quite different from rock and soil. To ensure the safety and stability of the slope of the dumping site and improve the economic effect of resource development and utilization, it is of great significance to carry out the experimental study of the mechanical characteristics of the soil–rock mixture on the slope. Figure 1 shows the occurrence environment and morphological distribution of the soil–rock mixture on the slope of a typical mine dumpsite.
In recent years, many experts and scholars have carried out corresponding research on the mechanical characteristics of soil–rock mixtures. Xu carried out screening statistics on soil–rock mixtures near Longpan side drift, Tiger Leaping Gorge, China, and analyzed the fractal dimension law of soil–rock mixtures using fractal theory, establishing a quantitative relationship between fractal dimension and average particle size [1]. At the same time, the on-site in situ test and indoor mechanical test were carried out on the soil–rock mixture samples at the investigation site. The results showed that the size distribution and weight ratio of block stones have obvious effects on the mechanical properties [2]. The block stone would be damaged when the soil and rock mixture specimen is loaded, with the strength envelope conforming to the power law function [3]. Based on 3D scanning and discrete element numerical simulation technology, Yu carried out the direct shear test of soil–rock mixtures under different block stone content conditions, discussing the mechanical properties and failure mechanism of soil–rock mixture specimens under different axial stress conditions [4]. Kahraman carried out uniaxial compression and shear tests in soil–rock mixtures under different block stone ratios. It is proved that that the increase in the proportion of block stones interferes with the structural integrity, resulting in a decrease in uniaxial compressive strength [5]. However, the influence of the block rock ratio on the mechanical parameters of the shear test in the soil–rock mixture showed the opposite result [6]. When the internal stone content increased from 25% to 70%, the friction angle and cohesion changed significantly, with the shear strength increasing significantly [7]. Wei carried out direct shear tests of soil–rock mixtures under different moisture and stone content conditions. The results show that there is a negative correlation between moisture content and shear strength of soil–rock mixtures, with the shear strength gradually decreasing with the increase in moisture content. However, there was a positive correlation between stone content and the shear strength, with the shear strength gradually increasing with the increase in moisture content [8].
Based on the above research, it is found that rock and water content have an obvious influence on the mechanical properties of soil–rock mixtures [9]. However, in a low-temperature environment, when the temperature is lower than 0 °C, the water contained in the soil–rock mixture will undergo a water–ice phase transition. The volume expansion generated by the phase change will damage the internal mesoscopic pore structure, thereby causing the deterioration of the macroscopic mechanical properties. When the temperature is higher than 0 °C, the solid ice will melt into liquid water, entering the microscopic pore structure of the specimen to produce damage and freeze again [10]. This iterative freeze–thaw cycle will cause damage to the micropore structure and mechanical properties of the soil–rock mixture, which will lead to the unstable slide of slope engineering. In recent years, many experts and scholars have gradually paid attention to the influence of freeze–thaw cycles on the mesopore structure and macroscopic mechanical properties of soil–rock mixtures in low-temperature environments [11]. Tang carried out triaxial and nuclear magnetic resonance tests on FSRM (frozen soil–rock mixture) at different temperatures to elucidate the mechanism of the internal degradation of FSRM. The results show that under the action of temperature rise, the locking effect of the particle ice film is weakened, and the increase in water weakens the strain energy generated by the work of interlocking friction between particles in the shear process, which leads to the decrease in strength [12]. Zhou carried out research on the effect of freeze–thaw cycles on the mechanical properties of triaxial and shear tests of soil–rock mixtures with different water content and stone content [13]. The results showed that under repeated freeze–thaw cycles, the triaxial compressive strength of the soil–rock mixture has a linear relationship with the confining pressure, with the mechanical strength showing an increasing trend with the gradual increase in the confining pressure [14]. The number of freeze–thaw cycles and the stone content had a significant impact on the cohesion and internal friction angle. In addition, repeated freeze–thaw cycles weaken the bonding strength between soil and stone and between stone and stone, weakening their macroscopic physical properties [15]. Tang conducted the indoor freeze–thaw cycle test and shear test of the earth–rock mixture and detected the microscopic pores of samples with different freeze–thaw cycles based on the nuclear magnetic resonance system, discussing the influence of freeze–thaw cycles on the micropores and macroscopic mechanical properties [16]. The experimental results showed that with the increase in the number of freeze–thaw cycles, the internal porosity showed a trend of first increasing, then decreasing, and then increasing. The skeleton structure inside the specimen would loosen, with the peak shear strength showing a clear decreasing trend [17].
In summary, freeze–thaw cycling has obvious effects on the micropore structure and macroscopic mechanical properties of soil–rock mixtures. However, through previous studies, it can be found that most studies mainly analyze the macroscopic mechanical behavior of soil–rock mixtures, and there are few studies on the microstructure of soil–rock mixtures under cyclic freezing and thawing. The detection of soil–rock mixtures by nuclear magnetic resonance systems also has certain limitations. There is also a lack of research on the establishment of the internal relationship between the microscopic parameters of the soil–rock mixture and the macroscopic mechanics. So, in this paper, an indoor freeze–thaw cycle test and a uniaxial compression test were carried out on the soil–rock mixture taken from the surface layer of a graphite mine in Jixi City, Heilongjiang. Based on the electrochemical comprehensive test system, the impedance spectra of soil–rock mixtures under different freeze–thaw cycles were detected. The mechanism of freeze–thaw cycles in the microscopic pore structure of the soil–rock mixture was analyzed with the characteristic parameters of impedance spectroscopy, with the intrinsic relationship between the characteristic parameters of the impedance spectrum and the macroscopic mechanical properties established. In addition, the uniaxial compression test of the soil–rock mixture under different freeze–thaw cycles was numerically simulated by combining the particle flow program (PFC2D), and the crack propagation law of soil–rock mixtures under different freeze–thaw cycles is discussed. The research results can provide a reference for the safety and stability of the slope of dumping sites in low-temperature environments.

2. Materials and Methods

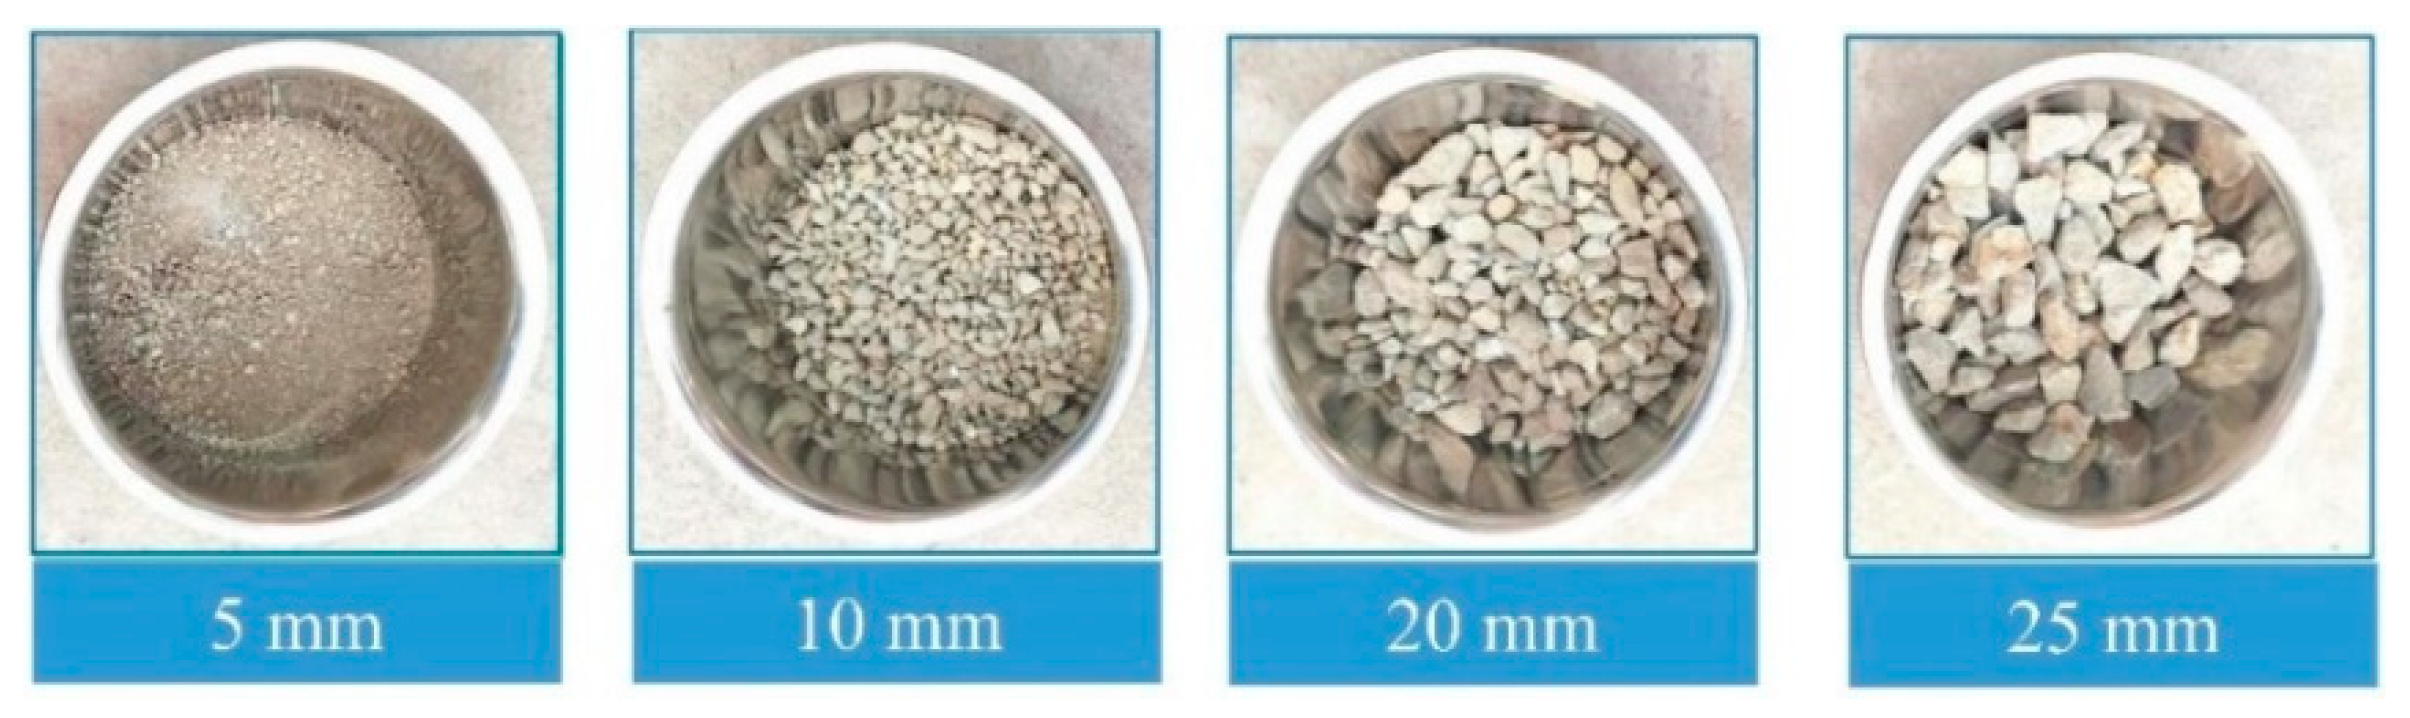
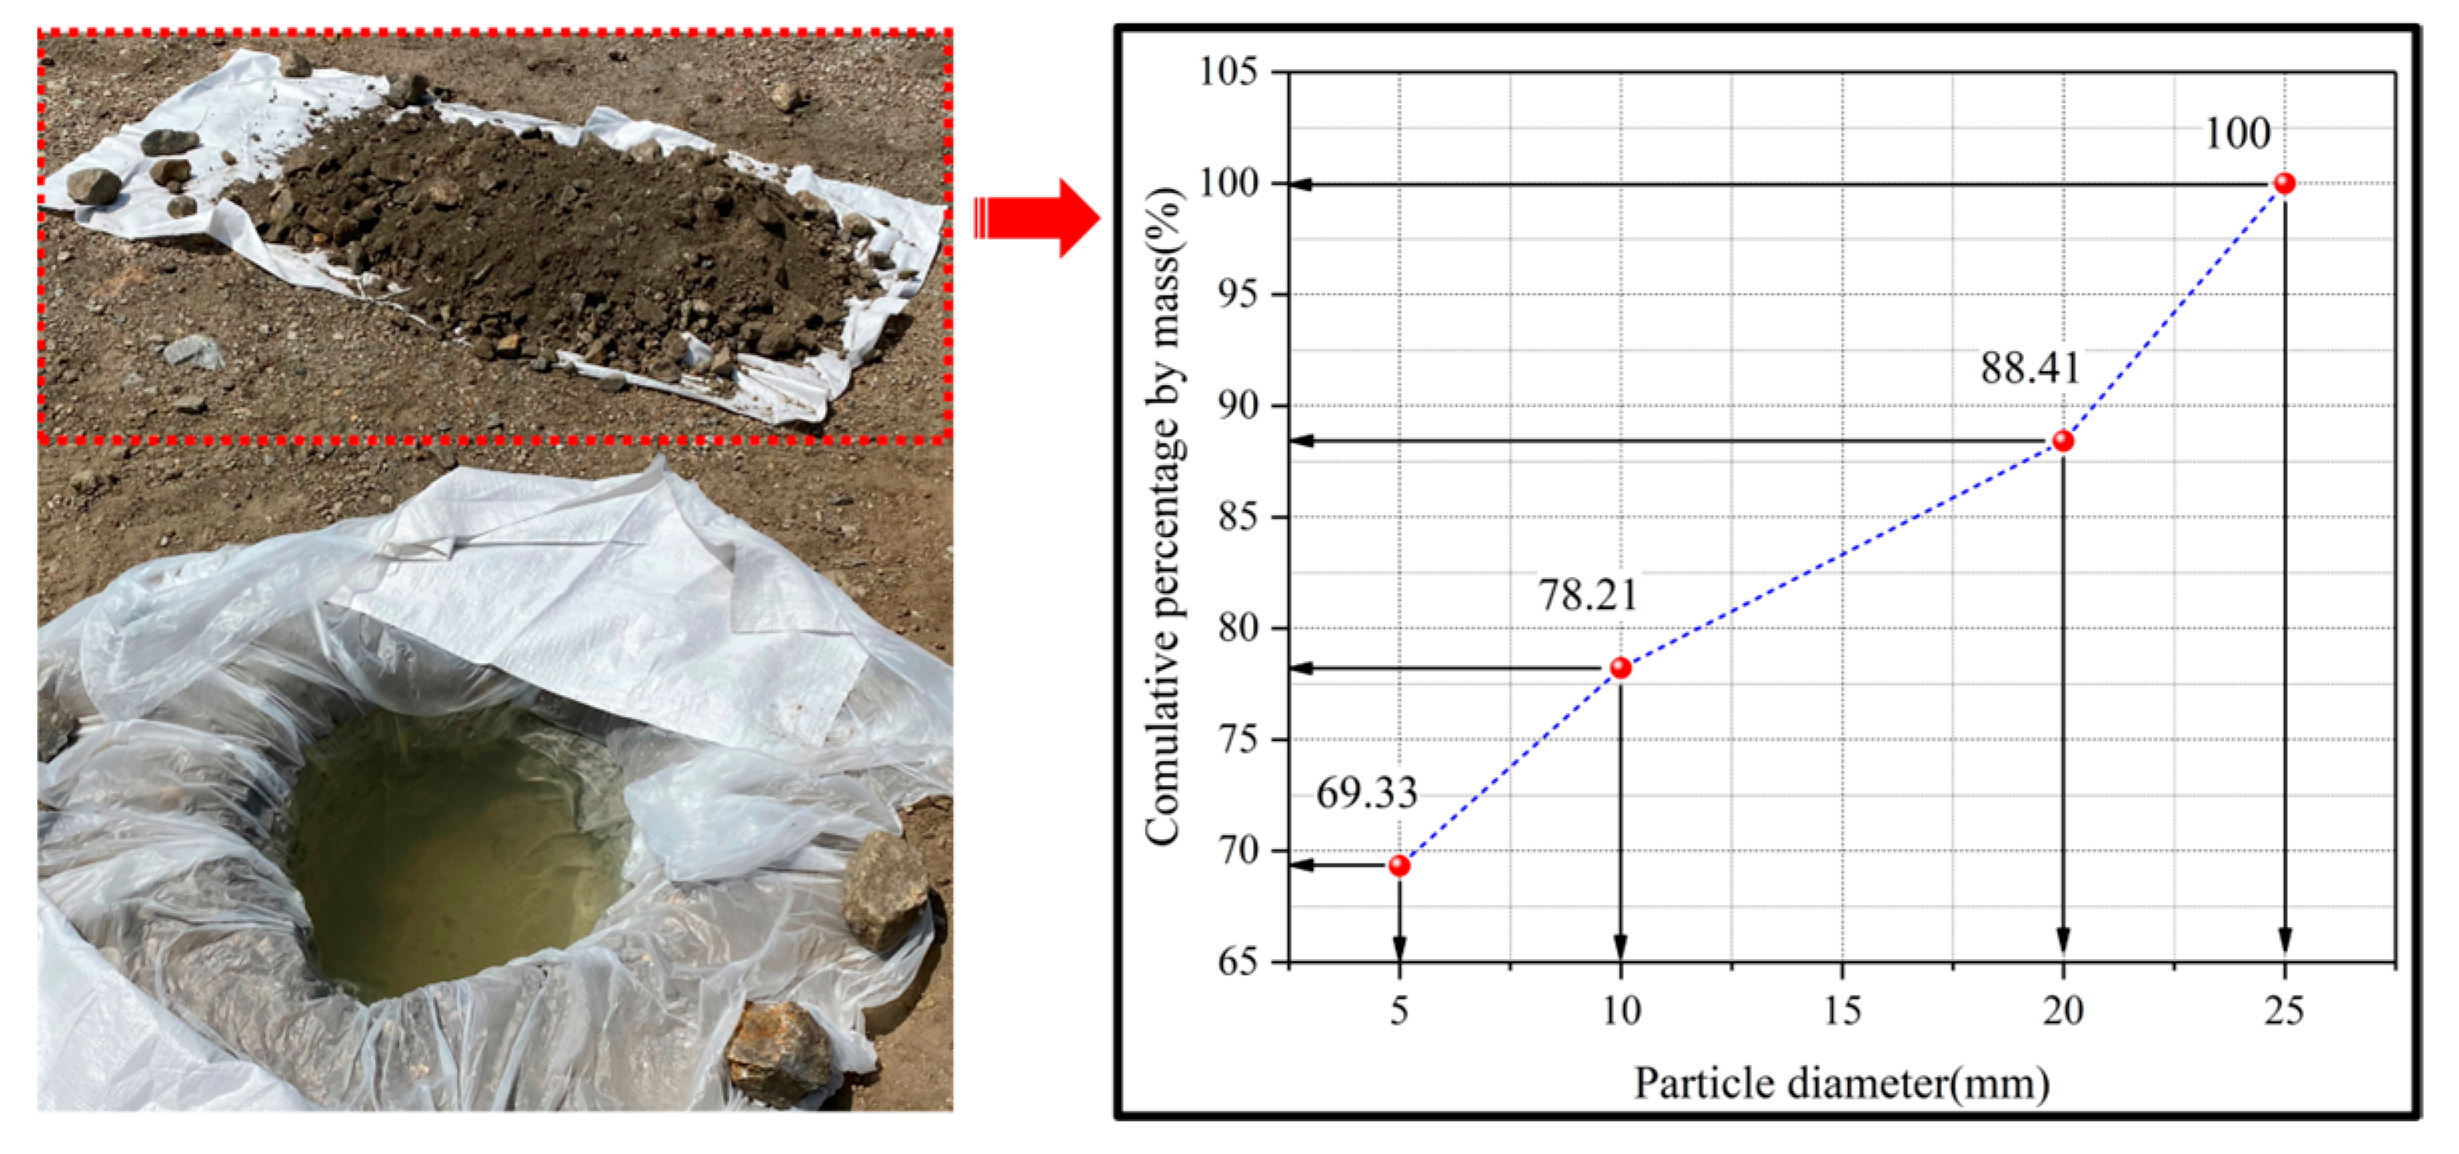
2.1. Test Materials and Specimens

The soil and stone materials of different particle sizes used in this test were taken from the slope of a graphite mine dumping site in Jixi City, Heilongjiang. Heilongjiang Jixi City is located in northeast China and its climatic conditions belong to the obvious temperate monsoon climate. The summer average high temperature is higher than 20 °C and in the winter, the average low temperature is close to minus 20 °C (as shown in Figure 2), which is a typical seasonal frozen ground area with obvious freezing and thawing processes.
In the study of soil–rock mixtures, the determination of the soil–rock threshold has a significant impact on the microscopic pore structure and macroscopic mechanical properties. Based on the current research on existing soil–rock mixtures, the threshold value selected for this experiment is 0.05 [18]. The calculation expression is as follows:
d S / R L c = 0.05
In the formula, d S / R is the soil–rock threshold and L c is the height of the direct shear test box. Because the shape of the soil–rock mixture is a cube with a side length of 100 mm, the threshold for dividing the soil and stone particle size is 5 mm ( d S / R = 100 × 0.05 = 5   mm ). Materials with a particle size greater than 5 mm are stone, and those with a particle size of less than 5 mm are soil (as shown in Figure 3) [19]. The soil and stone with different particle sizes were taken from the surface of the dumping site. Through the on-site screening test and equivalent substitution method, the mass proportion of soil (5 mm) required for the sample was 69.33%, and the proportion of stone with different particle sizes was 8.88% (10 mm), 10.20% (20 mm), and 11.59% (25 mm). The detailed gradation curve is shown in Figure 4.
In the process of specimen production, the soil and stone materials are first weighed according to different mass proportions and then stirred with the aqueous solution. To fully contact the aqueous solution with the soil and stone, the evenly stirred soil–rock mixture was sealed into the stirring container and allowed to stand for 24 h; then, the prepared mold was filled. Finally, demolding and numbering were carried out. To prevent the moisture content from changing in the subsequent test, the specimen was fully wrapped in plastic wrap after demolding until the end of repeated freeze–thaw cycle tests.

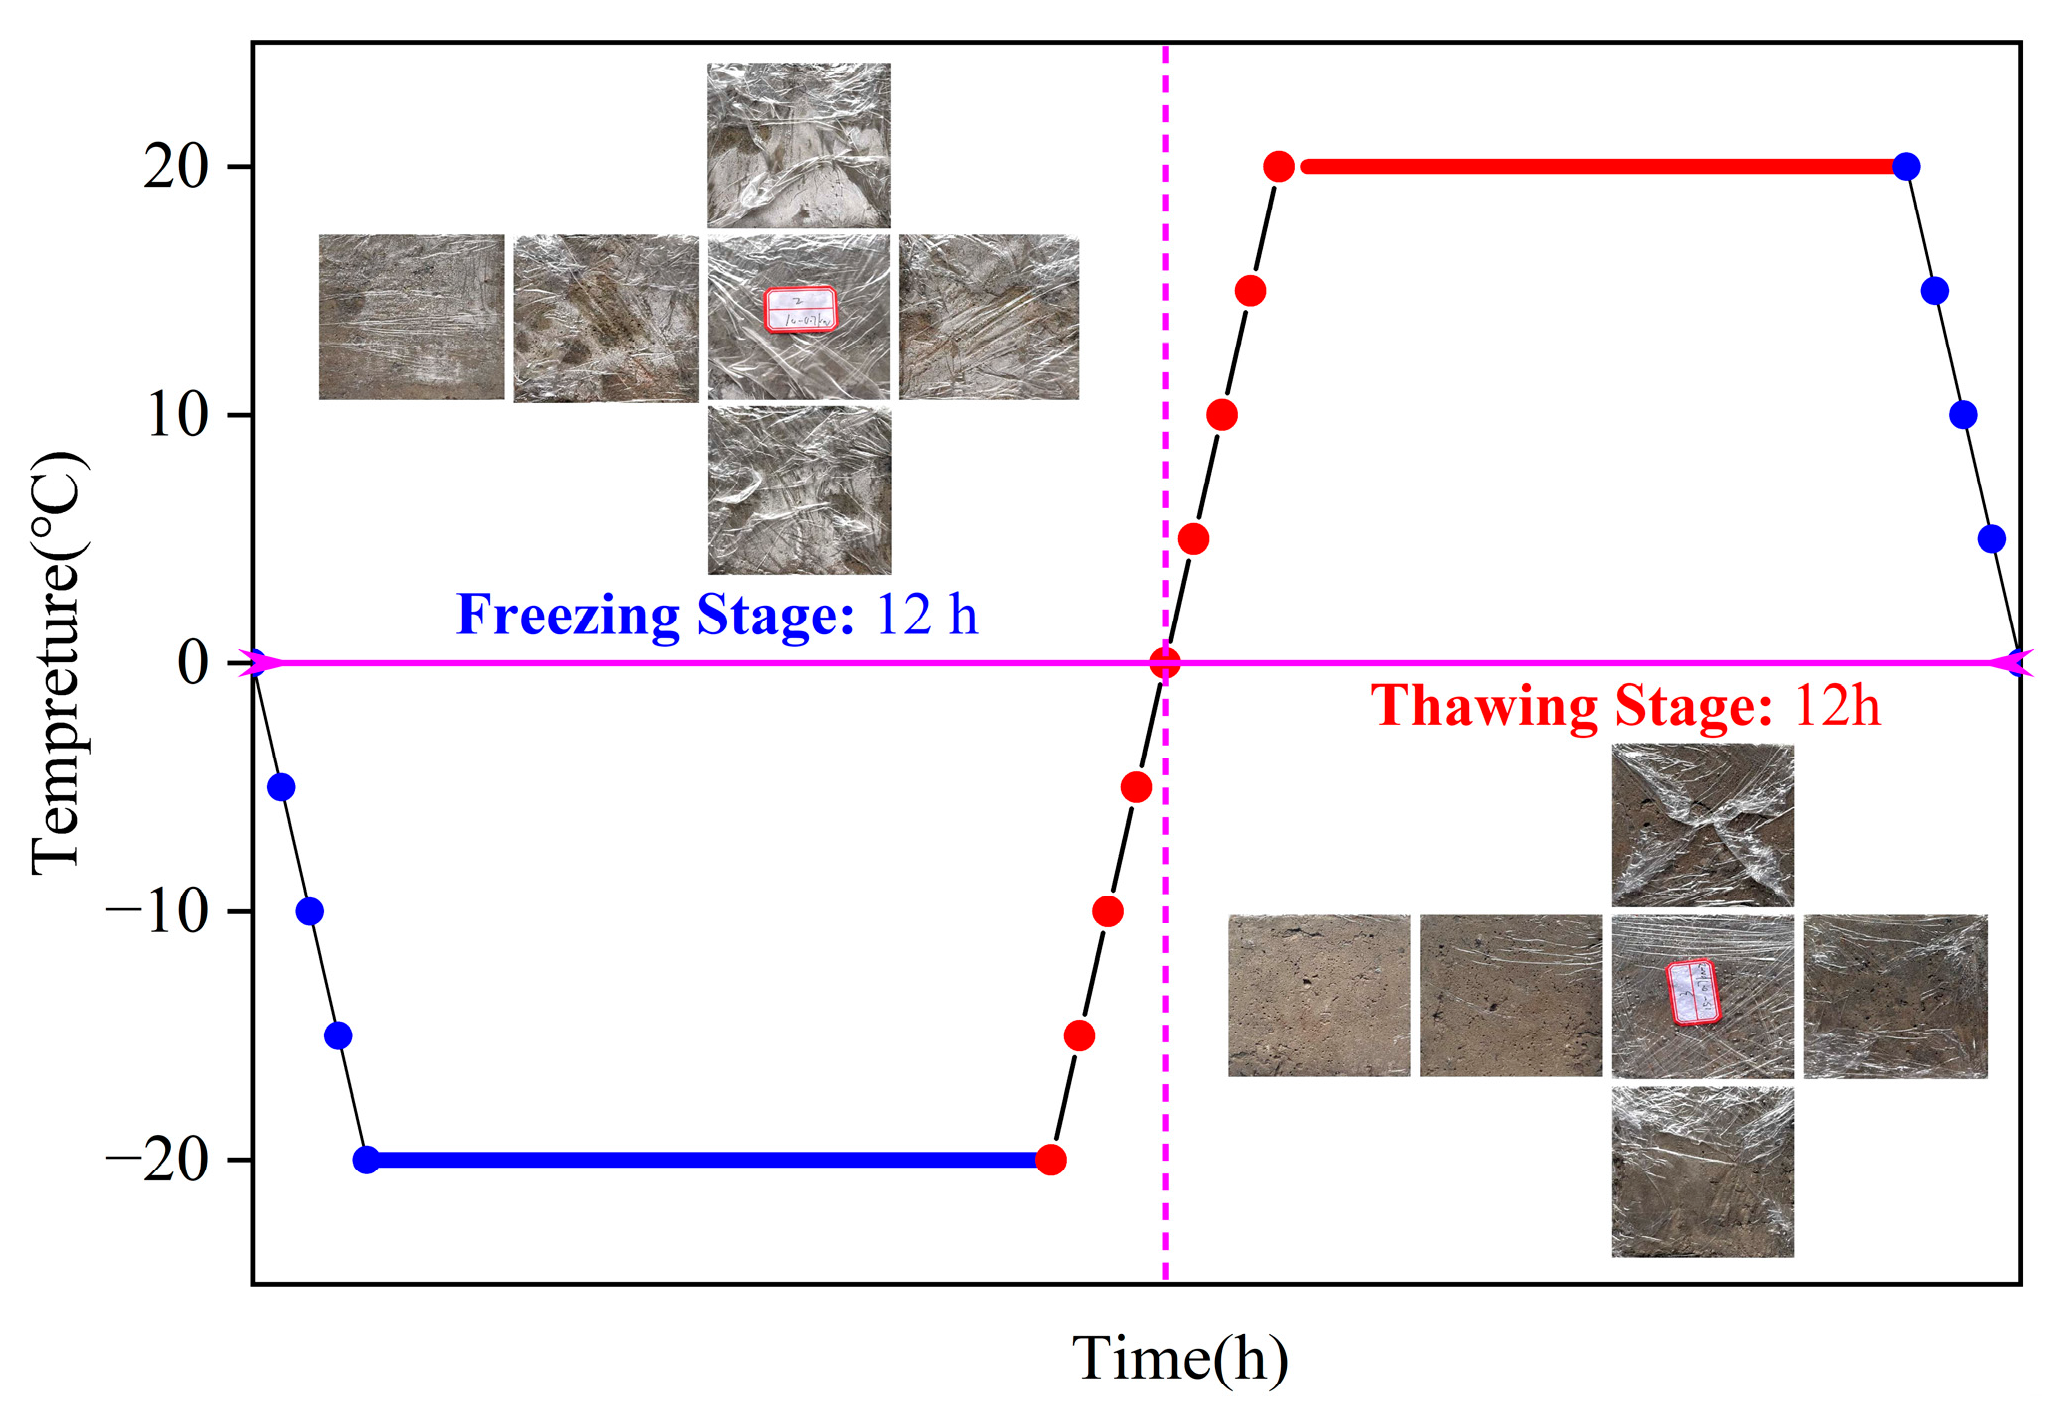
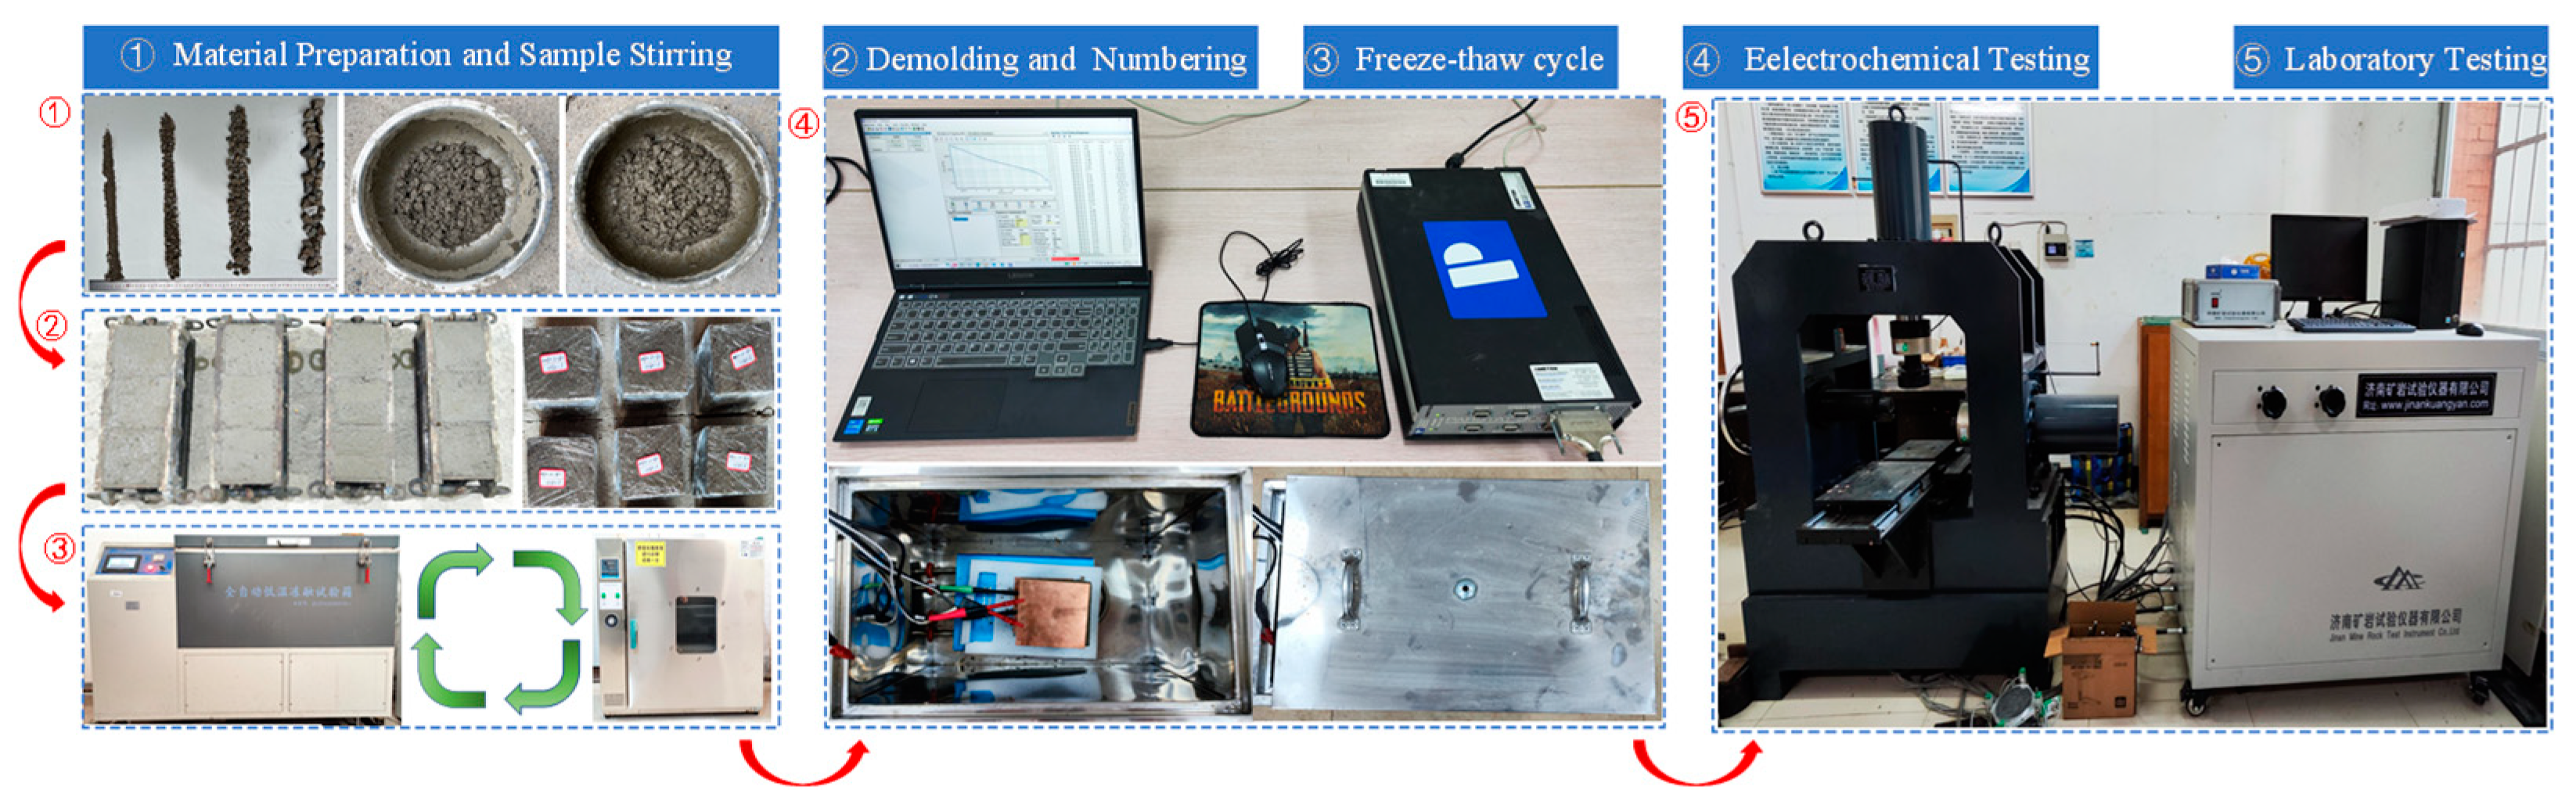
2.2. Freeze–Thaw Cycle Test

Because of the particularity of the soil–rock mixture sample, the implementation method of this freeze–thaw cycle experiment is in gas-freeze and gas-thaw mode. The freezing phase and the thawing phase were carried out in a cryogenic test chamber and a drying chamber, respectively. The low-temperature chamber is a low-temperature freeze–thaw test chamber produced by China Beijing Zhongtest Sanyou Technology Co., Ltd. and the drying chamber is an electric heating constant temperature laboratory dryer produced by Shangcheng Instrument Business Department of Shaoxing City, Zhejiang Province. Based on the statistical results of the 2019–2021 temperature in Jixi City (Figure 1) and the current soil–rock mixture freeze–thaw cycle test, the freezing temperature was set at −20 °C with a freezing time of 12 h. The thawing temperature was set at 20 °C with a thawing time of 12 h. The number of freeze–thaw cycles was set by reference to the life of the dump, of which the graphite mine dump was designed to last 13 years. To facilitate the freeze–thaw test, a total of 15 freeze–thaw cycles were set up, and 0, 5, 10, and 15 freeze–thaw cycles were carried out in turn. The complete freeze–thaw process is shown in Figure 5.

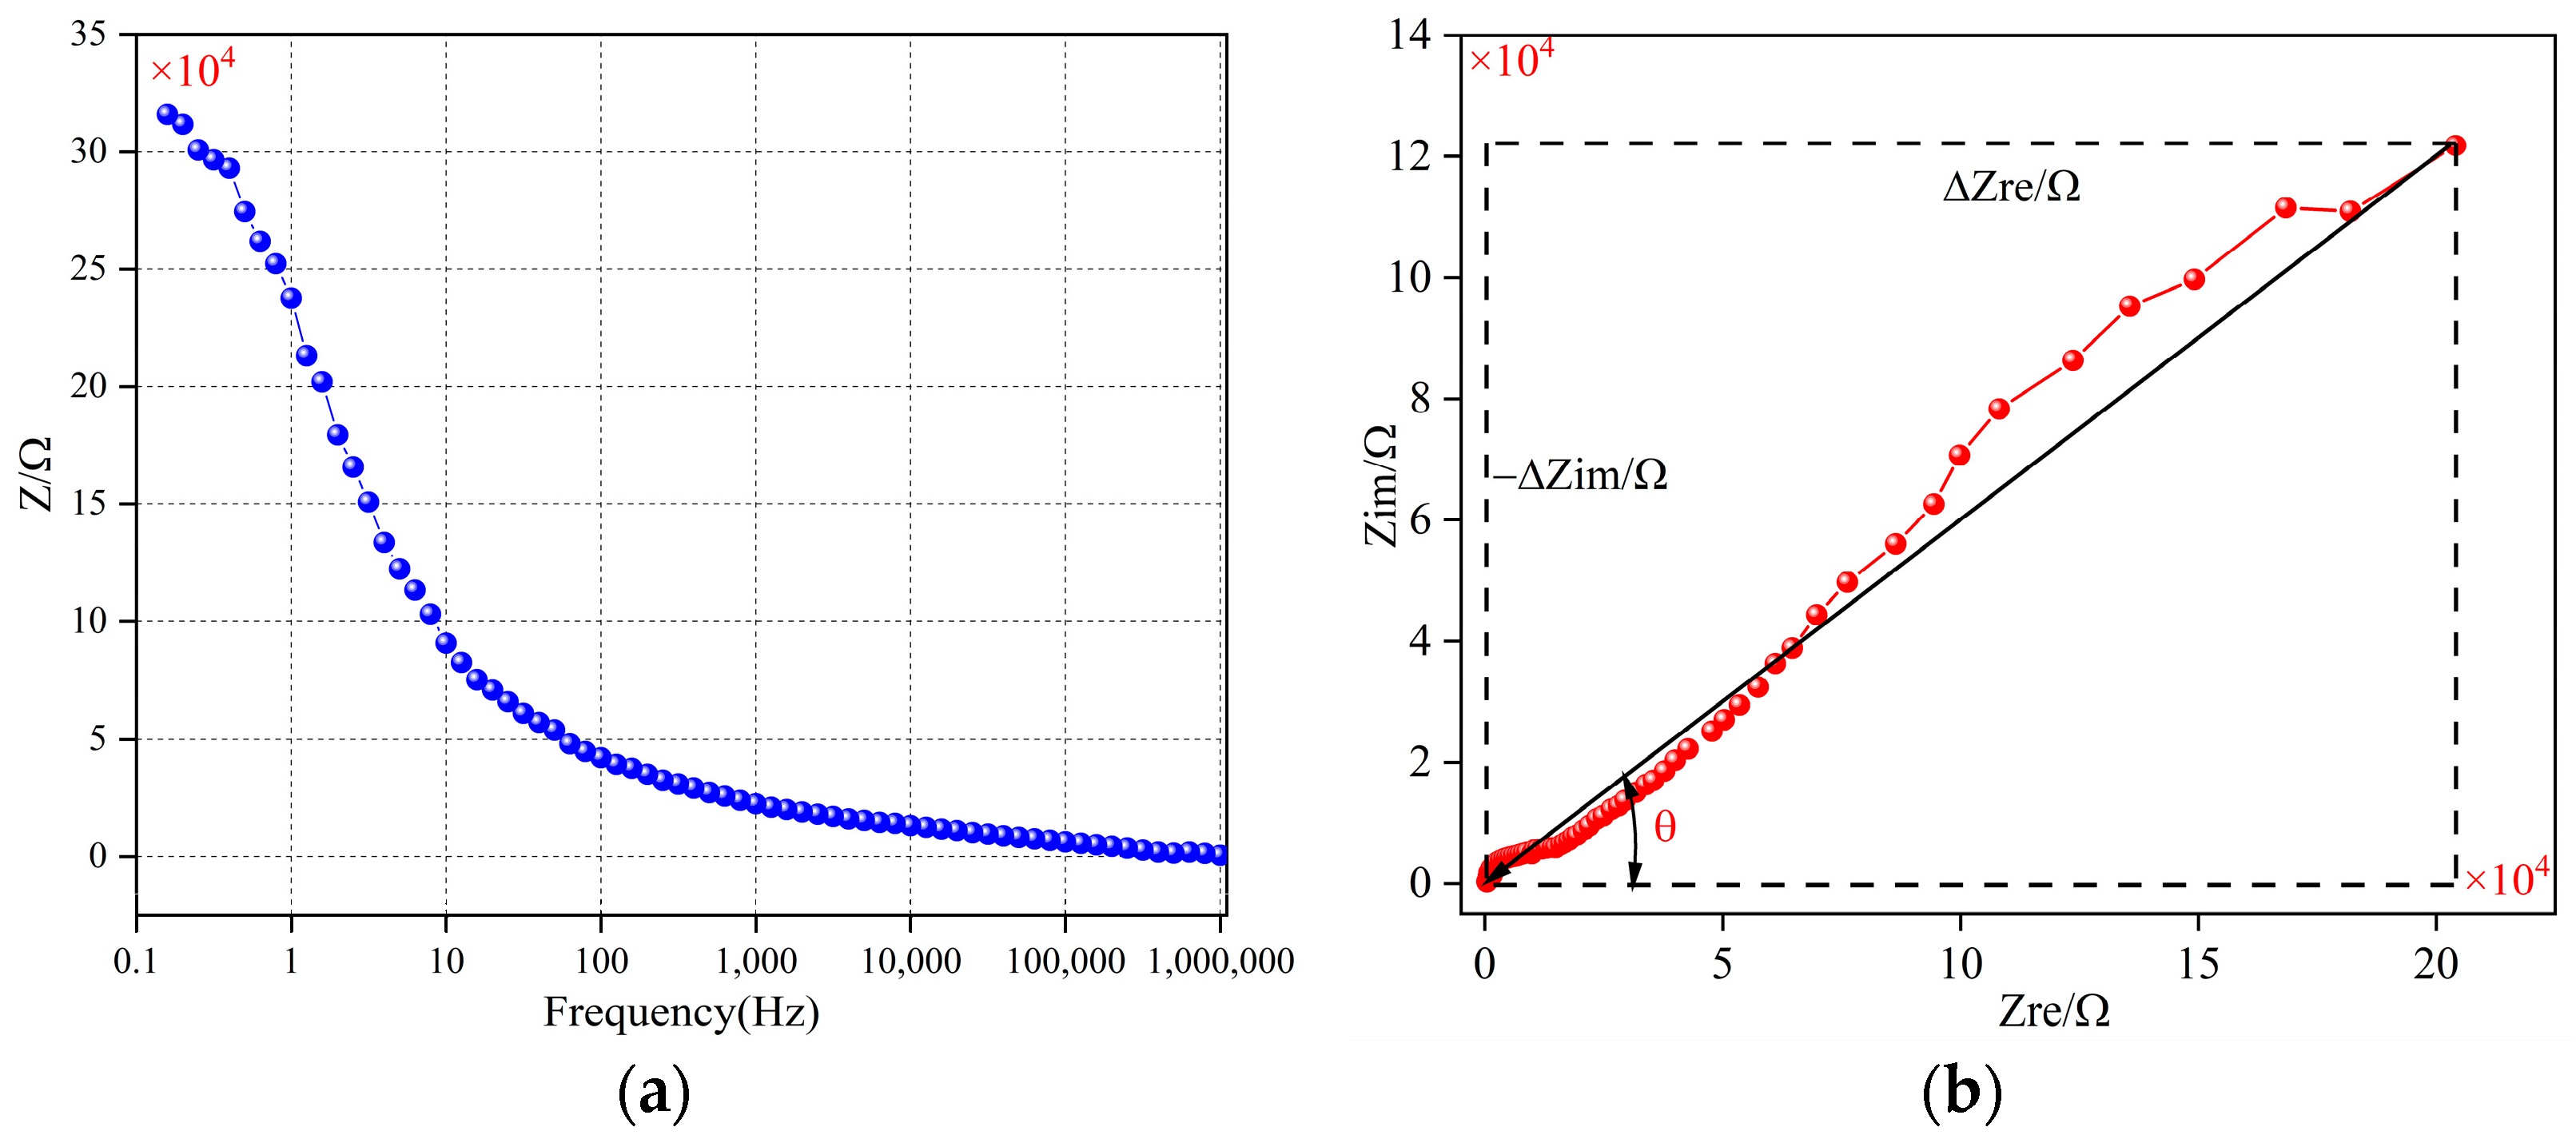
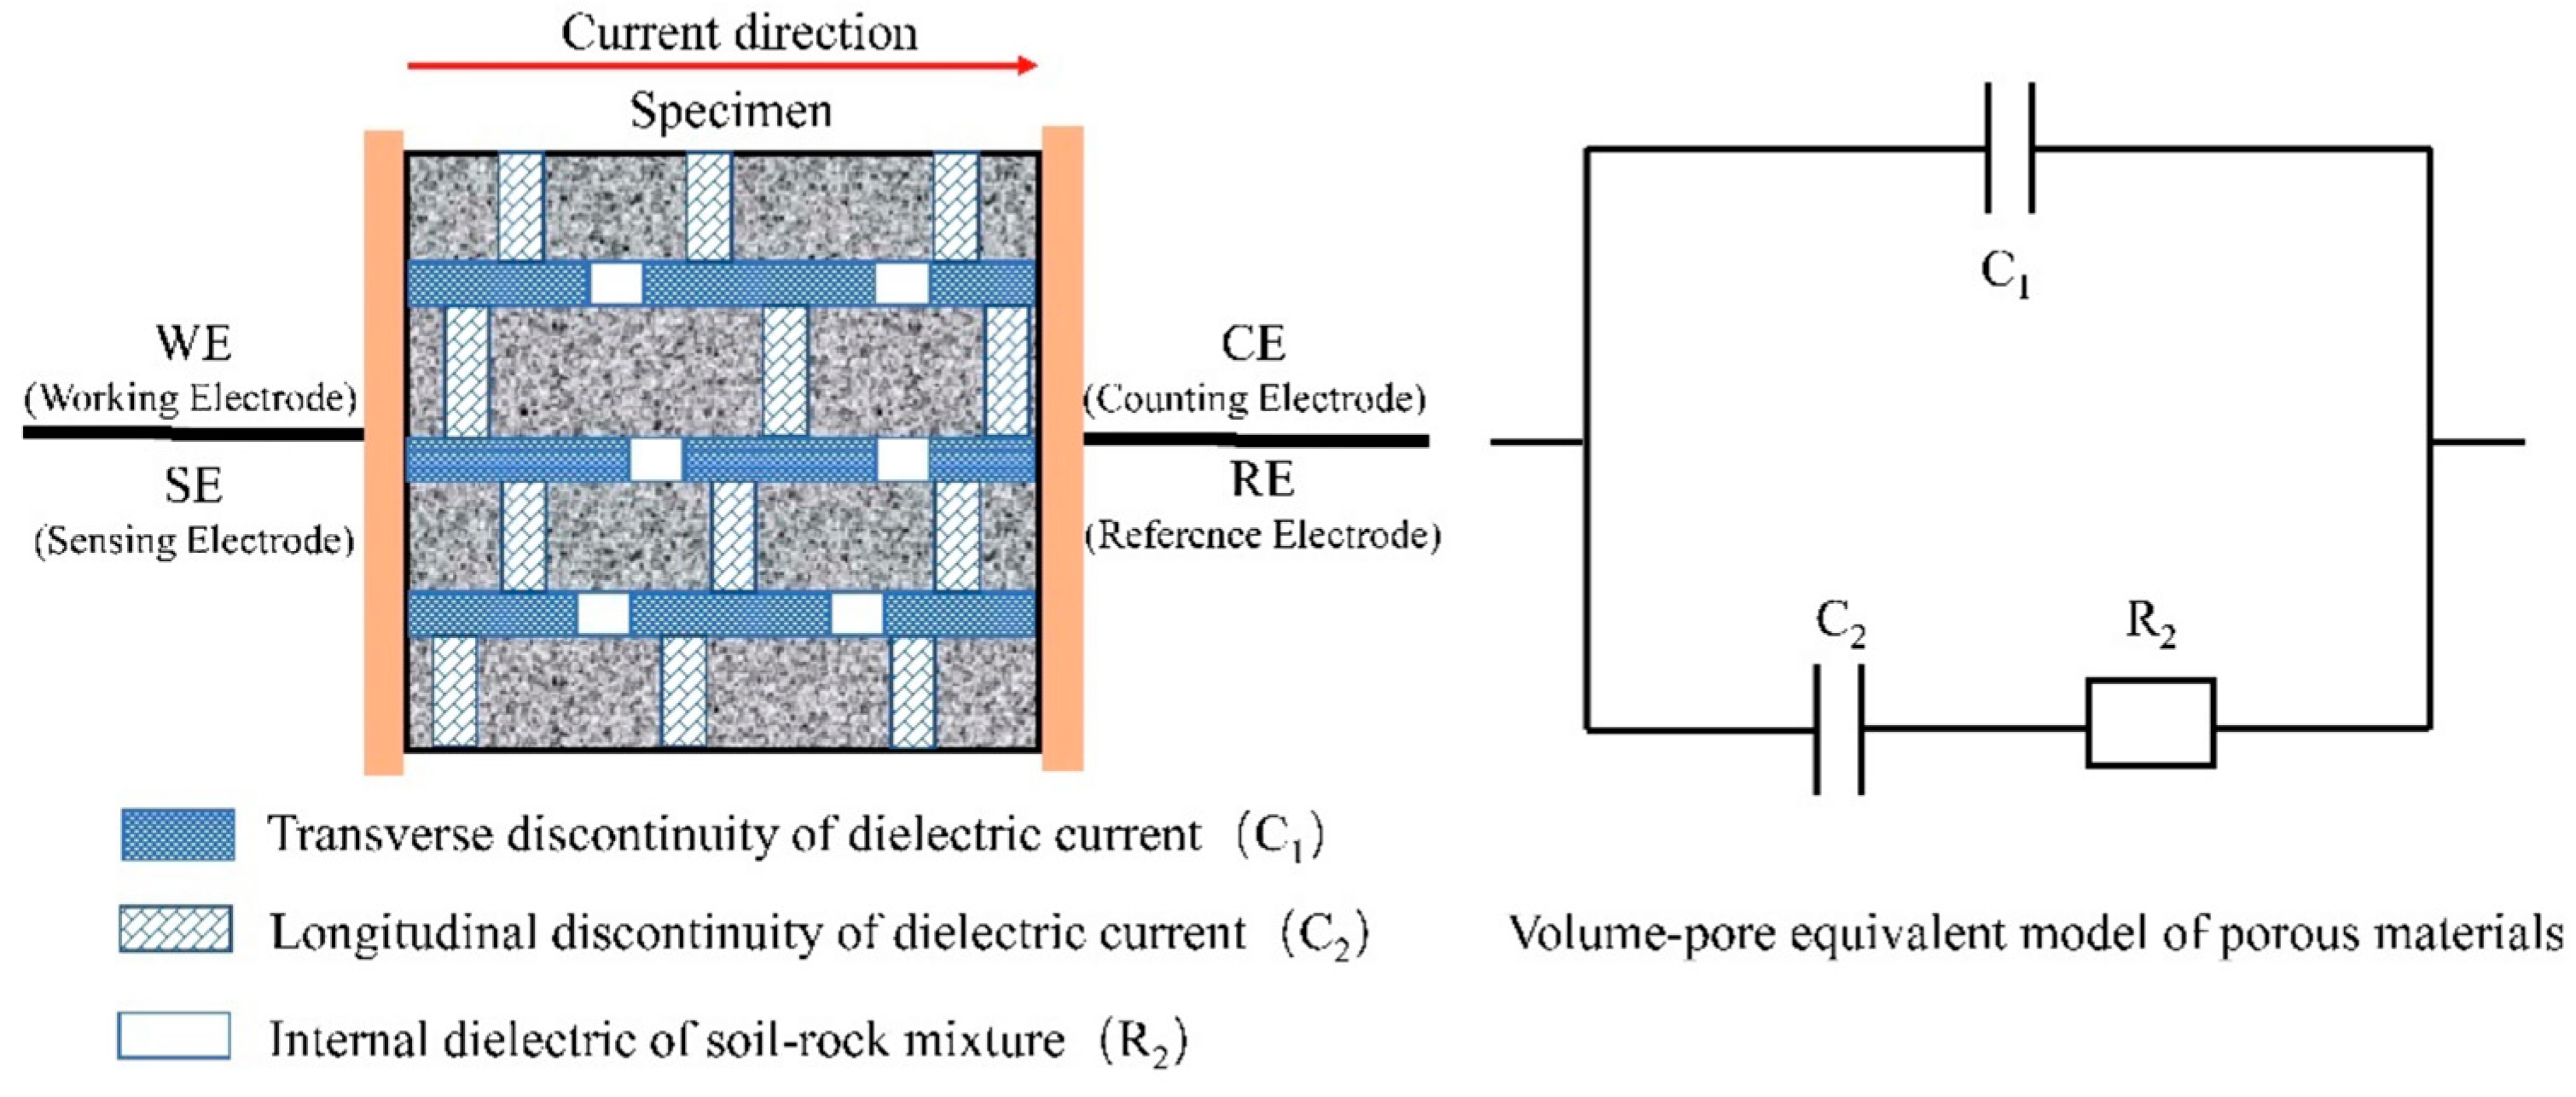
2.3. Electrochemical Test and Uniaxial Compression Test

Electrochemical impedance spectrometry (EIS) is a detection technique to evaluate the internal structure of a sample based on disturbance feedback detection after the electric field disturbance is applied to the specimen [20]. The relevant information about the interface properties can be obtained, which has good applicability to the detection of the internal microscopic structure of the soil–rock mixture. The EIS device is the PARSTAT 3000A-DX electrochemical workstation produced by Ametek Trading Co., Ltd. Beijing China. The wiring method is a four-electrode circuit, and the layout and instrument test parameters are shown in Figure 6 and Table 1. According to the principle of operation of electrochemical testing, voltage and current can be connected by impedance in the specimen test [21]. The impedance calculation formula is as follows:
Z = R j X c
Z ω = Z r e j Z i m
Z = Z r e 2 + Z i m 2
In the formula, Z is the total impedance. Z r e is the real impedance. Z i m is the imaginary impedance. R is the resistance. j = 1 . X c is the capacitive reactance. X c = 1 / ω c ( ω is the angular frequency and c is the capacitance). In the EIS, the Nyquist plot is a system test result with the abscissa of the real impedance and the ordinate of the imaginary impedance. The real impedance is the impedance of the total impedance in the same phase as the variable frequency AC current applied by the equipment and the imaginary impedance is the impedance with the phase difference. In this paper, the pore volume equivalent circuit model of porous dielectric materials proposed by Andrade was used as the equivalent circuit model (as shown in Figure 6) [22]. Among them, R 2 is the dielectric flow formed by the internal electrolyte and charged group of the soil–rock mixture. C 1 and C 2 are the transverse (current normal direction) and longitudinal (current positive direction) continuities of the dielectric flow inside the material, respectively. Based on the principle of impedance calculation, it can be seen that:
Z r e ω = 0
Z r e ω = Z r e R 2 , C 1 , C 2
Z r e ω = C 1 + C 2
Z r e ω = C 1
Figure 7 shows the trend of impedance with frequency and the change in imaginary impedance with real impedance. It can be seen that the process of increasing the absolute value of real impedance and imaginary impedance is the process of from high frequency to low frequency. Among them, the distribution characteristic angle is the angle between the line and the abscissa line of the distribution characteristic point and the origin in the Nyquist diagram, and its value is the ratio of the imaginary impedance distribution length to the real impedance distribution length. The distribution characteristic points (∆ Z r e , Δ Z i m ) and distribution characteristic angle are the characteristic parameters of the Nyquist plot, which can indirectly characterize the mesopore structure inside the soil–rock mixture. The calculation formula of distribution characteristic points and distribution characteristic angles is as follows:
Z r e = Δ Z r e , m a x Δ Z r e , m i n = Δ Z r e R 2 , C 1 , C 2
Δ Z i m = C 2
θ = arctan Δ Z i m / Δ Z r e
Δ Z r e , m a x and Δ Z r e , m i n are the maximum and minimum increments of real impedance, respectively. Δ Z i m , m a x and Δ Z i m , m i n are the maximum and minimum increments of imaginary impedance. The above formula shows that the physical significance of the distribution characteristic point representation is the continuity characteristic of the longitudinal internal structural skeleton of the soil–rock mixture.
The uniaxial compression test equipment is a multi-functional rock direct shear instrument produced by Jinan Ore Rock Test Instrument Co., Ltd. (Jinan, China). The complete test process is shown in Figure 8. Referring to the geotechnical test method standard (GB/T 50123-2019), the uniaxial compression test control mode is displacement control and the loading speed is 0.05 mm/s [23]. The soil–rock mixture specimen is a cube with a side length of 100 mm. The uniaxial strength calculation expression is as follows:
P = F A
Among them, P is the uniaxial compressive strength. F is the peak load of the soil–rock mixture when it is damaged by load and A is the cross-sectional area.

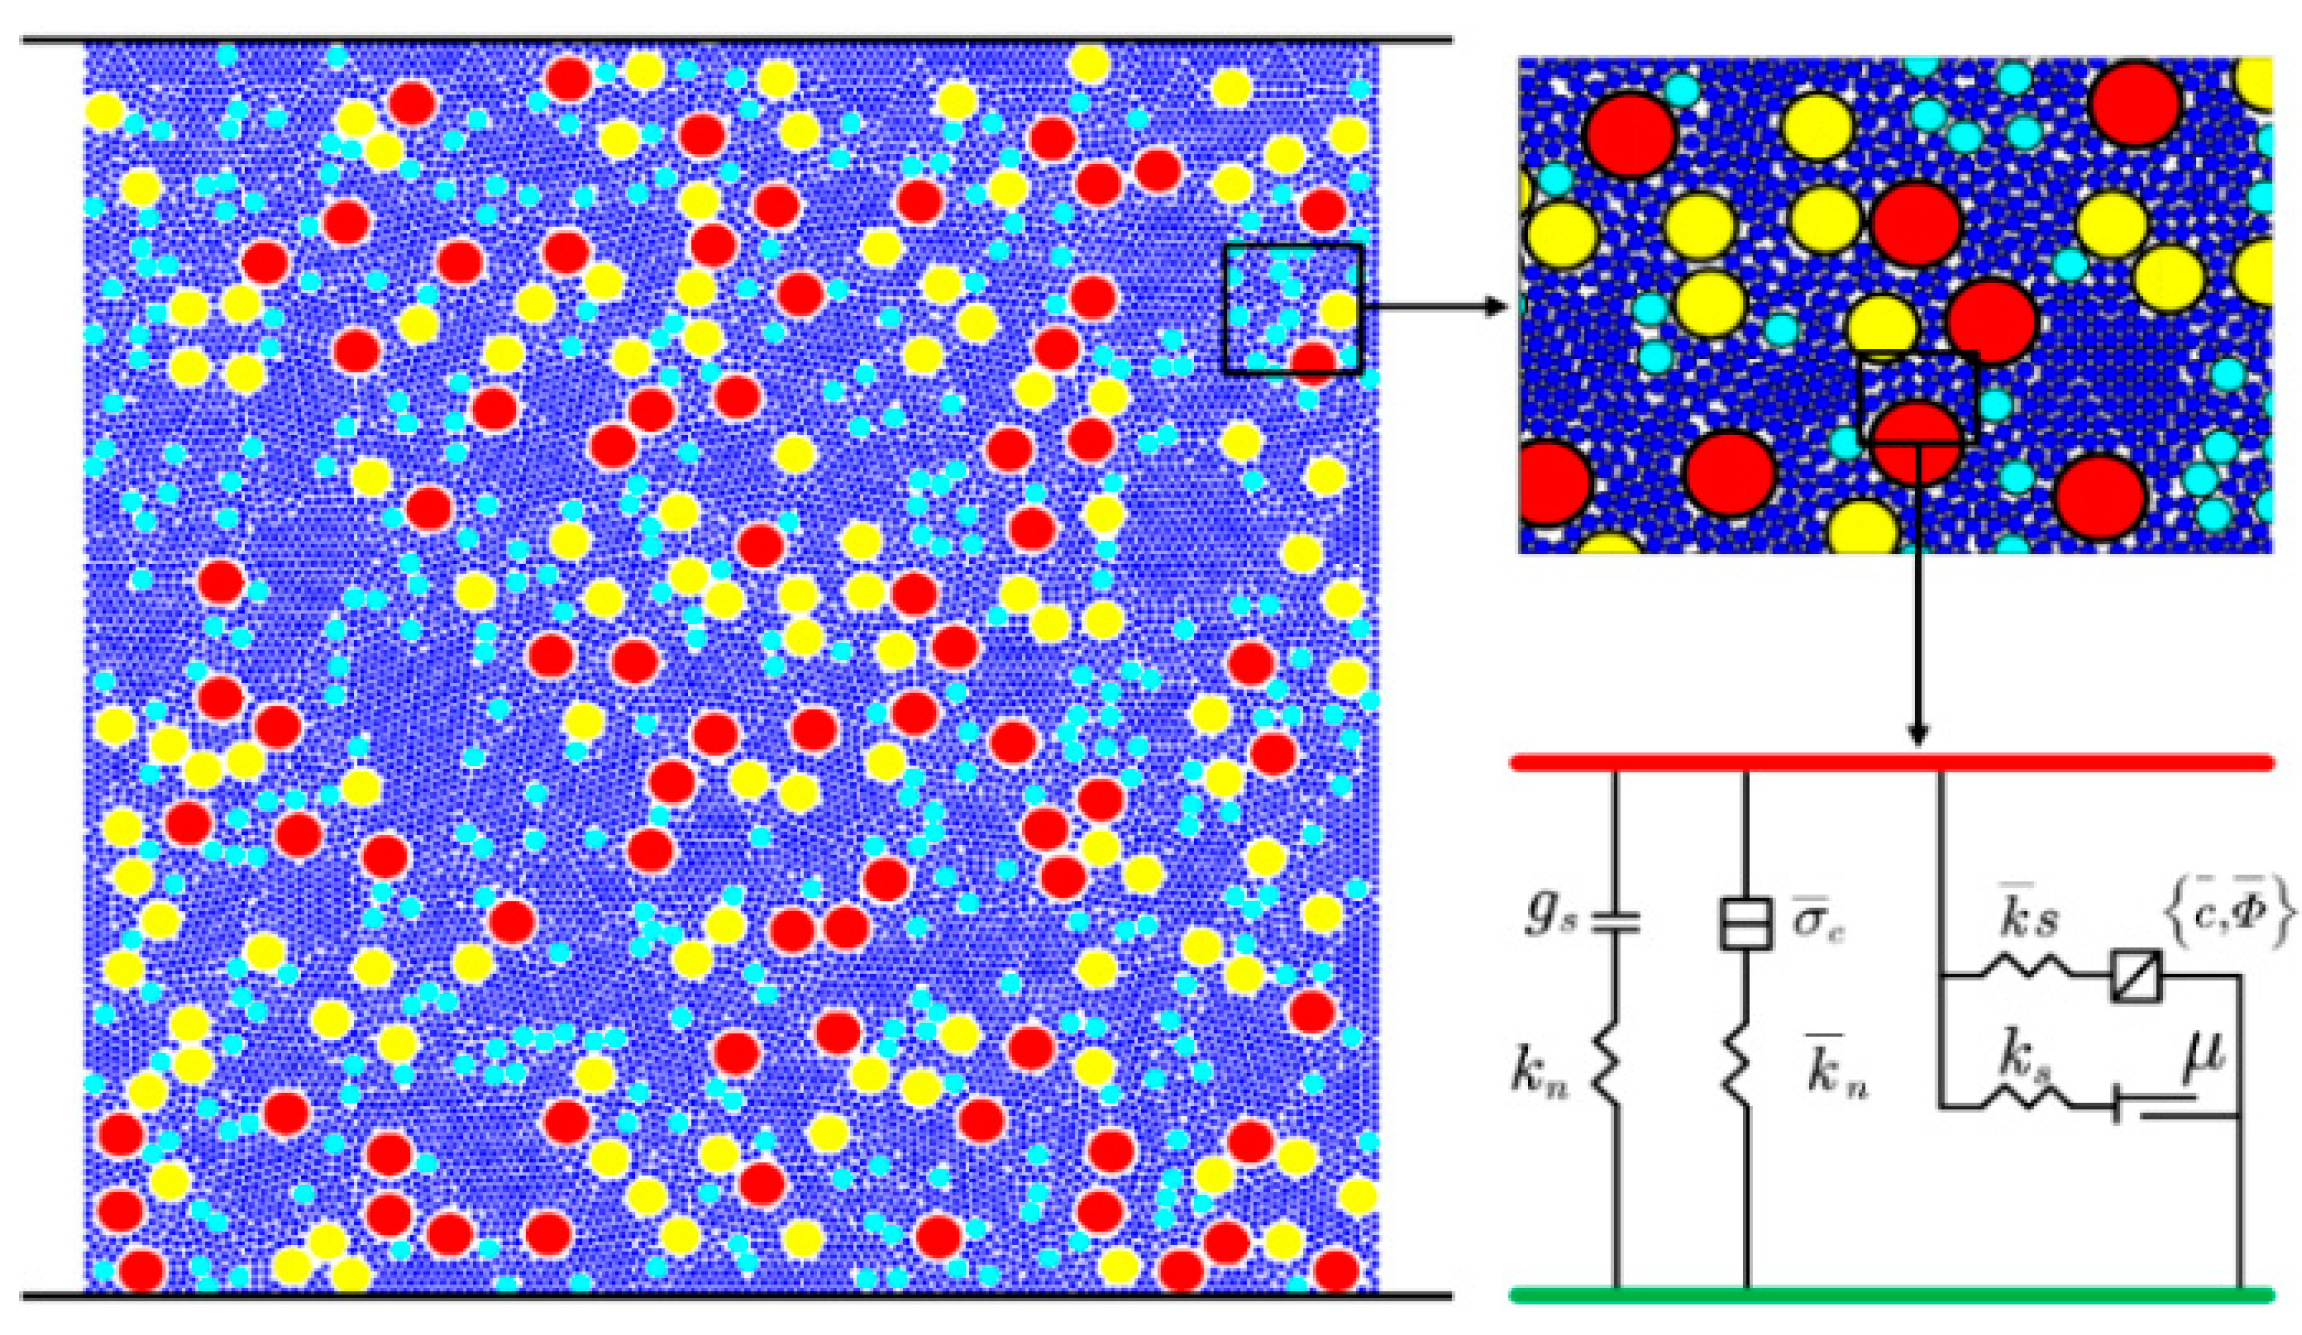
2.4. Numerical Simulation of Particle Flow Programs

PFC software 7.0 is a discrete element particle flow analysis program widely used in meso- and macroscopic damage evolution and crack propagation during the loading process of rock materials [24,25,26]. In this paper, the built-in programming language was used to model a mixture of soil and rock composed of soil and stone with different particle sizes. The parallel cementation model was used to simulate the uniaxial compression test of the soil–rock mixture under different freeze–thaw cycles (as shown in Figure 9). Through the “trial and error method”, the numerical simulation parameters and the mechanical parameters of the indoor test were gradually approximated.

3. Results and Analysis

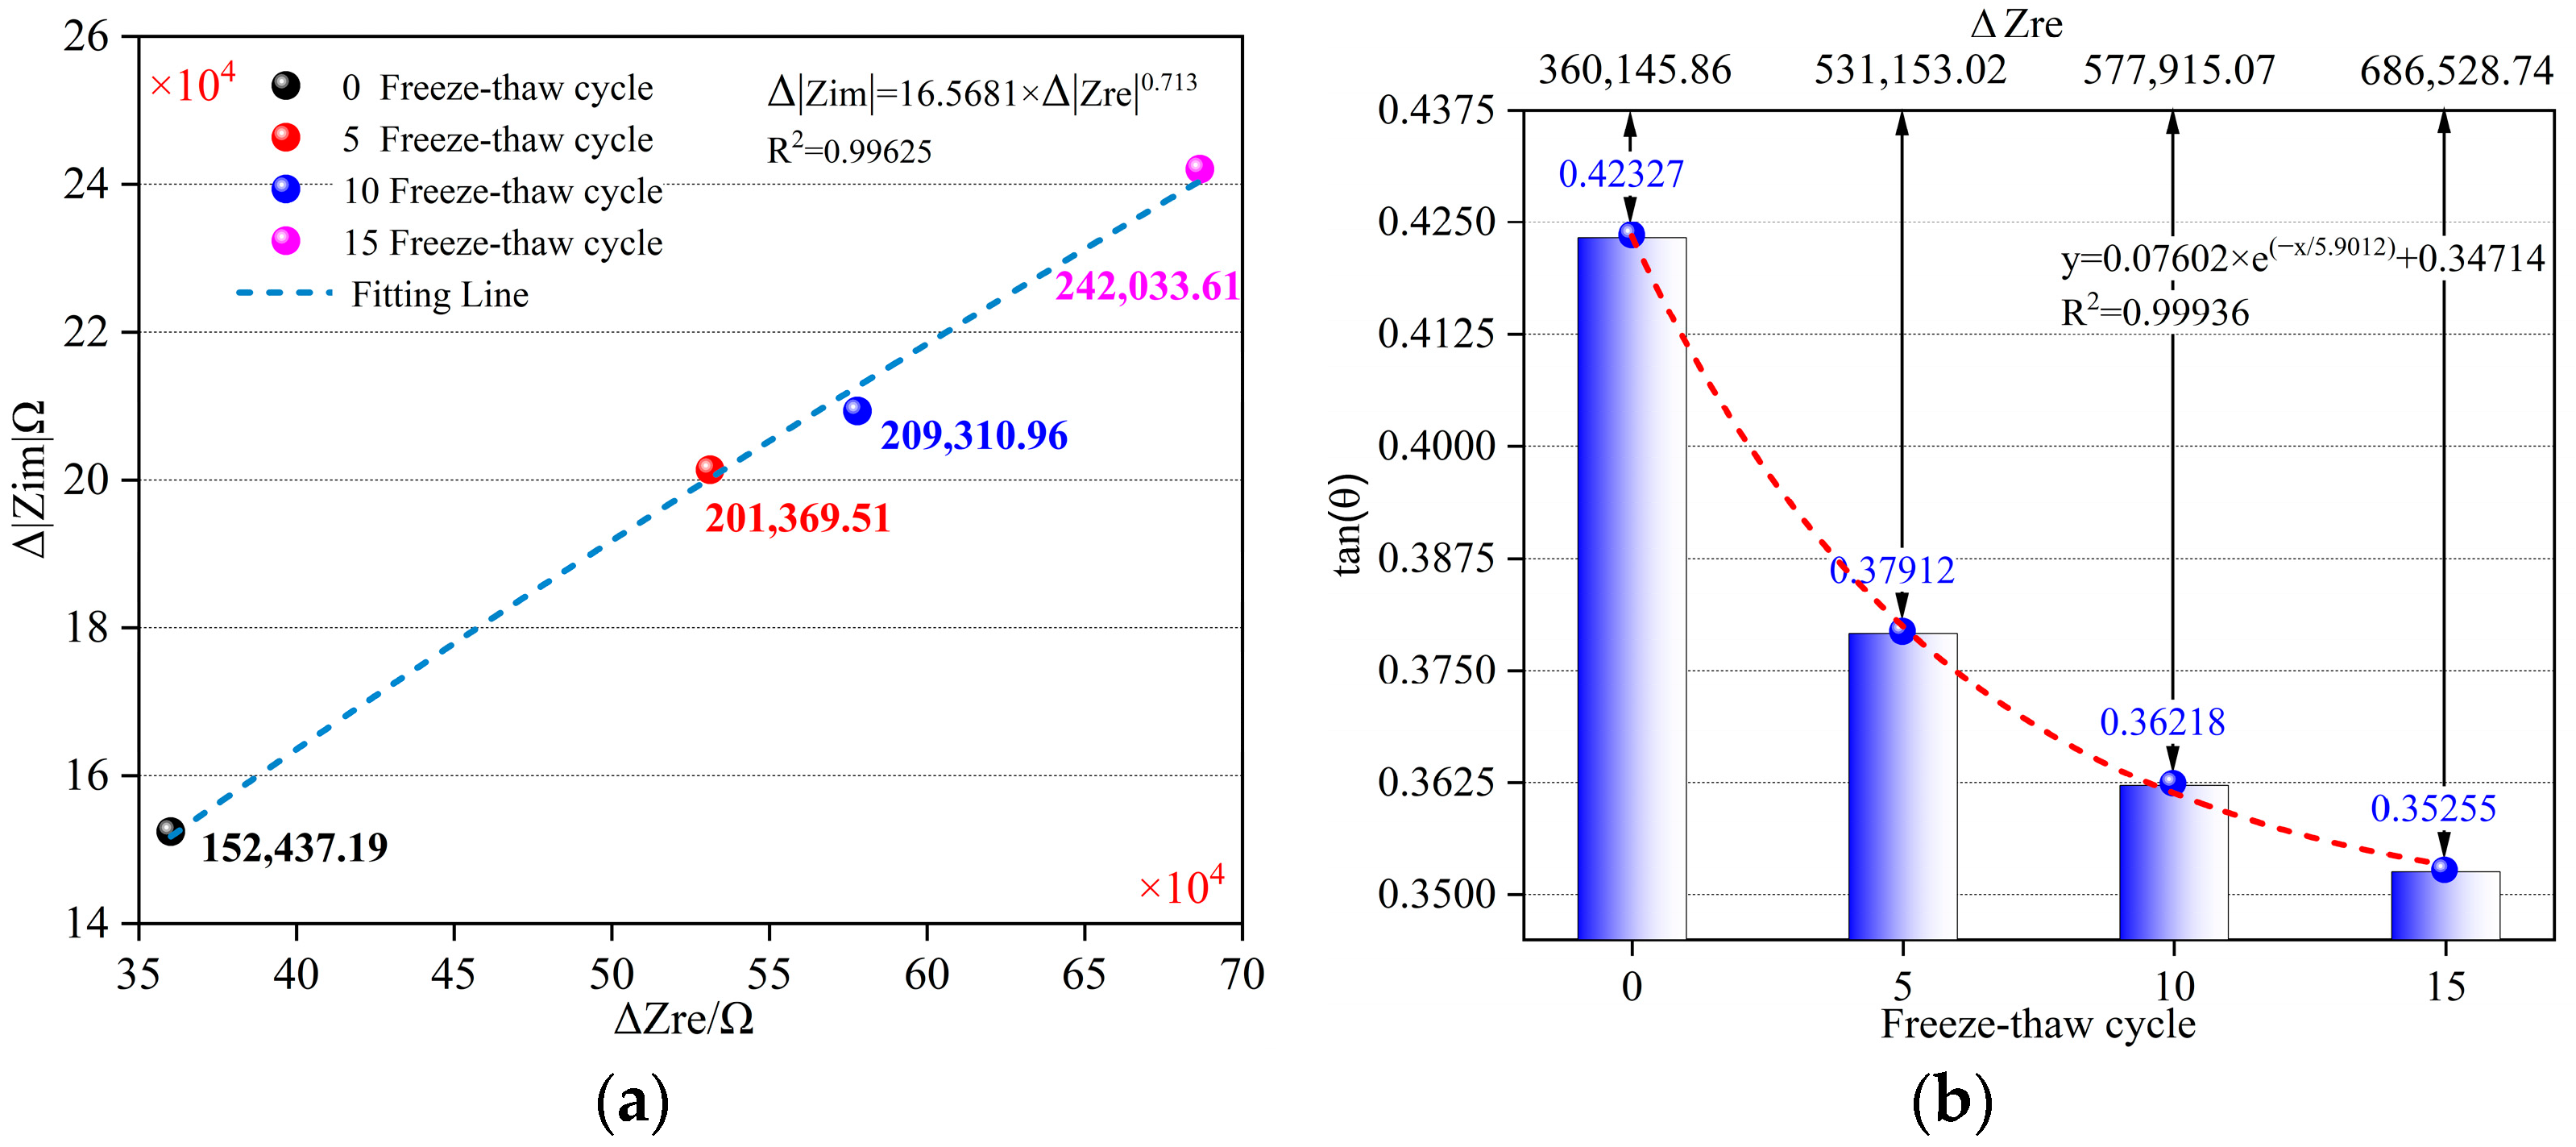
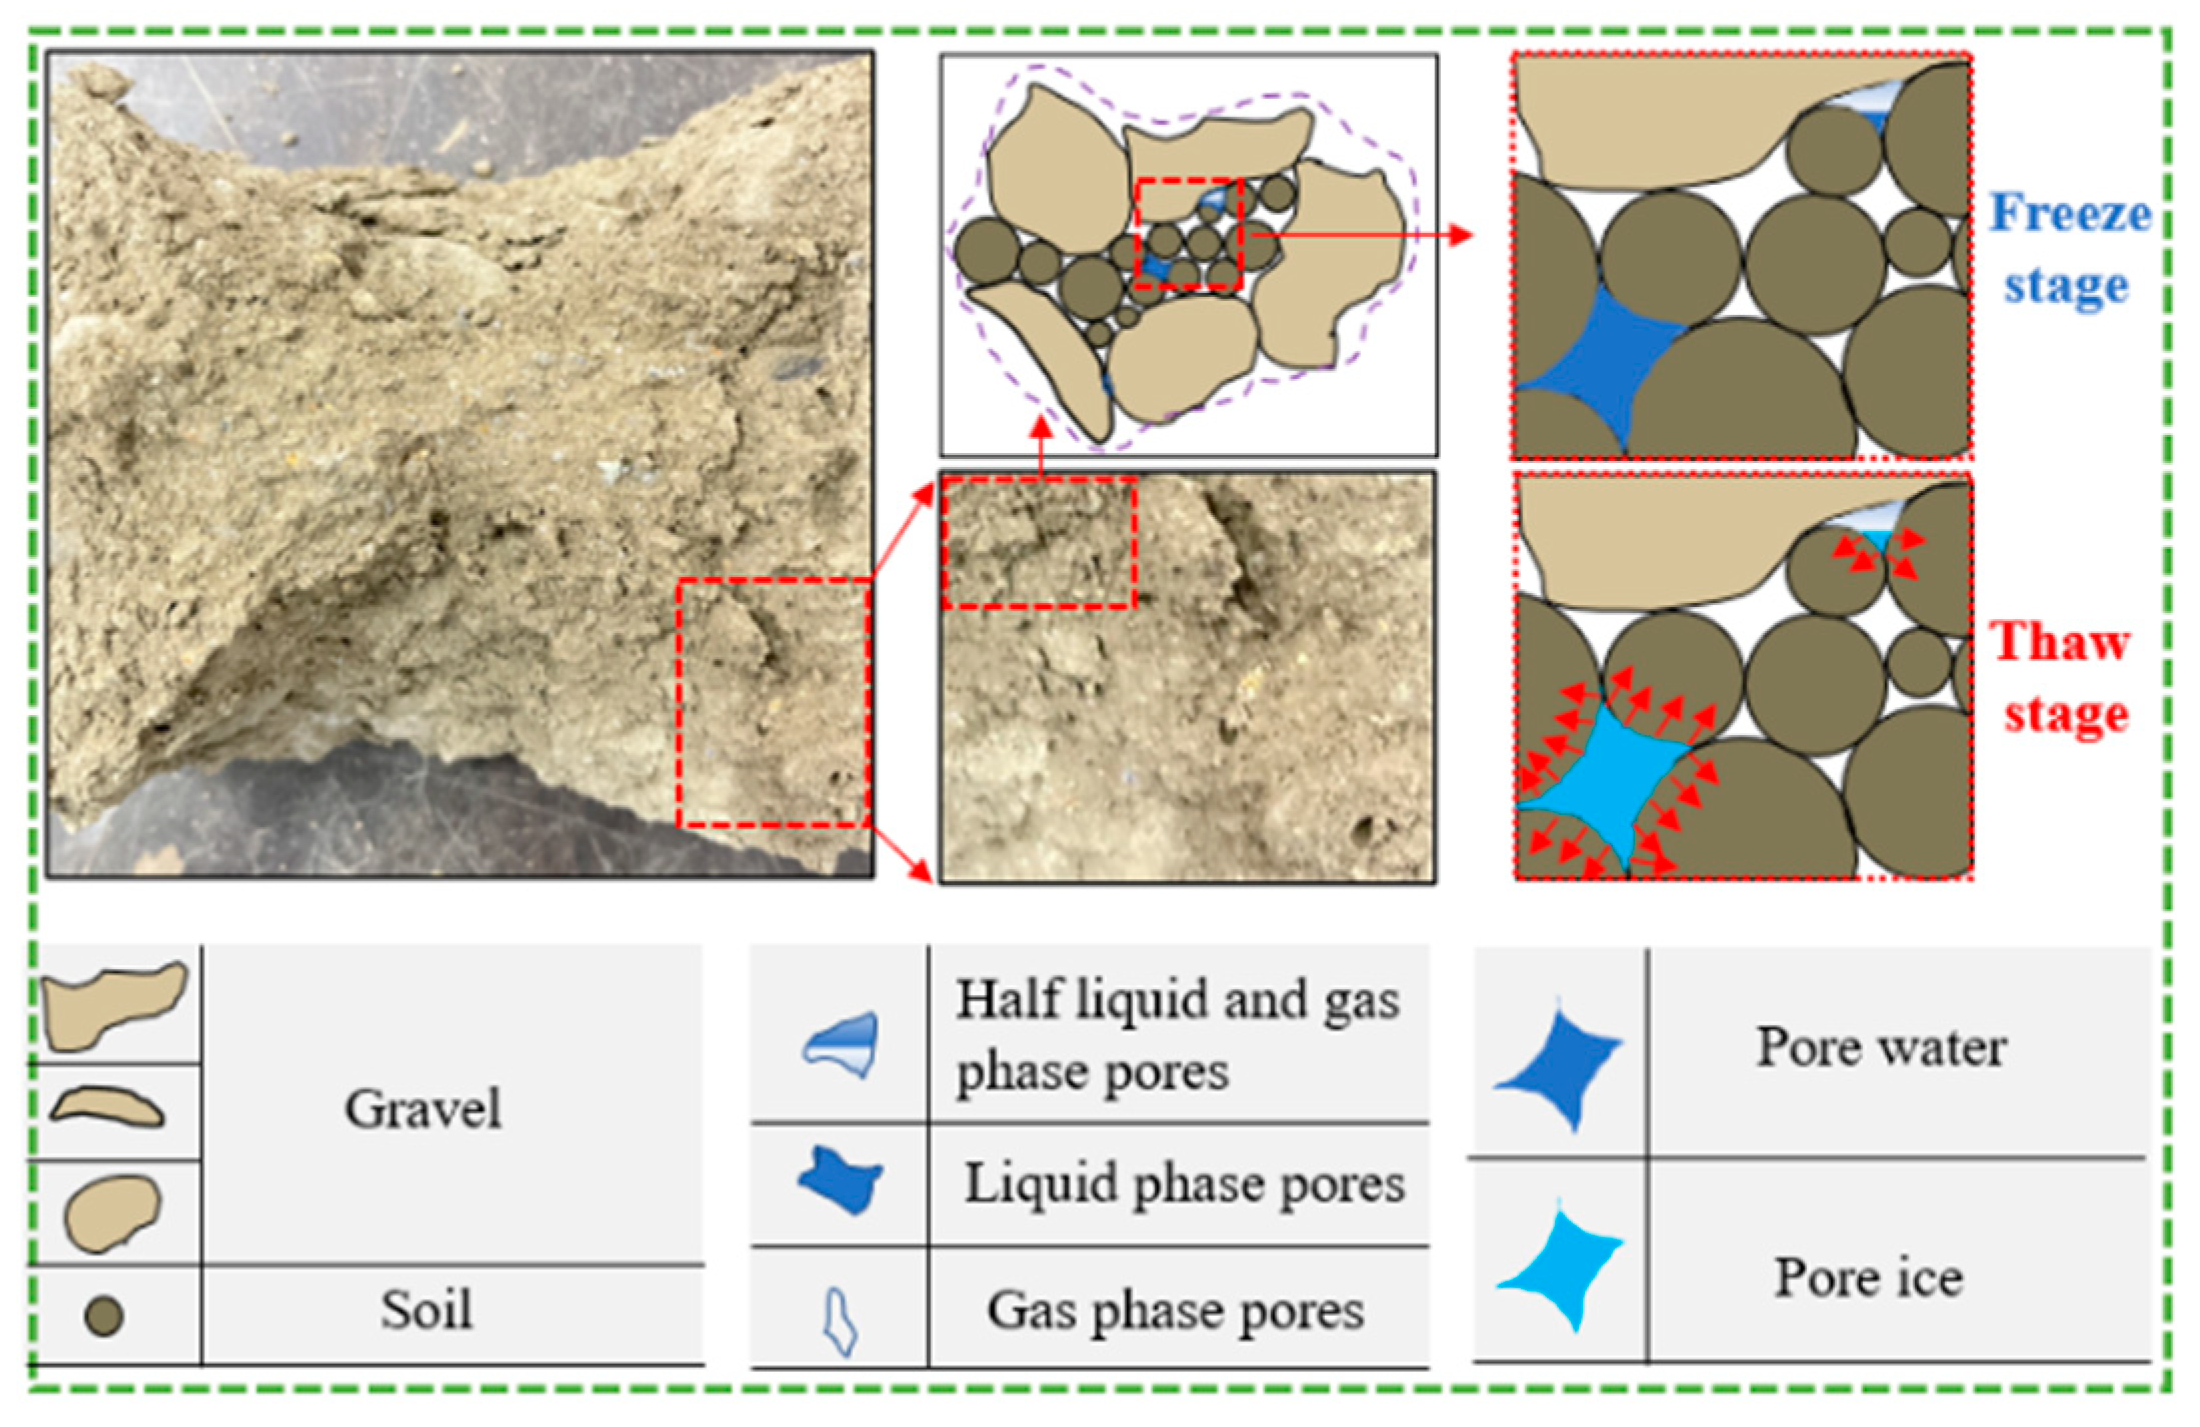
3.1. Effect of Freeze–Thaw Cycle on Mesoscopic Pore Structure of Soil–Rock Mixture

In the electrochemical test, because the pure resistance does not have continuity in the normal direction of the AC current, the distribution characteristic point and the tangent of the distribution characteristic of the pure resistance are constant (∆ Z r e ,   0 ) and 0. Therefore, this paper used the similarity of the characteristic angle of the soil–rock mixture and the pure resistance distribution to characterize the changes in the internal micropore structure of the soil–rock mixture under different freeze–thaw cycles. When the tangent of the distribution characteristic of the soil–rock mixture gradually increases and is far from 0, the similarity between the specimen and the pure resistance decreases. When the tangent gradually decreases and is close to 0, its similarity increases. The resistance similarity characteristics of soil–rock mixtures under different freeze–thaw cycles can characterize the interaction between internal water and pores, indirectly reflecting the evolution of microscopic pores. Figure 10a shows the distribution of characteristic points. It is shown that the real impedance component and the imaginary impedance component under different freeze–thaw cycles show a good power function relationship, and the fitting coefficient is as high as 0.99625. In addition, when the number of freeze–thaw cycles increased from 0 to 15, the real and imaginary impedances of the soil–rock mixture showed an increasing trend. Figure 10b shows the trend of the tangent of the distribution characteristic under different freeze–thaw cycles. It can be seen from the figure that when the number of freeze–thaw cycles increases from 0 to 15, the tangent of the characteristic angle of the distribution decreases from 0.42327 to 0.35255 with a decrease of 16.71%. At the same time, the tangent of the distribution characteristic shows a good exponential relationship with the number of freeze–thaw cycles, and the fitting coefficient is 0.99936.
The internal microscopic pore structure distribution of soil–rock mixtures can be primarily categorized into gas-phase pores, liquid-phase pores, and semi-liquid/semi-gas-phase pores (as depicted in Figure 11). During freeze–thaw cycles, the liquid-phase pores and semi-liquid/semi-gas-phase pores play a vital role in the microscopic pore structure. In the electrochemical testing of soil–rock mixtures, the microscopic pores can function as miniature capacitors. The expression for calculating capacitance is represented by Equation (13):
C = ε S 4 π k d
In Equation (13), C is the capacitance, ε is the relative dielectric constant, S is the area directly opposite the two plates of the capacitor, K is the electrostatic constant, and d is the vertical distance between the two plates of the capacitor. According to the calculation principle of capacitance, it is known that as the vertical distance ( d ) between the the two plates of the capacitor increases, the capacitance ( C ) exhibits a decreasing trend, while its similarity to pure resistance increases. When the test temperature drops below 0 °C, the pore water in the liquid-phase pores and semi-liquid/semi-gas-phase pores will undergo a phase transition from liquid water to solid ice. The volume expansion caused by phase transition will produce ice pressure in the pores of different radii of the soil–rock mixture. When the ice pressure exceeds the cohesive strength of the pore walls, the pores undergo expansion and connectivity, leading to an increase in the number of internal pores and the dilation of the original pore radii within the sample. In EIS testing, an increase in the number of internal pores and the expansion of pore radii in soil–rock mixtures result in an increase in the distance between the capacitor electrodes. This leads to a decreasing trend in capacitance. Ultimately, the similarity between the electrochemical test of the soil–rock mixture and the pure resistance test increased.
Based on the above, it can be concluded that the similarity between the tangent of the characteristic angle of soil–rock mixtures and pure resistance under different freeze–thaw cycles can characterize the variation law of internal microscopic pores. Therefore, to represent the variation in internal pores in soil–rock mixtures under different freeze–thaw cycles in a more intuitive and convenient manner, this paper introduces the similarity of distribution characteristic angles to characterize pore changes. The calculation expression is as follows:
S θ = θ m a x θ i θ m a x × 100
In the equation, S θ is the similarity of distribution characteristic angles. θ i is the tangent of the distribution characteristic angle of soil–rock mixtures under the i th freeze–thaw cycle. θ m a x is the maximum value (90°) of the tangent of the distribution characteristic angle of soil–rock mixtures in the Nyquist plot. Figure 12 shows the variation in characteristic angular similarity with the number of freeze–thaw cycles. Based on the graph, it can be observed that there is a strong exponential relationship between the number of freeze–thaw cycles and the similarity. As the number of freeze–thaw cycles increases, the similarity exhibits an exponential growth trend. Considering the influence of freeze–thaw cycles on the similarity of characteristic angles in soil–rock mixtures, when the number of freeze–thaw cycles increased, the tangent of the characteristic angle decreased, and the similarity increased. The number of internal mesoscopic pores increased, which eventually led to an increase in porosity. In summary, the increase in the number of freeze–thaw cycles resulted in an increase in both porosity and similarity. Moreover, both porosity and similarity are physical parameters represented in percentages. Therefore, the similarity of soil–rock mixtures can be used as an indirect representation of porosity. It provides data support for subsequent research on the establishment of freeze–thaw damage models of soil–rock mixtures.

3.2. Effect of Freeze–Thaw Cycles on Mechanical Properties of Soil–Rock Mixtures

Figure 13a shows the stress–strain curve of the soil–rock mixture under different freeze–thaw cycles. From the graph, it can be observed that the stress–strain curve also exhibits stages of pore compaction (OA stage), elastic deformation (AB stage), unstable development (BC stage), and the post-failure stage (after point C). Meanwhile, as the number of freeze–thaw cycles increased from 0 to 15, there was a noticeable decrease in peak intensity and peak secant modulus. However, the peak strain and pore compaction stages showed an increasing trend.
Figure 13b shows the fitting results of the relationship between the number of freeze–thaw cycles and various mechanical parameters of the soil–rock mixture. From the figure, it can be observed that as the number of freeze–thaw cycles increased from 0 to 15, the uniaxial compressive strength decreased from 0.37095 MPa to 0.19431 MPa, representing a decrease of 47.62%. Furthermore, there is a strong exponential relationship between the compressive strength and freeze–thaw cycles, with a high fitting correlation coefficient of up to 0.99752. With the gradual increase in the number of freeze–thaw cycles, the uniaxial compressive strength showed an exponential decrease. In the fitting calculations of the relationship between the number of freeze–thaw cycles and peak strain and peak secant modulus (Figure 14a), as freeze–thaw cycles gradually increased, the peak strain increased from 2.115% to 4.608%, and the modulus decreased from 0.16492 GPa to 0.0398 GPa. In addition, both the peak strain and the peak secant modulus exhibit a strong exponential relationship with freeze–thaw cycles, with fitting correlation coefficients of 0.99179 and 0.99873, respectively. When the number of freeze–thaw cycles gradually increased, the peak strain and the peak secant modulus showed exponential increasing and exponential decreasing trends, respectively.
In the discrete element simulation of uniaxial compression tests on soil–rock mixtures, the stress–strain curves exhibit similar deformation stages as those of rock stress–strain curves. Therefore, the parallel cementation model, which is the most widely used in the numerical calculation of discrete elements in geotechnical engineering, is selected to carry out the numerical simulation of the uniaxial compression tests. In the numerical simulation of uniaxial compression tests on soil–rock mixtures with different freeze–thaw cycles, microstructural parameters such as density, stiffness ratio (Kratio), porosity, friction coefficient (Fric), and internal friction angle (pb_fa) remained unchanged. The paper only focused on varying the effective modulus (emod)/bond effective modulus (pb_emod) and cohesive force (pb_coh)/tensile strength (pb_ten), which are factors influencing the modulus and compressive strength. In the selection of a simulated modulus for the specimens, the elastic deformation of soil–rock mixtures under different freeze–thaw cycles was relatively short and difficult to calculate accurately. Therefore, the peak secant modulus was chosen for numerical simulation as an alternative. Table 2 shows the numerical calculation of the mesoparameters of soil–rock mixtures under different freeze–thaw cycles. It can be seen from the table that with the increase in the number of freeze–thaw cycles, the emod/pb-emod and pb_coh/pb_ten both show a decreasing law. Table 3 and Figure 14b are numerical simulation results of uniaxial compression tests of soil–rock mixtures at different freeze–thaw cycles. Based on the simulation results, it can be observed that the numerical simulation results are in close agreement with the laboratory test results. The errors between the fracture modulus and unconfined compressive strength are both less than 0.0000666996 GPa and 0.00621 MPa, respectively.
Figure 15 shows the crack propagation law of soil–rock mixtures under different freeze–thaw cycles. Combined with the crack increase curve in Figure 13a, it can be observed that with an increase in the number of freeze–thaw cycles, there is a significant increase in the strain occurring during the initiation of cracks within the soil–rock mixture. Furthermore, by analyzing the crack heat maps and crack propagation time-step diagrams of the soil–rock mixture under different freeze–thaw cycles, it can be observed that when the specimen is damaged by pressure, the failure started from the corner, then gradually extended to the middle and lower parts of the specimen, ultimately leading to final failure. In addition, when the crack extended to the middle, it also followed the pattern of spreading from the middle section toward both ends. Figure 16 shows the crack classification results of different soil–rock mixtures. According to the diagram, it can be observed that under different freeze–thaw cycles, the cracks generated in the compressive failure of the soil–rock mixture were mainly tensile cracks, followed by tension–shear cracks, and the least were compression–shear cracks. As the number of freeze–thaw cycles increased from 0 to 15, the occurrence of compressive shear cracks showed a decreasing trend, with the proportion of cracks decreasing from 1.37% to 0.76%. Additionally, tension–shear cracks and tensile cracks show an increasing and decreasing trend, respectively, from 0 to 10 freeze–thaw cycles. However, the pattern was not clearly observed from 10 to 15 cycles.
The mesoscopic pore structure of porous materials has a significant influence on the macroscopic mechanical properties [27,28]. To investigate the inherent relationship between the microporosity of soil–rock mixtures and their uniaxial compressive strength, the characteristic angular similarity and uniaxial strength were fitted and calculated. The fitting results are shown in Figure 17. It can be seen from the figure that the angular similarity of the distribution characteristics and uniaxial compressive strength under different freeze–thaw cycles have a good linear relationship, and the fitting correlation coefficient is 0.9928. The uniaxial compressive strength increased exponentially with the increase in similarity. As the freeze–thaw cycle increased from 0 to 15, the similarity coefficient of the electrochemical test for the soil–rock mixture gradually increased, which indicated that the microscopic porosity increased gradually. The repeated freezing and thawing processes generated frost heaving forces, which caused the expansion of the size of micropores or microdefects between soil and soil, soil and rock, and rock and rock within the soil–rock mixture. Exactly, the interconnection of pores and defects with different radii weakened the bonding strength within the soil–rock mixture, leading to a decrease in its uniaxial compressive strength.

4. Conclusions

This research paper conducted laboratory freeze–thaw cycling, uniaxial compression tests, and electrochemical impedance spectroscopy (EIS) on soil–rock mixtures. Additionally, it utilized discrete element method (DEM) simulation software (PFC2D) to simulate and calculate the uniaxial compression tests under different freeze–thaw cycles. The similarity of the distribution characteristic angle and pure resistance of the soil–rock mixture under different freeze–thaw cycles were introduced to indirectly characterize the microscopic pores, and the influence on the distribution characteristic points, distribution characteristic angles, and similarity was analyzed. In addition, the effects of freeze–thaw cycling on macroscopic physical parameters such as uniaxial compressive strength, crack initiation, and crack propagation were discussed. The intrinsic relationship between similarity and uniaxial compressive strength was established. The main conclusions of the paper are as follows:
(1)
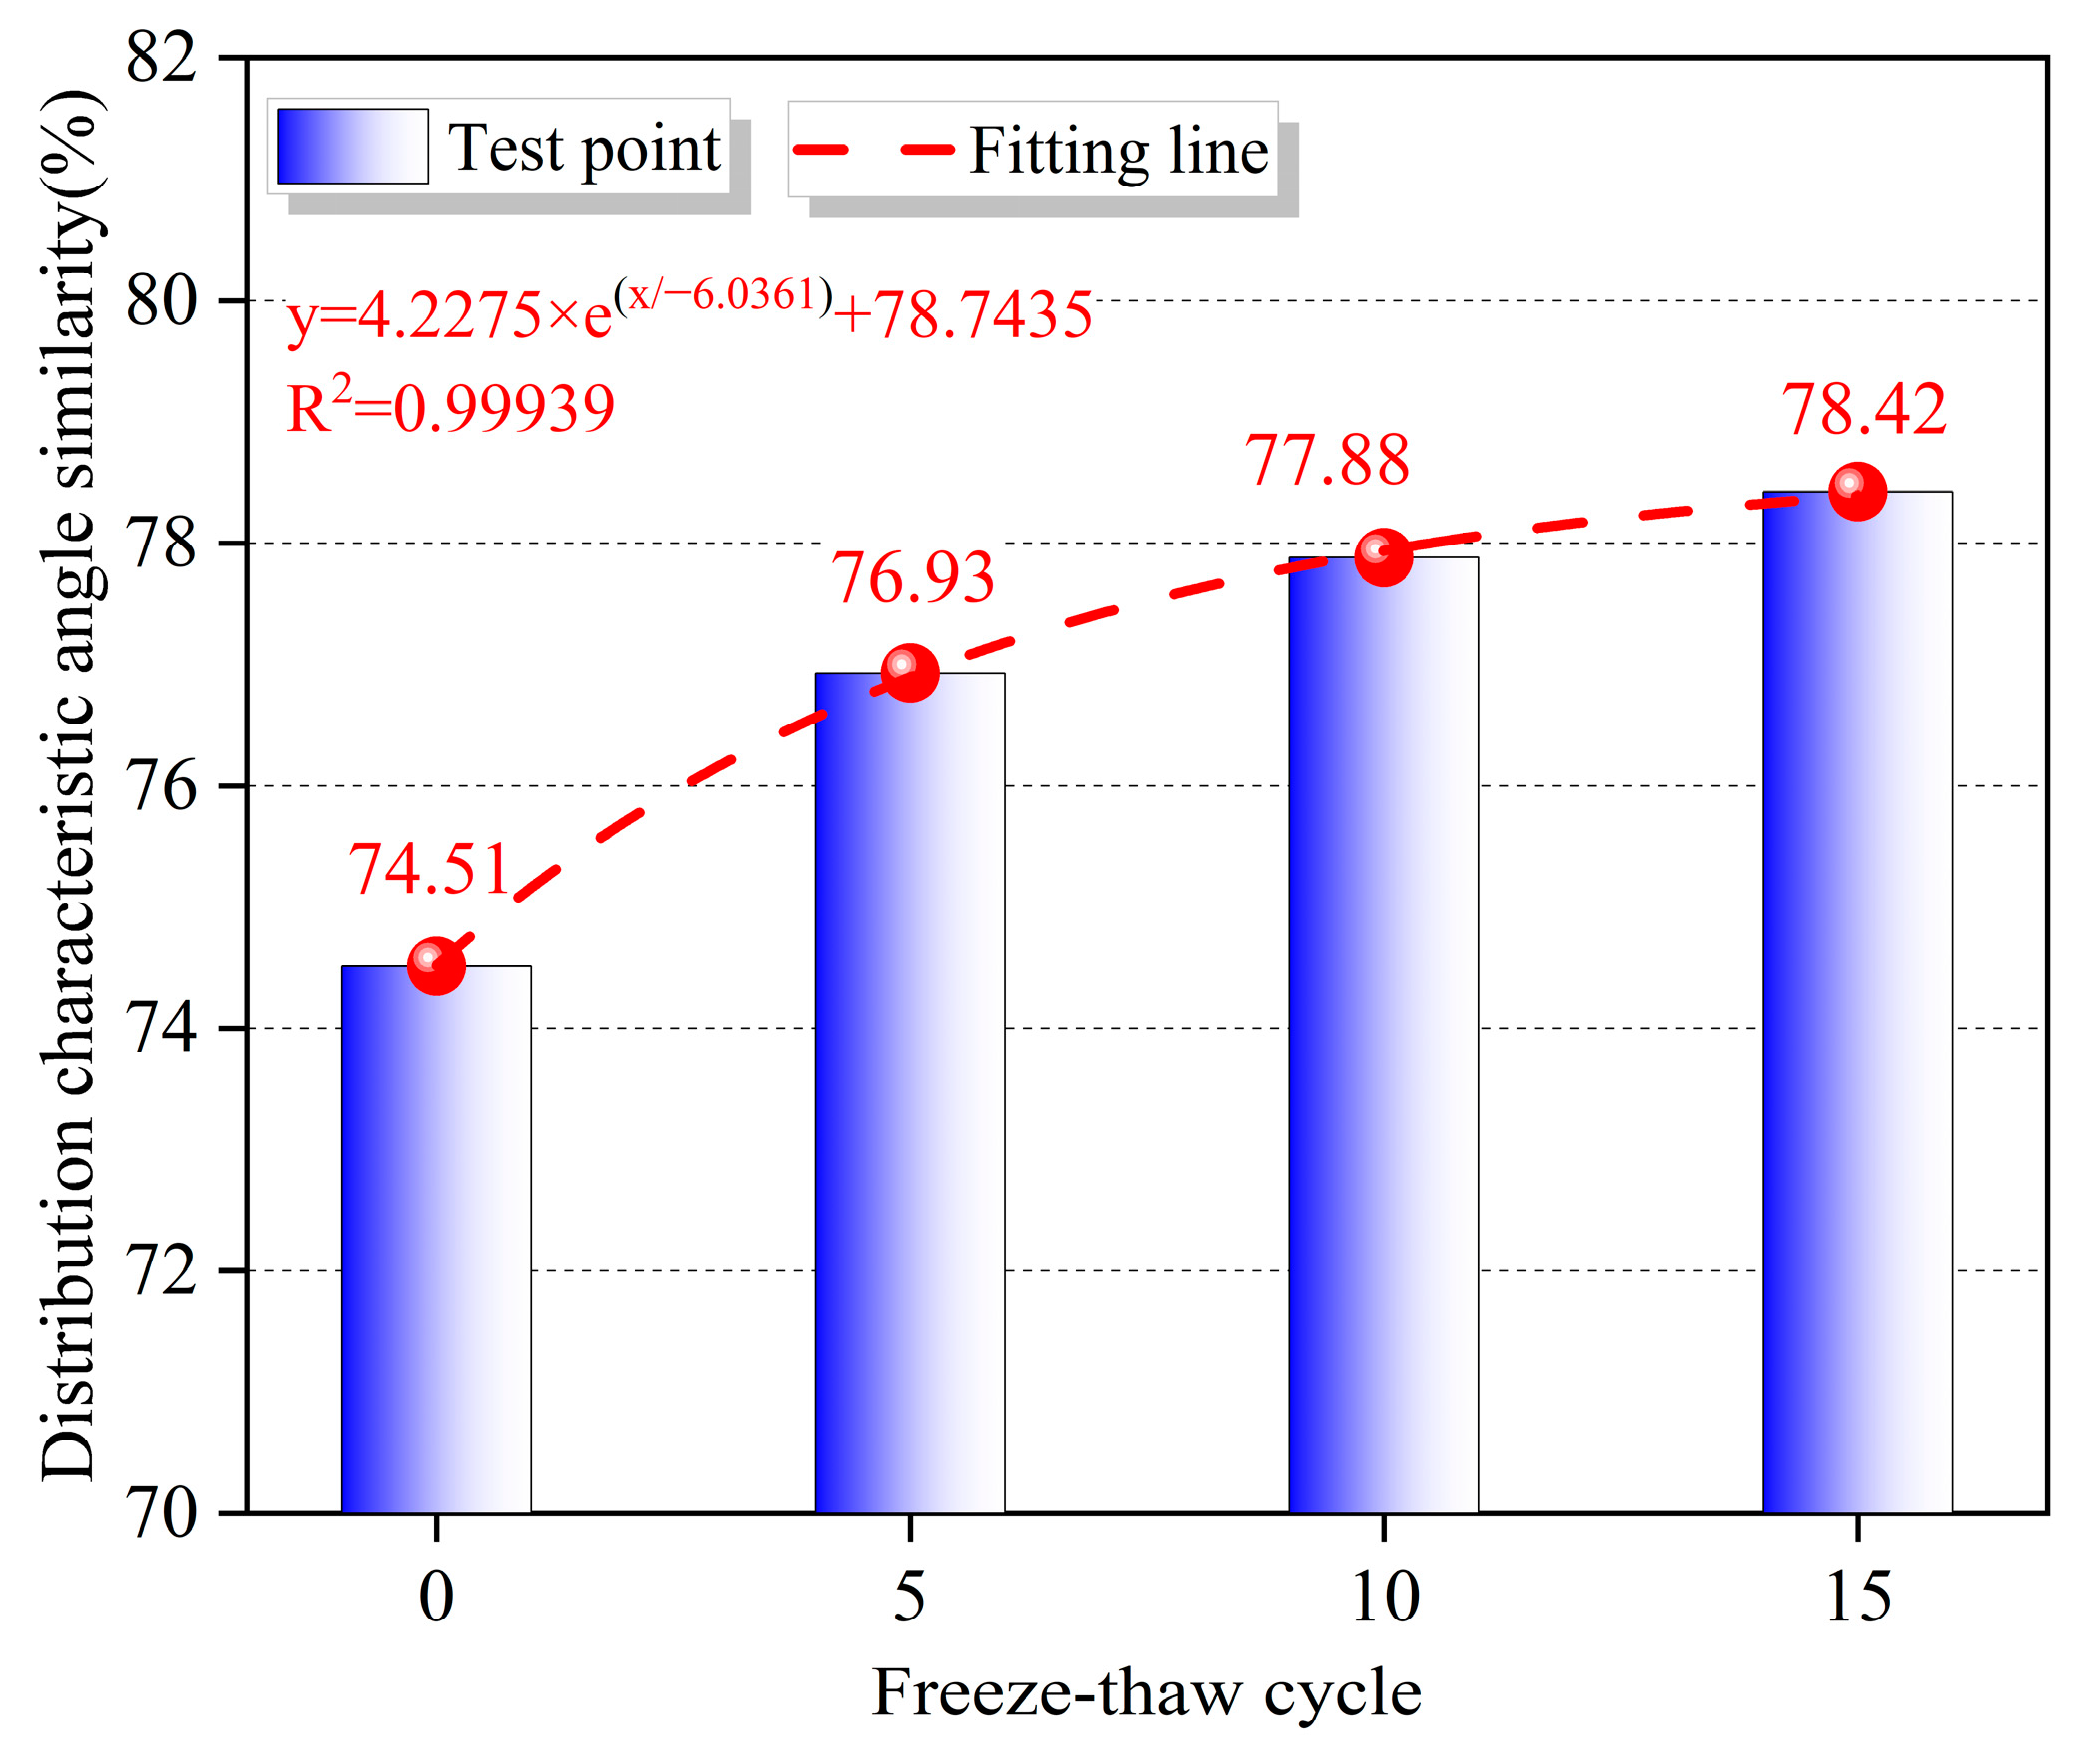
Under different freeze–thaw cycle conditions, the similarity of distribution characteristic angles in soil–rock mixtures can indirectly represent the microporosity. The similarity and the tangent values of the distribution characteristic angles in the soil–rock mixture exhibit a good exponential relationship with the number of freeze–thaw cycles. As the freeze–thaw cycles increased, the number of microscopic pores within the soil–rock mixture gradually increased, and the tangent values of the distribution characteristics decreased while the similarity increased.
(2)
The uniaxial compressive strength, peak secant modulus, and peak strain of the soil–rock mixture had good exponential relationships with the number of freeze–thaw cycles. The uniaxial compressive strength and peak secant modulus both exhibited exponential decay with an increasing number of freeze–thaw cycles. However, the peak strain showed an exponential increase trend. In addition, the stage of pore compaction also shows an increasing trend with an increasing cycle.
(3)
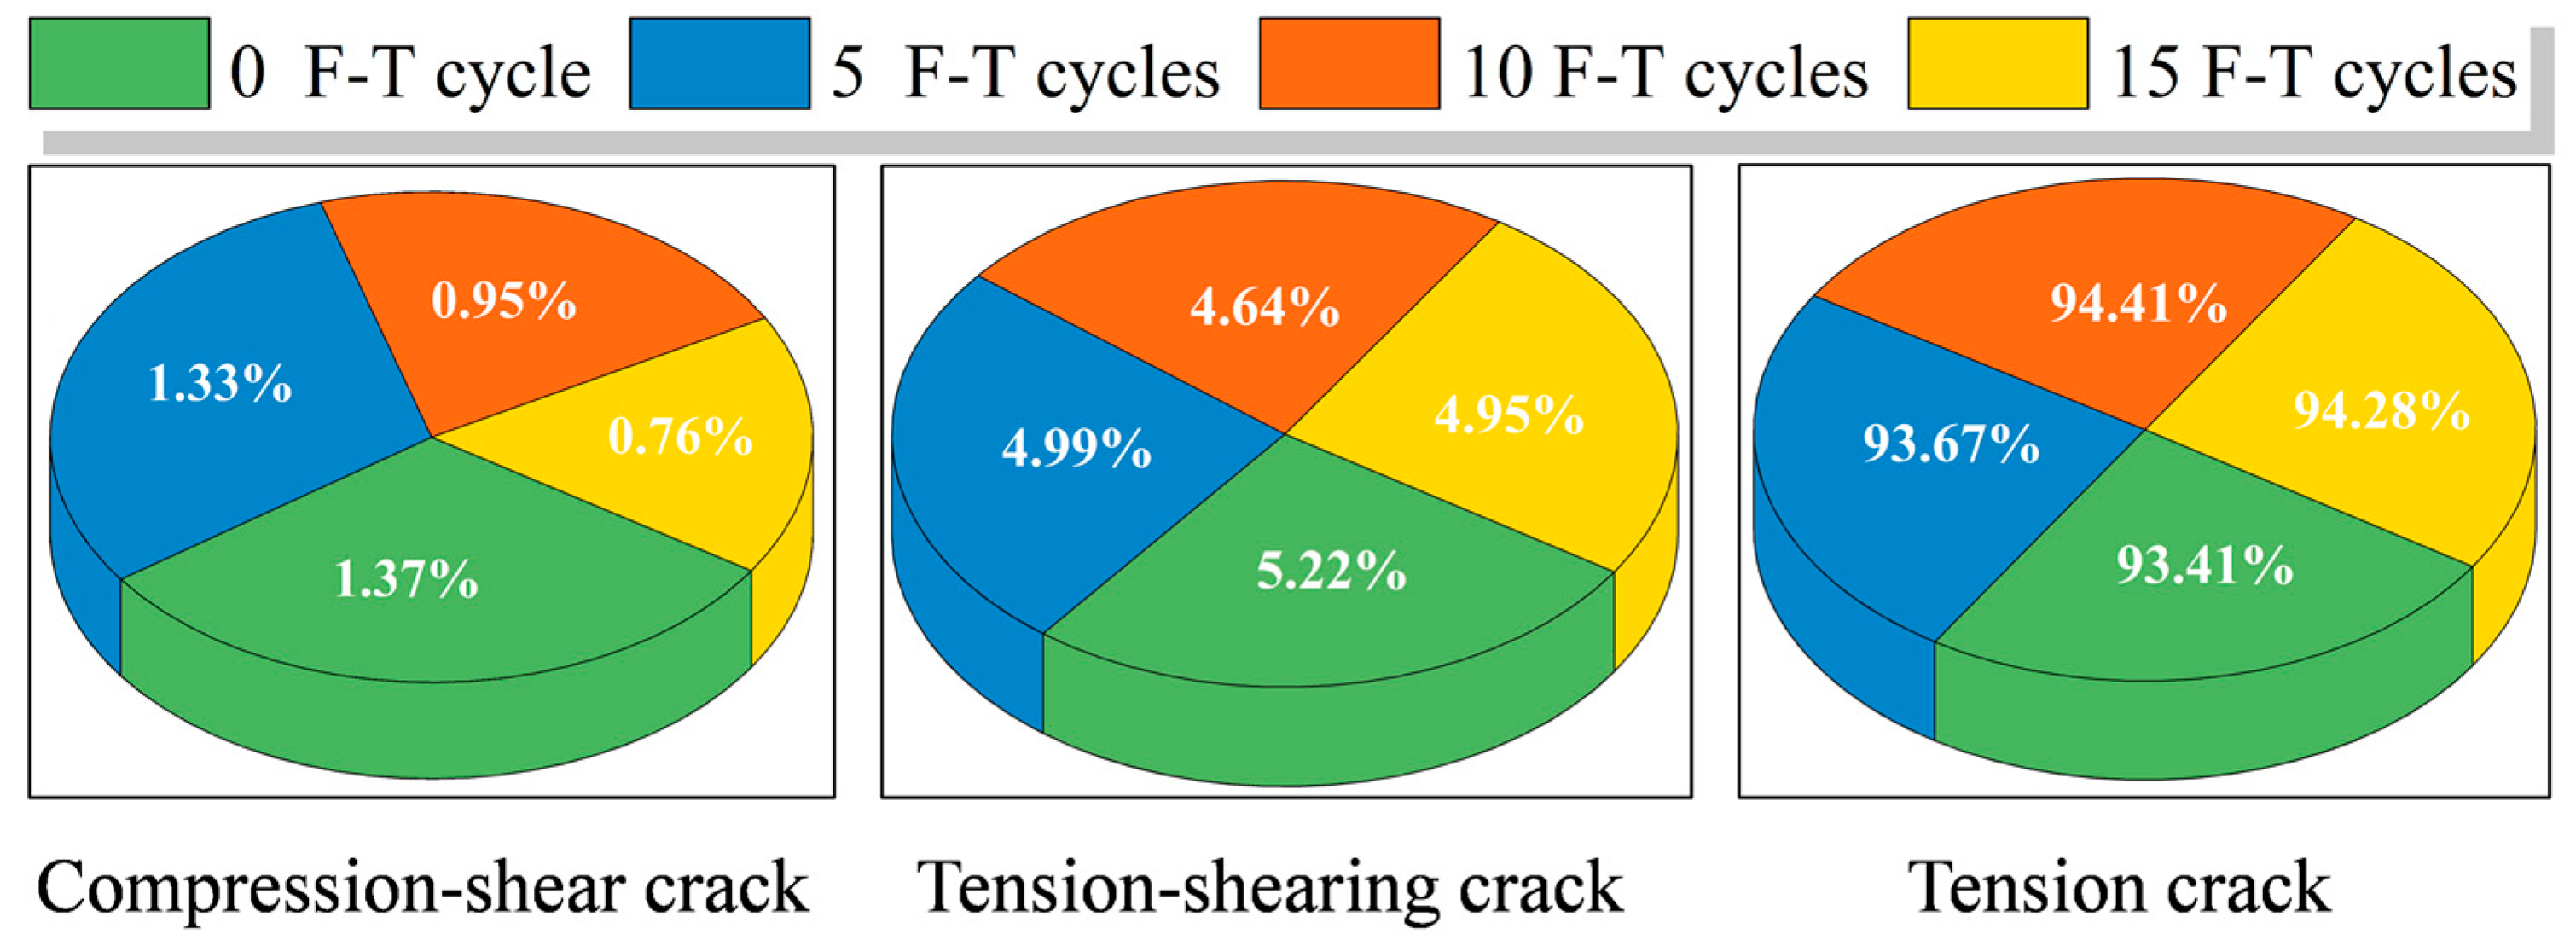
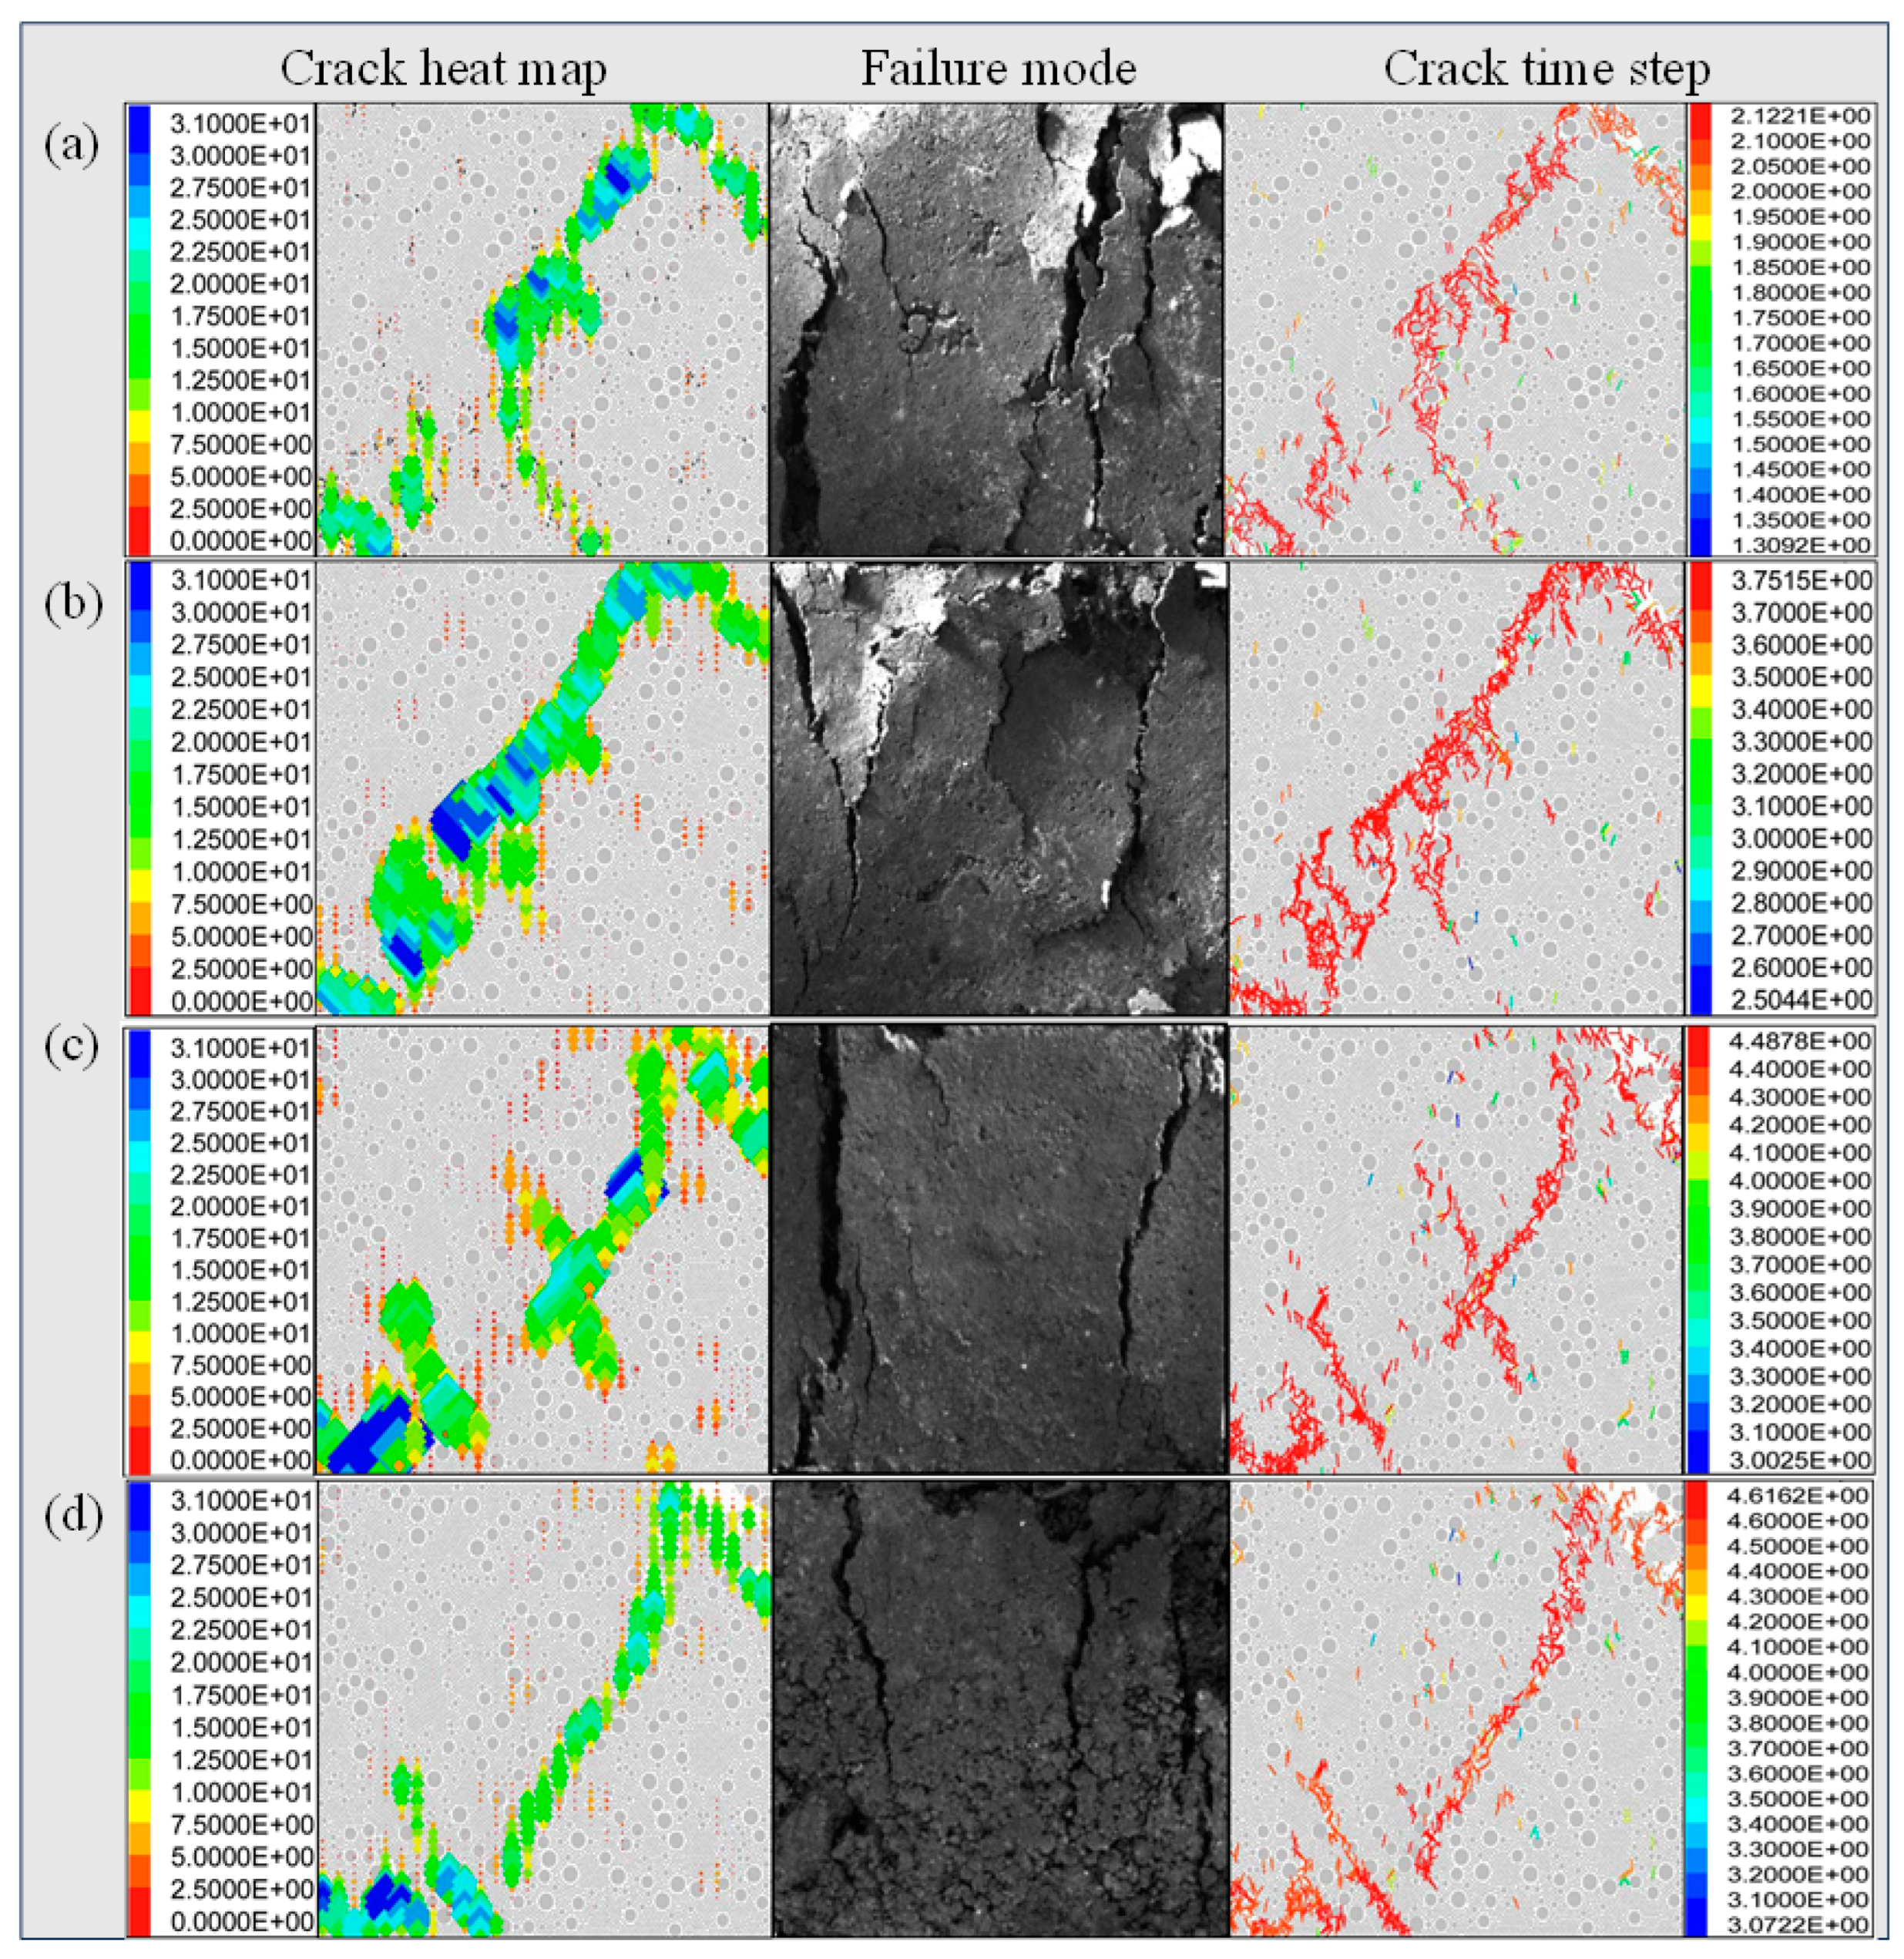
With an increasing number of freeze–thaw cycles, the effective modulus (emod)/bonded effective modulus (pb_emod) and the cohesion (pb_coh)/tensile strength (pb_ten) both exhibited decreasing trends. The strain of the soil and rock mixture when cracks begin to germinate also increased significantly. Under different freeze–thaw cycles, the failure modes and crack propagation patterns of the soil–rock mixture were generally similar. The crack propagation extended from the edges and corners toward the middle-lower part, with partial expansion toward both ends in the central region. The failure crack type was mainly tensile failure, followed by tensile–shear failure, and the compression–shear failure occurred the least.
(4)
Under different freeze–thaw cycles, there was a good linear relationship between the similarity of the soil–rock mixture and uniaxial compressive strength. The uniaxial compressive strength exhibited a linear decrease with an increasing similarity.

Author Contributions

Conceptualization, H.D.; Methodology, B.Z. and G.T.; Software, B.Z.; Formal analysis, H.D.; Investigation, B.Z. and G.T.; Data curation, Y.X.; Writing—original draft, B.Z. and G.T.; Writing—review and editing, H.D. and Y.X.; Supervision Y.X. All authors have read and agreed to the published version of the manuscript.

Funding

This research was funded by the school-enterprise joint project of Central South University, China (Grant No.2021XQLH153), China National Key R&D Program during the 14th Five-year Plan Period, China (Grant No.2021YFC2900400), National Natural Science Foundation of China Youth Science Foundation, China (Grant No.52004327).

Institutional Review Board Statement

Not applicable.

Informed Consent Statement

Not applicable.

Data Availability Statement

All the data analyzed in this study are included in this published article.

Acknowledgments

The author would like to thank the anonymous reviewers and sponsors.

Conflicts of Interest

The authors declare no conflict of interest.

References

  1. Xu, W.H.R. Particle size fractal characteristics of the soil–rock mixtures in the right bank slope of Jinsha River at Long-Pan, Tiger-Leaping Gorge area. Engng. Geol. 2006, 14, 496–501. (In Chinese) [Google Scholar]
  2. Xu, W.J.; Hu, R.L.; Tan, R.J. Some geomechanical properties of soil-rock mixtures in the Hutiao Gorge area, China. Geotechnique 2007, 57, 255–264. [Google Scholar] [CrossRef]
  3. Xua, W.J.; Xu, Q.; Hu, R.L. Study on the shear strength of soil-rock mixture by large scale direct shear test. Int. J. Rock Mech. Min. 2011, 48, 1235–1247. [Google Scholar] [CrossRef]
  4. Yu, J.; Jia, C.J.; Xu, W.Y.; Zhang, Q.; Wu, C.J. Granular discrete element simulation of the evolution characteristics of the shear band in soil-rock mixture based on particle rotation analysis. Environ. Earth Sci. 2021, 80, 213. [Google Scholar] [CrossRef]
  5. Kahraman, S.; Alber, M. Estimating unconfined compressive strength and elastic modulus of a fault breccia mixture of weak blocks and strong matrix. Int. J. Rock Mech. Min. 2006, 43, 1277–1287. [Google Scholar] [CrossRef]
  6. Gao, W.H.R.; Oyediran, I.A.; Li, Z.Q.; Zhang, X.Y. Geomechanical characterization of zhangmu soil-rock mixture deposit. Geotech. Geol. Eng. 2014, 32, 1329. [Google Scholar] [CrossRef]
  7. Holtz, W.G.; Ellis, W. Triaxial shear characteristics of clayey gravel soils. J. Soil Mech. Found. Div. 1956, 820, 1–22. [Google Scholar]
  8. Wei, H.Z.; Xu, W.J.; Wei, C.F.; Meng, Q.S. Influence of water content and shear rate on the mechanical behavior of soil-rock mixtures. Sci. China Technol. Sc. 2018, 61, 1127–1136. [Google Scholar] [CrossRef]
  9. Gao, F.; Xiong, X.; Xu, C.S.; Zhou, K.P. Mechanical property deterioration characteristics and a new constitutive model for rocks subjected to freeze-thaw weathering process. Int. J. Rock Mech. Min. 2021, 140, 104642. [Google Scholar] [CrossRef]
  10. Xiao, Y.G.; Deng, H.W.; Tian, G.L.; Yu, S.T. Analysis of Microscopic Pore Characteristics and Macroscopic Energy Evolution of Rock Materials under Freeze-Thaw Cycle Conditions. Mathematics 2023, 11, 710. [Google Scholar] [CrossRef]
  11. Wei, Z.N.; Yang, W.; Zhai, C.; Sun, Y.; Tang, W.; Chen, A.K.; Xu, H.X.; Wang, Y. Freezing characteristics and microstructural damage evolution of granular materials in cold regions under freezing-thawing cycles. Environ. Earth Sci. 2023, 82, 191. [Google Scholar] [CrossRef]
  12. Tang, L.Y.; Lu, Z.H.; Zheng, J.J.; Zheng, J.G.; Jin, L.; Yu, Y.T.; Jia, H.L.; Sun, Q.; Wu, D.; Li, G. Mechanism of strength degradation of frozen soil-rock mixture under temperature rise-induced particle ice film ablation. Permafr. Periglac. 2023. early access. [Google Scholar] [CrossRef]
  13. Xing, K.; Zhou, Z.; Yang, H.; Liu, B.C. Macro-meso freeze-thaw damage mechanism of soil-rock mixtures with different rock contents. Int. J. Pavement. Eng. 2020, 21, 9–19. [Google Scholar] [CrossRef]
  14. Zhou, Z.; Li, F.; Yang, H.; Gao, W.Y.; Miao, L.W. Orthogonal experimental study of soil-rock mixtures under the freeze-thaw cycle environment. Int. J. Pavement. Eng. 2021, 22, 1376–1388. [Google Scholar] [CrossRef]
  15. Zhou, Z.; Xing, K.; Yang, H.; Wang, H. Damage mechanism of soil-rock mixture after freeze-thaw cycles. J. Cent. S Univ. 2019, 26, 13–24. [Google Scholar] [CrossRef]
  16. Tang, L.Y.; Li, G.; Luo, T.; Jin, L.; Yu, Y.T.; Sun, Q.; Li, G.Y. Mechanism of shear strength deterioration of soil-rock mixture after freeze-thaw cycles. Cold Reg. Sci. Technol. 2022, 200, 103585. [Google Scholar] [CrossRef]
  17. Tang, L.Y.; Li, G.; Li, Z.; Jin, L.; Yang, G.S. Shear properties and pore structure characteristics of soil-rock mixture under freeze-thaw cycles. B Eng. Geol. Environ. 2021, 80, 3233–3249. [Google Scholar] [CrossRef]
  18. Xu, W.J.; Zhang, H.Y. Research on the effect of rock content and sample size on the strength behavior of soil-rock mixture. B Eng. Geol. Environ. 2021, 80, 2715–2726. [Google Scholar] [CrossRef]
  19. Medley, E.W. The Engineering Characterization of Melanges and Similar Block-in-Matrix Rocks (Bimrocks); University of California: Berkeley, CA, USA, 1994. [Google Scholar]
  20. Dong, H.; Zhu, X.; Chen, L.; Luo, Z.; Jiang, X. Study on pore characteristics of soil-rock mixture resistance similarity based on the electrochemical impedance spectroscopy. Chin. J. Sci. Instrum. 2020, 41, 119–128. (In Chinese) [Google Scholar]
  21. Bard, A.J.; Faulkner, L.R. Electrochemical Methods Fundamentals and Applications, 2nd ed.; Shao, Y.H.; Zhu, G.Y.; Dong, X.D., Translators; Chemical Industry Press: Beijing, China, 2005. [Google Scholar]
  22. Andrade, C.; Blanco, V.M.; Collazo, A.; Keddam, M.; Nóvoa, X.R.; Takenouti, H. Cement paste hardening process studied by impedance spectroscopy. Electrochim. Acta 1999, 44, 4313–4318. [Google Scholar] [CrossRef]
  23. GB/T 50123-2019; Geotechnical Test Method Standard. Ministry of Water Resources of the People’s Republic of China. China Standard Press: Beijing, China, 2019. (In Chinese)
  24. Cundall, P.A.; Strack, O.D.L. A discrete numerical model for granular assemblies. Geotechnique 1979, 29, 47–65. [Google Scholar] [CrossRef]
  25. Zhao, Z.L.; Wang, X.; Wen, Z.J. Analysis of Rock Damage Characteristics Based on Particle Discrete Element Model. Geotech. Geol. Eng. 2018, 36, 897–904. [Google Scholar] [CrossRef]
  26. Ning, J.G.; Liu, X.S.; Tan, Y.L.; Wang, J.; Tian, C.L. Relationship of box counting of fractured rock mass with Hoek-Brown parameters using particle flow simulation. Geomech. Eng. 2015, 9, 619–629. [Google Scholar] [CrossRef]
  27. Li, J.L.; Zhu, L.Y.; Zhou, K.P.; Liu, H.W.; Cao, S.P. Damage characteristics of sandstone pore structure under freeze-thaw cycles. Rock Soil Mech. 2019, 40, 3524–3532. [Google Scholar] [CrossRef]
  28. Gao, F.; Xiong, X.; Zhou, K.P.; Li, J.L.; Shi, W.C. Strength deterioration model of saturated sandstone under freeze-thaw cycles. Rock Soil Mech. 2019, 40, 926–932. [Google Scholar] [CrossRef]
Figure 1. Typical dump slope and soil–rock mixed morphology.
Applsci 13 11504 g001
Figure 2. Temperature statistics of Jixi City from 2019 to 2021.
Applsci 13 11504 g002
Figure 3. Soil and stone with different particle sizes.
Applsci 13 11504 g003
Figure 4. On-site sampling and grading curve of soil–rock mixture.
Applsci 13 11504 g004
Figure 5. Freeze–thaw cycle process.
Applsci 13 11504 g005
Figure 6. Schematic diagram of electrochemical test and equivalent circuit model.
Applsci 13 11504 g006
Figure 7. The test results of EIS. (a) The trend of total impedance as a function of frequency. (b) Nyquist plot of EIS.
Applsci 13 11504 g007
Figure 8. The complete test processes.
Applsci 13 11504 g008
Figure 9. Schematic diagram of numerical simulation of the soil–rock mixture. g s is the surface gap between particles. k n and k s are the normal stiffness of a linear spring and the shear stiffness of a linear spring ;   k ¯ n ,   k ¯ s , and σ ¯ c are the normal stiffness, the shear stiffness, and the normal strength of the parallel bond. c ¯ , ϕ ¯ is the shear strength of the parallel bond, and μ is the coefficient of friction.
Applsci 13 11504 g009
Figure 10. Changes in characteristic points and angles of soil–rock mixtures under different freeze–thaw cycles. (a) Distribution characteristic point variation law and fitting results. (b) Distribution characteristic angle variation law and fitting results.
Applsci 13 11504 g010
Figure 11. Distribution of microscopic pore structure of soil–rock mixture.
Applsci 13 11504 g011
Figure 12. Fitting results in similarity of soil–rock mixtures to the number of freeze–thaw cycles.
Applsci 13 11504 g012
Figure 13. Stress–strain curve and crack number curve of soil–rock mixture under different freeze–thaw cycles. (a) Stress–strain curves under different freeze–thaw cycles. (b) The fitting relationship between freeze–thaw cycles and uniaxial compressive strength.
Applsci 13 11504 g013
Figure 14. Fitting and calculation results of mechanical characteristic parameters of soil–rock mixture with the number of freeze–thaw cycles. (a) Relationships between freeze–thaw cycles and peak strain as well as secant modulus. (b) Numerical simulation results in uniaxial compression under different freeze–thaw cycles.
Applsci 13 11504 g014
Figure 15. Crack growth laws of soil–rock mixtures under different freeze–thaw cycles; (ad) were 0, 5, 10, and 15 cycle specimens, respectively.
Applsci 13 11504 g015
Figure 16. Crack classification of soil–rock mixture under different freeze–thaw cycles.
Applsci 13 11504 g016
Figure 17. Fitting relationship between similarity of soil–rock mixture and macroscopic mechanical properties.
Applsci 13 11504 g017
Table 1. Test parameters of EIS.
Main
Parameters
Start Frequency (Hz)End Frequency (Hz)Data QualityCurrent Range (mA)Voltage Range (V)Electrometer Mode
Parameter value1,000,0000.0132+/−6Differential
Table 2. Numerical simulation parameters under different freeze–thaw cycles.
F-T CycleDensity
(kg/m3)
KratioPorosityFricemod/
pb-Emod (GPa)
pb_coh/
pb_ten (MPa)
pb_fa (°)
024071.50.030.50.66980.359440
50.21170.2889
100.19820.2381
150.15090.1882
Table 3. Statistical numerical simulation results in different cycles of freeze–thaw times.
F-T
Cycle
Peak Secant Modulus (GPa)Peak Stress (MPa)
Indoor Test ParametersNumerical Simulation ParametersErrorIndoor Test ParametersNumerical Simulation ParametersError
00.016491730.016425036.66996 × 10−50.34880.342590.00621
50.007404910.0074182771.33674 × 10−50.27450.274750.00025
100.005193120.0051710052.2115 × 10−50.23260.229090.00351
150.003980030.0039631421.68878 × 10−50.18340.180040.00336
Disclaimer/Publisher’s Note: The statements, opinions and data contained in all publications are solely those of the individual author(s) and contributor(s) and not of MDPI and/or the editor(s). MDPI and/or the editor(s) disclaim responsibility for any injury to people or property resulting from any ideas, methods, instructions or products referred to in the content.

