
Research on the Intelligent Modeling Design of a Truck Front Face Driven by User Imagery


Abstract
:1. Introduction
2. Methods
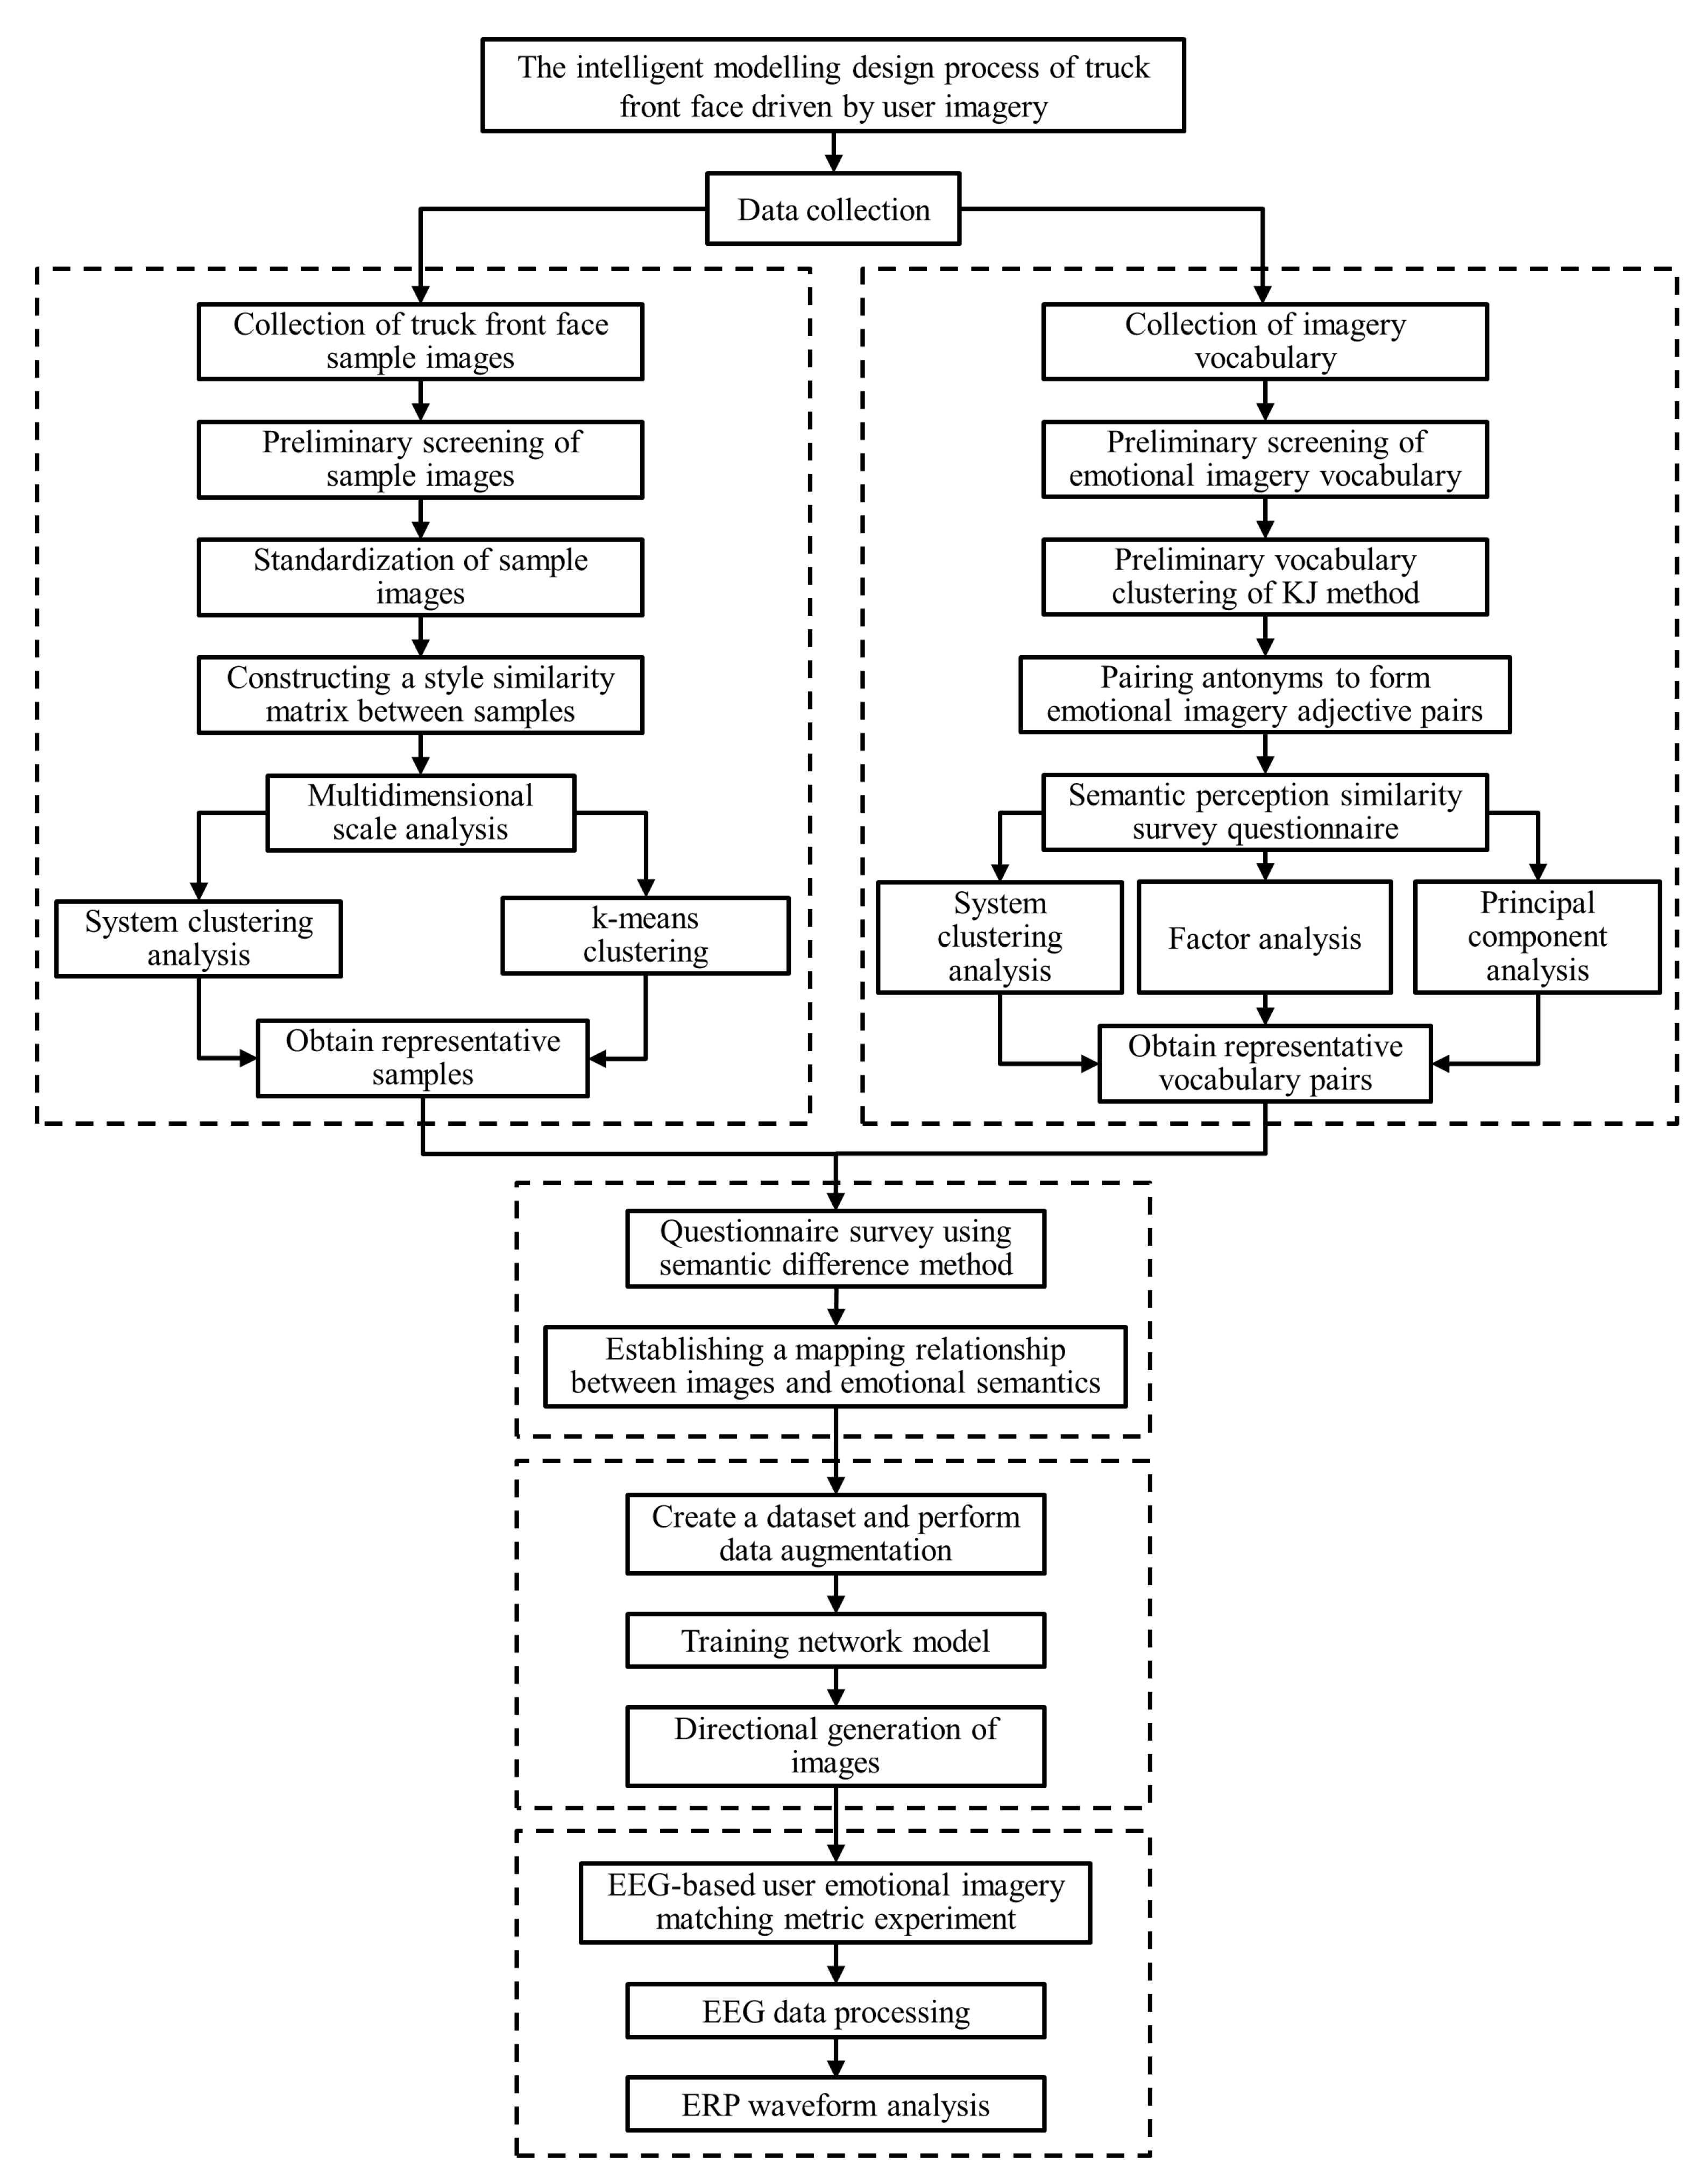
2.1. Research Framework
- (1)
- Focus group method: This article used the focus group method at multiple stages of the research process. Firstly, this method was used for the preliminary screening of truck front face sample images. Secondly, this method was used for preliminary clustering of sample appearance similarity. Finally, this method was used in the screening of representative image vocabulary. The purpose of using the focus group method is to remove image vocabulary that is not suitable for evaluating the image of the front face of a truck and reduce the testing burden for participants in perceptual–cognitive measurement experiments. Large amounts of data are not conducive to research or participants answering questions, and they will affect the accuracy and reliability of measurement results. So, it is necessary to use focus groups to reduce the data and select representative data for emotional imagery research.
- (2)
- Delphi method: This study used a combination of the Delphi method and the focus group method in screening image vocabulary. This can comprehensively utilize the advantages of individual expert thinking and group collaboration to obtain more comprehensive and diverse information. At the same time, it can also supplement the shortcomings of the focus group method and ensure the independence of individual decision-making.
- (3)
- KJ method (Affinity Diagram): This method used the KJ method to cluster truck front face samples and image vocabulary. The main purpose of using the KJ method is to classify and organize similar samples and image vocabulary in order to discover the connections and commonalities between these samples and image vocabulary or better understand data features and find appropriate clustering partitions. At the same time, using focus groups for KJ clustering also enhances the reliability of clustering and avoids personal subjective emotional interference with clustering results.
- (4)
- Multi-dimensional scale analysis: This method uses multi-dimensional scale analysis to calculate similarity data between samples in order to evaluate their correlation and convert high-dimensional data into sample coordinates in low-dimensional space, reducing data dimensionality, thereby simplifying the model and improving computational efficiency.
- (5)
- System clustering analysis: This method used a systematic clustering method to determine representative samples and representative image vocabulary. The purpose is to view the clustering status of sample data through a tree graph and the clustering evolution process of the data through a lineage graph.
- (6)
- K-means cluster analysis: This method uses K-means clustering analysis to obtain the categories to which each representative sample belongs and the distance from the center of the category to which it belongs. The purpose is to find representative samples in each cluster category.
- (7)
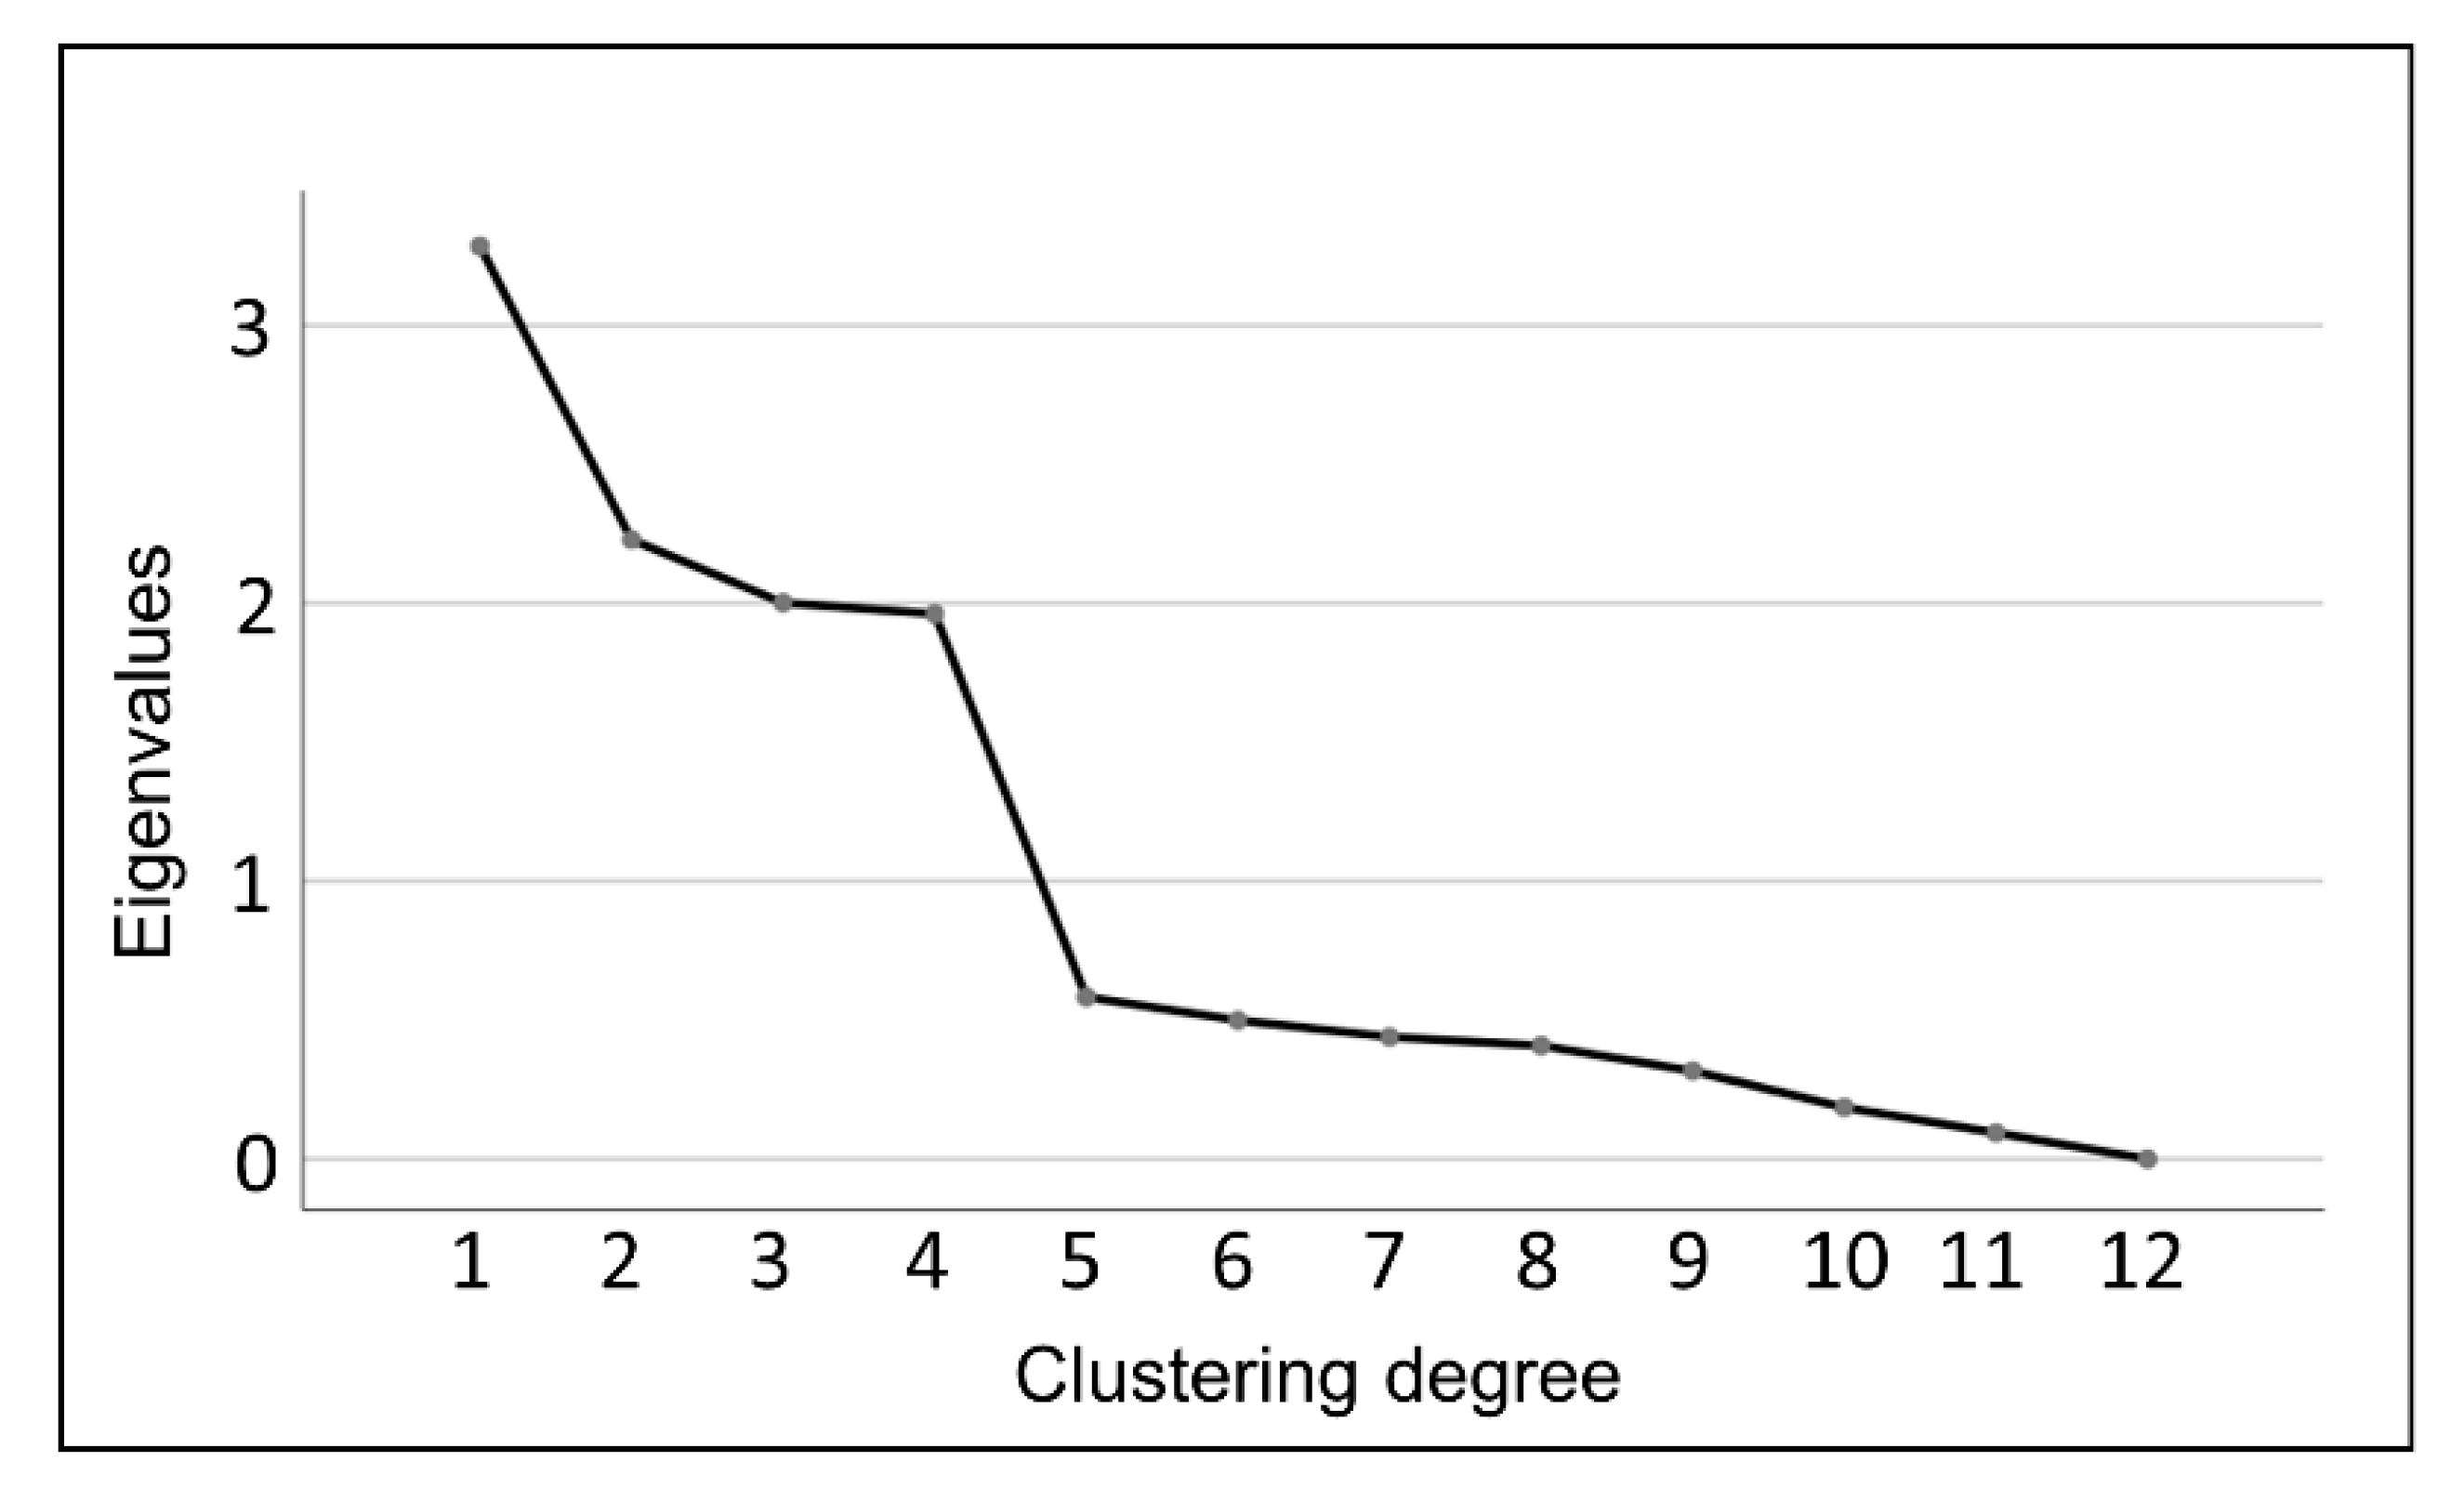
- Factor analysis: This method uses factor analysis to obtain a gravel map. Then, by observing the curve changes of the gravel map, it identifies the turning point where the difference in feature values within the group suddenly increases significantly in order to determine the appropriate number of clustering groups.
- (8)
- Principal component analysis: This method uses principal component analysis to identify representative image vocabulary pairs, which are the words with the highest component score within the group.
- (9)
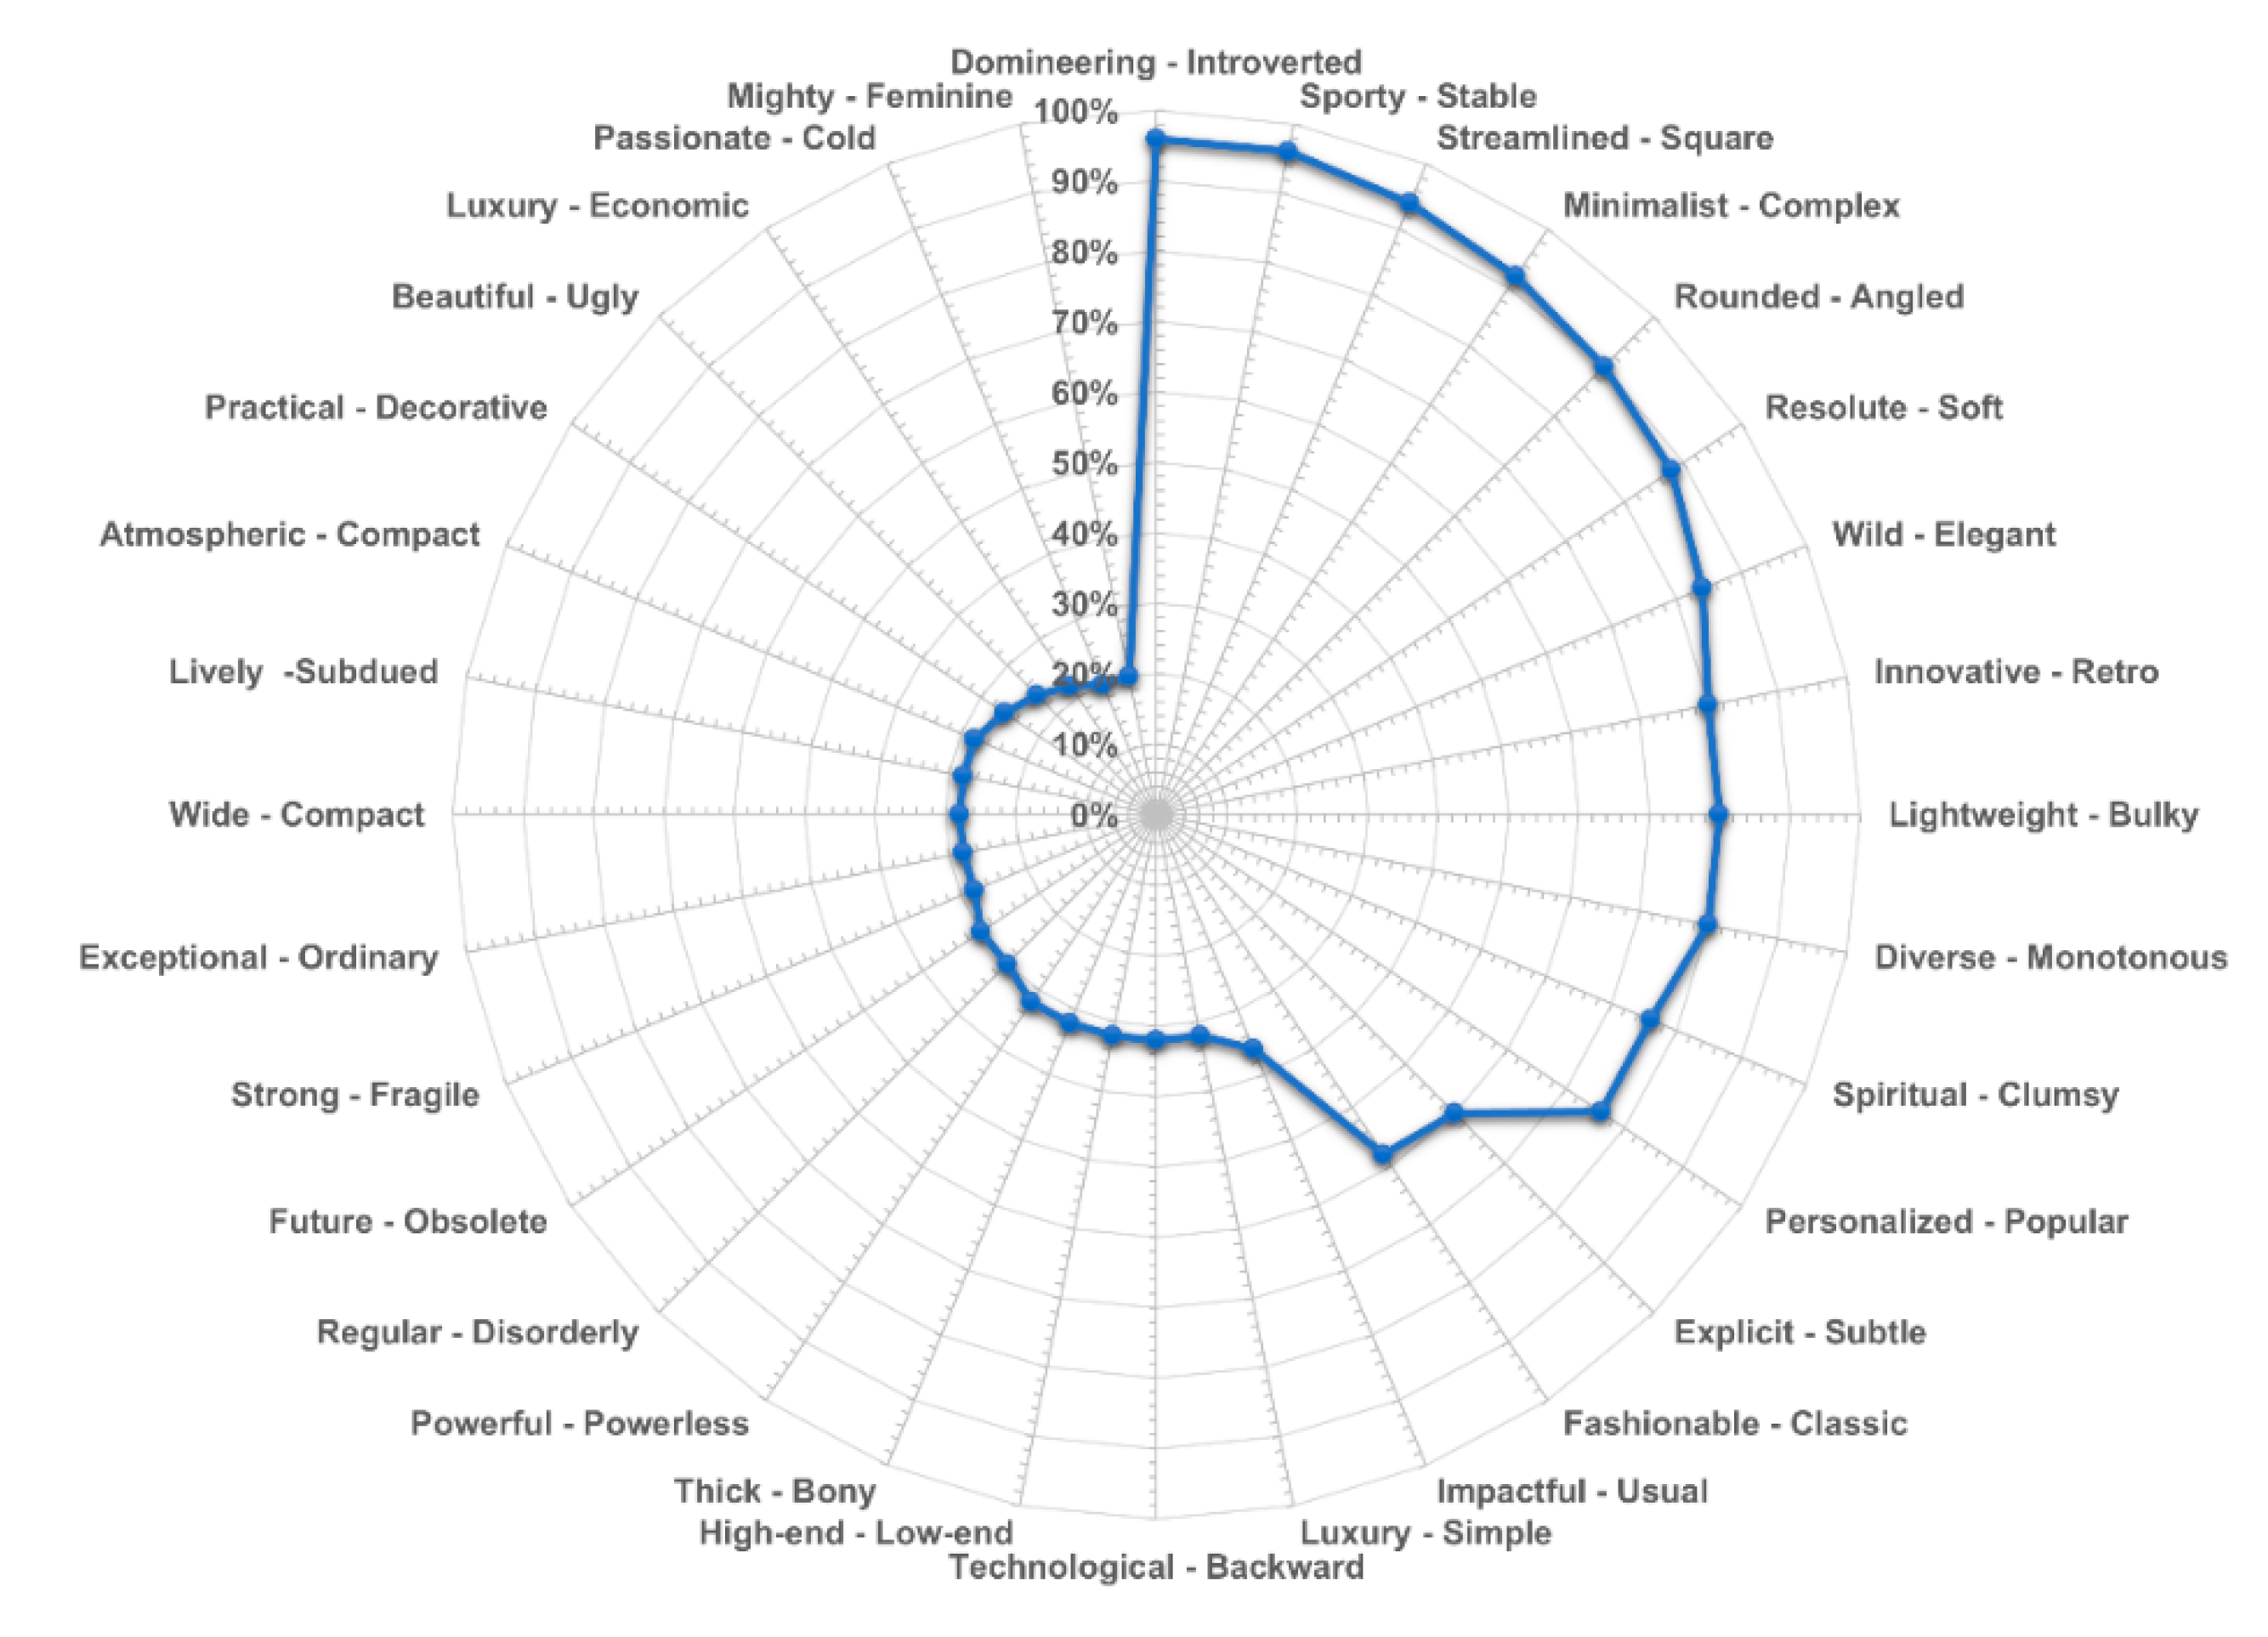
- Semantic difference method: This method uses the semantic difference method to determine the mapping relationship between representative image vocabulary and representative samples. Among them, the positive values in the questionnaire tend to favor the vocabulary on the right side of the number axis, while the negative values tend to favor the vocabulary on the left side of the number axis. The higher the absolute value, the higher the degree of inclination.
2.2. Experimental Methods and Evaluation Process
2.2.1. Kansei Imagery Measurement Stage
2.2.2. Design Implementation Stage
2.2.3. Design Evaluation Stage
2.3. Summary of Methods
3. Methods
3.1. Construction of Emotional Imagery Sample Set
3.1.1. Collection of Truck Front Face Sample Images
- (1)
- Determine the collection method.
- (2)
- Determination of sample collection targets and data sources.
3.1.2. Preliminary Screening of Truck Front Face Sample Images
3.1.3. Standardization of Sample Images
- (1)
- Adjust the aspect ratio of each sample image to square.
- (2)
- Adjust the main content of the sample to be in the middle of the picture and have the same proportion.
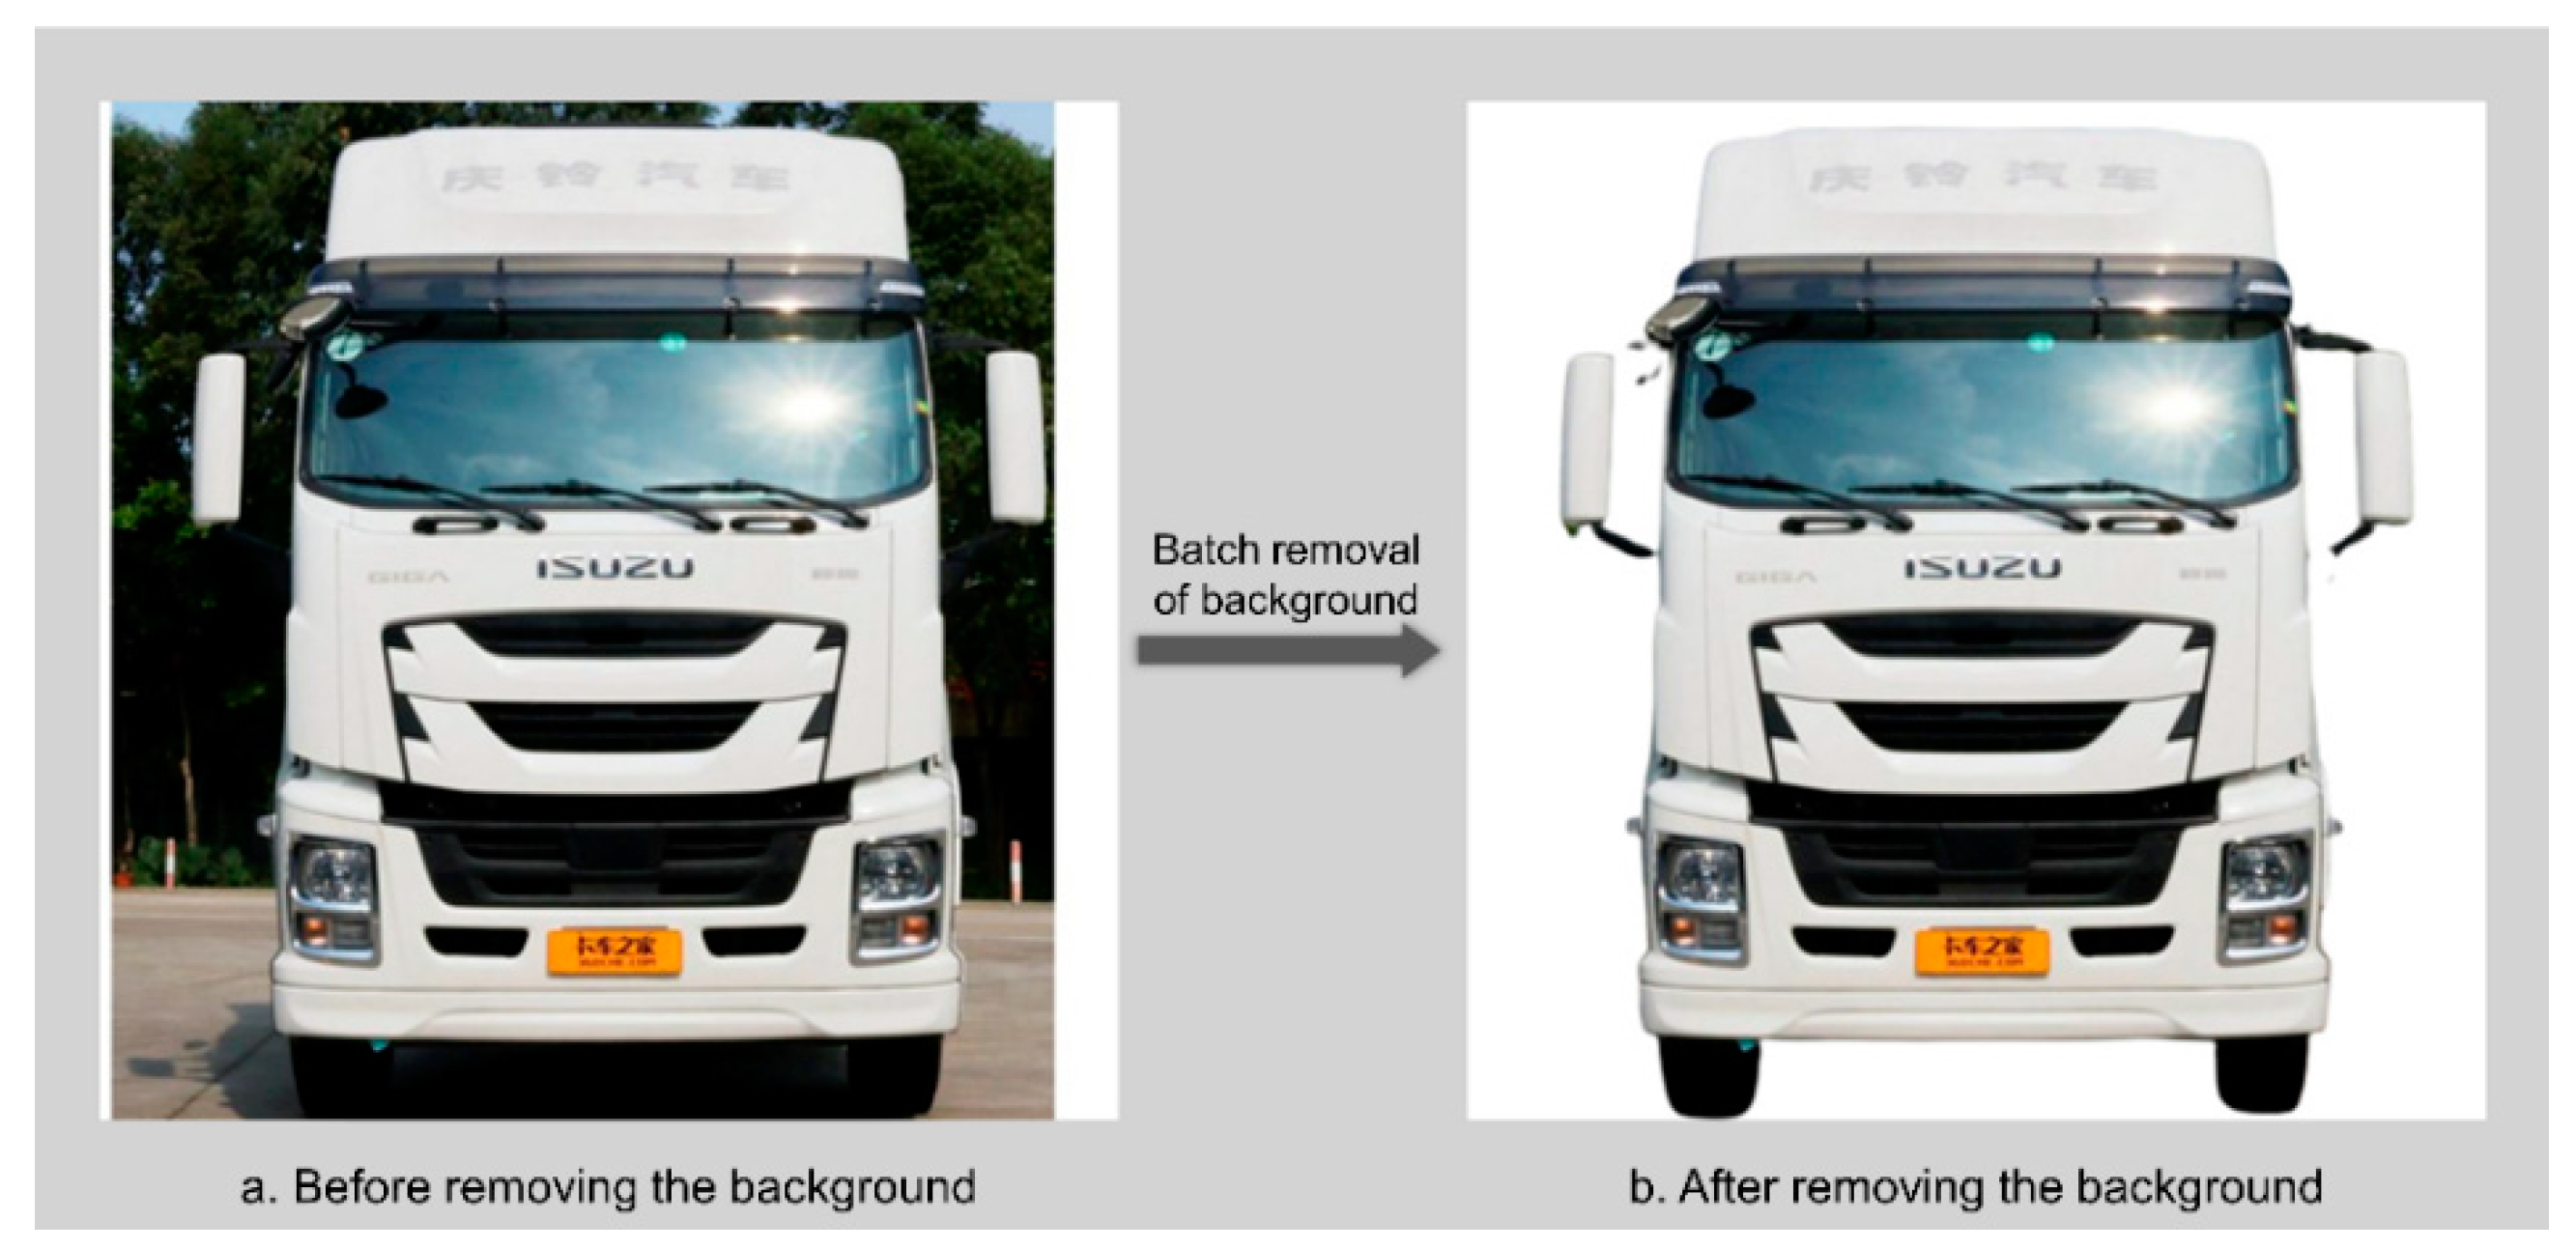
- (3)
- Remove the background of the sample image of the front face of the truck.
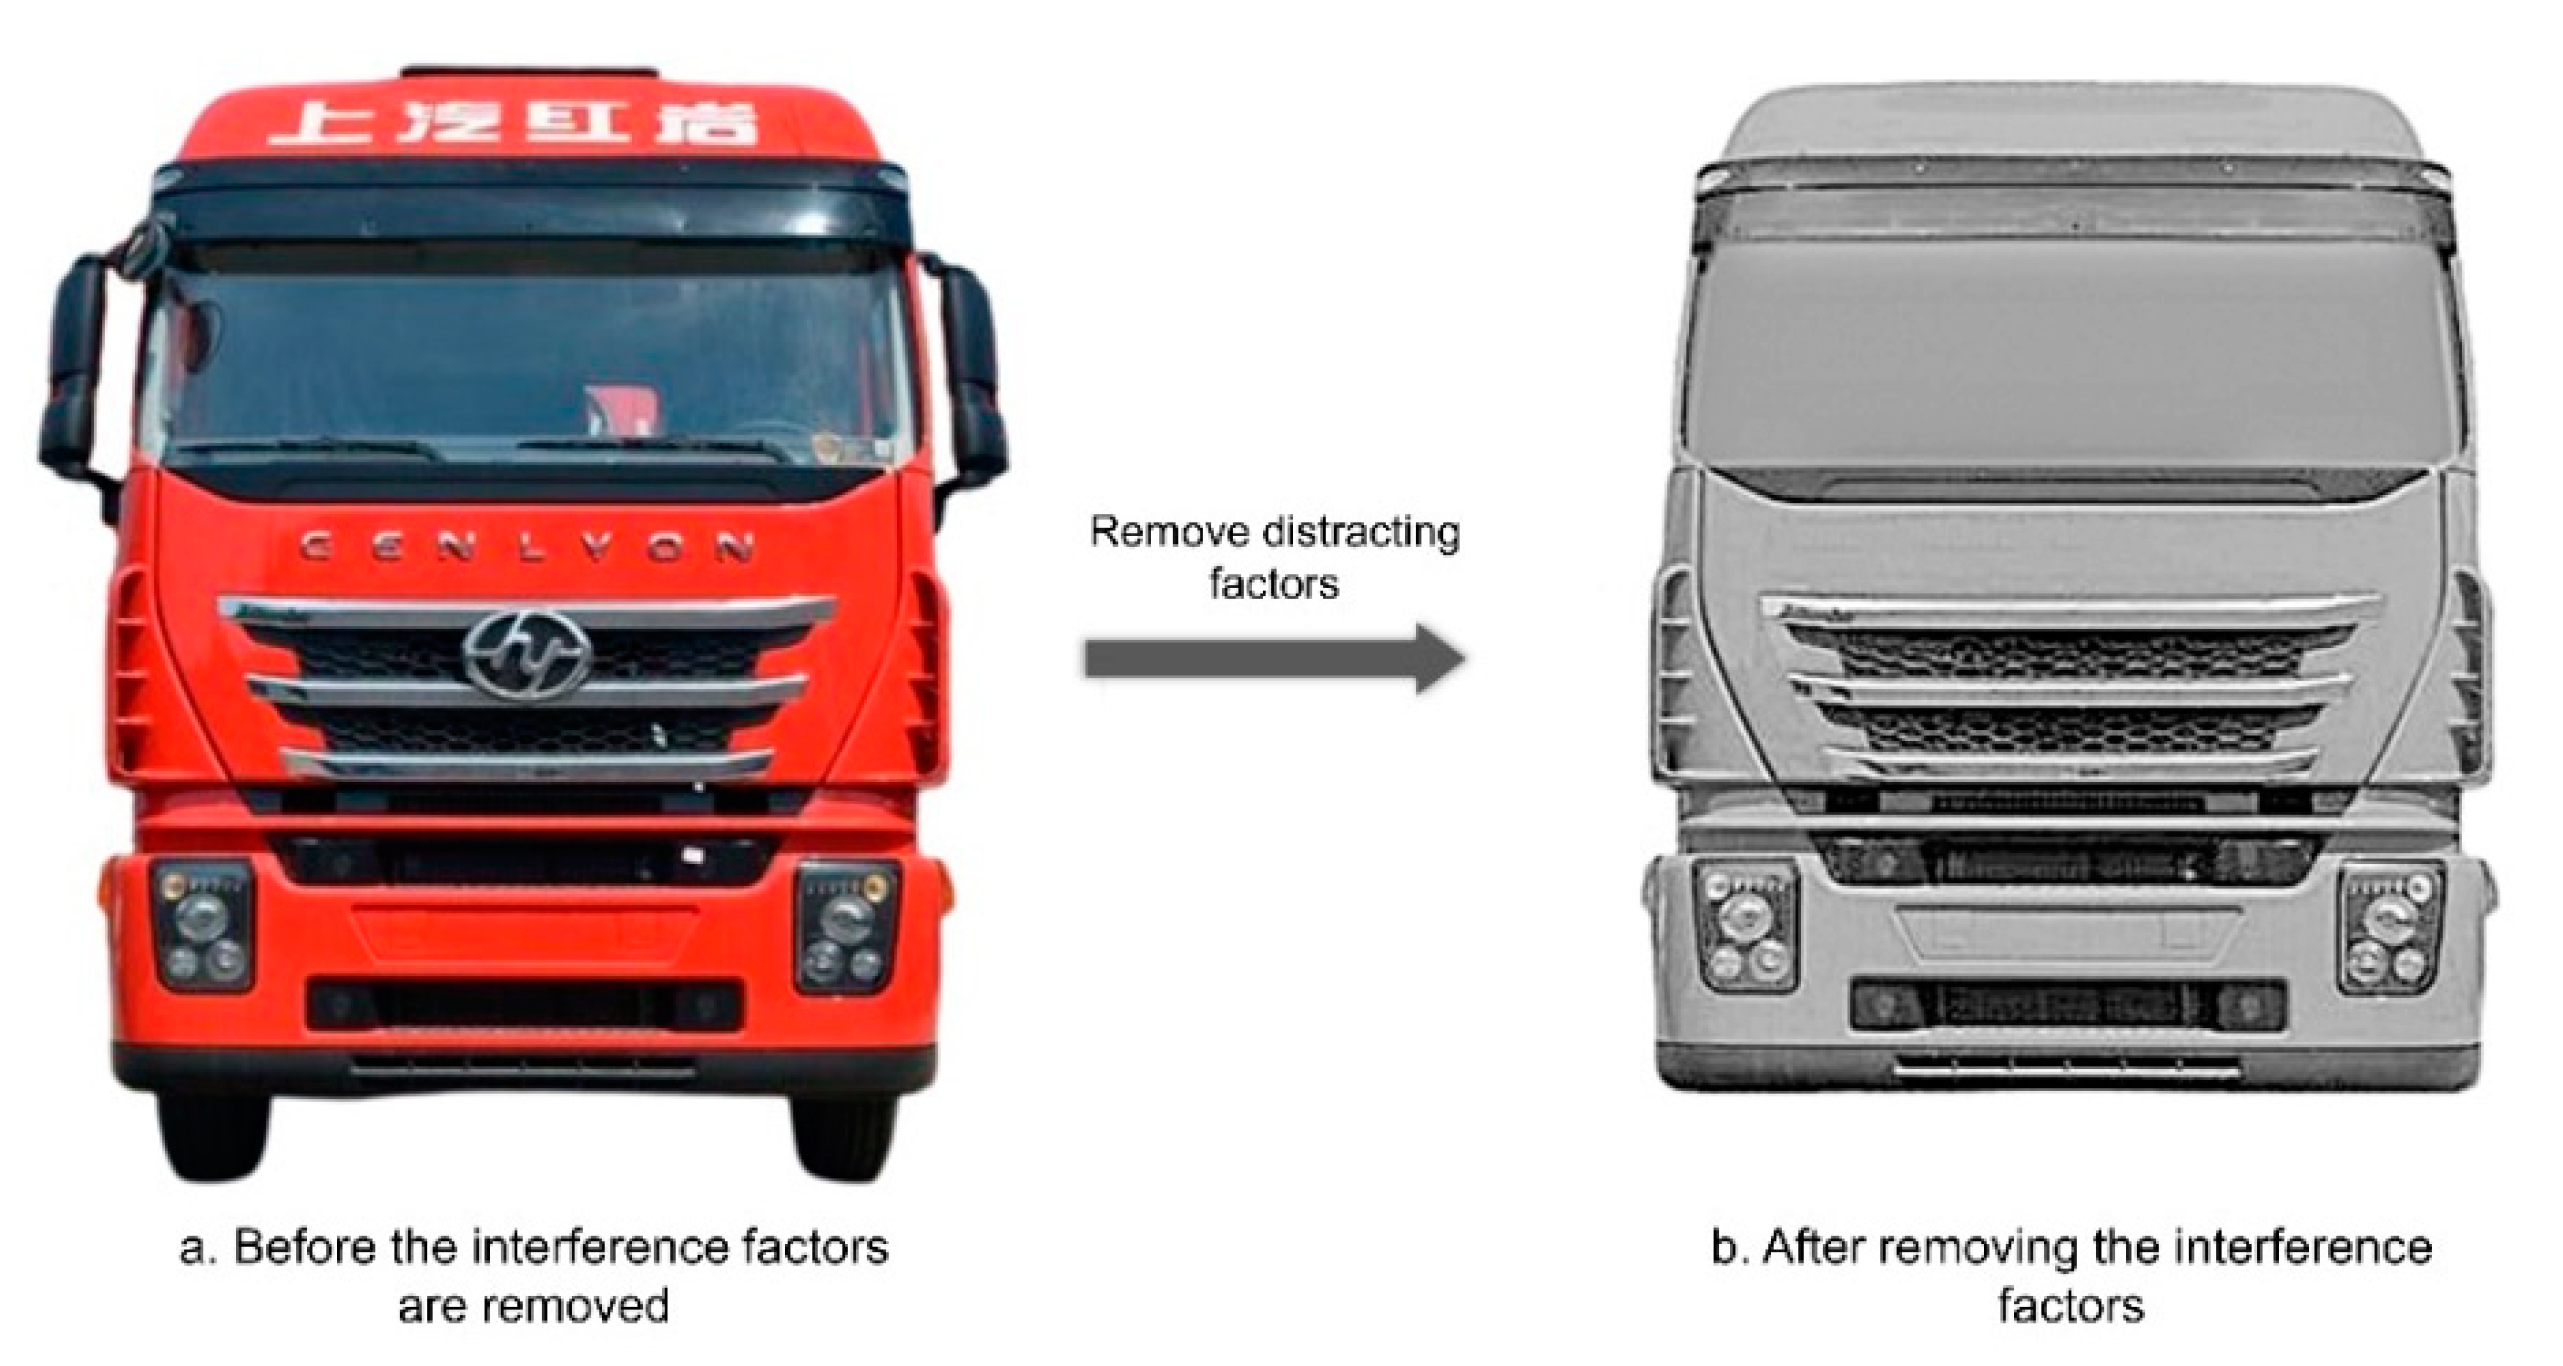
- (4)
- Remove the confounding factors on the front-facing subject of the truck that affect the Kansei cognitive measures.
3.1.4. Establishment of Representative Samples of Truck Front Face
- (1)
- Preliminary clustering based on sample appearance similarity using focus groups.
- (2)
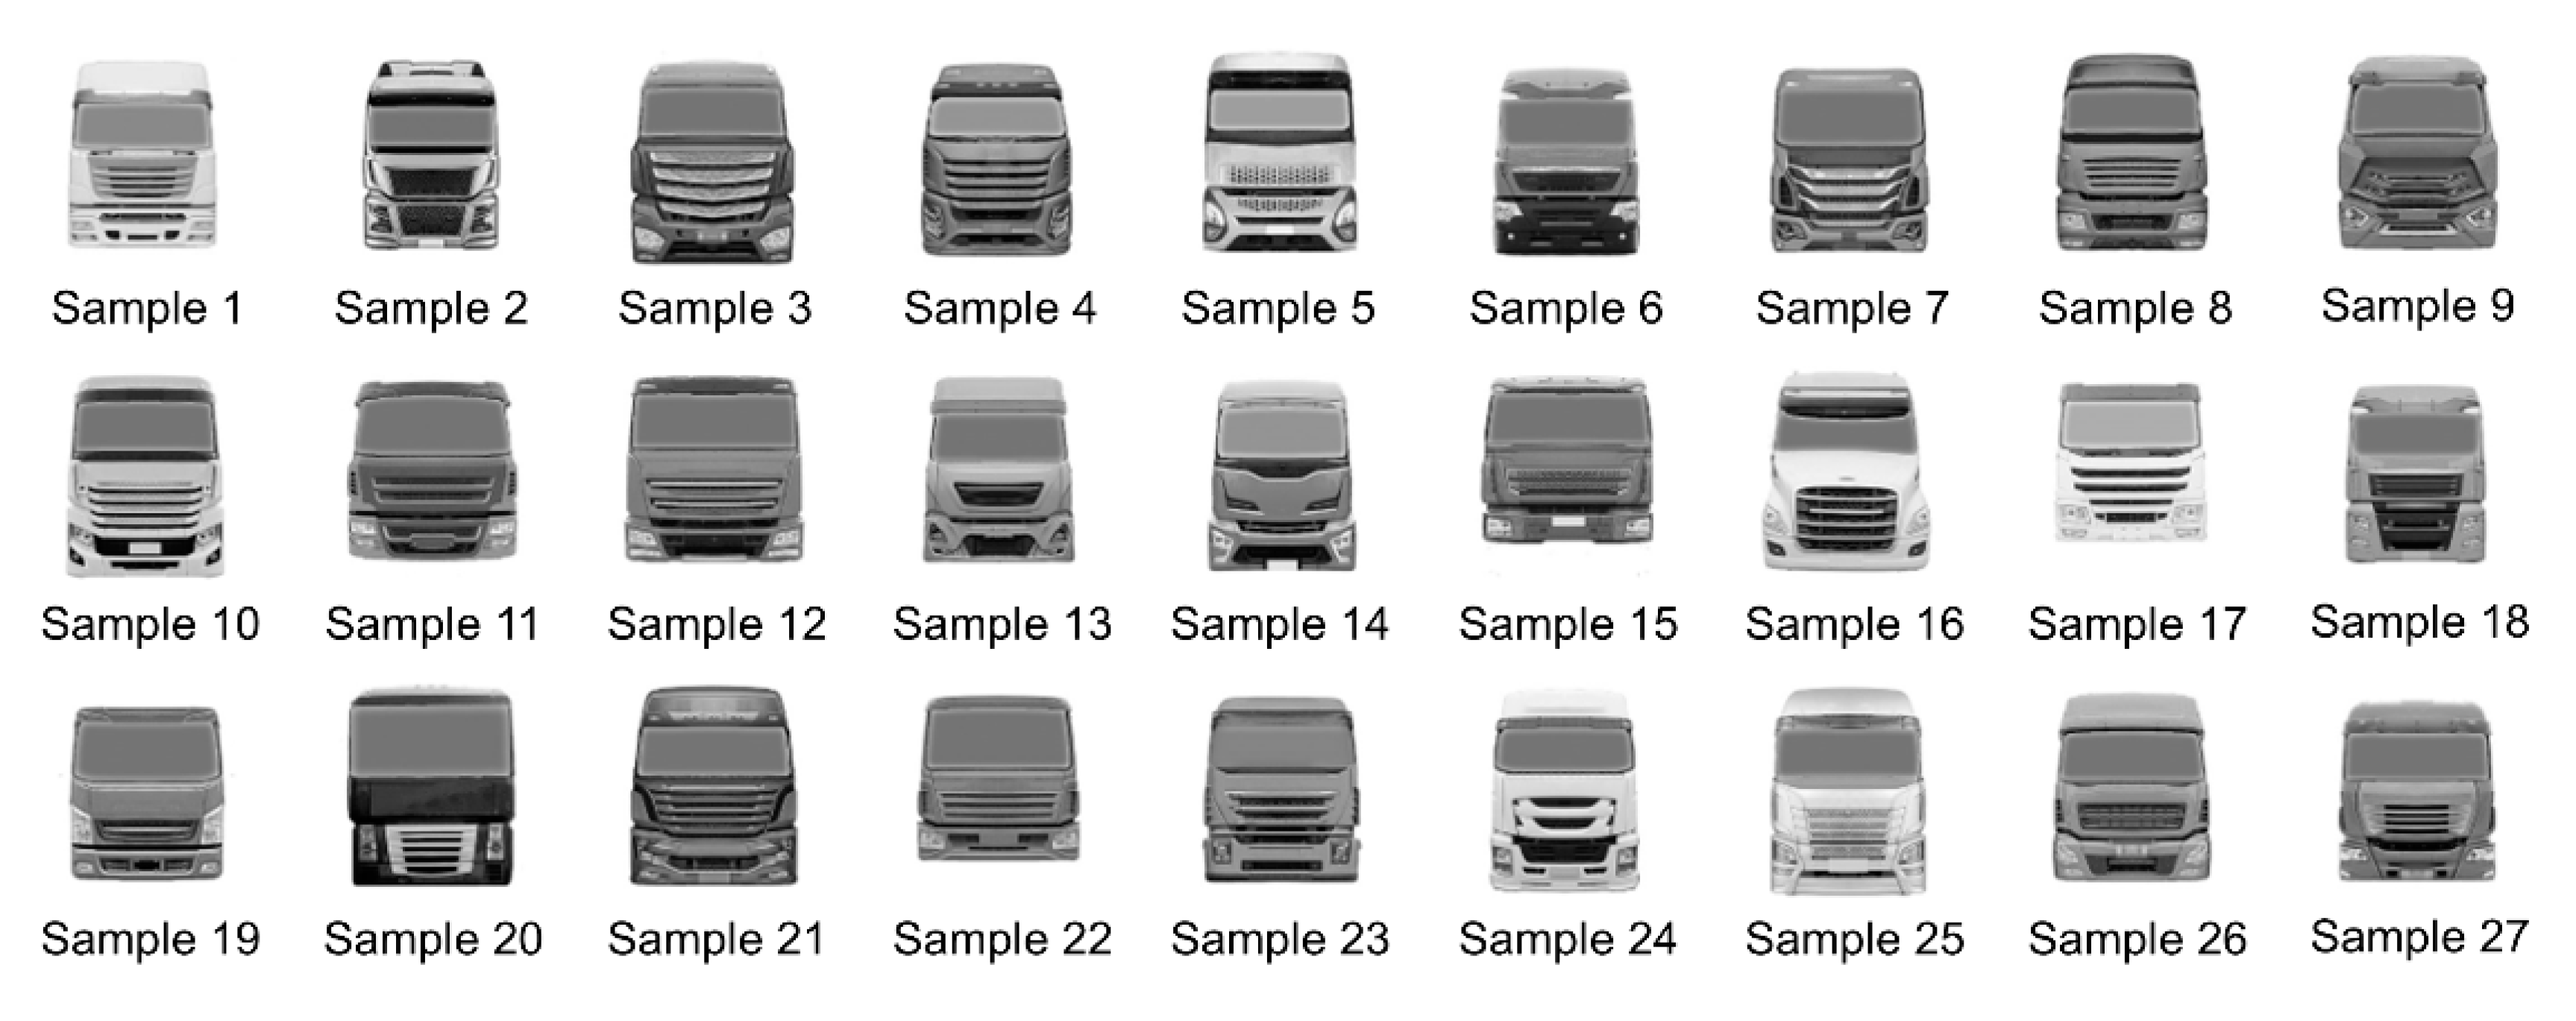
- Style similarity measurement among representative samples.
- First, 5 graduate students majoring in design are invited to pre-classify 27 representative samples, and the classifiers are required to classify the representative samples according to the similarity of emotional image style between the samples, without specifying the classification criteria or the number of classifications in advance. The results show that when the number of categories is 12–15, categories with obvious differences can be obtained.
- Invite 22 testers for formal classification. The 22 testers include 12 graduate students majoring in design, 4 graduate students majoring in mechanics, and 6 graduate students majoring in vehicles. Let each subject divide the 27 samples with similar emotional image styles into a group according to their subjective feelings, and the number of classifications is 12–15 categories. After the experiment, a total of 22 pieces of emotional image style similarity classification data were obtained.
- For the convenience of statistical analysis, the 22 emotional imagery style similarity classification data were summarized and made into a sample style similarity matrix. In the process of making, start from the sample with the smallest number in each category, compare the samples with higher numbers one by one, and mark them on the pre-prepared form. The labeling method is cumulative scoring until all samples from all classes are recorded. Then, count the number of times every two representative samples is classified into the same group and fill it into the similarity matrix. The representative sample imagery style similarity matrix (partial) is shown in Table 1.
- (3)
- Use IBM SPSS Statistics 25 software (https://www.ibm.com/support/pages/downloading-ibm-spss-statistics-25, accessed on 21 October 2020) to analyze the data of the sample image style similarity matrix.
- Analyze the data of the sample image style similarity matrix on a multi-dimensional scale and evaluate the analysis results through the pressure index “SK” and the coefficient of determination “RSQ”. The analysis results show that the value of “Stress” in the 6-dimensional space is 0.02423 and the value of “RSQ” is 0.99558, indicating that the multi-dimensional scale analysis in the 6-dimensional space is a very good fit and the spatial coordinate data can be fully utilized. The partial coordinates of the representative samples in the six-dimensional space are shown in Table 2.
- 2
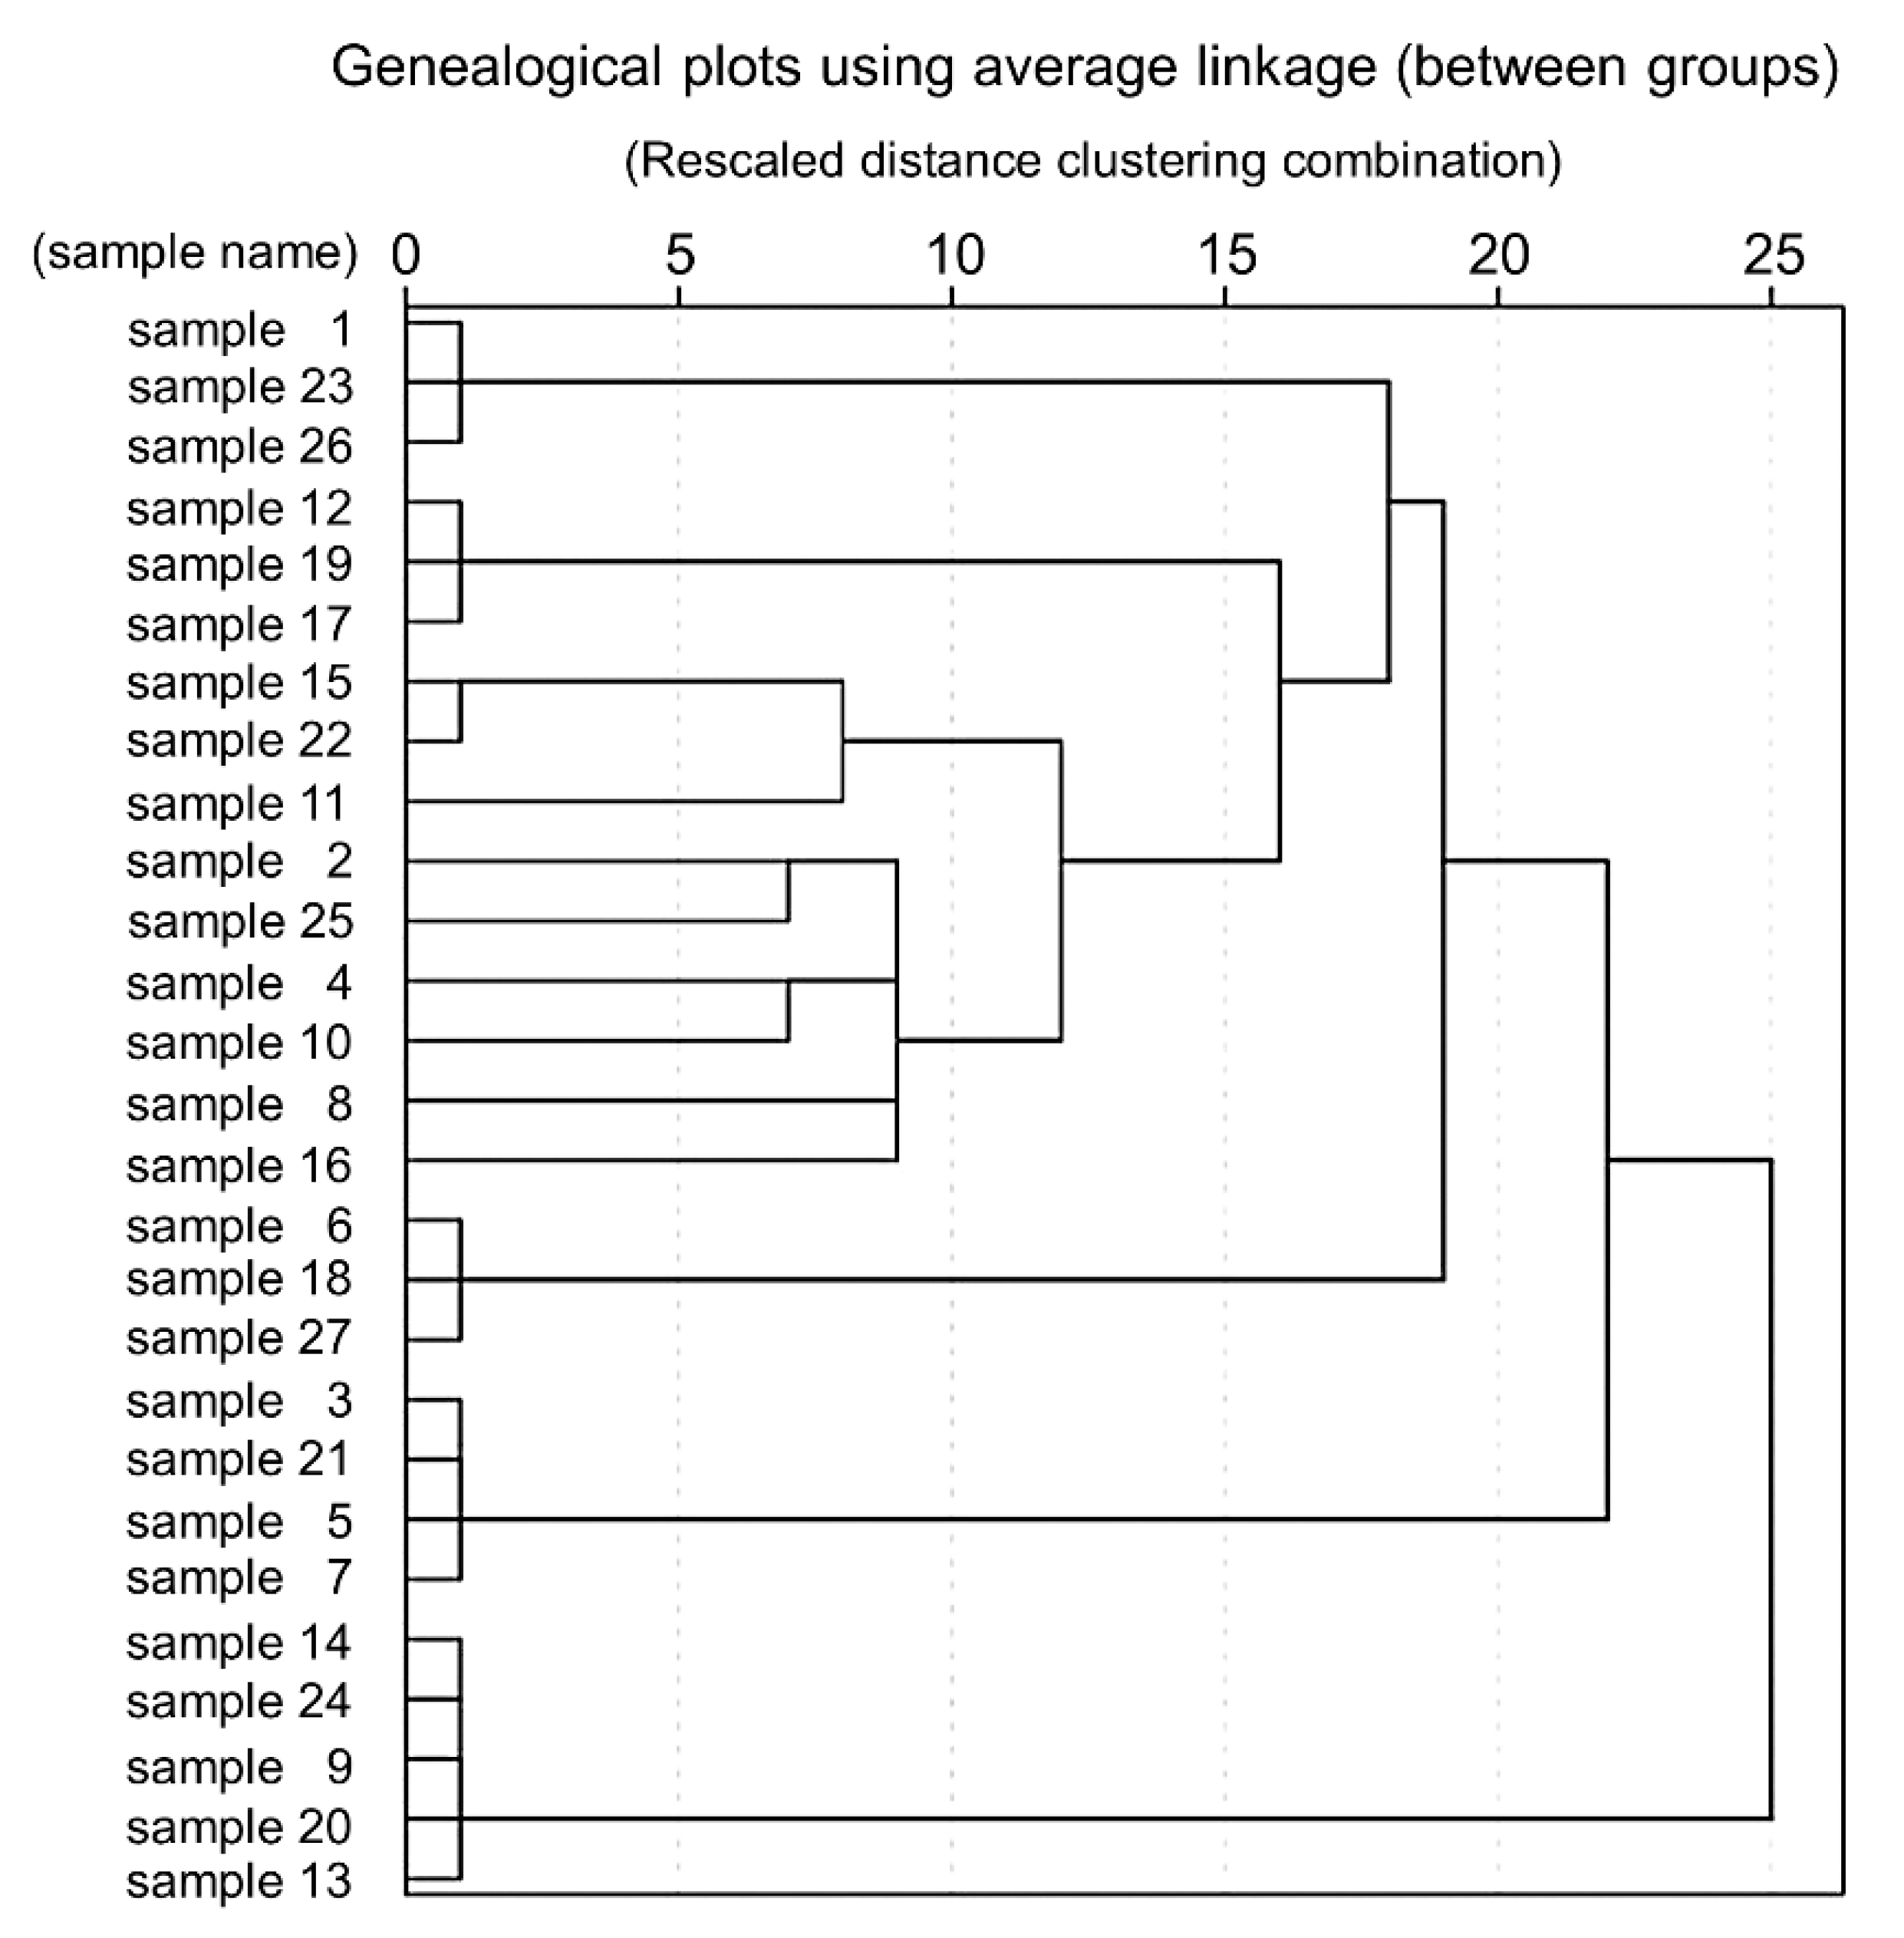
- To further group the samples with high similarity in emotional imagery styles into one class and those with low similarity into different classes, this study continued to analyze the 6-dimensional coordinates of the representative samples using systematic analysis. The partial clustering coefficient table of the representative samples (Table 3) and the cluster analysis spectrum chart of the representative samples (Figure 7) were obtained through systematic clustering.
- 3
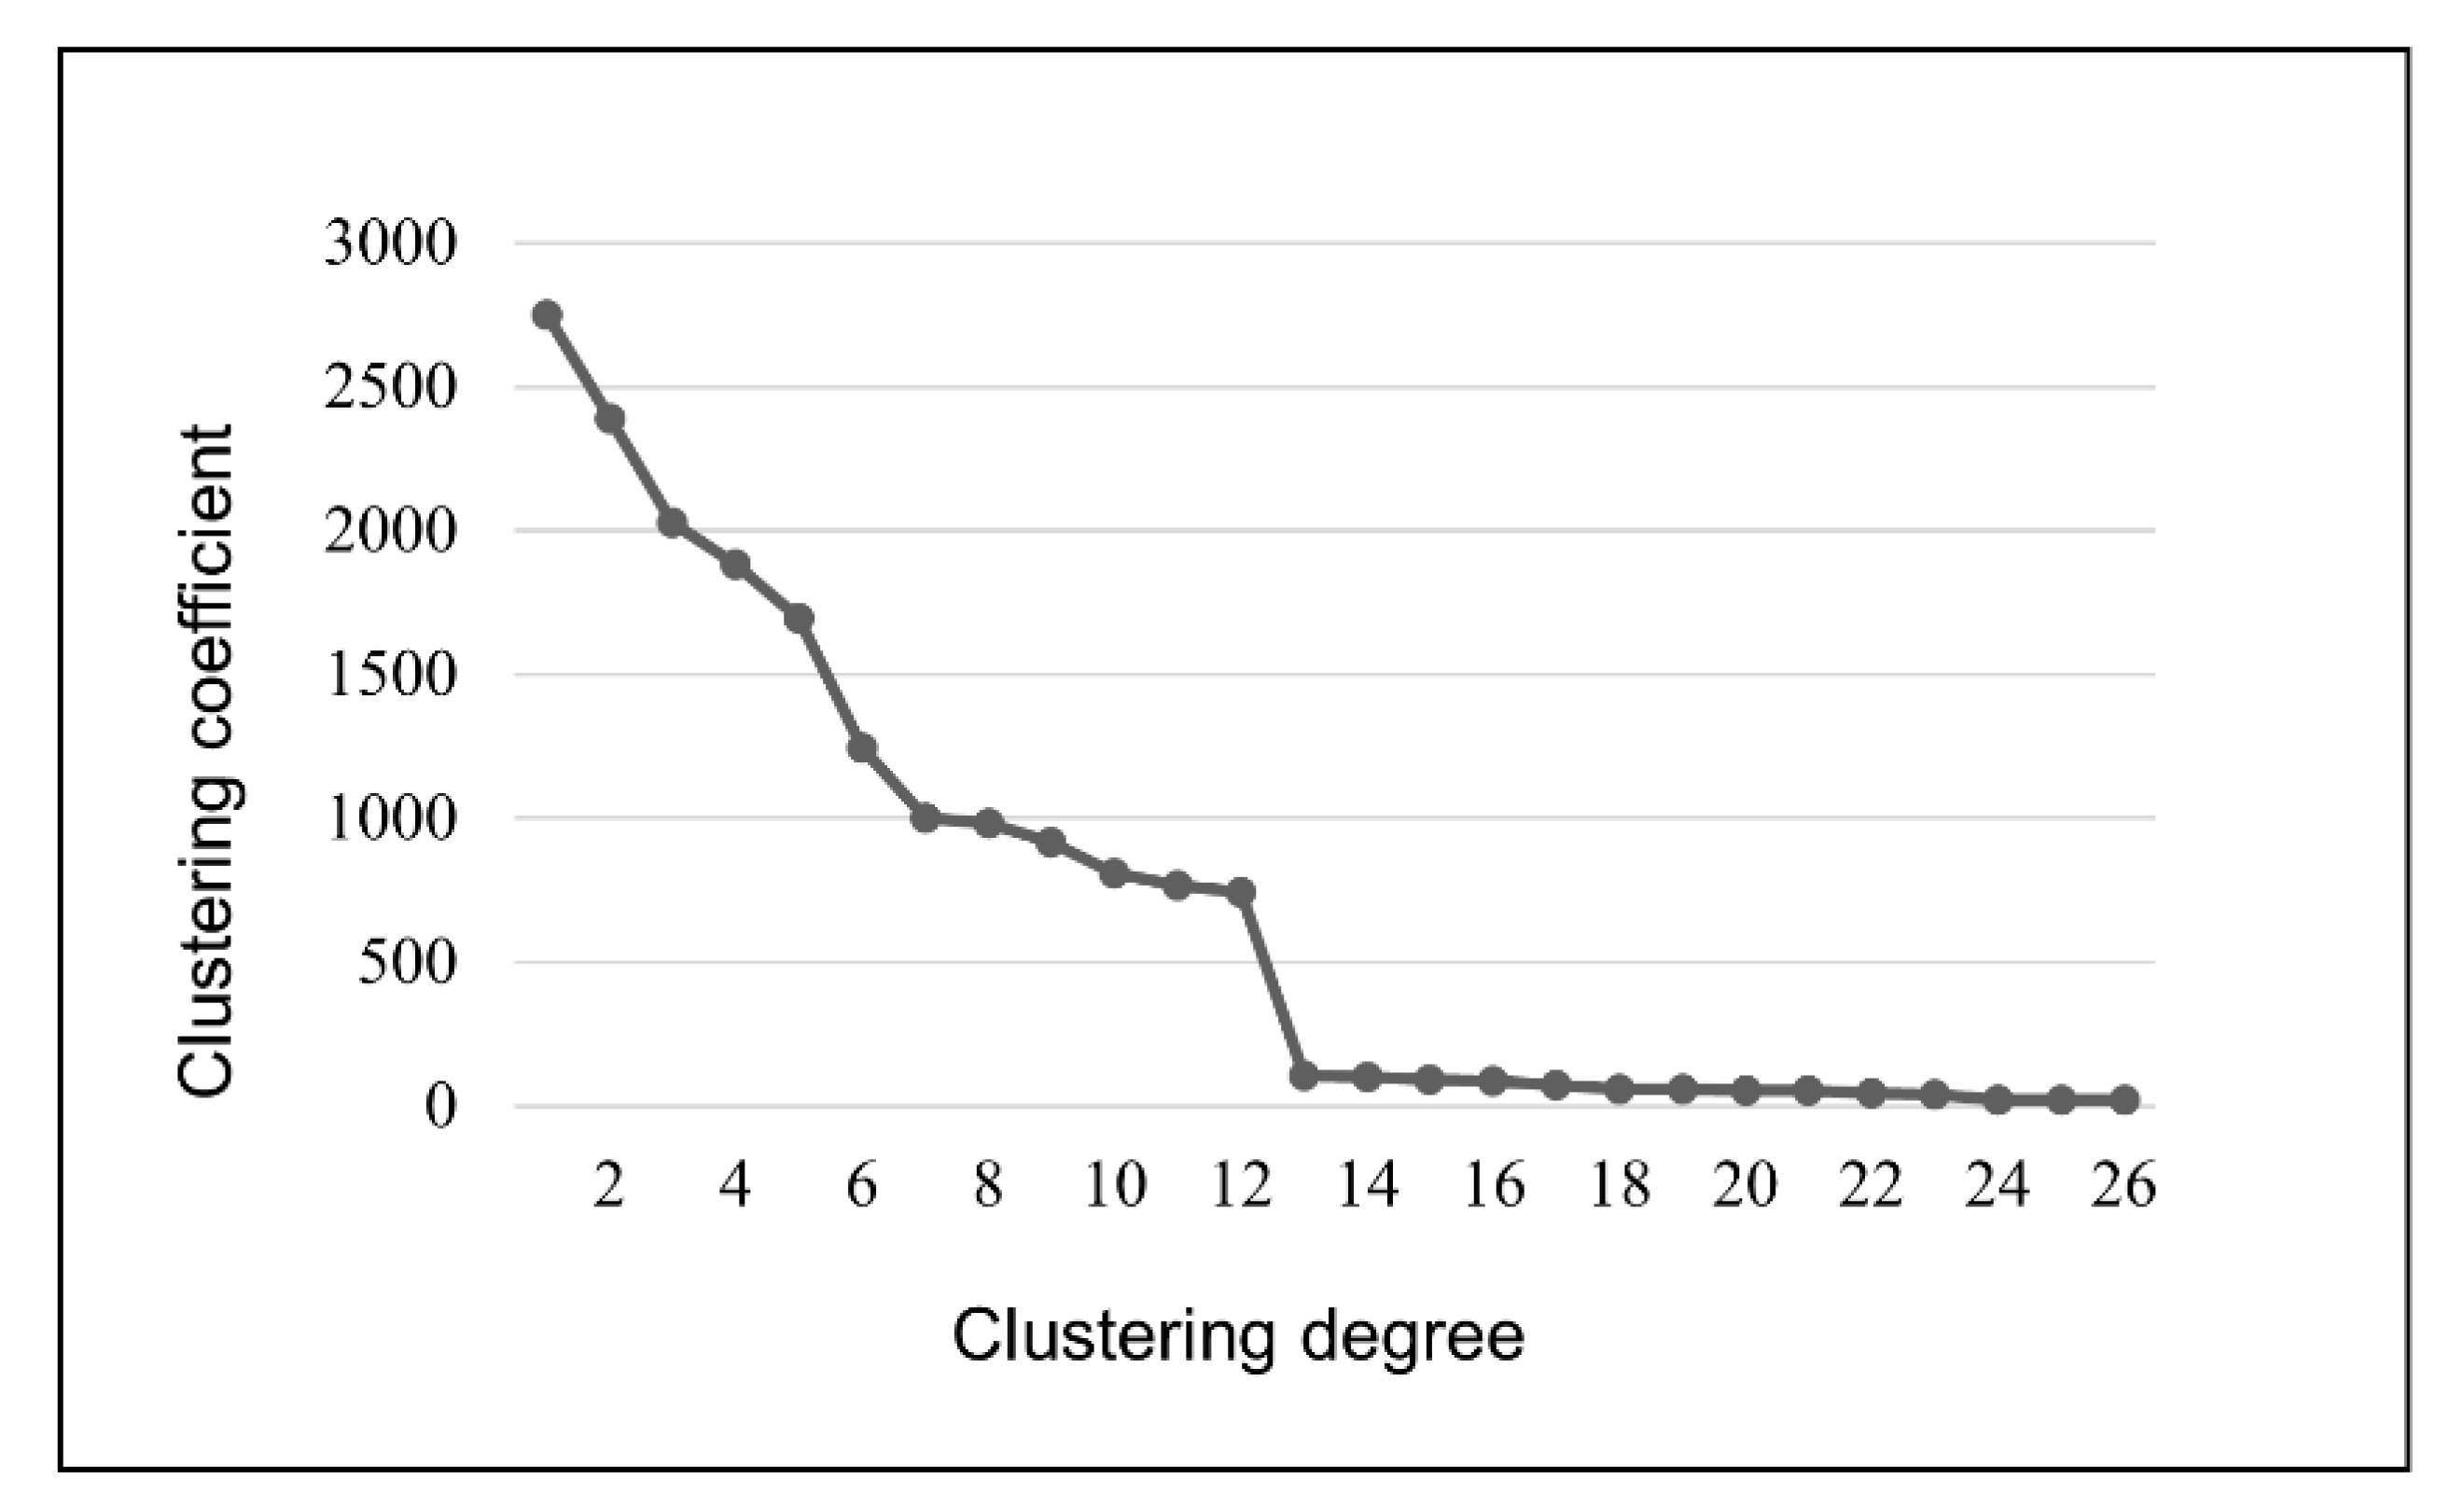
- According to Table 3 and Figure 7, the clustering process of the 27 representative samples can be clearly seen. To better understand the classification of the 27 representative samples, the clustering coefficients in Table 4 were imported into Excel for curve fitting to find the turning point of the change in the clustering coefficients, as shown in Figure 8.
- 4
- To find new representative samples in each of the 13 categories just classified, this study performed K-means clustering on the six-dimensional coordinate data to obtain the categories to which each representative sample belongs and the distance between the centers of the categories to which it belongs, as shown in Table 4.
3.2. Construction of the Semantic Space of Emotional Imagery
3.2.1. Collection of Imagery Vocabulary
3.2.2. Preliminary Screening of Emotional Imagery Vocabulary
3.2.3. Establish Imagery Semantic Space
3.3. Construct the Mapping Relationship between Representative Imagery Words and Representative Samples
3.4. Imagery Product Generative Adversarial Network
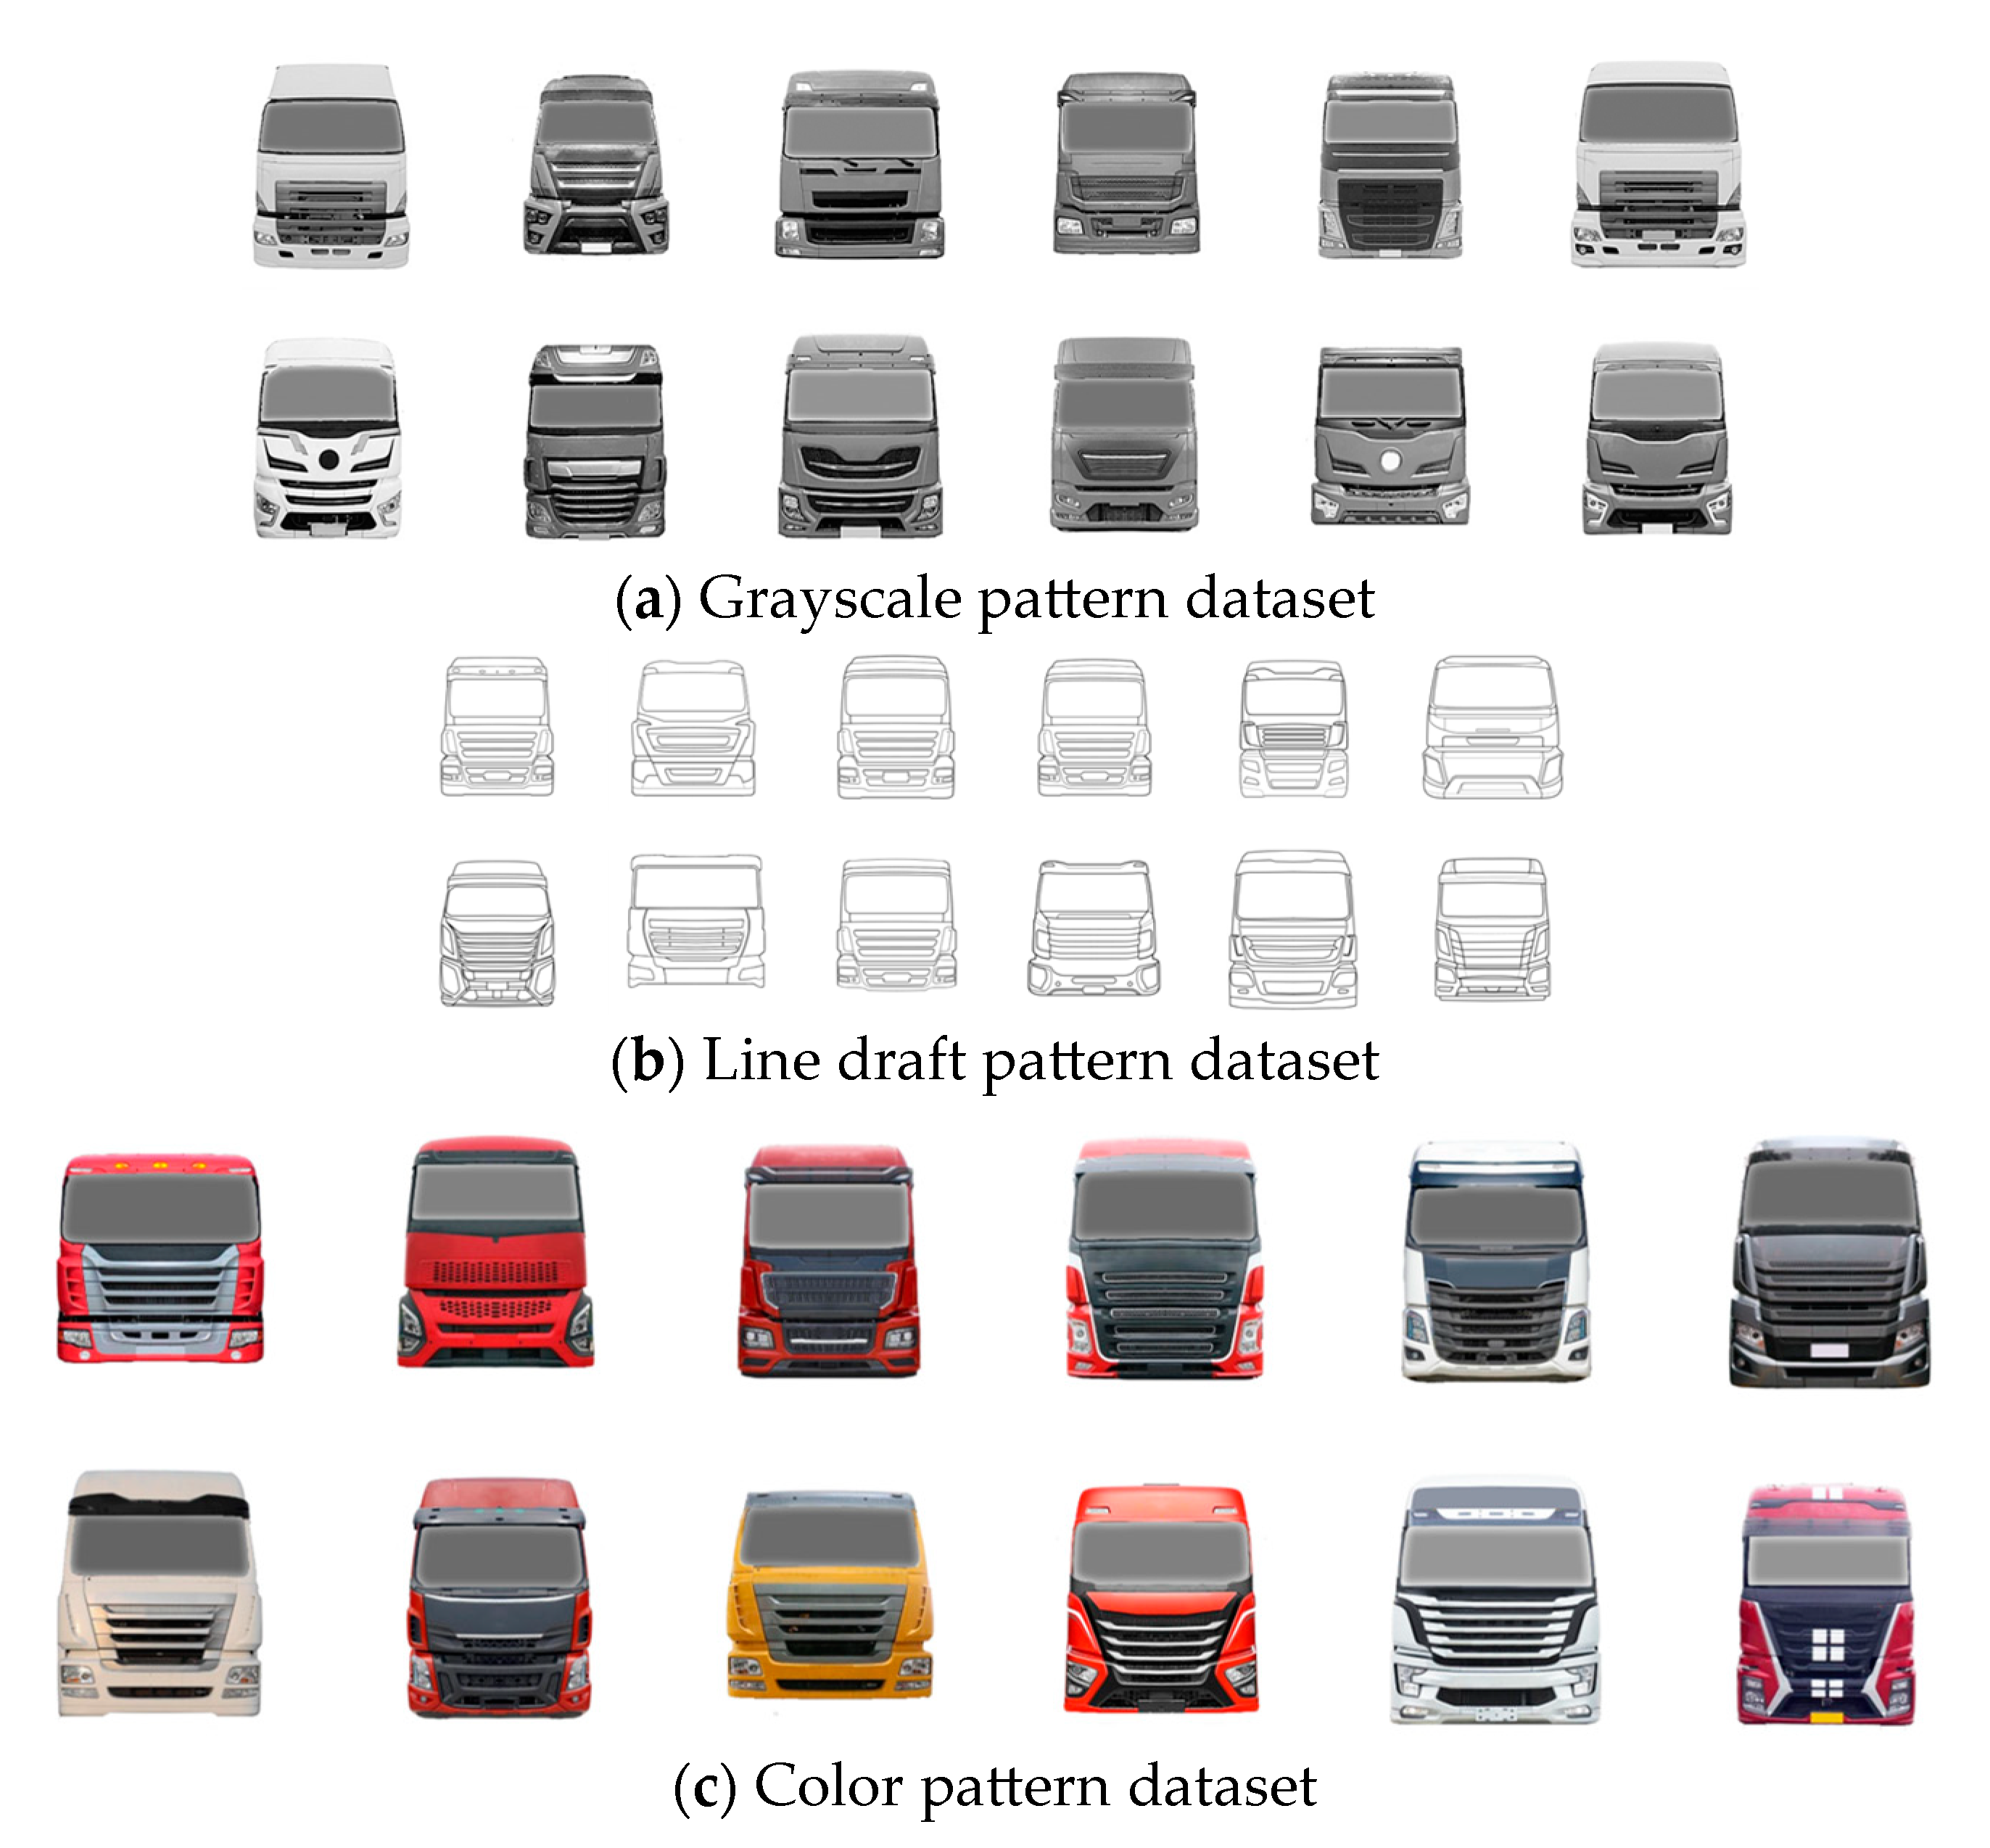
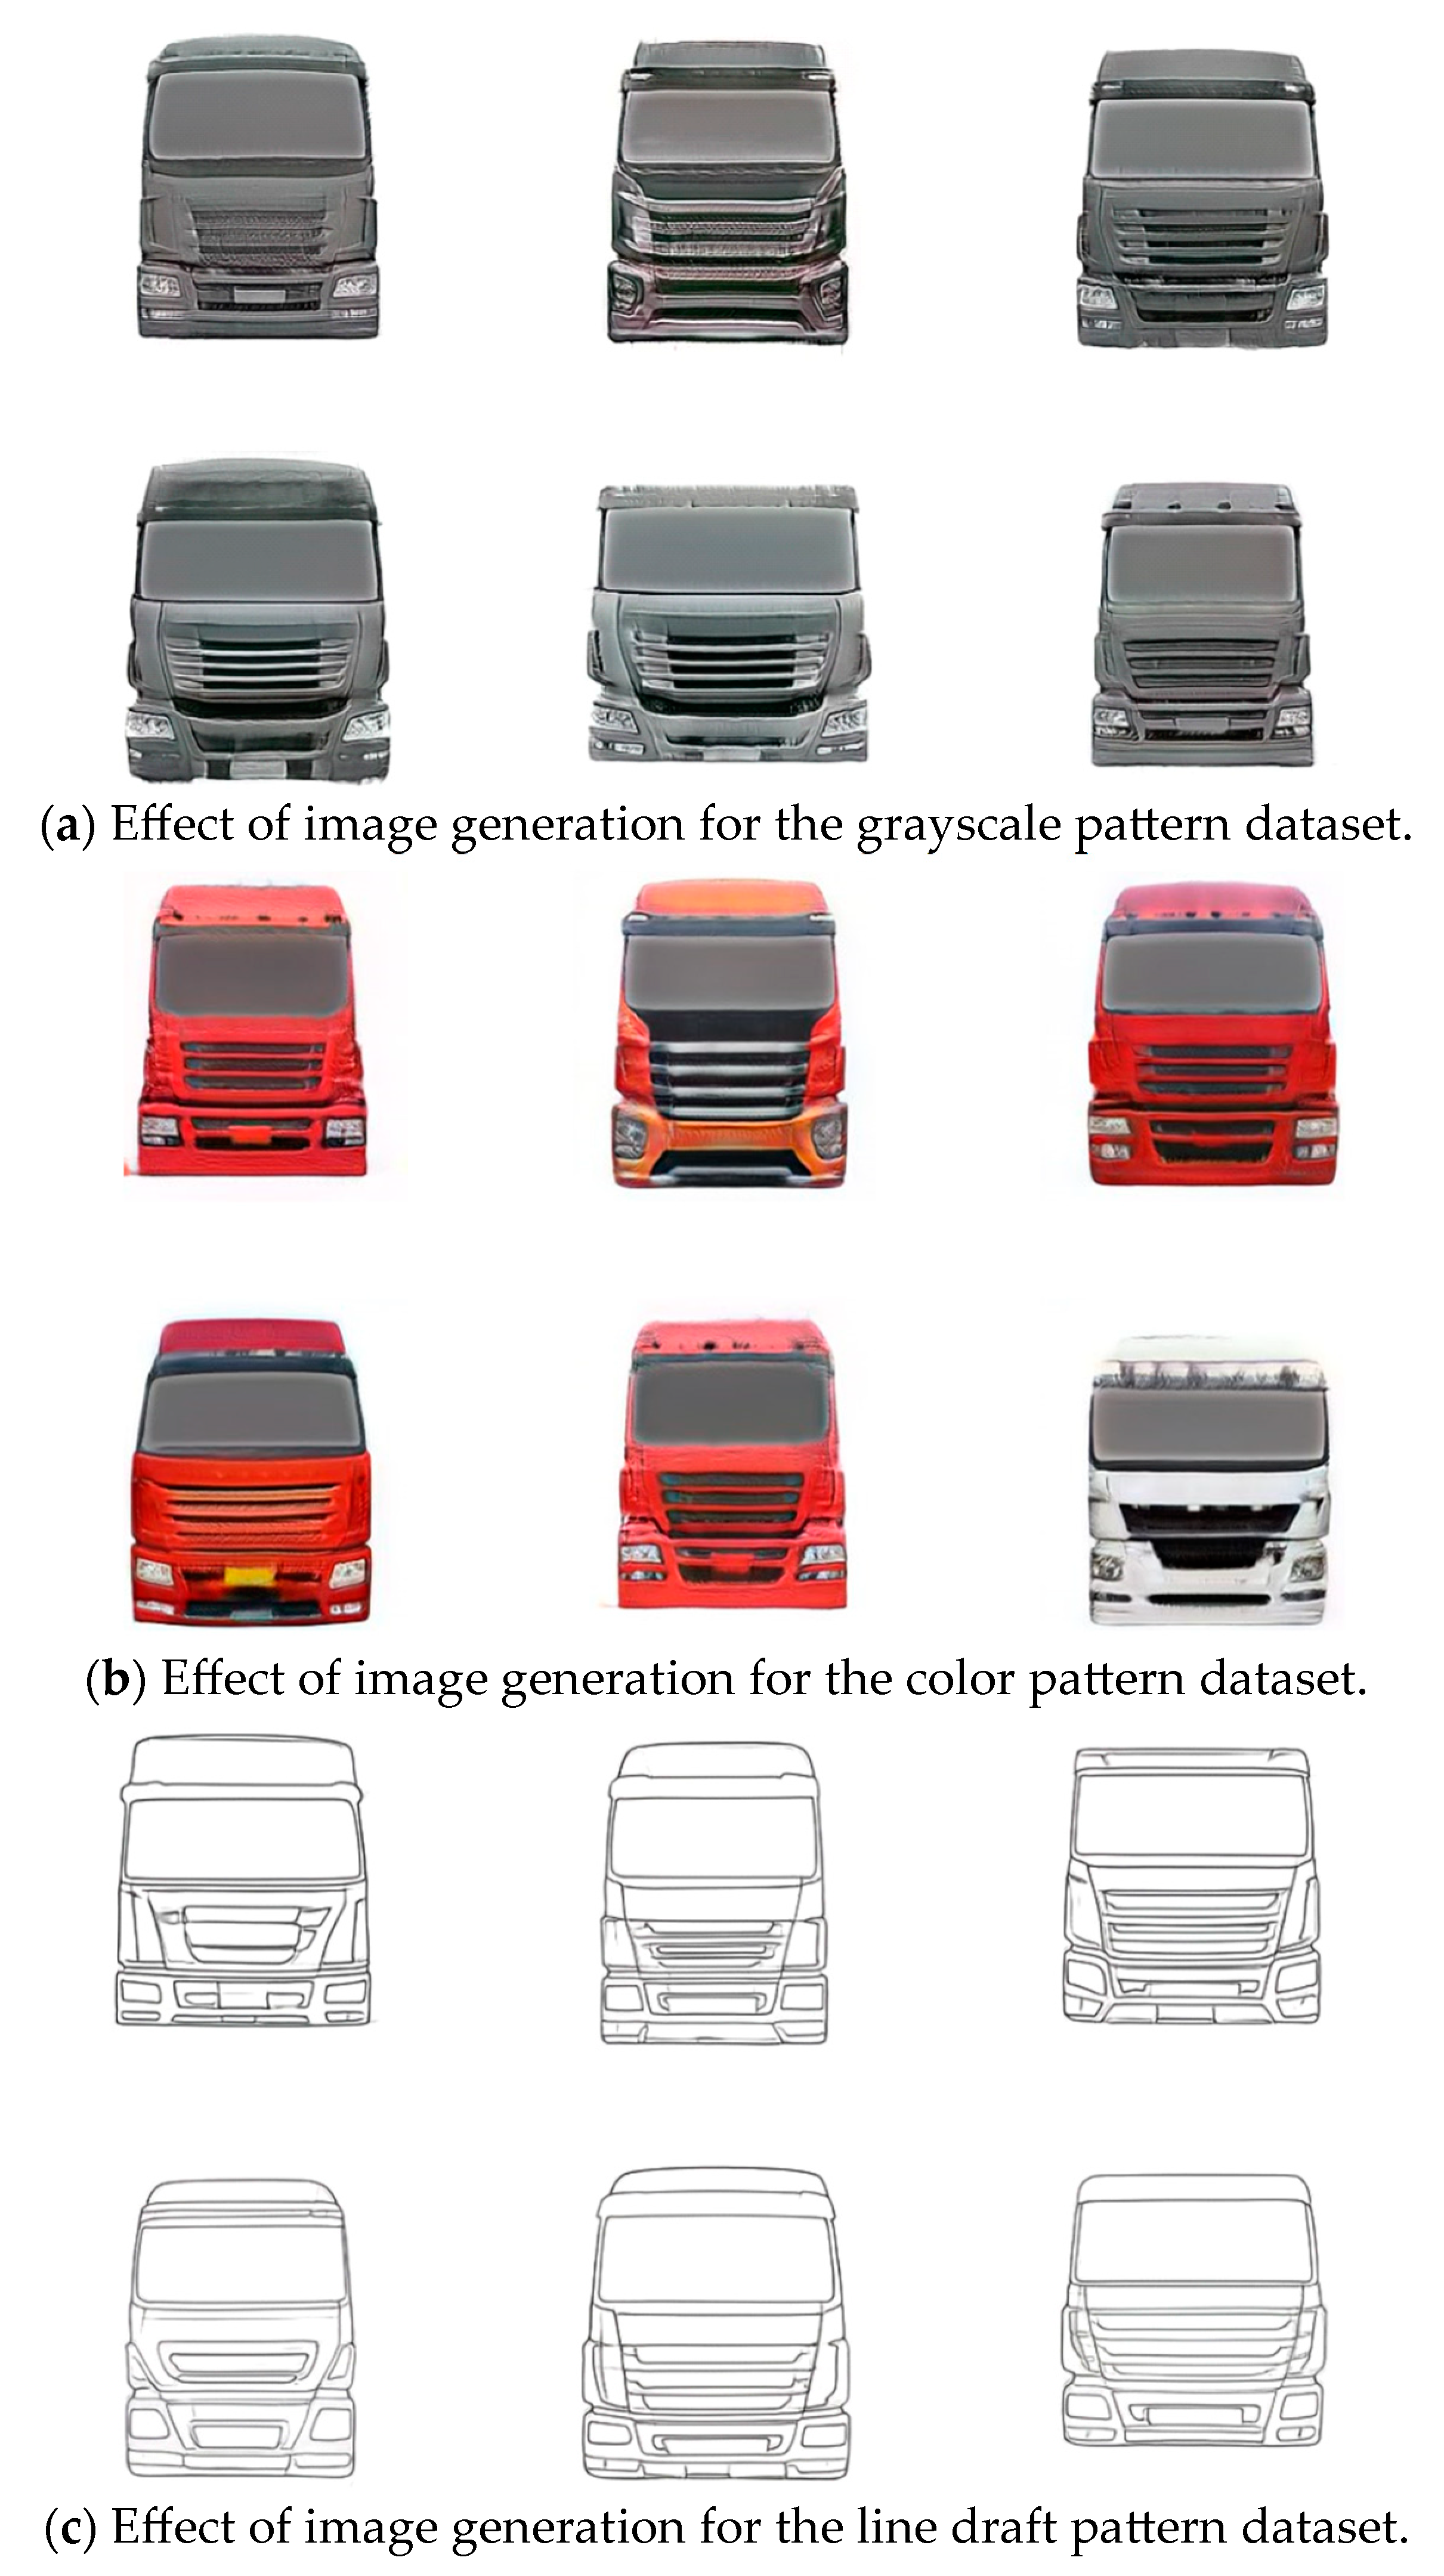
3.4.1. Truck Front Face Dataset Production and Data Enhancement
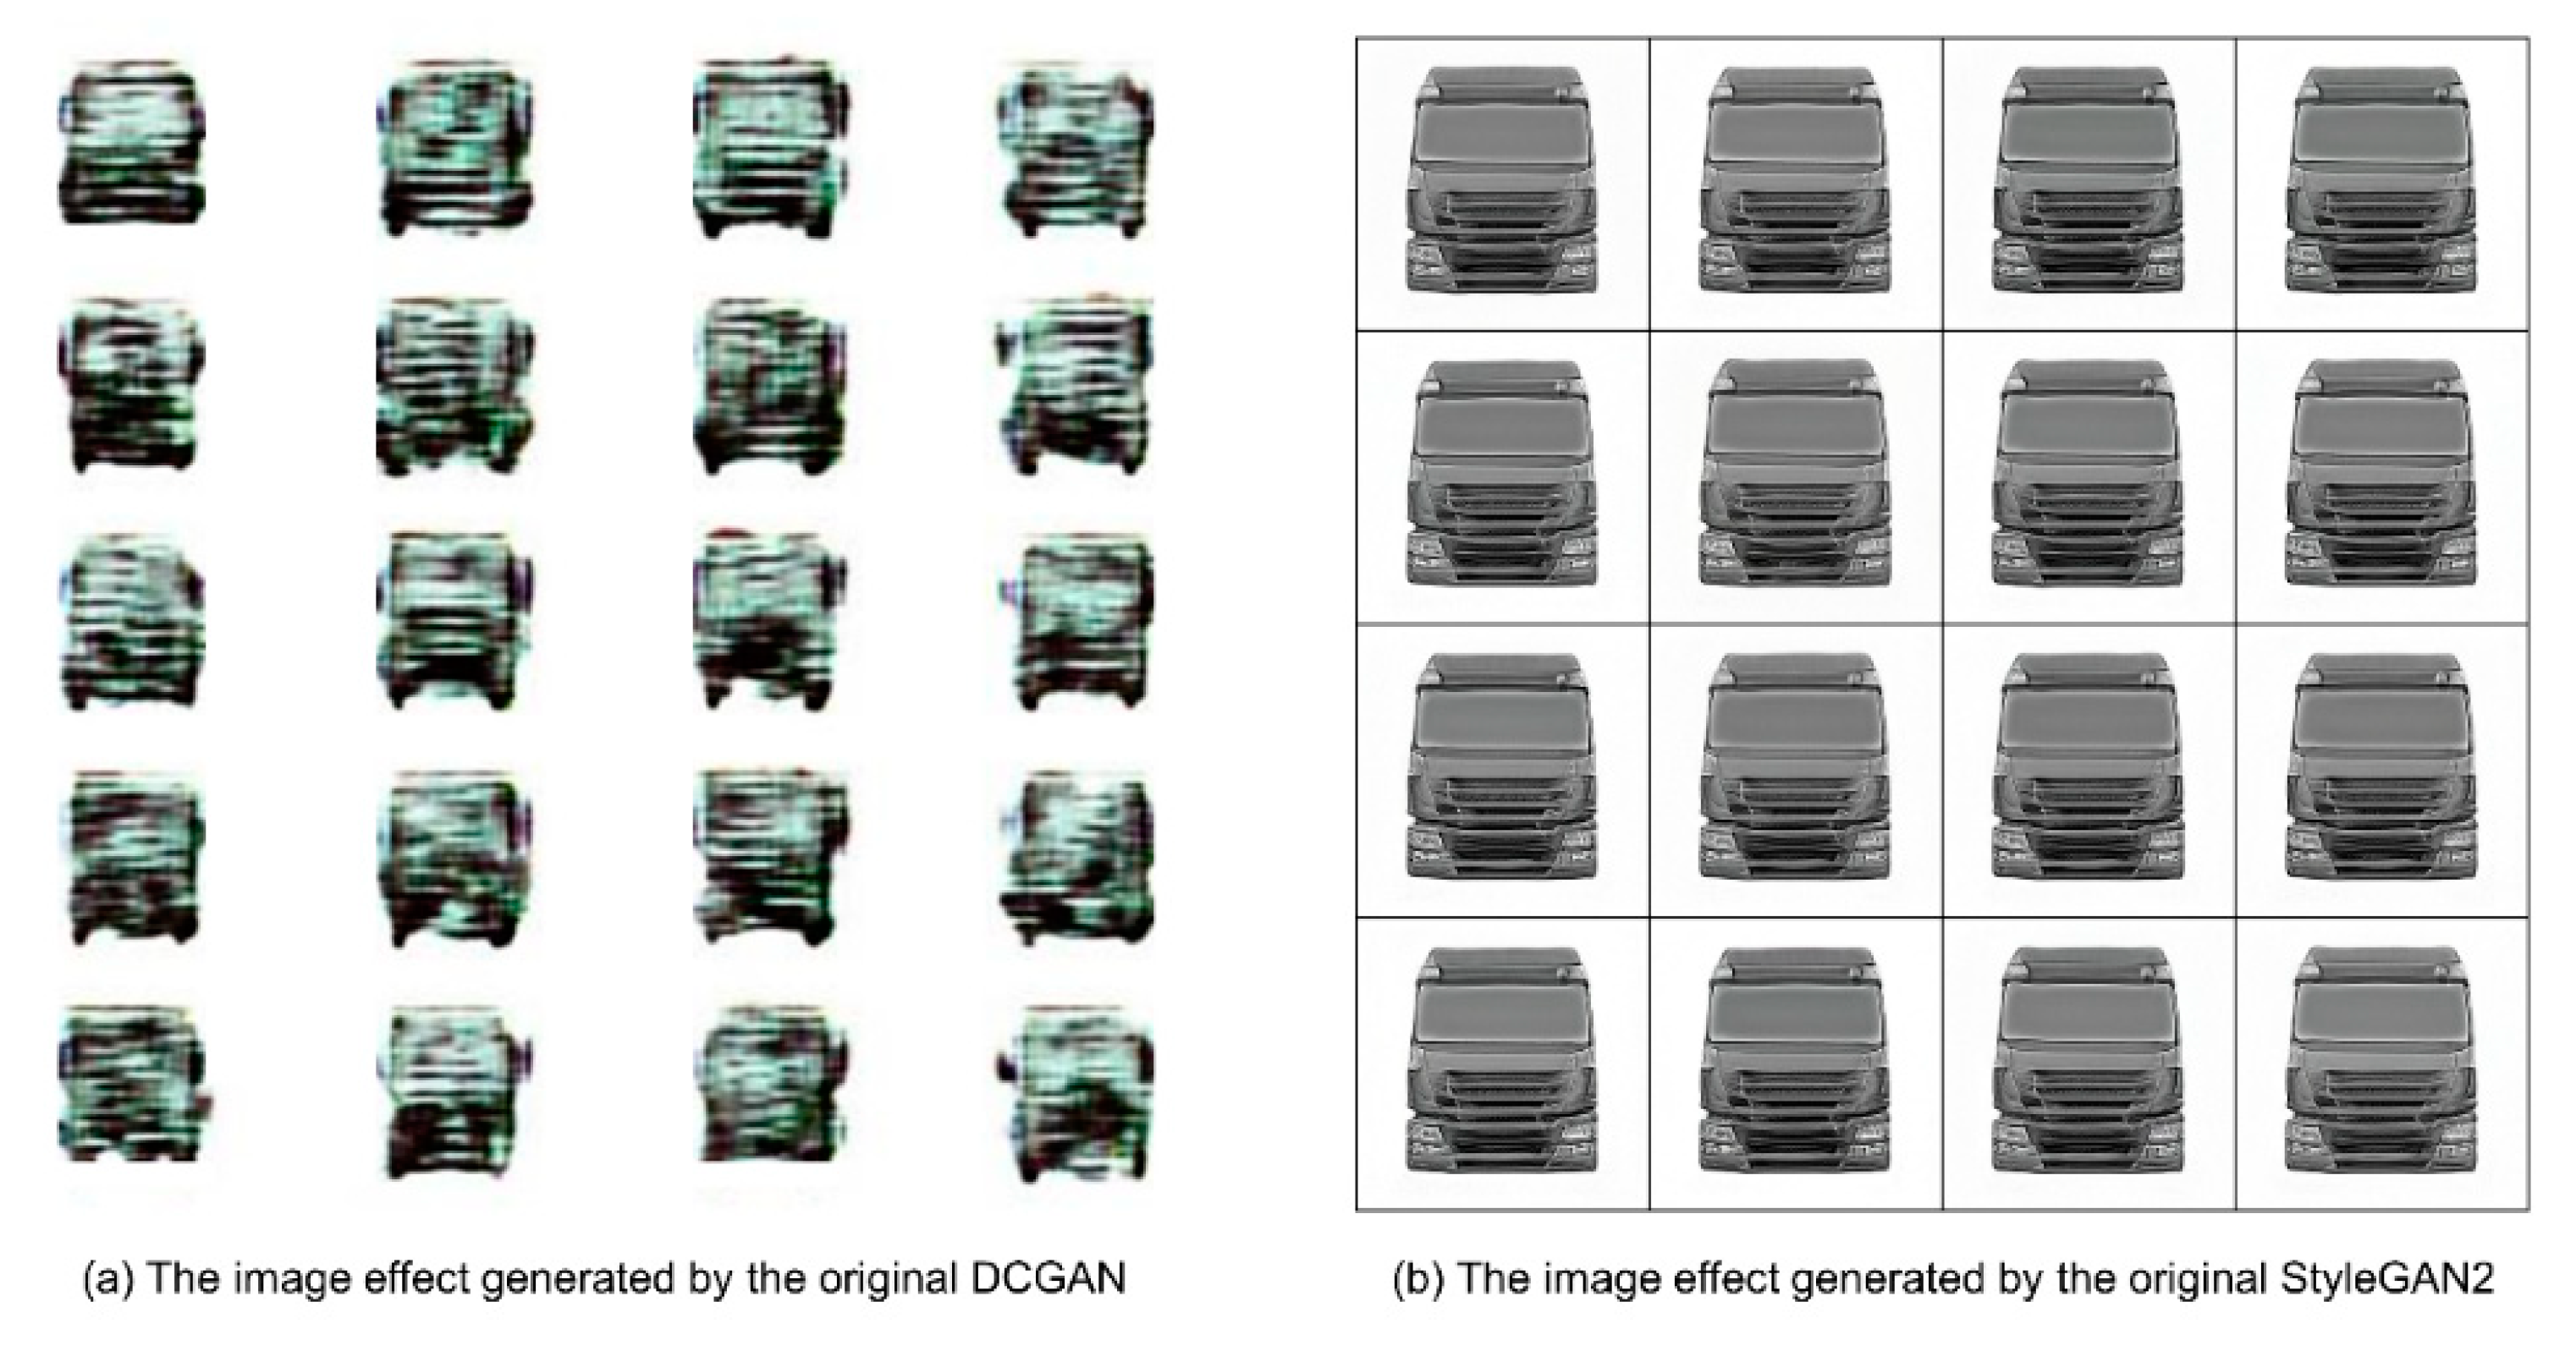
3.4.2. Comparison of the Generation Effect of Original DCGAN and StyleGAN2
3.4.3. Overview of the StyleGAN2 Principle and the Interpretation of Equations
- is the letter specified in the original GAN paper to represent the cross entropy;
- is a network that generates images and receives random noise ;
- is a binary discriminant network that distinguishes between true and false for a given image;
- is the degree of difference between the real sample and the generated image;
- is a parameter that represents sample images;
- is the distribution interval of real data for all samples;
- is a logarithm with a natural base e;
- is a real image, and the corresponding label is 1;
- represents the probability that is a real image;
- is the distribution interval of all noise-generated data;
- is random noise;
- is the image generated by a given noise , with a corresponding label of 0;
- is the probability that the network determines whether the image generated by is true.
- represents a total of samples;
- represents the number of iterations of training;
- is a logarithm with a natural base e;
- represents any real data;
- represents the result determined by the discriminator on real data ;
- represents any random data with the same structure as real data;
- represents false data generated in the generator based on ;
- represents the result determined by the discriminator on false data ;
- and are both probabilities of the sample being ‘true’.
3.4.4. Improving the Original StyleGAN2 Model
- (1)
- The image effect generated by the original StyleGAN2 training is blurred and distorted and the detail processing is not in place, which may be due to the small sample size of the dataset and the small total number of iterations during training. Therefore, this experiment introduces a generative model with 550,000 iterations of a large dataset of cars as the initialized model, which makes the StyleGAN2 network less demanding on the sample size of the dataset and becomes a small sample training model.
- (2)
- In order to solve the problem that the detail transition in the generated image is not natural enough, this experiment defines a function accumulate, which is used to realize the sliding average of the model parameters, and the decay rate of the specified sliding average coefficient is 0.999. This function uses the model1.named_parameters() and model2.named_parameters() methods to obtain all the parameters of the models, model1 and model2, and then calculates the parameters of the model1 approach the parameters of model2 to achieve a moving average. Later in the training process, the generated network can periodically call the accumulate() function to update the parameters in model2, which can better control the generalization ability of the model.
- (3)
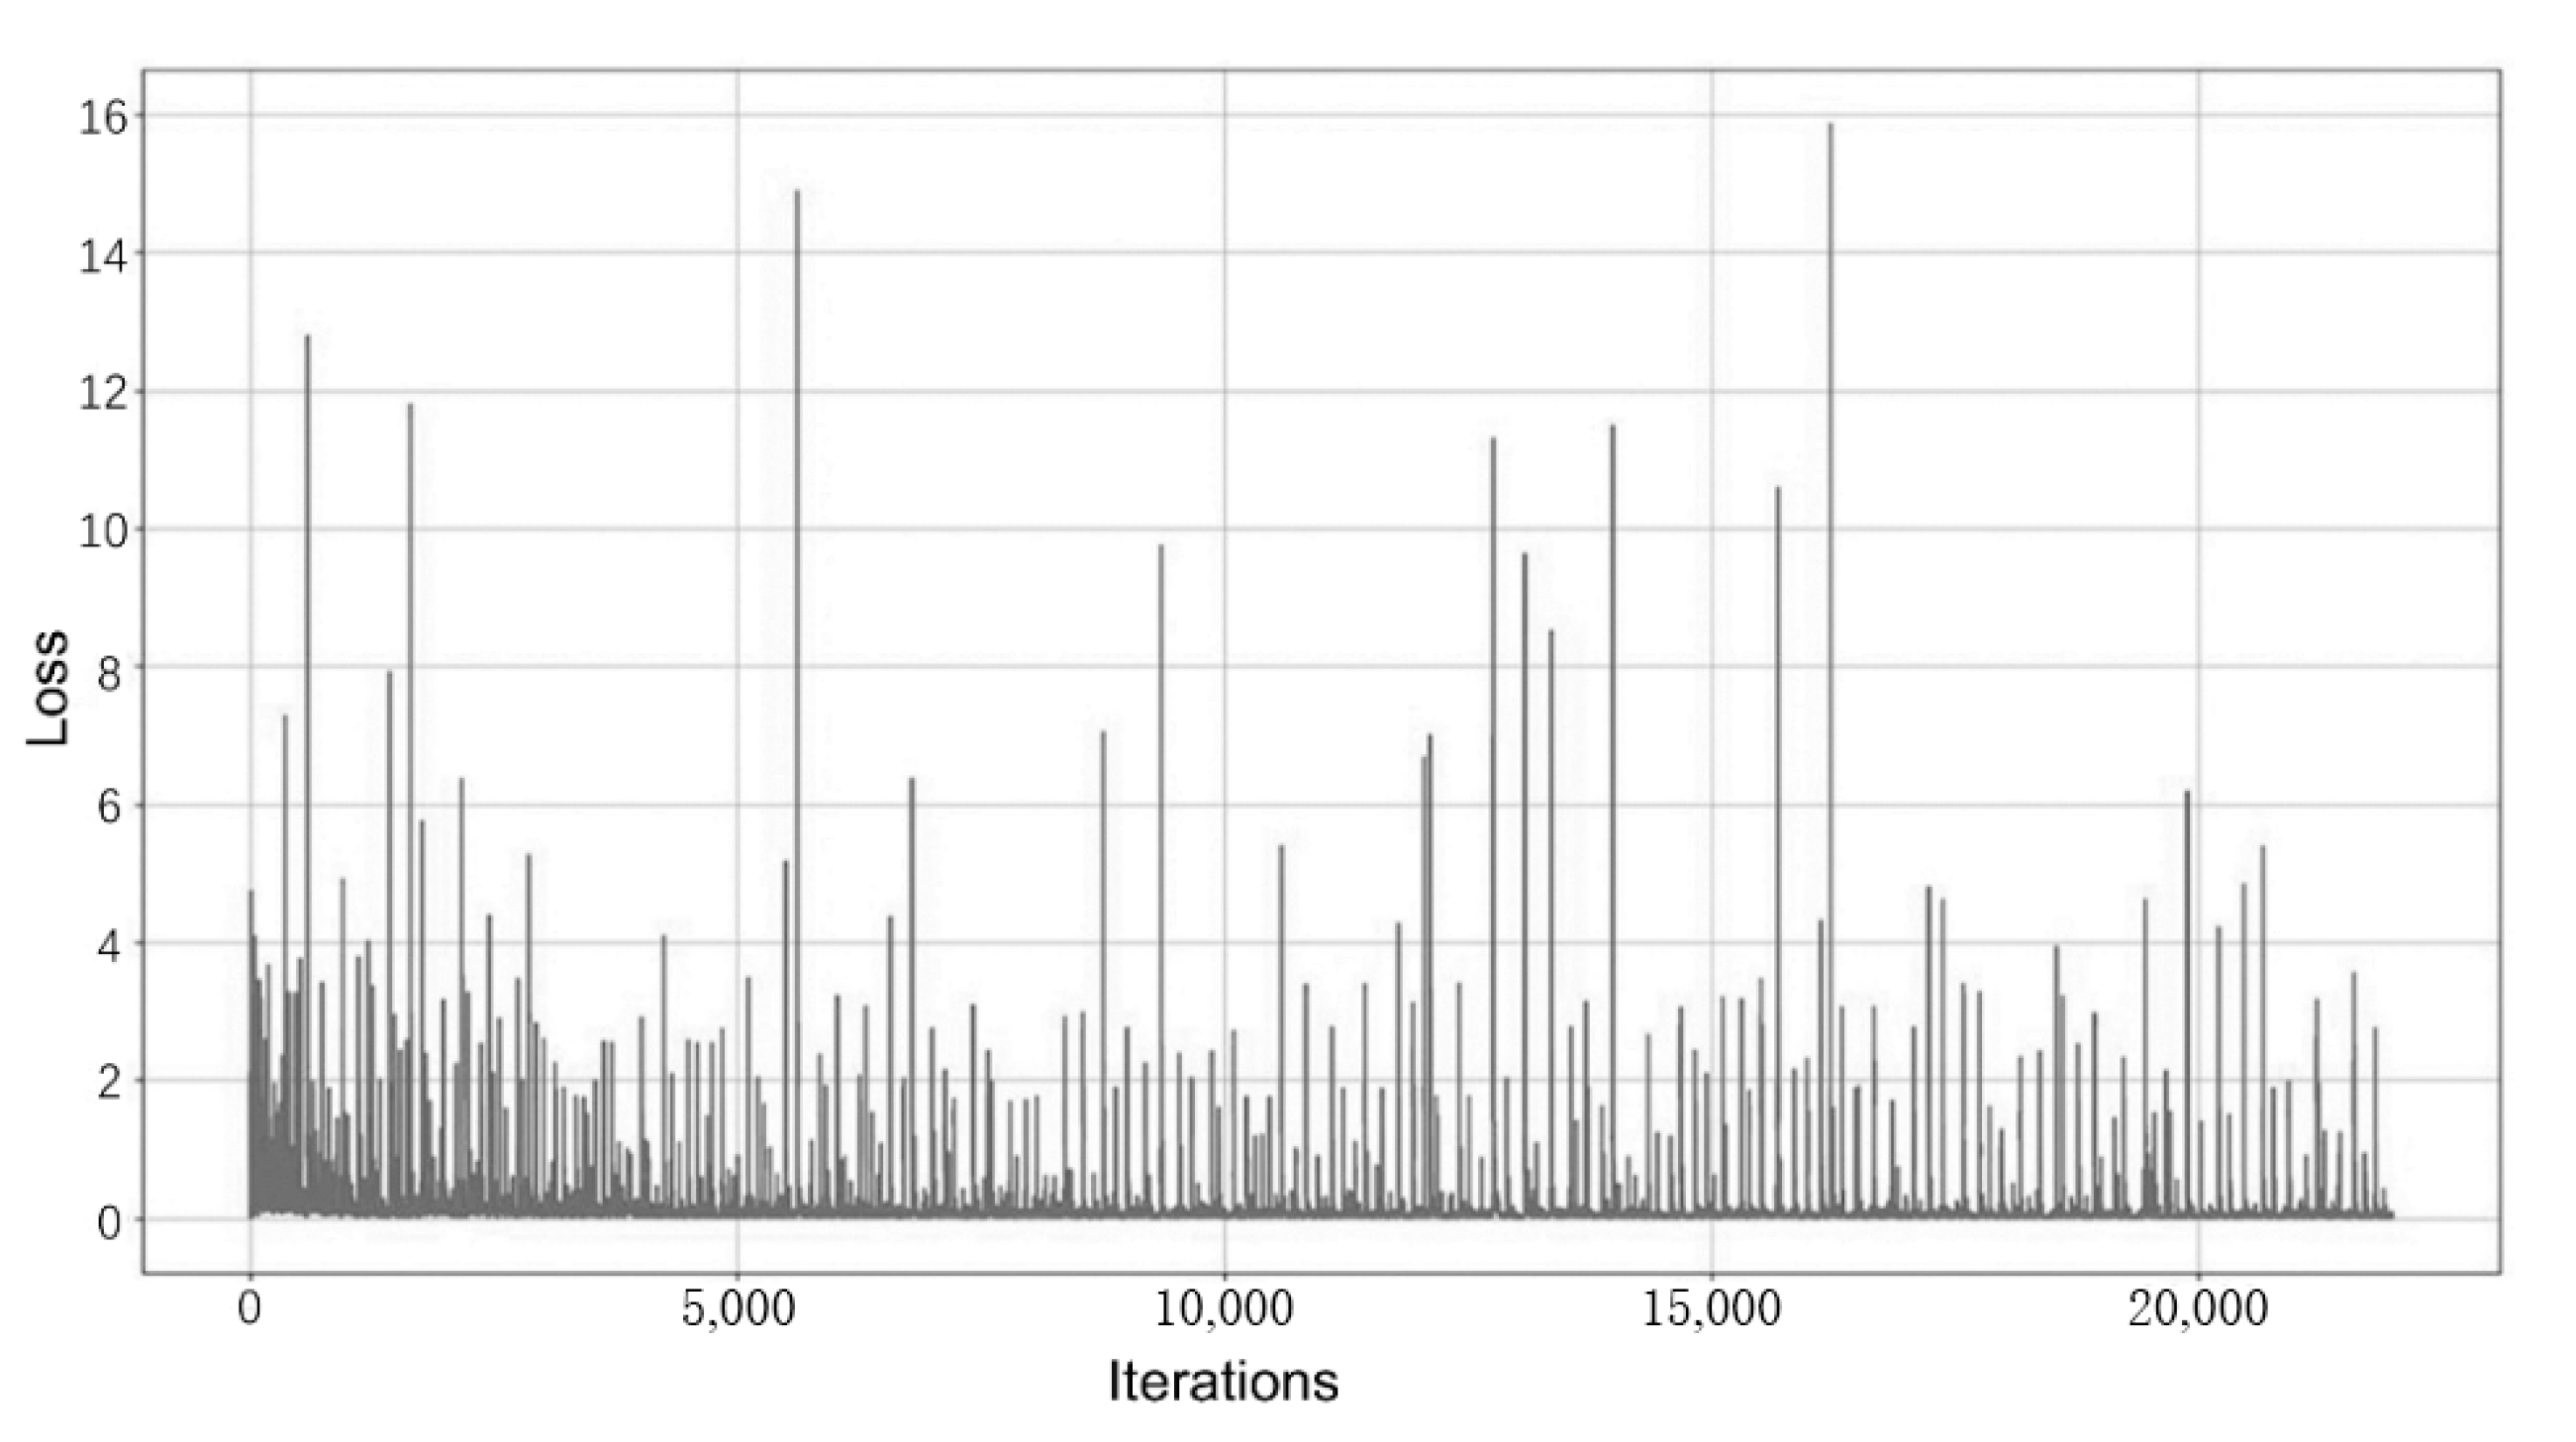
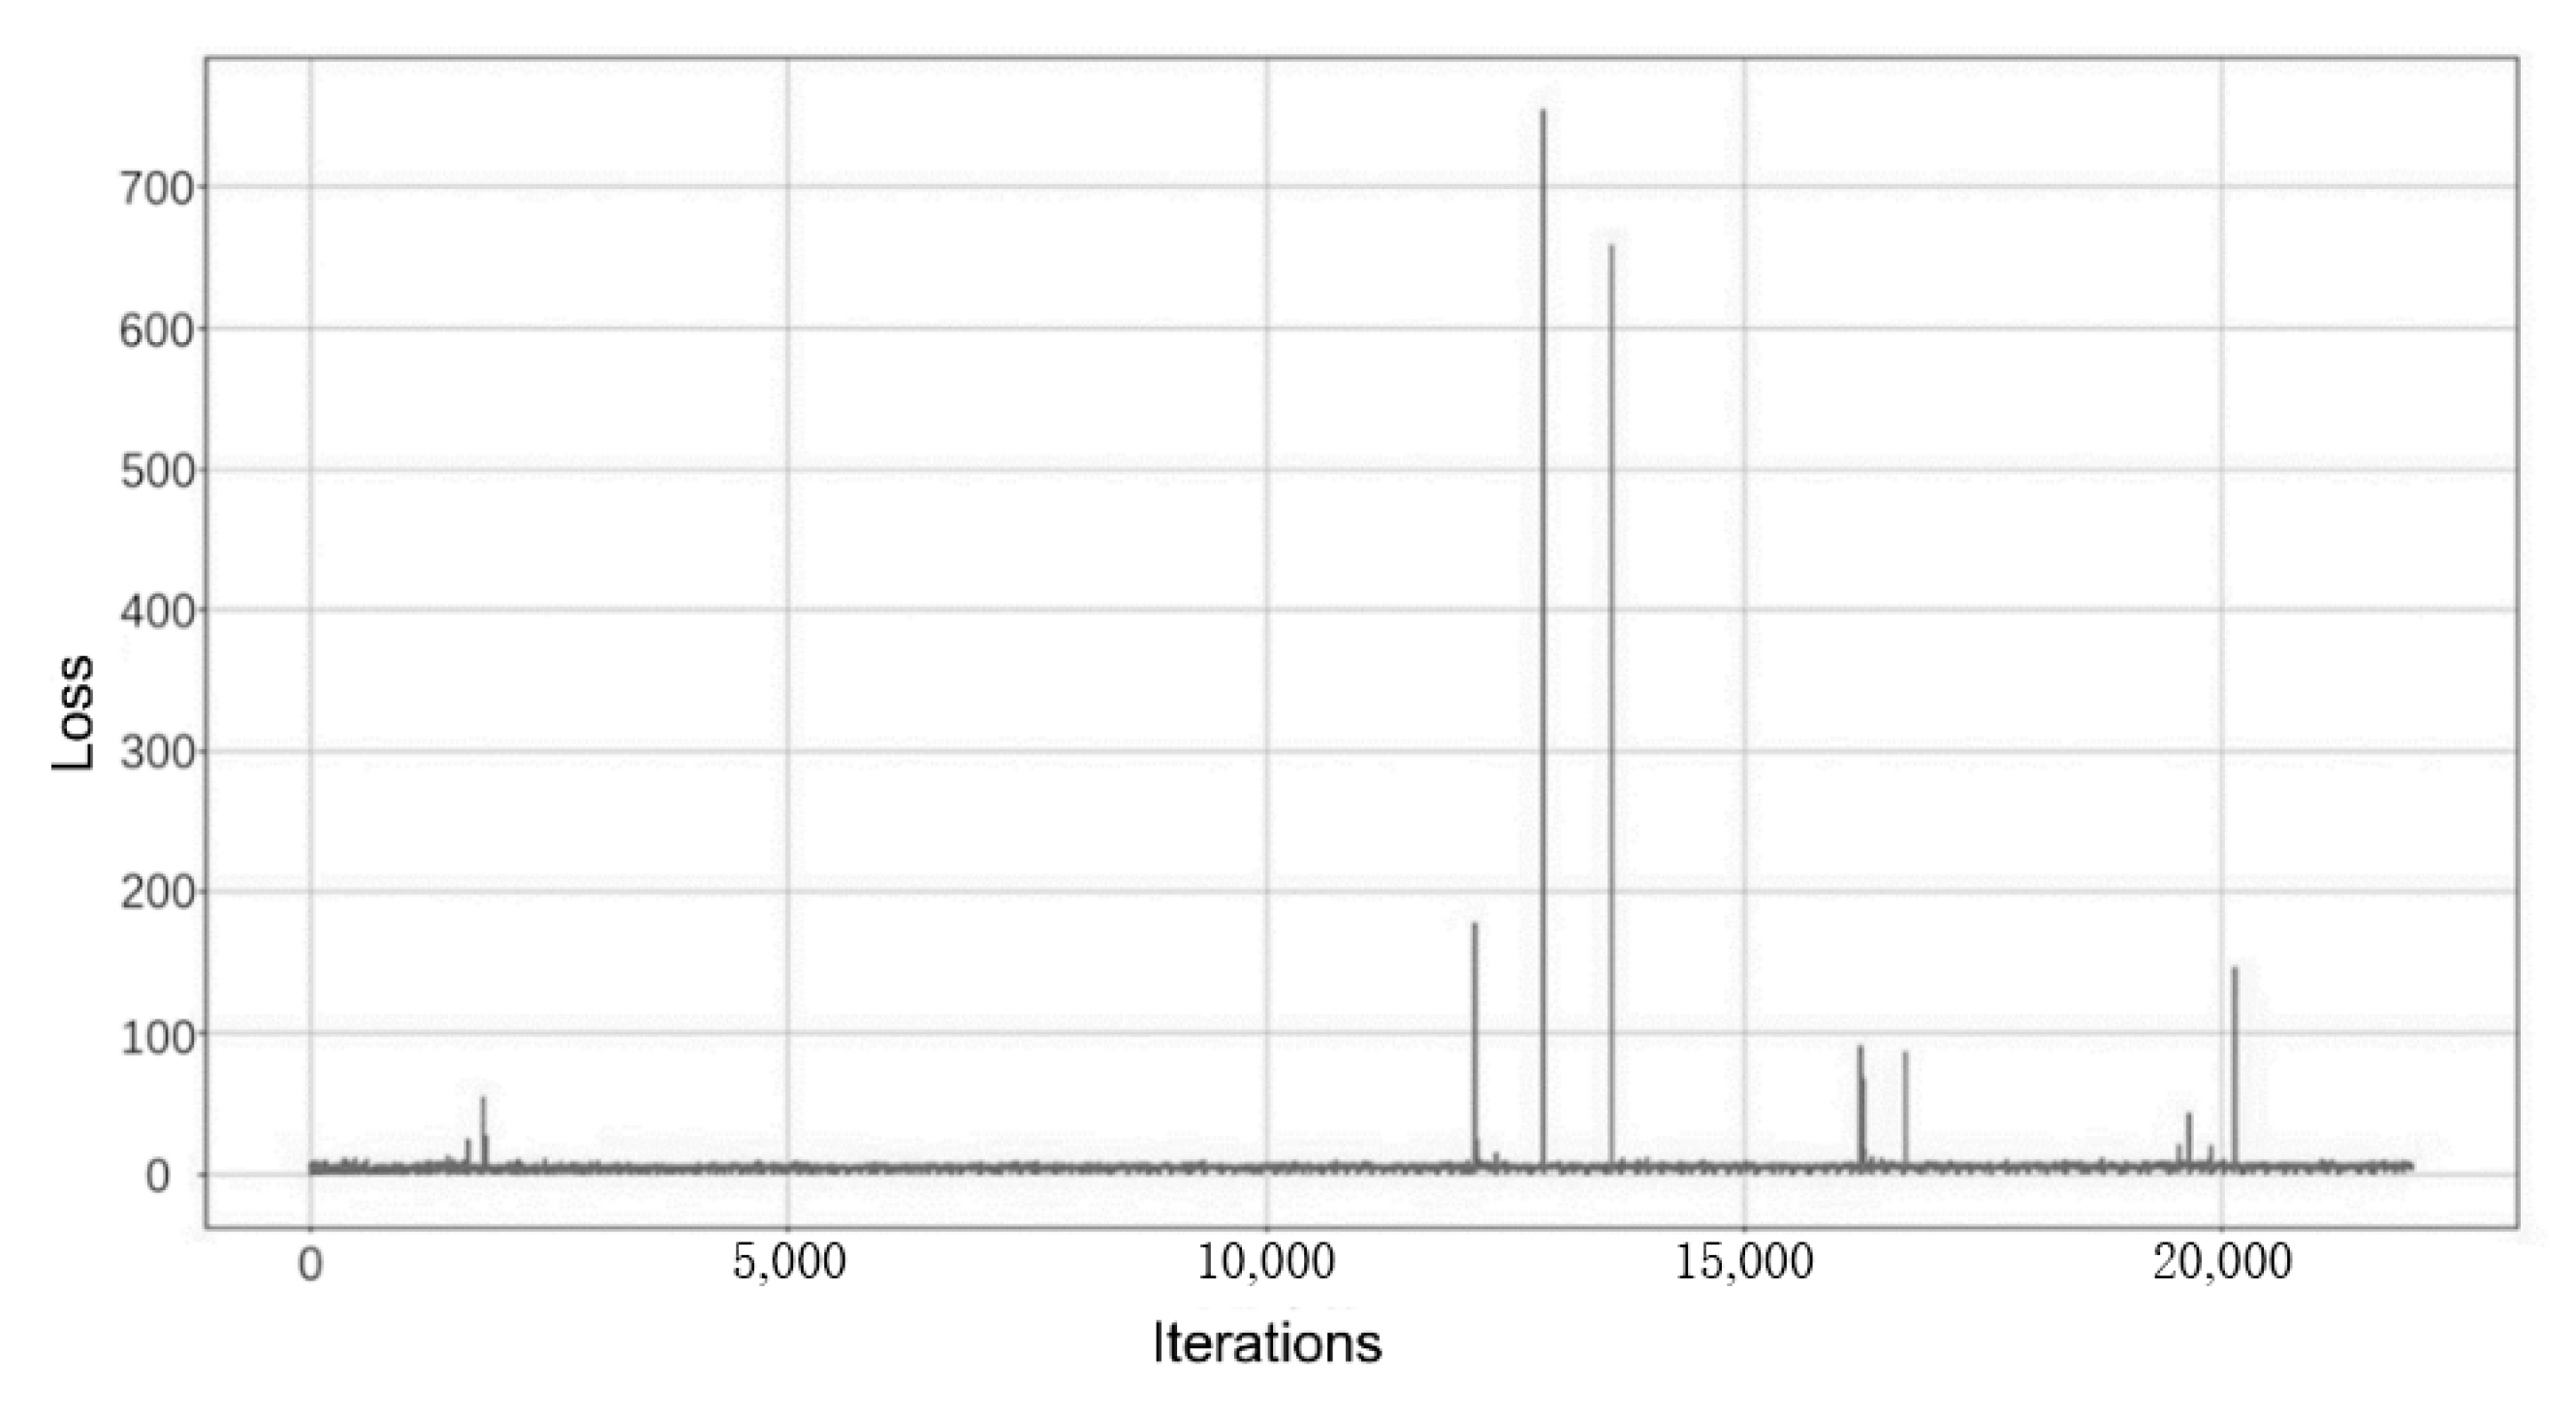
- The training process of the original StyleGAN2 needs to be observed by entering the visualization program. In order to facilitate the viewing of the loss values of the generator and discriminator, this experiment stores the discriminator loss value “d_loss_val” and the generator loss value “g_loss_val” obtained from each training iteration in the “d_losses” and “g_losses” arrays, which is convenient. After the training, the Matplotlib library is used to plot the loss curves of the discriminator and generator during the training. The variation of the loss function for the discriminator is shown in Figure 14, and the variation of the loss function for the generator is shown in Figure 15.
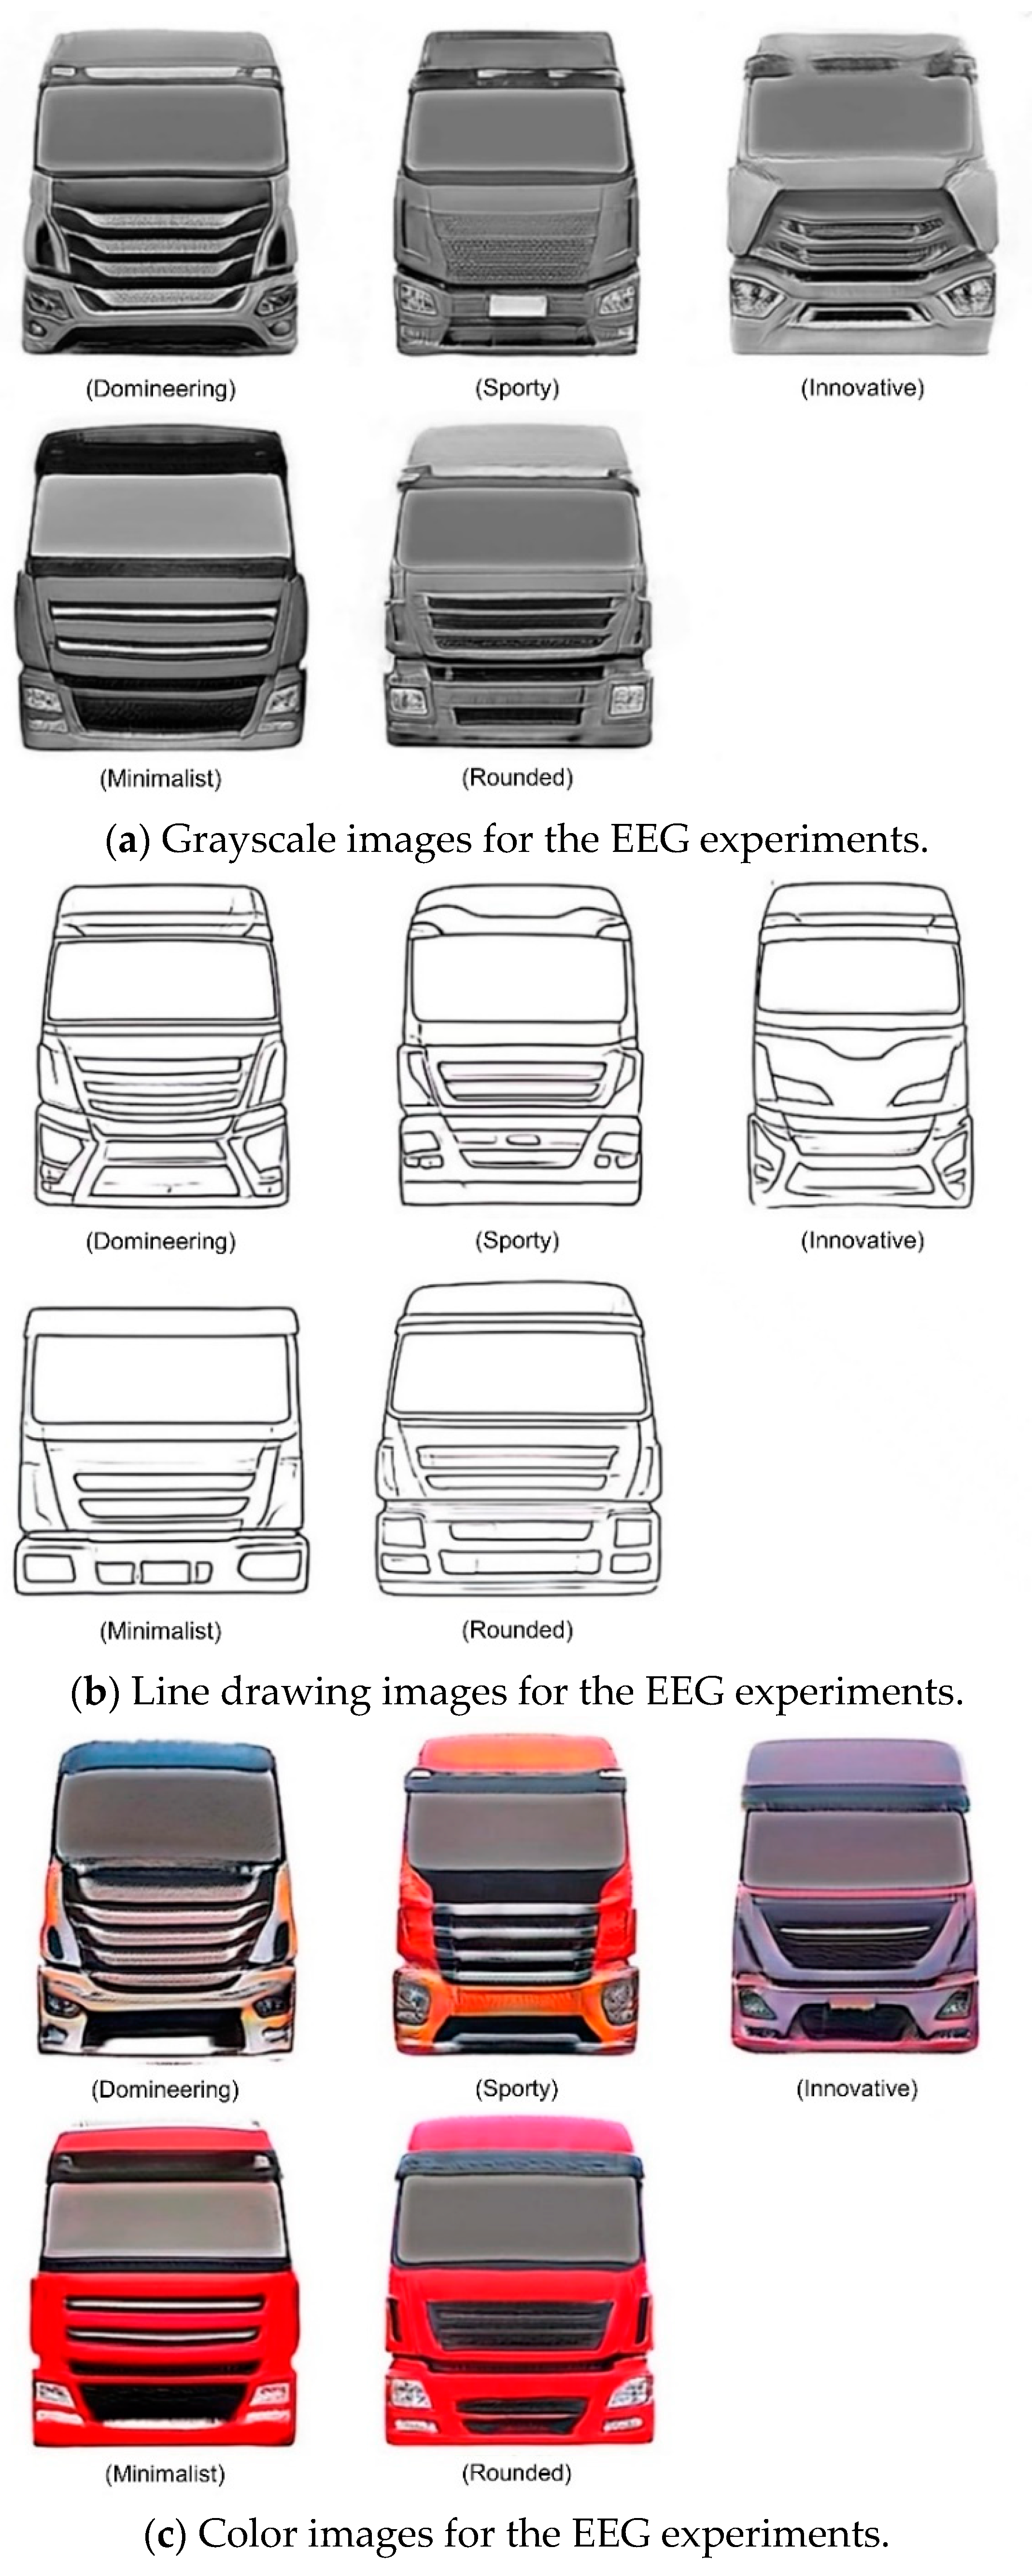
3.4.5. Results and Analysis of the Directed Generation Experiments
3.5. EEG-Based User Emotional Imagery Matching Metric Experiment
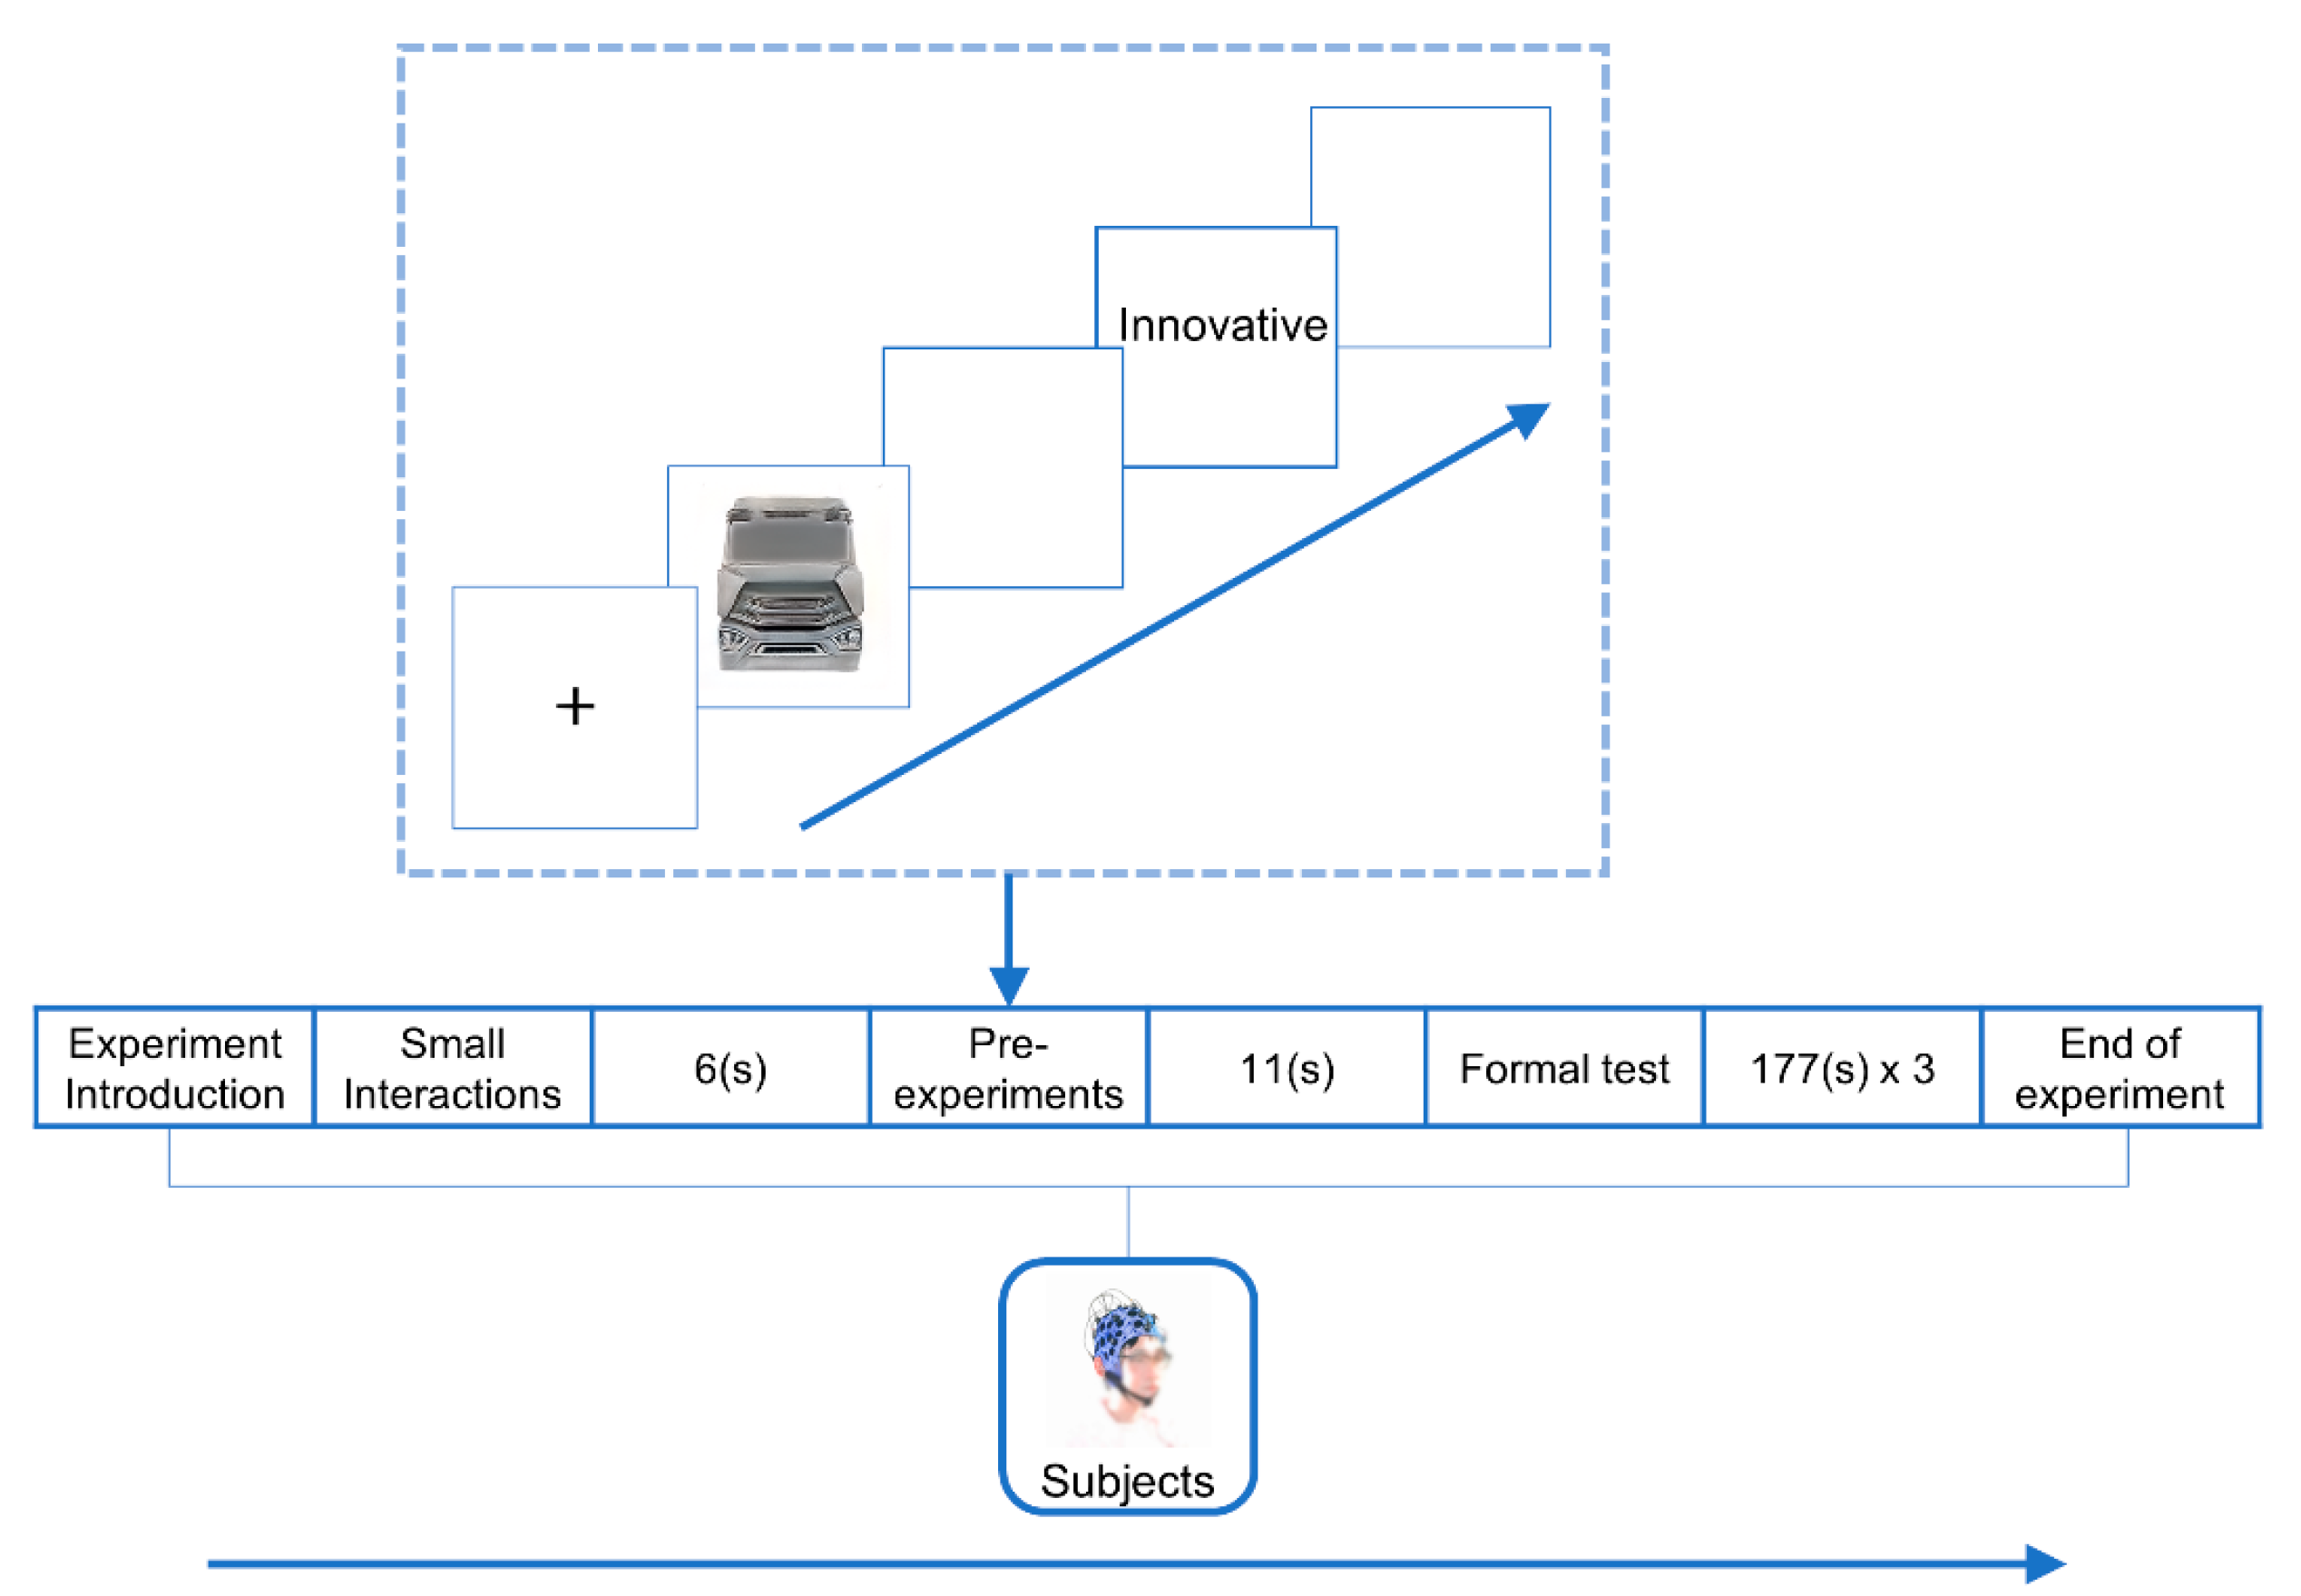
3.5.1. Overview of Experimental Design
3.5.2. Experimental Procedures and Methods
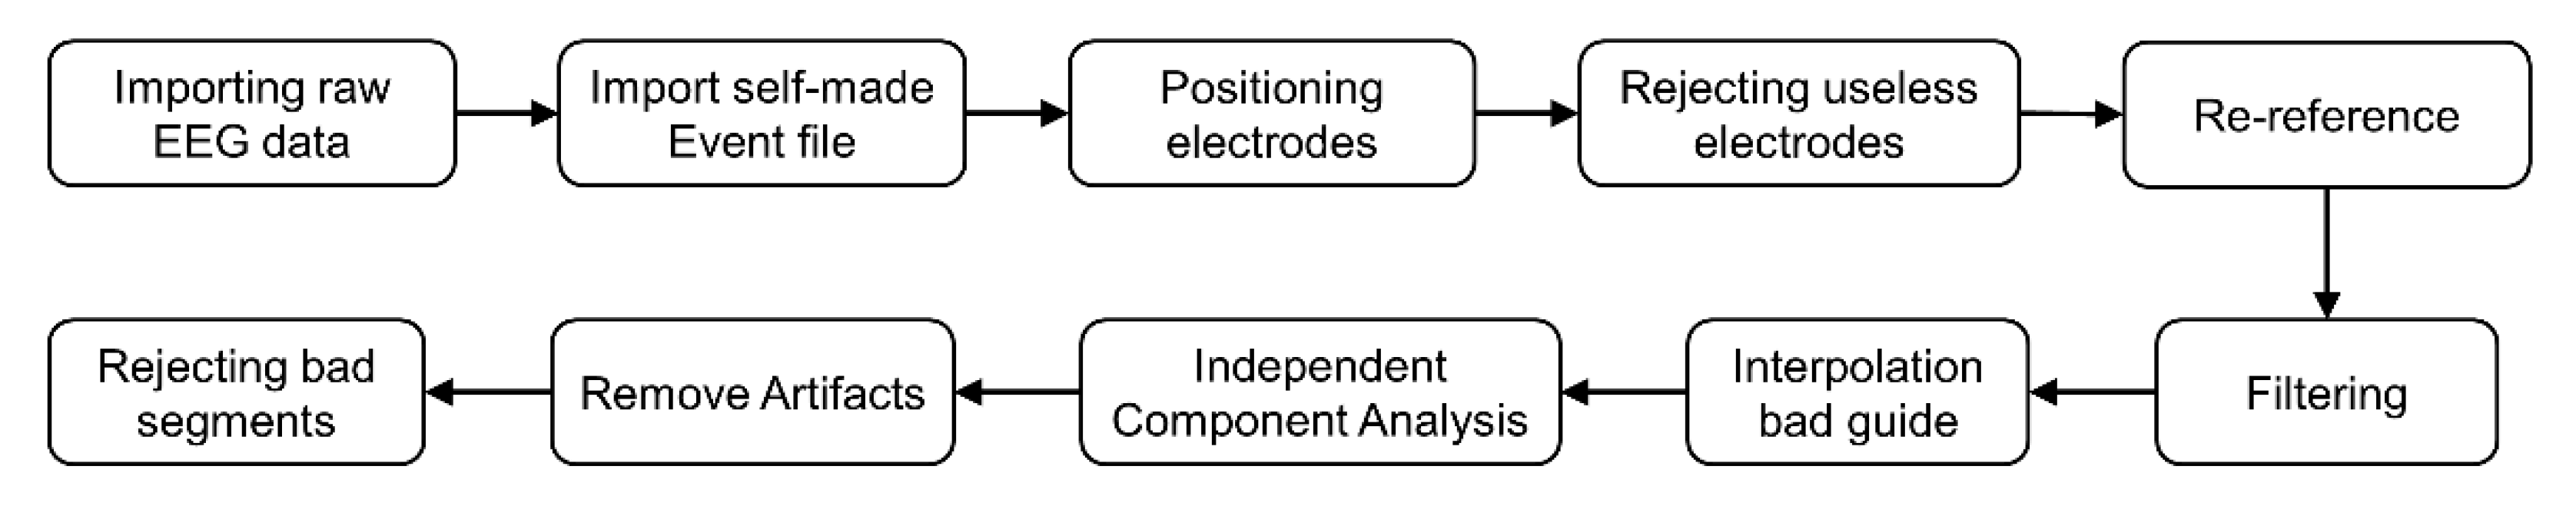
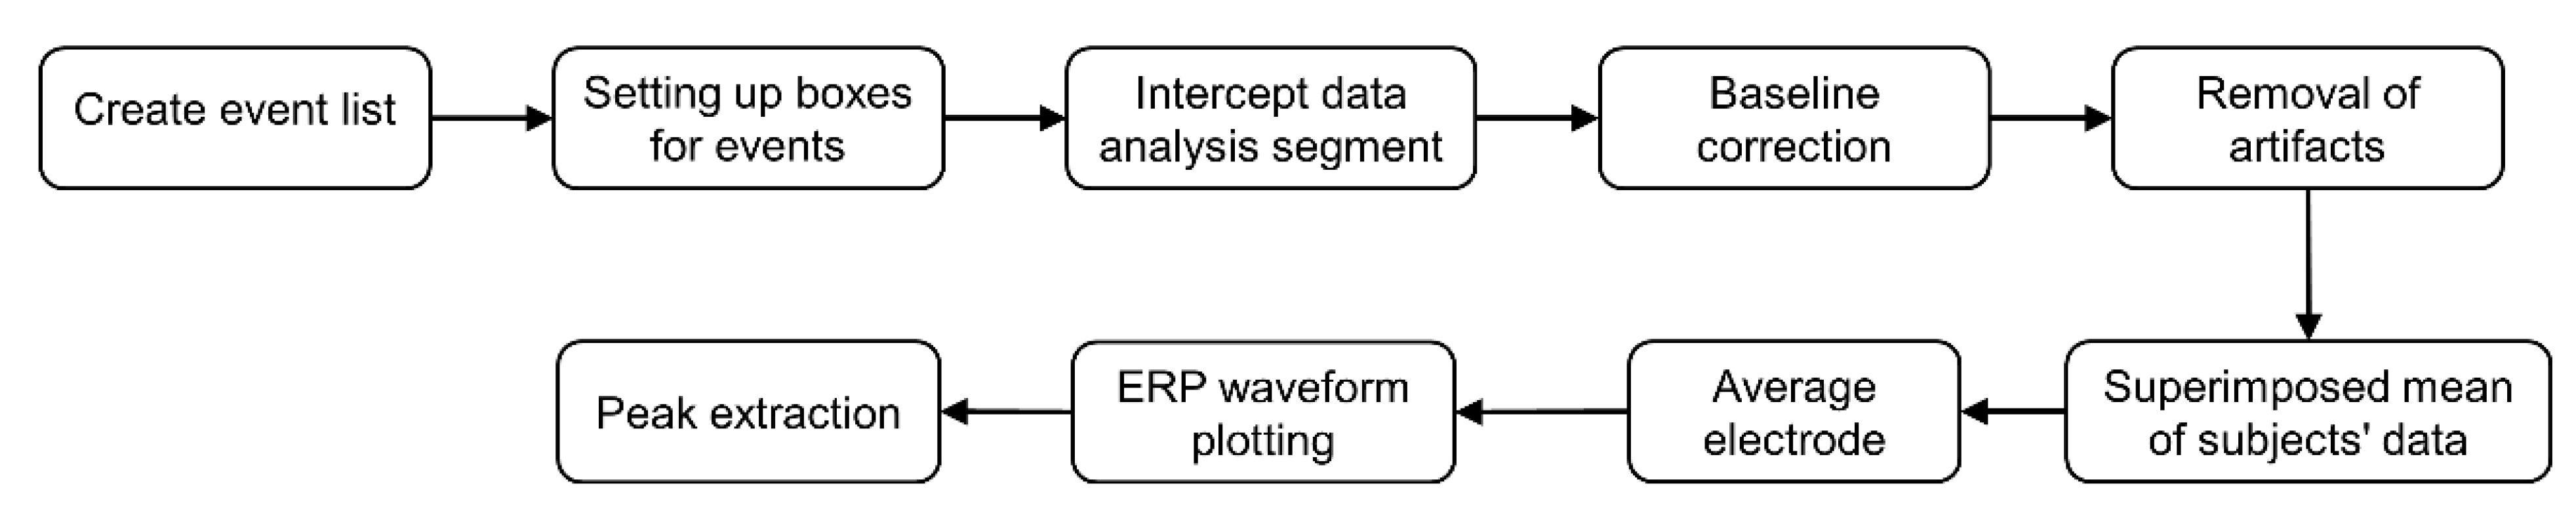
3.5.3. EEG Data Processing and Analysis
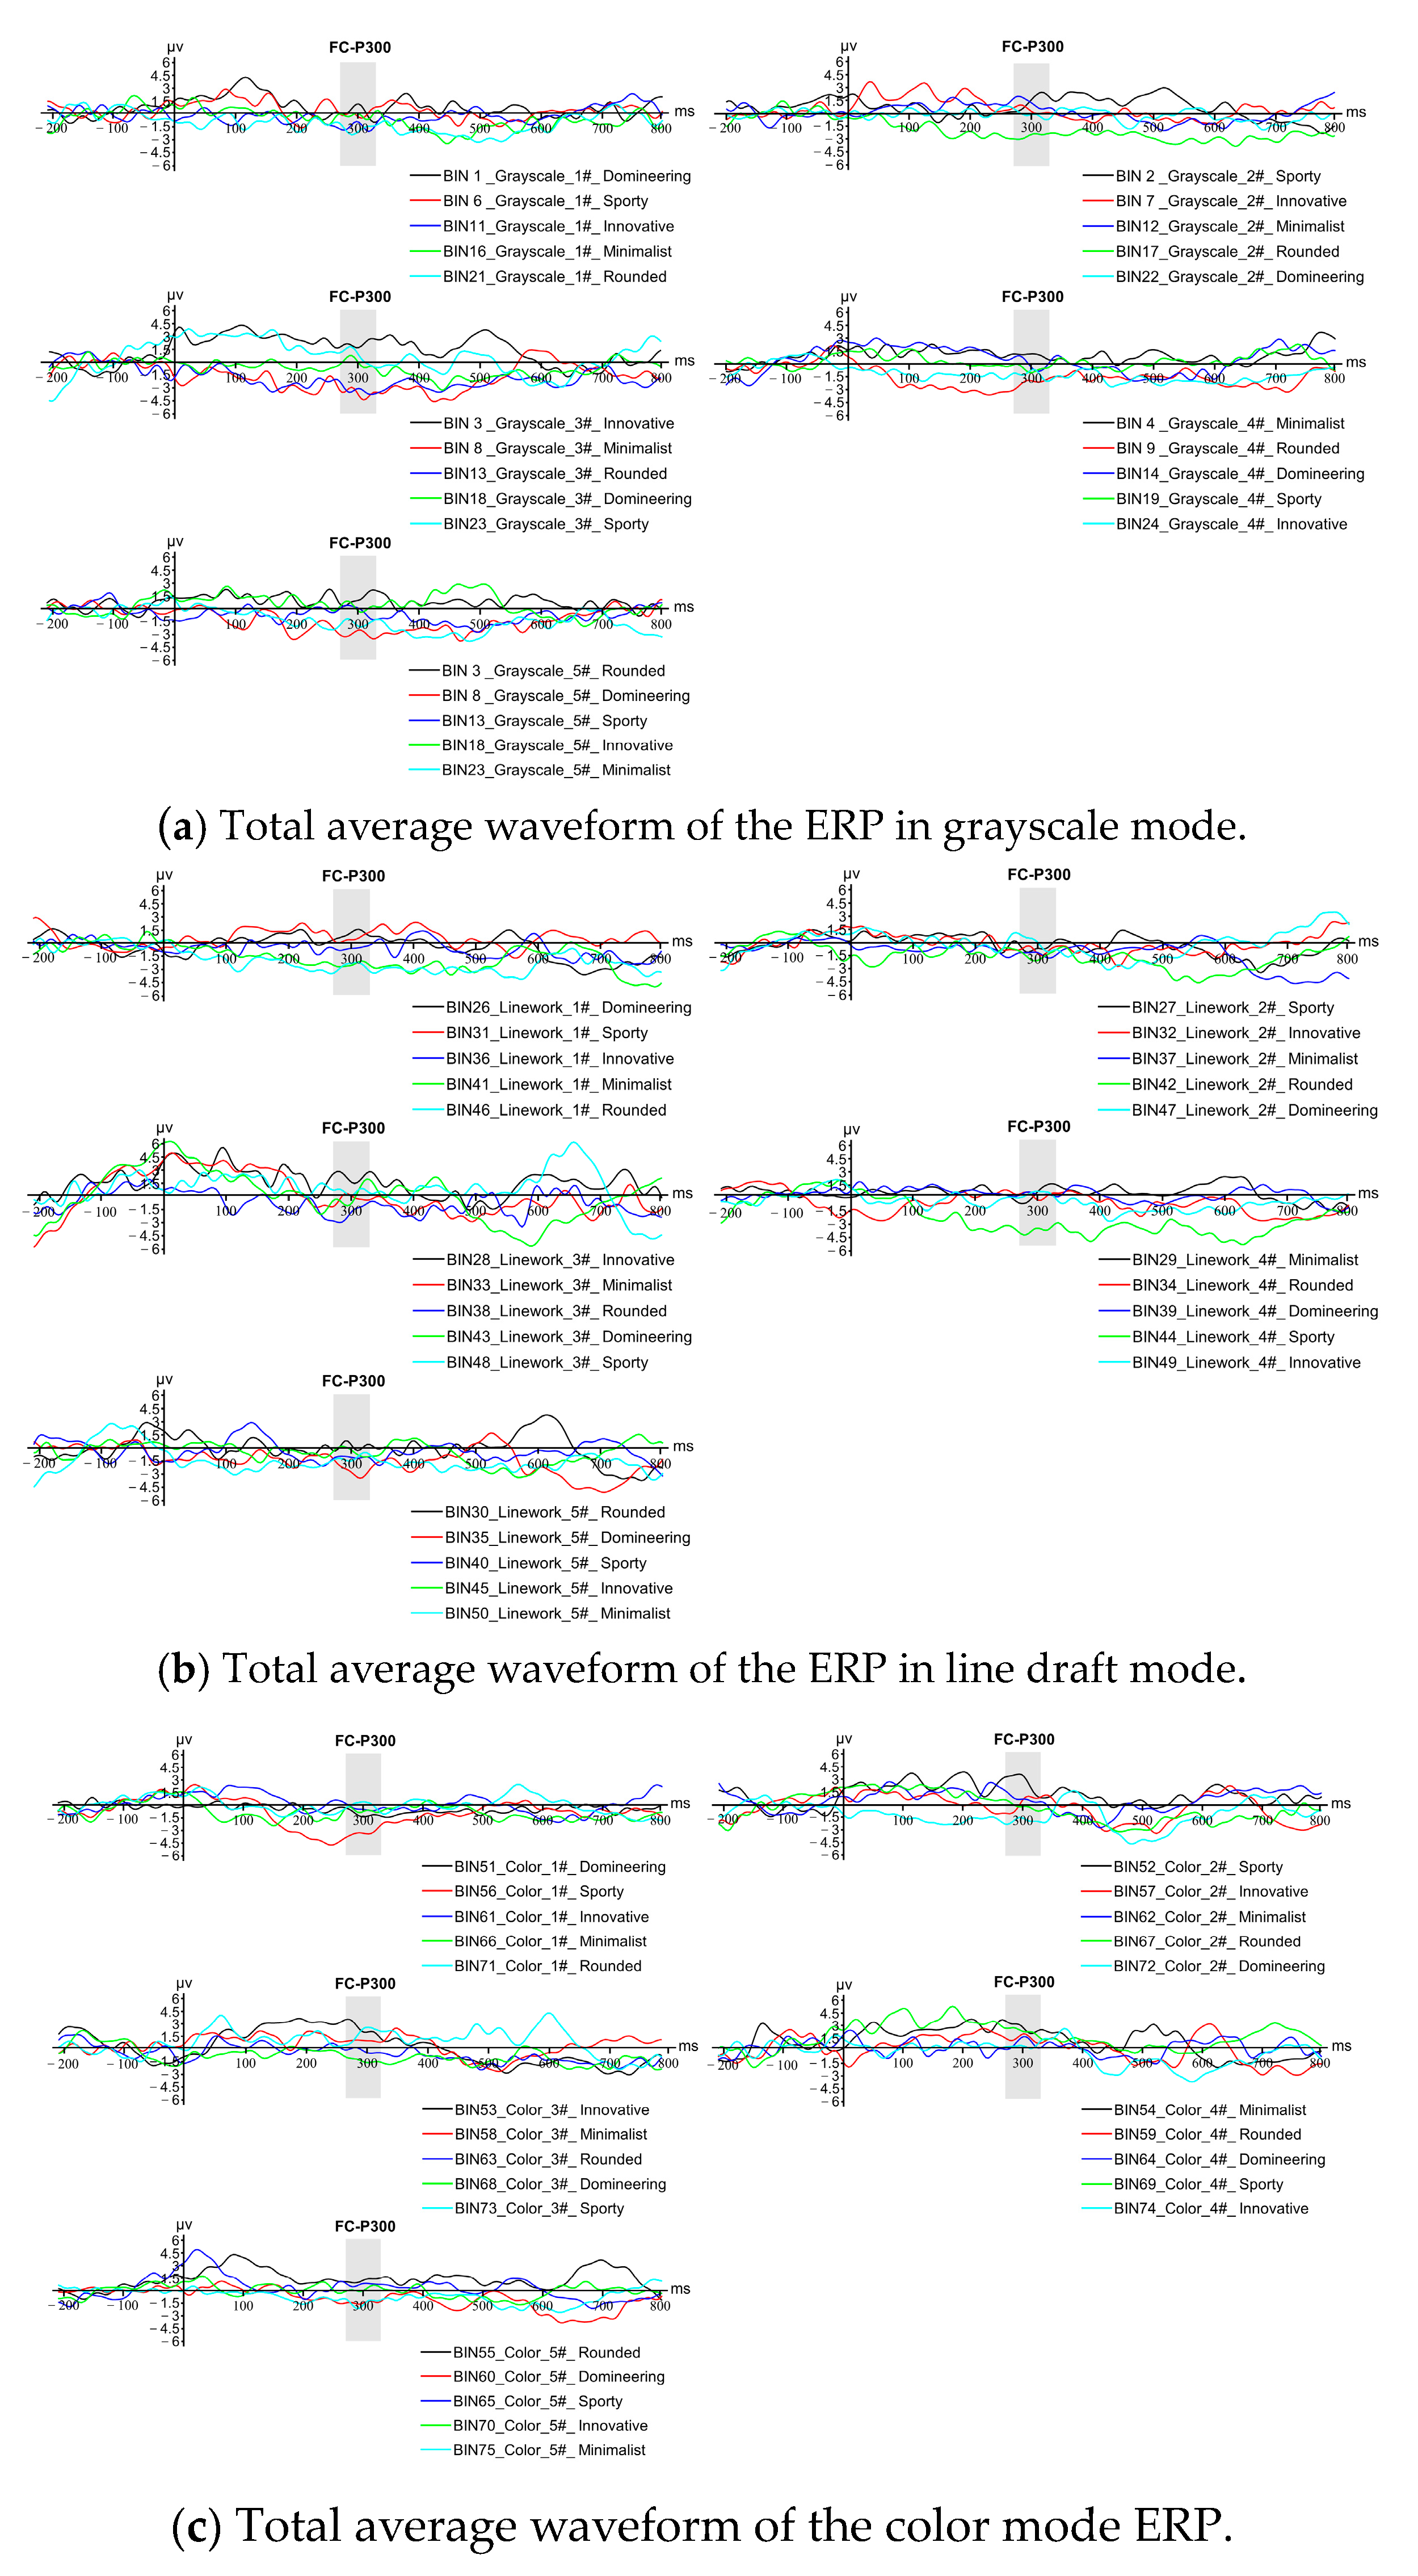
3.5.4. Data Analysis Results of the EEG Experiments
4. Discussion
4.1. Elaboration of the Findings
4.2. Potential Theoretical and Practical Implications
4.2.1. Theoretical Implications
4.2.2. Practical Implications
4.3. Limitations and Directions for Future Research
- (1)
- In this paper, a questionnaire was used in the imagery mining and analysis phase because it was not easy to find and manipulate a large number of eligible EEG subjects. In the future, a suitable physiological measurement tool can be selected for the study during imagery mining and localization to improve the objectivity, reliability, and persuasiveness of the study.
- (2)
- Considering the limitations of data resources and the difficulty of population research, the emotional intention classification of this study only has five categories with a single dimension, and the dataset collection samples are small. In the future, it is possible to build a comprehensive evaluation system for product imagery with more dimensions, expand the number of samples in the dataset through other technical means, or directly establish a three-dimensional database.
5. Conclusions
- (1)
- Construct the emotional imagery space of the truck front face design.
- (2)
- Application of deep learning technology for the directional generation of truck front face imagery modeling.
- (3)
- Quantitative experiment of user emotional image matching based on EEG technology.
Author Contributions
Funding
Institutional Review Board Statement
Informed Consent Statement
Data Availability Statement
Acknowledgments
Conflicts of Interest
References
- Pile, V.; Williamson, G.; Saunders, A.; Holmes, E.A.; Lau, J.Y. Harnessing emotional mental imagery to reduce anxiety and depression in young people: An integrative review of progress and promise. Lancet Psychiatry 2021, 8, 836–852. [Google Scholar] [CrossRef] [PubMed]
- Qiu, K.; Su, J.; Zhang, S.; Yang, W. Research on product target image cognition based on complex network theory and game theory. J. Adv. Mech. Des. Syst. Manuf. 2022, 16, JAMDSM0064. [Google Scholar] [CrossRef]
- Lee, J.L.; James, J.D.; Kim, Y.K. A reconceptualization of brand image. Int. J. Bus. Adm. 2014, 5, 1. [Google Scholar] [CrossRef]
- Park, J.; Gunn, F.; Lee, Y.; Shim, S. Consumer acceptance of a revolutionary technology-driven product: The role of adoption in the industrial design development. J. Retail. Consum. Serv. 2015, 26, 115–124. [Google Scholar] [CrossRef]
- Amatulli, C.; Guido, G.; Nataraajan, R. Luxury purchasing among older consumers: Exploring inferences about cognitive age, status, and style motivations. J. Bus. Res. 2015, 68, 1945–1952. [Google Scholar] [CrossRef]
- Shi, S.; Wang, Y.; Chen, X.; Zhang, Q. Conceptualization of omnichannel customer experience and its impact on shopping intention: A mixed-method approach. Int. J. Inf. Manag. 2020, 50, 325–336. [Google Scholar] [CrossRef]
- Nam, S.; Choi, J. Development of a user evaluation system in virtual reality based on eye-tracking technology. Multimed. Tools Appl. 2023, 82, 21117–21130. [Google Scholar] [CrossRef]
- Guo, F.; Li, M.; Hu, M.; Li, F.; Lin, B. Distinguishing and quantifying the visual aesthetics of a product: An integrated approach of eye-tracking and EEG. Int. J. Ind. Ergon. 2019, 71, 47–56. [Google Scholar] [CrossRef]
- Guo, F.; Liu, W.L.; Liu, F.T.; Wang, H.; Wang, T.B. Emotional design method of product presented in multi-dimensional variables based on Kansei Engineering. J. Eng. Des. 2014, 25, 194–212. [Google Scholar] [CrossRef]
- Vieira, J.; Osório, J.M.A.; Mouta, S.; Delgado, P.; Portinha, A.; Meireles, J.F.; Santos, J.A. Kansei engineering as a tool for the design of in-vehicle rubber keypads. Appl. Ergon. 2017, 61, 1–11. [Google Scholar] [CrossRef]
- Hou, T.; Yannou, B.; Leroy, Y.; Poirson, E. Mining customer product reviews for product development: A summarization process. Expert Syst. Appl. 2019, 132, 141–150. [Google Scholar] [CrossRef]
- Qi, J.; Zhang, Z.; Jeon, S.; Zhou, Y. Mining customer requirements from online reviews: A product improvement perspective. Inf. Manag. 2016, 53, 951–963. [Google Scholar] [CrossRef]
- Li, Y.; Feng, Q.; Huang, T.; Wang, S.; Cong, W.; Knighton, E. A new product development study using intelligent data analysis algorithm based on KE theory. J. Intell. Fuzzy Syst. 2022, 43, 7041–7055. [Google Scholar] [CrossRef]
- Xue, L.; Yi, X.; Zhang, Y. Research on optimized product image design integrated decision system based on Kansei engineering. Appl. Sci. 2020, 10, 1198. [Google Scholar] [CrossRef]
- Wu, M.Y.; Chen, Y.H. Factors affecting consumers’ cognition of food photos using Kansei engineering. Food Sci. Technol. 2021, 42, e38921. [Google Scholar] [CrossRef]
- Cong, J.; Chen, C.H.; Zheng, P. Design entropy theory: A new design methodology for smart PSS development. Adv. Eng. Inform. 2020, 45, 101124. [Google Scholar] [CrossRef]
- Zhang, S.; Su, P.; Liu, S. Fusion of cognitive information: Evaluation and evolution method of product image form. Comput. Intell. Neurosci. 2021, 2021, 5524093. [Google Scholar] [CrossRef] [PubMed]
- Xue, S. Intelligent system for products personalization and design using genetic algorithm. J. Intell. Fuzzy Syst. 2019, 37, 63–70. [Google Scholar] [CrossRef]
- Hu, M. Decision-making model of product modeling big data design scheme based on neural network optimized by genetic algorithm. Comput. Intell. Neurosci. 2021, 2021, 9315700. [Google Scholar] [CrossRef]
- Dong, Y.; Peng, Q.; Tan, R.; Zhang, J.L.; Zhang, P.; Liu, W. Product function redesign based on extension theory. Comput. Aided Des. Appl. 2021, 18, 199–210. [Google Scholar] [CrossRef]
- Wang, T.; Li, H.; Wang, X. Extension Design Model of Rapid Configuration Design for Complex Mechanical Products Scheme Design. Appl. Sci. 2022, 12, 7921. [Google Scholar] [CrossRef]
- Mao, J.; Zhu, Y.; Chen, M.; Chen, G.; Yan, C.; Liu, D. A contradiction solving method for complex product conceptual design based on deep learning and technological evolution patterns. Adv. Eng. Inform. 2023, 55, 101825. [Google Scholar] [CrossRef]
- Yang, H.; Zhang, J.; Wang, Y.; Jia, R. Exploring relationships between design features and system usability of intelligent car human–machine interface. Robot. Auton. Syst. 2021, 143, 103829. [Google Scholar] [CrossRef]
- Wu, J.; Jia, L. Neural Network Model for Perceptual Evaluation of Product Modelling Design Based on Multimodal Image Recognition. Comput. Intell. Neurosci. 2022, 2022, 1665021. [Google Scholar] [CrossRef] [PubMed]
- Ding, M.; Zhao, L.; Pei, H.; Song, M. An XGBoost based evaluation methodology of product color emotion design. J. Adv. Mech. Des. Syst. Manuf. 2021, 15, JAMDSM0075. [Google Scholar] [CrossRef]
- Zeng, D.; He, M.E.; Tang, X.Z.; Wang, F.G. Cognitive association in interactive evolutionary design process for product styling and application to SUV design. Electronics 2020, 9, 1960. [Google Scholar] [CrossRef]
- Luo, X.; Zhao, H.; Chen, Y. Research on User Experience of Sports Smart Bracelet Based on Fuzzy Comprehensive Appraisal and SSA-BP Neural Network. Comput. Intell. Neurosci. 2022, 2022, 5597662. [Google Scholar] [CrossRef] [PubMed]
- Chen, D.; Cheng, P. Development of design system for product pattern design based on Kansei engineering and BP neural network. Int. J. Cloth. Sci. Technol. 2022, 34, 335–346. [Google Scholar] [CrossRef]
- Barmpalexis, P.; Karagianni, A.; Karasavvaides, G.; Kachrimanis, K. Comparison of multi-linear regression, particle swarm optimization artificial neural networks and genetic programming in the development of mini-tablets. Int. J. Pharm. 2018, 551, 166–176. [Google Scholar] [CrossRef]
- Ng, C.Y. Green product design and development using life cycle assessment and ant colony optimization. Int. J. Adv. Manuf. Technol. 2018, 95, 3101–3109. [Google Scholar] [CrossRef]
- Wang, L.; Liu, Z. Data-driven product design evaluation method based on multi-stage artificial neural network. Appl. Soft Comput. 2021, 103, 107117. [Google Scholar] [CrossRef]
- Mohseni, S.; Jayashree, S.; Rezaei, S.; Kasim, A.; Okumus, F. Attracting tourists to travel companies’ websites: The structural relationship between website brand, personal value, shopping experience, perceived risk and purchase intention. Curr. Issues Tour. 2018, 21, 616–645. [Google Scholar] [CrossRef]
- Wu, H.C.; Li, T. A study of experiential quality, perceived value, heritage image, experiential satisfaction, and behavioral intentions for heritage tourists. J. Hosp. Tour. Res. 2017, 41, 904–944. [Google Scholar] [CrossRef]
- Zhou, C.; Yuan, F.; Huang, T.; Zhang, Y.; Kaner, J. The Impact of Interface Design Element Features on Task Performance in Older Adults: Evidence from Eye-Tracking and EEG Signals. Int. J. Environ. Res. Public Health 2022, 19, 9251. [Google Scholar] [CrossRef] [PubMed]
- Lin, L.; Guo, G.; Xu, N. User-perceived styling experience of smart vehicles: A method to combine eye tracking with semantic differences. IET Intell. Transp. Syst. 2019, 13, 72–78. [Google Scholar] [CrossRef]
- Kuo, J.Y.; Chen, C.H.; Koyama, S.; Chang, D. Investigating the relationship between users’ eye movements and perceived product attributes in design concept evaluation. Appl. Ergon. 2021, 94, 103393. [Google Scholar] [CrossRef] [PubMed]
- Guo, F.; Qu, Q.X.; Nagamachi, M.; Duffy, V.G. A proposal of the event-related potential method to effectively identify kansei words for assessing product design features in kansei engineering research. Int. J. Ind. Ergon. 2020, 76, 102940. [Google Scholar] [CrossRef]
- Deng, L.; Wang, G. Application of EEG and interactive evolutionary design method in cultural and creative product design. Comput. Intell. Neurosci. 2019, 2019, 1860921. [Google Scholar] [CrossRef]
- Feng, Y.; Zhao, Y.; Zheng, H.; Li, Z.; Tan, J. Data-driven product design toward intelligent manufacturing: A review. Int. J. Adv. Robot. Syst. 2020, 17, 1729881420911257. [Google Scholar] [CrossRef]
- Tao, F.; Cheng, J.; Qi, Q.; Zhang, M.; Zhang, H.; Sui, F. Digital twin-driven product design, manufacturing and service with big data. Int. J. Adv. Manuf. Technol. 2018, 94, 3563–3576. [Google Scholar] [CrossRef]
- Chen, L.; Wang, P.; Dong, H.; Shi, F.; Han, J.; Guo, Y.; Childs, P.R.; Xiao, J.; Wu, C. An artificial intelligence-based data-driven approach for design ideation. J. Vis. Commun. Image Represent. 2019, 61, 10–22. [Google Scholar] [CrossRef]
- Alzubaidi, L.; Zhang, J.; Humaidi, A.J.; Al-Dujaili, A.; Duan, Y.; Al-Shamma, O.; Santamaría, J.; Fadhel, M.A.; Al-Amidie, M.; Farhan, L. Review of deep learning: Concepts, CNN architectures, challenges, applications, future directions. J. Big Data 2021, 8, 1–74. [Google Scholar] [CrossRef]
- Wang, Q. Design of Watercolor Cultural and Creative Products Based on Style Transfer Algorithm. Math. Probl. Eng. 2022, 2022, 2711861. [Google Scholar] [CrossRef]
- Duan, Y.; Zhang, J.; Gu, X. A novel paradigm to design personalized derived images of art paintings using an intelligent emotional analysis model. Front. Psychol. 2021, 12, 713545. [Google Scholar] [CrossRef] [PubMed]
- Ruder, M.; Dosovitskiy, A.; Brox, T. Artistic style transfer for videos and spherical images. Int. J. Comput. Vis. 2018, 126, 1199–1219. [Google Scholar] [CrossRef]
- Akber, S.M.A.; Kazmi, S.N.; Mohsin, S.M.; Szczęsna, A. Deep Learning-Based Motion Style Transfer Tools, Techniques and Future Challenges. Sensors 2023, 23, 2597. [Google Scholar] [CrossRef] [PubMed]
- Quan, H.; Li, S.; Hu, J. Product innovation design based on deep learning and Kansei engineering. Appl. Sci. 2018, 8, 2397. [Google Scholar] [CrossRef]
- Jing, Y.; Yang, Y.; Feng, Z.; Ye, J.; Yu, Y.; Song, M. Neural style transfer: A review. IEEE Trans. Vis. Comput. Graph. 2019, 26, 3365–3385. [Google Scholar] [CrossRef]
- Yan, M.; Xiong, R.; Shen, Y.; Jin, C.; Wang, Y. Intelligent generation of Peking opera facial masks with deep learning frameworks. Herit. Sci. 2023, 11, 20. [Google Scholar] [CrossRef]
- Wu, Y.; Zhang, H. Image style recognition and intelligent design of oiled paper bamboo umbrella based on deep learning. Comput. Aided Des. Appl. 2021, 19, 76–90. [Google Scholar] [CrossRef]
- Burnap, A.; Liu, Y.; Pan, Y.; Lee, H.; Gonzalez, R.; Papalambros, P.Y. Estimating and exploring the product form design space using deep generative models. In Proceedings of the International Design Engineering Technical Conferences and Computers and Information in Engineering Conference, Charlotte, NC, USA, 21–24 August 2016; American Society of Mechanical Engineers: New York, NY, USA, 2016; Volume 50107, p. V02AT03A013. [Google Scholar] [CrossRef]
- Ramzan, S.; Iqbal, M.M.; Kalsum, T. Text-to-Image Generation Using Deep Learning. Eng. Proc. 2022, 20, 16. [Google Scholar] [CrossRef]
- Liu, H.; Xu, Y.; Chen, F. Sketch2Photo: Synthesizing photo-realistic images from sketches via global contexts. Eng. Appl. Artif. Intell. 2023, 117, 105608. [Google Scholar] [CrossRef]
- Dai, Y.; Li, Y.; Liu, L.J. New product design with automatic scheme generation. Sens. Imaging 2019, 20, 29. [Google Scholar] [CrossRef]
- Li, X.; Wang, Y.; Sha, Z. Deep Learning Methods of Cross-Modal Tasks for Conceptual Design of Product Shapes: A Review. J. Mech. Des. 2023, 145, 041401. [Google Scholar] [CrossRef]
- Jiao, L.; Zhao, J. A survey on the new generation of deep learning in image processing. IEEE Access 2019, 7, 172231–172263. [Google Scholar] [CrossRef]
- Le, Q.; Miralles-Pechuán, L.; Kulkarni, S.; Su, J.; Boydell, O. An overview of deep learning in industry. In Data Analytics and AI; Auerbach Publications: New York, NY, USA, 2020; pp. 65–98. [Google Scholar] [CrossRef]
- Jaiswal, D.P.; Kumar, S.; Badr, Y. Towards an artificial intelligence aided design approach: Application to anime faces with generative adversarial networks. Procedia Comput. Sci. 2020, 168, 57–64. [Google Scholar] [CrossRef]
- Guo, F.; Wang, X.S.; Liu, W.L.; Ding, Y. Affective preference measurement of product appearance based on event-related potentials. Cogn. Technol. Work 2018, 20, 299–308. [Google Scholar] [CrossRef]


| Sample 1 | Sample 2 | Sample 3 | ··· | Sample 25 | Sample 26 | Sample 27 | |
|---|---|---|---|---|---|---|---|
| Sample 1 | 22 | 0 | 0 | ··· | 0 | 18 | 0 |
| Sample 2 | 0 | 22 | 1 | ··· | 3 | 0 | 0 |
| Sample 3 | 0 | 1 | 22 | ··· | 2 | 0 | 0 |
| Sample 4 | 0 | 0 | 2 | ··· | 1 | 0 | 2 |
| ⁝ | ⁝ | ⁝ | ⁝ | ⁝ | ⁝ | ⁝ | |
| Sample 24 | 0 | 0 | 0 | ··· | 0 | 0 | 0 |
| Sample 25 | 0 | 3 | 2 | ··· | 22 | 1 | 2 |
| Sample 26 | 18 | 0 | 0 | ··· | 1 | 22 | 0 |
| Sample 27 | 0 | 0 | 0 | ··· | 2 | 0 | 22 |
| Dimension 1 | Dimension 2 | Dimension 3 | Dimension 4 | Dimension 5 | Dimension 6 | |
|---|---|---|---|---|---|---|
| Sample 1 | −0.7339 | −1.4638 | −1.3204 | −1.5978 | 0.5369 | 0.0928 |
| Sample 2 | −0.3588 | −0.2469 | 0.4480 | 0.0816 | −0.4308 | −1.0219 |
| Sample 3 | −1.5737 | 2.5069 | −0.2423 | −0.1148 | 0.3699 | 0.2980 |
| Sample 4 | −0.4756 | −0.2327 | 0.2931 | 0.1190 | −0.5355 | −1.1086 |
| ⁝ | ⁝ | ⁝ | ⁝ | ⁝ | ⁝ | ⁝ |
| Sample 24 | 2.9822 | 0.6639 | −0.5215 | −0.0446 | 0.0098 | 0.0699 |
| Sample 25 | −0.6936 | 0.2190 | 0.2424 | 0.0205 | −0.3203 | −0.9297 |
| Sample 26 | −0.6968 | −1.4366 | −1.3156 | −1.6465 | 0.2399 | 0.3046 |
| Sample 27 | 0.1171 | −0.6680 | 2.3503 | −0.2225 | 0.7768 | 0.3307 |
| Combined Clustering | The Stage at Which Clustering First Appears | |||||
|---|---|---|---|---|---|---|
| Stage | Cluster 1 | Cluster 2 | Coefficient | Cluster 1 | Cluster 2 | Next Stage |
| 1 | 1 | 23 | 22.000 | 0 | 0 | 8 |
| 2 | 3 | 21 | 22.000 | 0 | 0 | 6 |
| 3 | 14 | 24 | 24.000 | 0 | 0 | 5 |
| 4 | 6 | 18 | 39.000 | 0 | 0 | 7 |
| 5 | 9 | 14 | 48.000 | 0 | 3 | 11 |
| ⁝ | ⁝ | ⁝ | ⁝ | ⁝ | ⁝ | ⁝ |
| 22 | 2 | 12 | 1697.889 | 21 | 12 | 23 |
| 23 | 1 | 2 | 1881.583 | 8 | 22 | 24 |
| 24 | 1 | 6 | 2028.111 | 23 | 7 | 25 |
| 25 | 1 | 3 | 2389.333 | 24 | 14 | 26 |
| 26 | 1 | 9 | 2749.045 | 25 | 13 | 0 |
| Clustering Members | |||||||
|---|---|---|---|---|---|---|---|
| Serial Number | Sample Name | Category Number | Distance | Serial Number | Sample Name | Category Number | Distance |
| 1 | Sample 1 | 1 | 3.606 | 15 | Sample 15 | 5 | 4.272 |
| 2 | Sample 2 | 2 | 0.000 | 16 | Sample 16 | 7 | 0.000 |
| 3 | Sample 3 | 3 | 3.536 | 17 | Sample 17 | 12 | 5.831 |
| 4 | Sample 4 | 4 | 0.000 | 18 | Sample 18 | 6 | 4.447 |
| 5 | Sample 5 | 3 | 6.042 | 19 | Sample 19 | 12 | 4.320 |
| 6 | Sample 6 | 6 | 3.180 | 20 | Sample 20 | 9 | 6.384 |
| 7 | Sample 7 | 3 | 7.211 | 21 | Sample 21 | 3 | 3.317 |
| 8 | Sample 8 | 8 | 0.000 | 22 | Sample 22 | 5 | 4.272 |
| 9 | Sample 9 | 9 | 5.913 | 23 | Sample 23 | 1 | 3.109 |
| 10 | Sample 10 | 10 | 0.000 | 24 | Sample 24 | 9 | 4.045 |
| 11 | Sample 11 | 11 | 0.000 | 25 | Sample 25 | 13 | 0.000 |
| 12 | Sample 12 | 12 | 5.228 | 26 | Sample 26 | 1 | 4.830 |
| 13 | Sample 13 | 9 | 6.954 | 27 | Sample 27 | 6 | 4.558 |
| 14 | Sample 14 | 9 | 4.094 | ||||
| Representative Vocabulary Screening Summary | |||||
|---|---|---|---|---|---|
| Sturdy | Steady | Luxurious | High end | Atmospheric | Proper |
| Economic | Ostentatious | Bulky | Domineering | Aggressive | Rounded |
| Traditional | Retro | Alternative | Innovative | Square | Robust |
| Minimalist | Popular | Plain | Resolute | Dull | Dynamic |
| Pleasing | Complex | Technological | Futuristic | Wild | Powerful |
| Stylish | Practical | Personalized | Dazzling | Enthusiastic | Unordered |
| Impactful | Friendly | Streamlined | Coordinated | Rough | Mature |
| Low-end | Meticulous | Monotonous | Grim | Industrial | Compact |
| Handsome | Graceful | Exaggerated | Natural | Elegant | Lightweight |
| Mighty | Comfortable | Ugly | Rigorous | Sharp | Uncomfortable |
| Excellence | Interesting | Soft | Heavy | Fragile | Dignified |
| Symmetrical | Bionic | Diverse | Classic | ||
| Emotional Imagery Adjective Pairs Summary | |||
|---|---|---|---|
| Strong—Fragile | Luxurious—Austere | High End—Low End | Interesting—Dull |
| Wide—Compact | Lightweight—Bulky | Minimalist—Complex | Rigorous—Casual |
| Sharp—Sluggish | Domineering—Introverted | Diverse—Monotonous | Rounded—Angled |
| Lively—Subdued | Streamlined—Square | Fashionable—Classic | Personalized—Popular |
| Resolute—Soft | Exceptional—Ordinary | Exaggerated—Real | Beautiful—Ugly |
| Fine—Rough | Harmonized—Contradictory | Affectionate—Distant | Spiritual—Clumsy |
| Mature—Young | Technological—Backward | Passionate—Cold | Mighty—Feminine |
| Wild—Elegant | Symmetrical—Asymmetrical | Innovative—Retro | Natural—Raw |
| Elegant—Tacky | Regular—Disorderly | Flamboyant—Subtle | Practical—Decorative |
| Rigid—Flexible | Atmospheric—Compact | Luxury—Economic | Powerful—Powerless |
| Thick—Bony | Comfortable—Uncomfortable | Futuristic—Obsolete | Impactful—Usual |
| Sporty—Stable | |||
| Summary Table of Word Pair Filtering Results | |||
|---|---|---|---|
| Lightweight—Bulky | Sporty—Stable | Streamlined—Square | Diverse—Monotonous |
| Rounded—Angled | Resolute—Soft | Minimalist—Complex | Domineering—Introverted |
| Innovative—Retro | Wild—Elegant | Spiritual—Clumsy | Personalized—Popular |
| Domineering—Introverted | Sporty—Stable | Streamlined—Square | ··· | Diverse—Monotonous | Spiritual—Clumsy | Personalized—Popular | |
|---|---|---|---|---|---|---|---|
| Domineering—Introverted | 4.000 | 1.360 | 1.507 | ··· | 1.587 | 1.440 | 1.447 |
| Sporty—Stable | 1.360 | 4.000 | 1.480 | ··· | 1.240 | 2.493 | 1.547 |
| Streamlined—Square | 1.507 | 1.480 | 4.000 | ··· | 1.533 | 1.547 | 1.493 |
| ⁝ | ⁝ | ⁝ | ⁝ | ⁝ | ⁝ | ⁝ | |
| Diverse—Monotonous | 1.587 | 1.240 | 1.533 | ··· | 4.000 | 1.467 | 1.440 |
| Spiritual—Clumsy | 1.440 | 2.493 | 1.547 | ··· | 1.467 | 4.000 | 1.380 |
| Personalized—Popular | 1.547 | 1.347 | 1.293 | ··· | 1.440 | 1.680 | 4.000 |
| The Rotated Component Matrix | ||||
|---|---|---|---|---|
| 1 | 2 | 3 | 4 | |
| Domineering—Introverted | 0.855 | |||
| Wild—Elegant | 0.849 | |||
| Resolute—Soft | 0.836 | |||
| Sporty—Stable | 0.832 | |||
| Spiritual—Clumsy | 0.830 | |||
| Lightweight—Bulky | 0.796 | |||
| Innovative—Retro | ||||
| Rounded—Angled | 0.906 | |||
| Streamlined—Square | 0.887 | |||
| Minimalist—Complex | 0.875 | |||
| Diverse—Monotonous | 0.850 | |||
| Personalized—Popular | ||||
| Domineering—Introverted | Sporty—Stable | Rounded—Angled | Minimalist—Complex | Innovative—Retro | |
|---|---|---|---|---|---|
| Sample 2 | −0.722 | −0.313 | −0.264 | 0.167 | −1.403 |
| Sample 4 | −0.438 | −0.486 | −0.417 | −0.208 | −0.472 |
| Sample 6 | −0.063 | −0.633 | −0.125 | −0.563 | −0.333 |
| Sample 8 | −0.271 | −0.596 | −0.567 | −0.396 | 0.042 |
| Sample 10 | −0.800 | −0.167 | −0.292 | 0.021 | −0.542 |
| Sample 11 | −0.542 | 0.979 | −0.563 | −0.944 | −0.104 |
| Sample 15 | −0.354 | −0.292 | −0.625 | −1.236 | 0.000 |
| Sample 16 | −0.542 | −0.542 | −0.631 | −0.417 | −0.489 |
| Sample 19 | −0.208 | −0.104 | −0.604 | −1.297 | 0.271 |
| Sample 21 | −1.583 | −0.292 | 0.875 | 1.125 | −0.521 |
| Sample 23 | −0.479 | −0.625 | −0.922 | −0.646 | −0.354 |
| Sample 24 | −0.896 | −0.646 | −0.271 | −0.813 | −0.979 |
| Sample 25 | −0.646 | −0.750 | −0.438 | −0.021 | −0.417 |
| Dataset Image Patterns | Imagery Name | Dataset Sample Size | Optimal Number of Iterations | Generated Image Availability |
|---|---|---|---|---|
| Grayscale mode | Domineering | 672 | 19,000 | 82% |
| Sporty | 990 | 12,000 | 77% | |
| Innovative | 654 | 15,000 | 73% | |
| Minimalist | 786 | 6000 | 94% | |
| Rounded | 486 | 7000 | 87% | |
| Line drawing mode | Domineering | 672 | 17,000 | 92% |
| Sporty | 990 | 9000 | 84% | |
| Innovative | 654 | 17,000 | 90% | |
| Minimalist | 786 | 13,000 | 90% | |
| Rounded | 486 | 10,000 | 91% | |
| Color mode | Domineering | 672 | 9000 | 83% |
| Sporty | 990 | 10,000 | 86% | |
| Innovative | 654 | 16,000 | 85% | |
| Minimalist | 786 | 16,000 | 92% | |
| Rounded | 486 | 70,00 | 87% |
| Domineering | Sporty | Innovative | Minimalist | Rounded | Average Score | |
|---|---|---|---|---|---|---|
| Grayscale | 2 | 2 | 2 | 1 | 3 | 2 |
| Linework | 3 | 1 | 2 | 2 | 1 | 1.8 |
| Color | 1 | 3 | 3 | 3 | 2 | 2.4 |
Disclaimer/Publisher’s Note: The statements, opinions and data contained in all publications are solely those of the individual author(s) and contributor(s) and not of MDPI and/or the editor(s). MDPI and/or the editor(s) disclaim responsibility for any injury to people or property resulting from any ideas, methods, instructions or products referred to in the content. |
© 2023 by the authors. Licensee MDPI, Basel, Switzerland. This article is an open access article distributed under the terms and conditions of the Creative Commons Attribution (CC BY) license (https://creativecommons.org/licenses/by/4.0/).
Share and Cite
Li, Z.; Zheng, F.; Wang, S.; Zhao, Z. Research on the Intelligent Modeling Design of a Truck Front Face Driven by User Imagery. Appl. Sci. 2023, 13, 11438. https://doi.org/10.3390/app132011438
Li Z, Zheng F, Wang S, Zhao Z. Research on the Intelligent Modeling Design of a Truck Front Face Driven by User Imagery. Applied Sciences. 2023; 13(20):11438. https://doi.org/10.3390/app132011438
Chicago/Turabian StyleLi, Zhixian, Feng Zheng, Shihao Wang, and Zitong Zhao. 2023. "Research on the Intelligent Modeling Design of a Truck Front Face Driven by User Imagery" Applied Sciences 13, no. 20: 11438. https://doi.org/10.3390/app132011438
APA StyleLi, Z., Zheng, F., Wang, S., & Zhao, Z. (2023). Research on the Intelligent Modeling Design of a Truck Front Face Driven by User Imagery. Applied Sciences, 13(20), 11438. https://doi.org/10.3390/app132011438