1. Introduction
Water is essential for life on earth and is crucial for the human body. It is also involved in the solubilization of nutrients and the transport of oxygen to target cells and tissues. Adequate water intake is essential for maintaining an appropriate function of the human body, and it also contributes to regulating body temperature and digestion. The stage of dehydration could be assessed by determining the brain-derived neurotrophic factor (BDNF) that increases in such cases and reverts in normal conditions [
1].
Establishing water quality criteria is crucial for safeguarding public health, protecting ecosystems, and sustaining various water-related activities. These criteria are set up by standards and guidelines that define the acceptable levels of various physical, chemical, and biological parameters in water bodies. Therefore, lists of new substances for monitoring are considered at the European Commission level. The presence of hormone-disrupting chemicals is examined, starting this year [
2]. The latest regulation on water quality for human consumption developed by the European Parliament and the European Council is 2020/2184, and it includes several specific concepts. Thus, water intended for human consumption can be “any water, whether in its initial state or after treatment, destinated for drinking, cooking, food preparation or any other domestic purpose in both public and private spaces, regardless of its origin and whether it is supplied from a distribution network, a tank or bottled in bottles or containers, including spring water” or “any water used in any food business for the production, processing, preservation or marketing of products or substances intended for human consumption” [
3].
It is well known that deviation from drinking water parameters can be seen as a threat to public health, and as a possible cause of tumors and benign or pathogenic diseases [
4]. Depending on the local infrastructure, the drinking water parameters for public institutions such as schools and/or hospitals should be prioritized. Microbiological contaminants pose significant safety risks to children [
5] and patients. Various chemical or physical factors can also alter water quality. Several contaminating mechanisms exist, including residual chemicals from pipe cleaning, substances, and microorganism infiltration. Dawood et al. have developed an artificial neural network that can help authorities anticipate potential risks and act to limit or eliminate them [
6].
The local water company certifies that the water complies with current regulations. Under such conditions, possible alterations in the water transport system to the consumer may occur. The transfer network is generally old and suffers from age-related degradation processes [
4]. The specific infrastructure needs periodic replacements, depending on technical problems. In addition to the central water supplier, another source is represented by wells. The authorized personnel in the field must also determine their quality. Usually, landowners should be aware of their responsibilities for ensuring the safety and security of the water source. Unfortunately, a study has shown that they must pay more attention to this issue [
7]. Citizen surveys’ responses and laboratory reports on water quality are the main foundations for the rehabilitation of water infrastructure.
Another aspect of the drinking water supply that needs to be considered is the limitation of its natural resources. One possible solution is to reuse water after appropriate treatment. Such a solution must be based on public acceptance. A study in Nevada, USA, revealed different agreement levels for this possible approach. The main influencing factors were cultural and geographical [
8].
Citizens’ views on the importance of water in their daily lives were the first issue to be tracked in the survey. Its impact is often minimized. Various studies highlighted the importance of increasing people’s knowledge about the negative influence of insufficient water intake [
9]. One issue that needs to be clarified concerns the difference between daily consumption and water intake. Rodger et al. mentioned in their study the importance of forming healthy habits regarding water consumption from the early years of life [
10].
The present investigation focused on three main directions. The first (1) was to determine the perception of the citizens of Pecica on the quality, supply, and access to drinking water. The second (2) concerns their opinion on wastewater treatment and disposal. The third (3) focuses on the benefits of revitalizing the water distribution system at the individual and local levels. Safe and controlled water sources are mandatory to ensure the population’s health [
11]. In this context, authorities can act in two directions: to ensure the quality of the source and to help inform residents about the influence of water ingestion parameters on their well-being. Every decision they take should be based on a well-documented feasibility plan that considers all aspects that could affect the living conditions of citizens. All procedures implemented are meant to improve hygiene and safety conditions [
12]. Industry-related areas are considered a possible source of contamination of water resources and, therefore, a threat to public health [
13].
This research is supported by the forthcoming implementation of one of the European Union’s Operational Infrastructure Plans (POIM). As a concrete application of the program, it is planned to improve/extend the current water and sewerage system in the city of Pecica and the villages of Sederhat and Turnu. The latter two need to be connected to the centralized system.
This study was mainly addressed to citizens in the region aged between 18 and 65 due to the importance of water quality and quantity in maintaining their health in future years. The idea was based on the results of various investigations that highlighted the importance of balanced hydration for the adult body [
14,
15,
16]. The chosen region is probably typical of a zone with a high prevalence of micro-farms. The manure that results from their activity was/is not usually adequately deposited. Such a situation raises environmental problems and could affect the population’s health by infiltrating nitrate/nitrites in the groundwater. The extension of the tap centralized water system is a feasible solution to resolve the aforementioned situation.
Particular attention should always be paid to drinking water, whether bottled or tap. Such water can be a vector for various microorganisms [
17,
18] and/or health-harming chemical compounds (antioxidants, plasticizers, etc.) [
19,
20] and nanoparticles [
21,
22].
2. Materials and Methods
Between 2020 and 2021, 192 interviews were conducted online via media apps and social networks. These reflect the population’s opinions.
Table 1 shows the percentage distribution of respondents considering their residence.
The pandemic situation impacted the number of responses. Because it was conducted online, the survey was influenced by people’s ability to interact with information devices. The expected values were ±5% error, 95% probability, and maximum dispersion.
The average age of the respondents was 37.27 years, ranging from 18 to 65 years. The majority were women, 102 (53.1%).
The questions covered water quality, distribution, and sewerage systems. The research was based on a statistical survey as an instrument. Accordingly, the information was analyzed and processed through the statistical program IBM SPSS Statistic software, Version 20. Different assessments and interrelations were made.
The survey form had different questions: factual, scaled, semi-open, or closed. The statistical calculation considered the selection interval (192) as a reference to the region’s total population (14,254). The statistical stage was 74. Thus, of the 74 inhabitants, 1 participated in the survey. Respondents worked individually after the purpose of the questionnaire was explained to them. They were enthusiastic about completing the survey, as the subject was of genuine interest in ensuring their health and well-being.
Pecica [
23] is a town in Arad County, in the Plain of Arad, on the right bank of the Mures River. It was declared a town in 2004, and in 2011, it had a population of 12,762. The administrative territory covers an area of 23,717 ha and administers the villages of Bodrogu Vechi, Turnu, and Sederhat. It lies in the Crișana region, crossed by the National Road (E68) and the A1 Timisoara-Arad-Nădlac motorway, which connects Romania to Hungary. Pecica is 20 km from Arad, 30 km from the Nădlac border crossing, and 14 km from the Turnu border crossing.
3. Results and Discussion
The questions in the survey were classified under five essential aspects that are discussed below.
3.1. Water Quality Importance
The extraction source primarily influences the quality of drinking water. In the Pecica area, the possibility of shale gas exploitation has been raised. The situation could affect drinking water parameters and mainly the health of young people [
24]. In their research, L. Watson et al. emphasized hydration’s influence on children’s harmonious development [
25]. These issues highlight the importance of water quality awareness. Apart from groundwater, contamination of drinking water can also occur in the distribution system due to various sanitation by-products [
26]. Pollution can be caused by human and biogenic activity [
27].
Considering the aforementioned aspects, a critical purpose of the survey was to analyze the importance of water in the respondents’ lives. Most respondents, 92.2%, perceived it as having an important role (
Supplementary Materials Figure S1), and, therefore, the next step was to evaluate their perception of the quality of water.
Considering the citizens’ residences, only a slight difference can be noticed between their opinions (
Table 2). A high majority of the respondents are concerned about water properties. Evidence of the consumer’s preoccupation with the quality of water used in the fields is also underlined in different studies. Savchenko et al. highlight the interest in the properties of water used for irrigation [
28]. Such a topic is also relevant in this case since the Pecica zone is agrarian. Ensuring optimal parameters for water resources used in agriculture can easily be achieved using a controlled source. It was interesting to notice that the differences between the percentages obtained from the male and female respondents did not register high variations (4.1%) for the aspects treated in this section.
3.2. Water Utilization
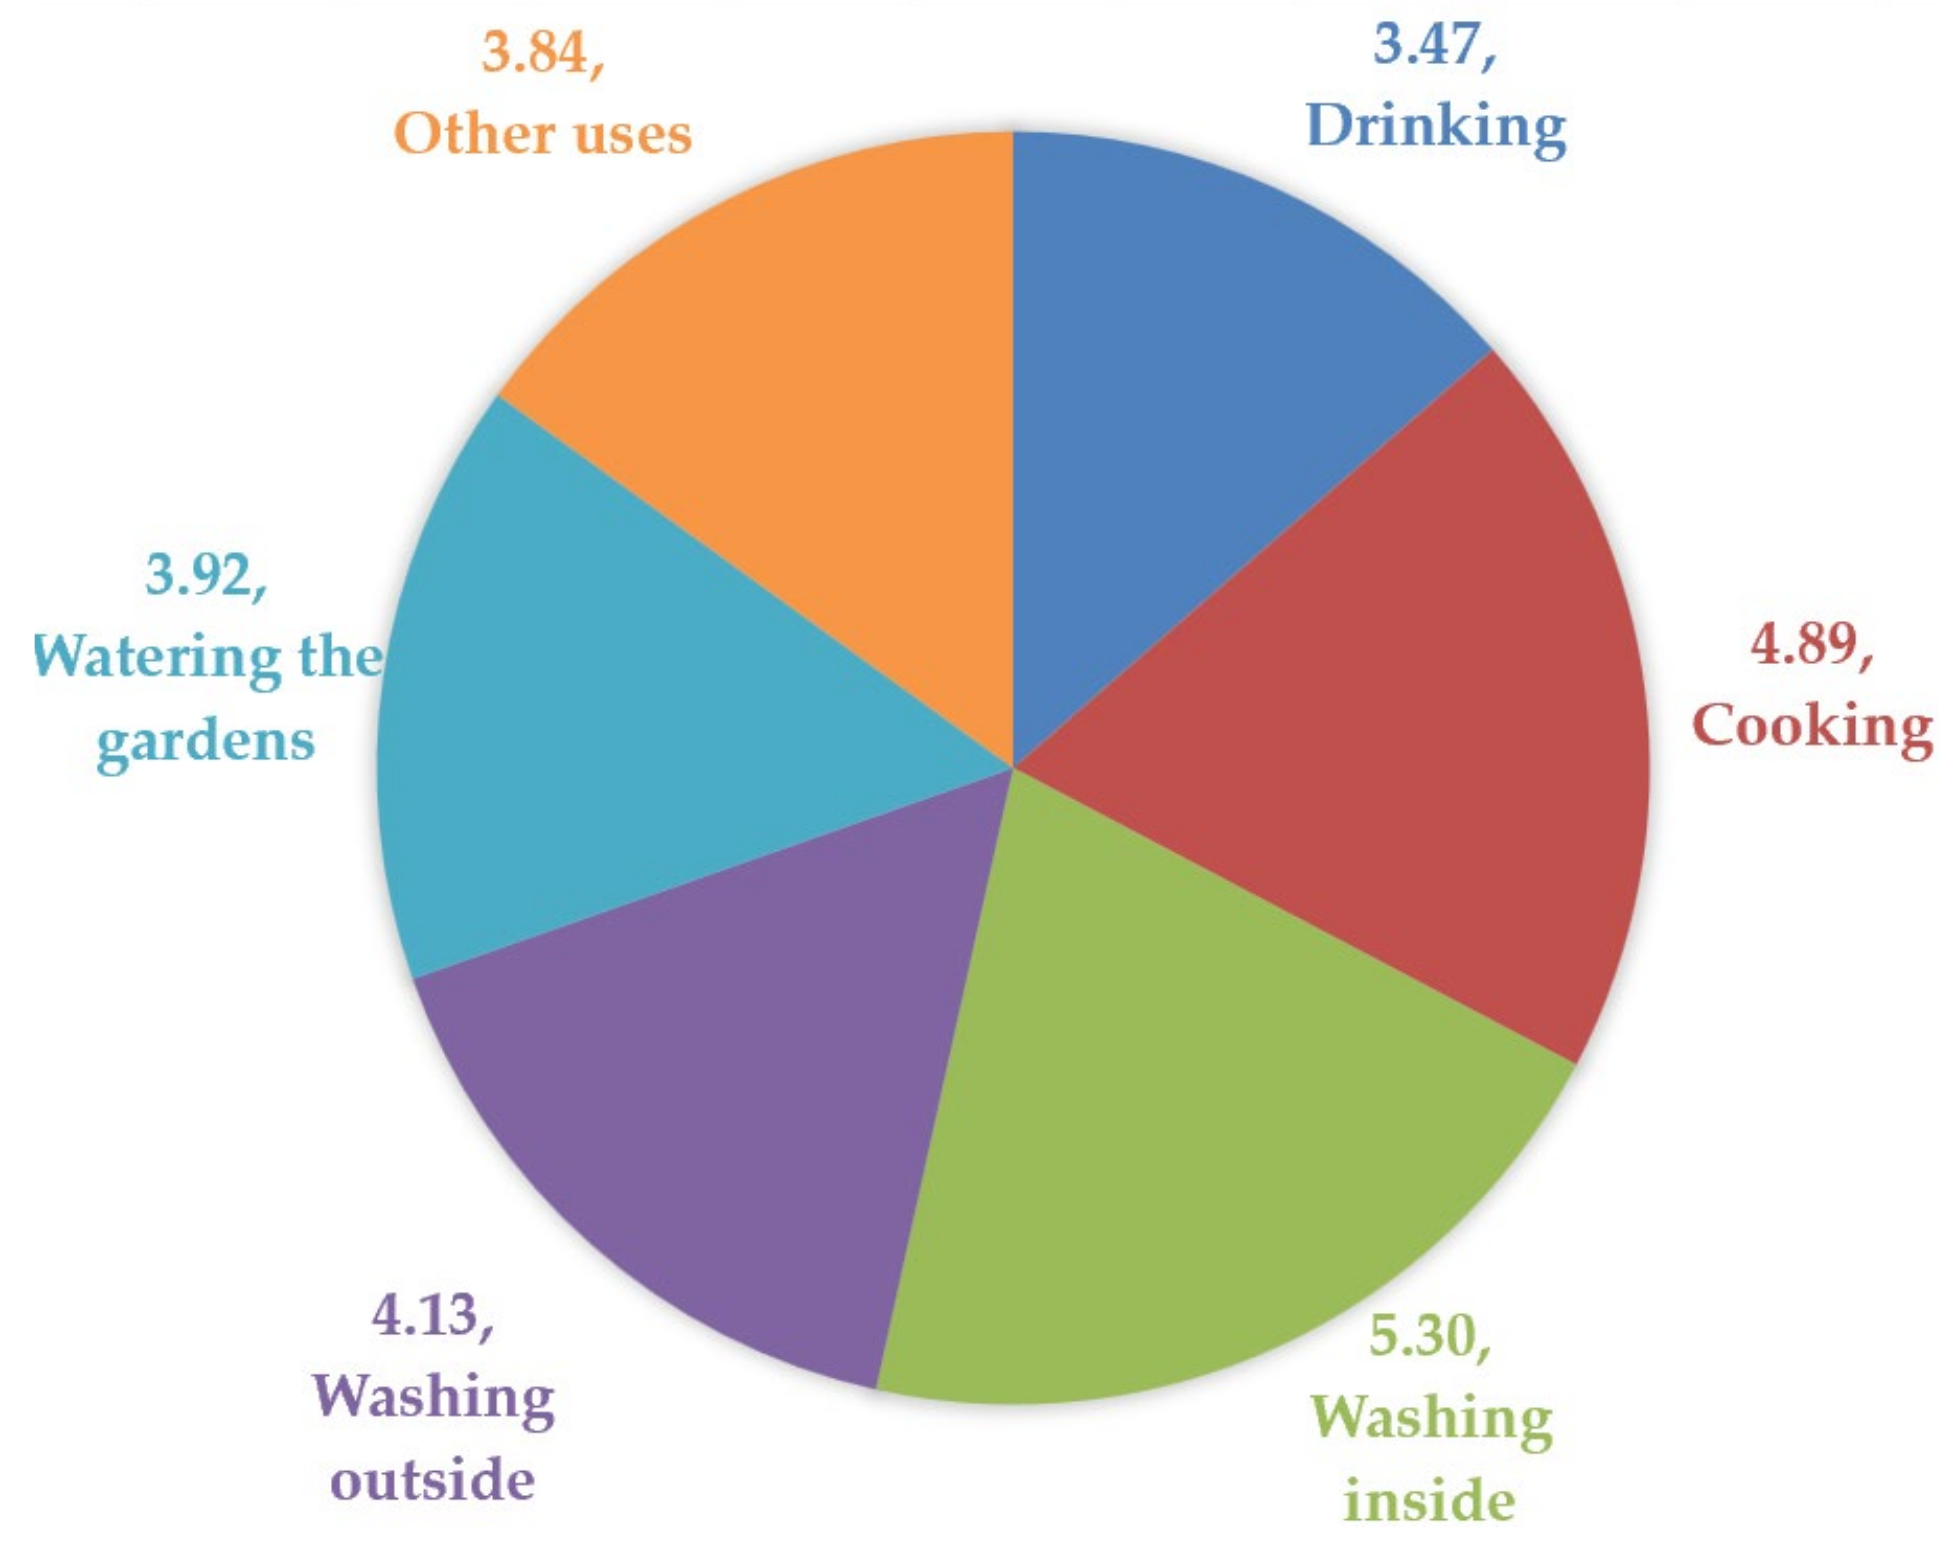
In terms of household water use, it is mainly used for washing inside, e.g., clothes (m = 5.30), cooking (m = 4.89), washing outside, e.g., car, yard (m = 4.13), garden watering (m = 3.92), other uses (m = 3.84), and finally drinking (m = 3.47) (
Figure 1). It has to be pointed out that a significant difference between the answers of male and female respondents was noticed in the case of the use of water for indoor activities, where the women’s answers were 17.6% higher than those of men, a fact that can be attributed to the women’s household chores.
Observing the data from
Figure 1, the principal directions for water utilization are drinking and cooking. Such a situation imposes specific qualitative standards. Therefore, in the region included in the present research, the tap water system extension will bring incommensurable consumer benefits, given that different chemical or microbial contaminants could be found in traditional sources, such as wells. A recent research study underlines the relevance of various actions undertaken by people in their own homes to ensure water safety [
29]. So, access to a centralized framework could be a viable alternative.
A quantitative interpretation was conducted for the most representative number of respondents, Pecica. Differences in water use frequency were statistically significant, with Chi-square coefficients ranging from 13.87 to 212.53 at thresholds less than 0.05 (
Table 3). Therefore, it can be stated that the results are significant for the population of Pecica.
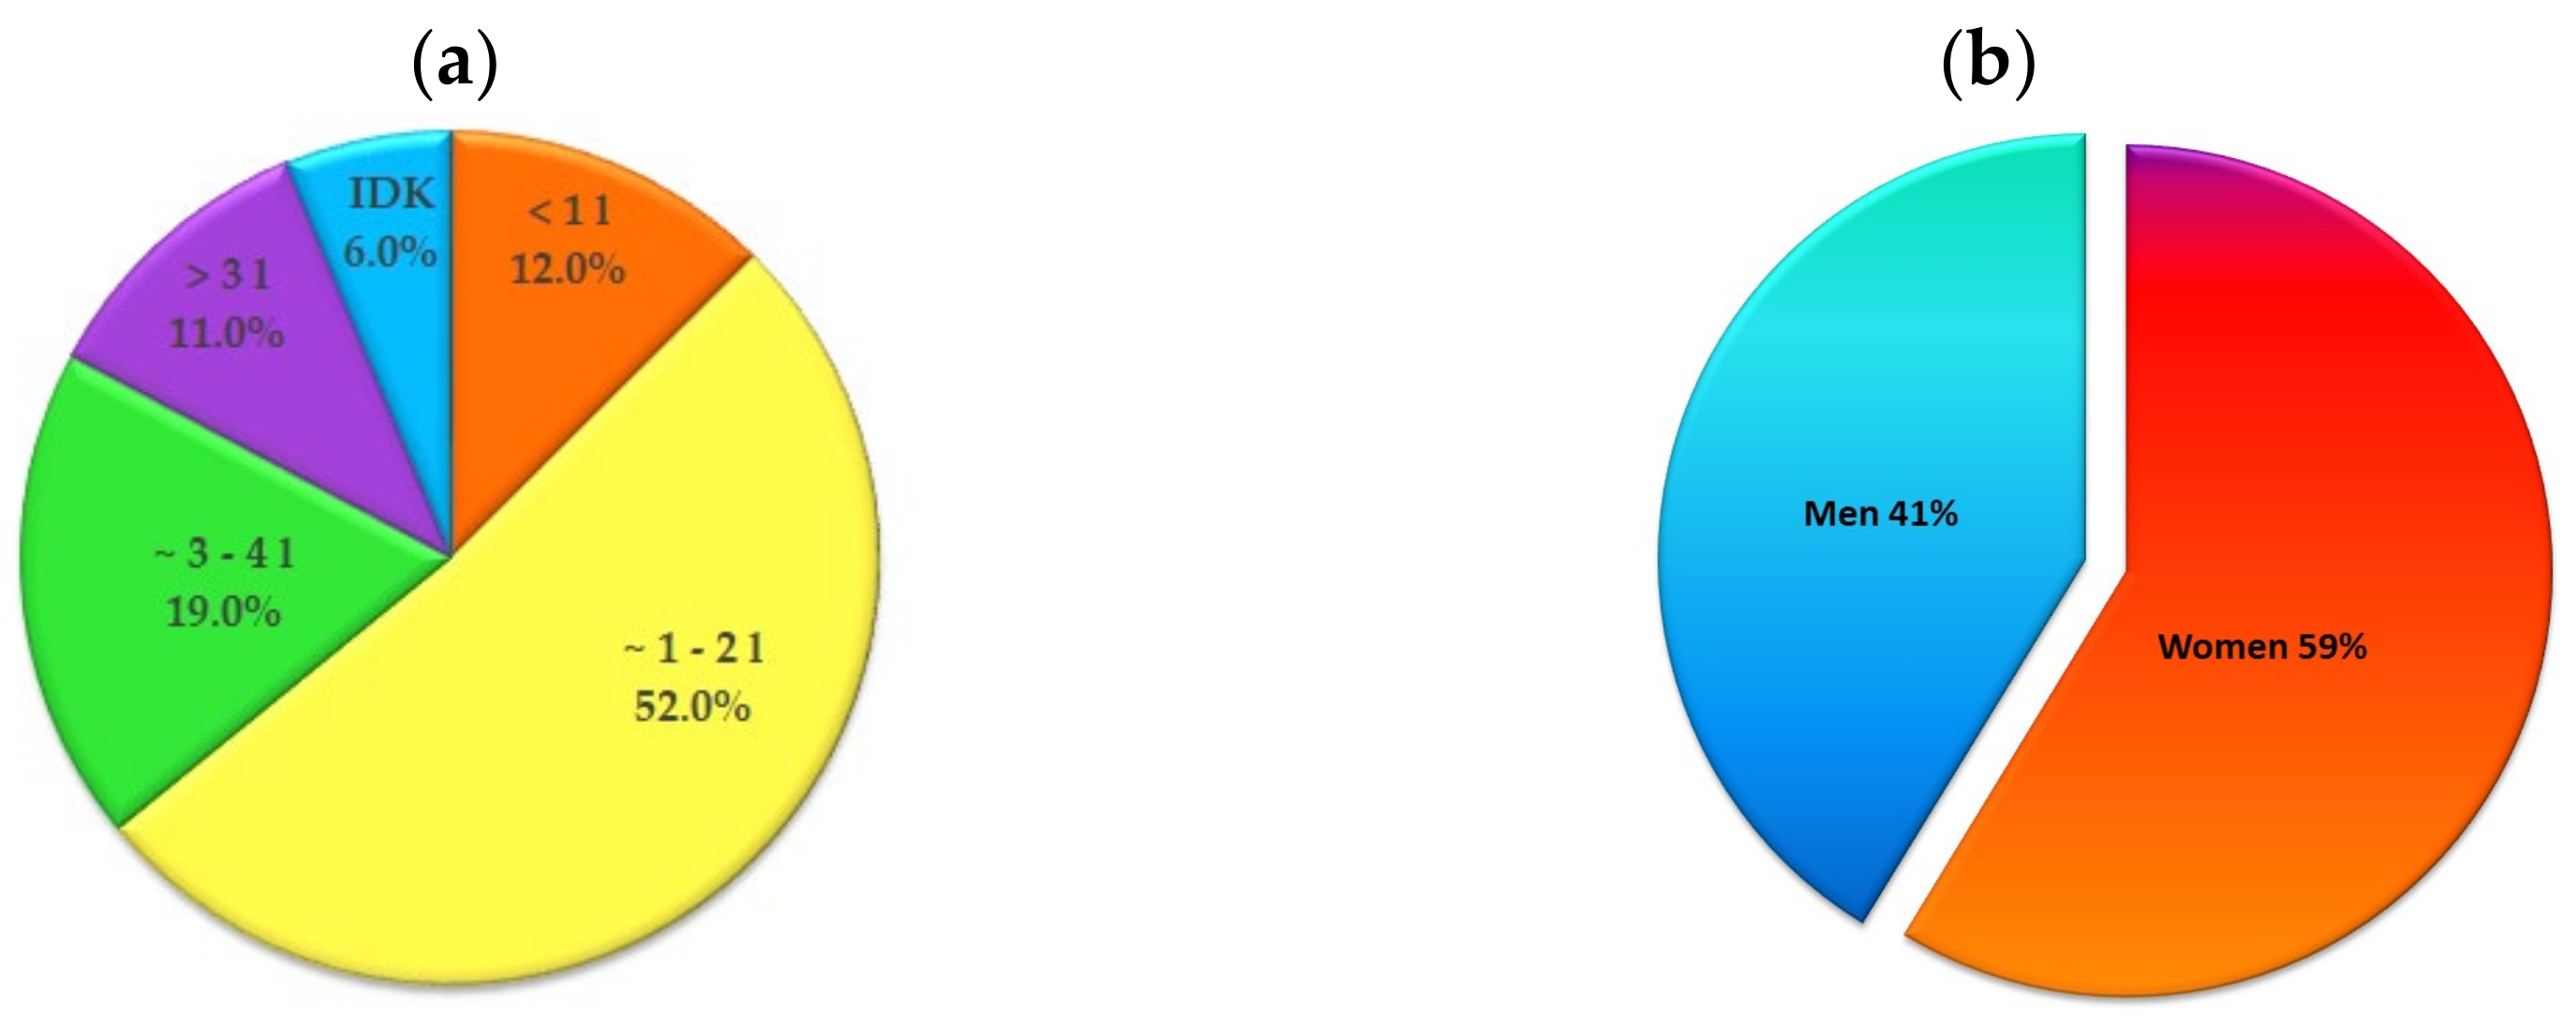
As mentioned above, daily water intake is essential. Respondents were asked about the amount of water consumed regularly. About half of them drink between 1 and 2 L (
Figure 2). According to the US National Academies of Sciences, Engineering, and Medicine, the total recommended amount of fluid intake is 3.7 L for men and 2.7 L for women [
30]. At the same time, the European Food and Safety Authority indicates a consumption of 2.0 L/day for females and 2.5 L/day for males [
31]. Correlating the respondents’ answers with the recommendations of these institutions, we can say that a small percentage of them do not have an optimum level of daily water intake.
It can also be seen from
Figure 2 that 6% of people could not specify the total amount of daily ingested fluids. Most respondents fell below the limits recommended by nutritionists because they referred only to the consumed water, not to all liquids. As Sawka et al. mentioned in their study, humans can achieve the average water balance between resources and consumption for a specific time interval by adapting particular mechanisms to the involved activity [
32].
The survey questions were designed on the premise that daily water intake is not influenced by gender or region. The initial hypothesis was confirmed using the independent
t-test coefficients at thresholds greater than 0.05 (
Table 4). Therefore, water consumption is not significantly different between men and women in Pecica and Turnu.
3.3. Drinking Water Sources and Characteristics
Another set of questions was related to residents’ basic knowledge of the properties of drinking water. In Romania, specific parameters are regulated by Law 119/2014 [
33]. Thus, to the question” What are the optimal pH values for drinking water?”, almost half of the participants (47.0%) responded that they do not know them. 33.0% of people answered correctly (pH 6.5–8.5) (
Supplementary Materials Figure S2).
Analyzing the subsequent answers, we can say that familiarity with scientific terms is decreasing. For example, to the question “What do you think is the maximum permissible level of dissolved solids in water to be drinkable?” 72% of the participants did not know the correct answer. Less than 10% (6%) answered correctly (maximum permissible value 500 mg/liter) (
Supplementary Materials Figure S3).
The level of respondents’ acquaintance with basic water quality parameters is related to the general knowledge generated through marketing campaigns. Most of the 12 respondents who answered correctly are university-educated. According to the obtained data, it could be seen that respondents’ knowledge was limited to pH values. When the specific domain was extended to the total dissolved solids parameter, which provides information on water purity, familiarity was limited.
The third question regarding the properties of drinking water referred to its smell: “What must water smell like to be good for drinking?” Most respondents (92%) considered that good-quality water has no smell (
Supplementary Figure S4).
Determining the population’s general level of knowledge regarding tap water properties was one of our subsequent research directions. This objective was motivated by the importance given at the European level to ensure a green perspective and a reliable management system. A recent publication underlines the need to improve the specific knowledge in the field for Local Authority employees in Ireland [
34]. Our findings, along with others, could help the authorities to implement and design the optimum actions to increase the awareness of information in the field in the case of each of the categories.
Correct information about bottled or tap water’s properties, advantages, and disadvantages is needed. Impartial communication about the potability characteristics of water is essential for consumer choices. Sensory aspects, such as taste, color, or smell, together with individual treatments applied at home (cooling and/or filtration), can correlate with the person’s preference for different types of water [
35]. Regardless of the type, water quality can be altered. Two additional important aspects determine the scale of any local tap water infrastructure. These are related to implementing safety regulations [
36] and cost improvement. Adhering to legal provisions ensures that quality parameters are maintained throughout the chain, from the treatment plant to the final consumer. Recent data have presented the possible health risks of tap and bottled water to consumers [
37].
Hu et al. highlight important issues regarding consumer hesitation in choosing tap water as their primary drinking water source and suggest the importance of local authorities in reassuring residents of its safe use [
38]. Unfortunately, the quality of tap water is considered to be lower than that of bottled water. This aspect may be true in some cases because quality changes may occur throughout the distribution system. Also, the importance of storage conditions has been proven in bottled water cases. Exposing bottled water to a temperature higher than 40 °C increases the amount of di-(2-ethylhexyl)phthalate in the product [
39]. In addition, light also contributes to the product’s deterioration by increasing its content of plastic particles [
18]. Other studies show that our research reflects consumers’ preference for bottled water (
Figure 3). A possible explanation is related to global warming [
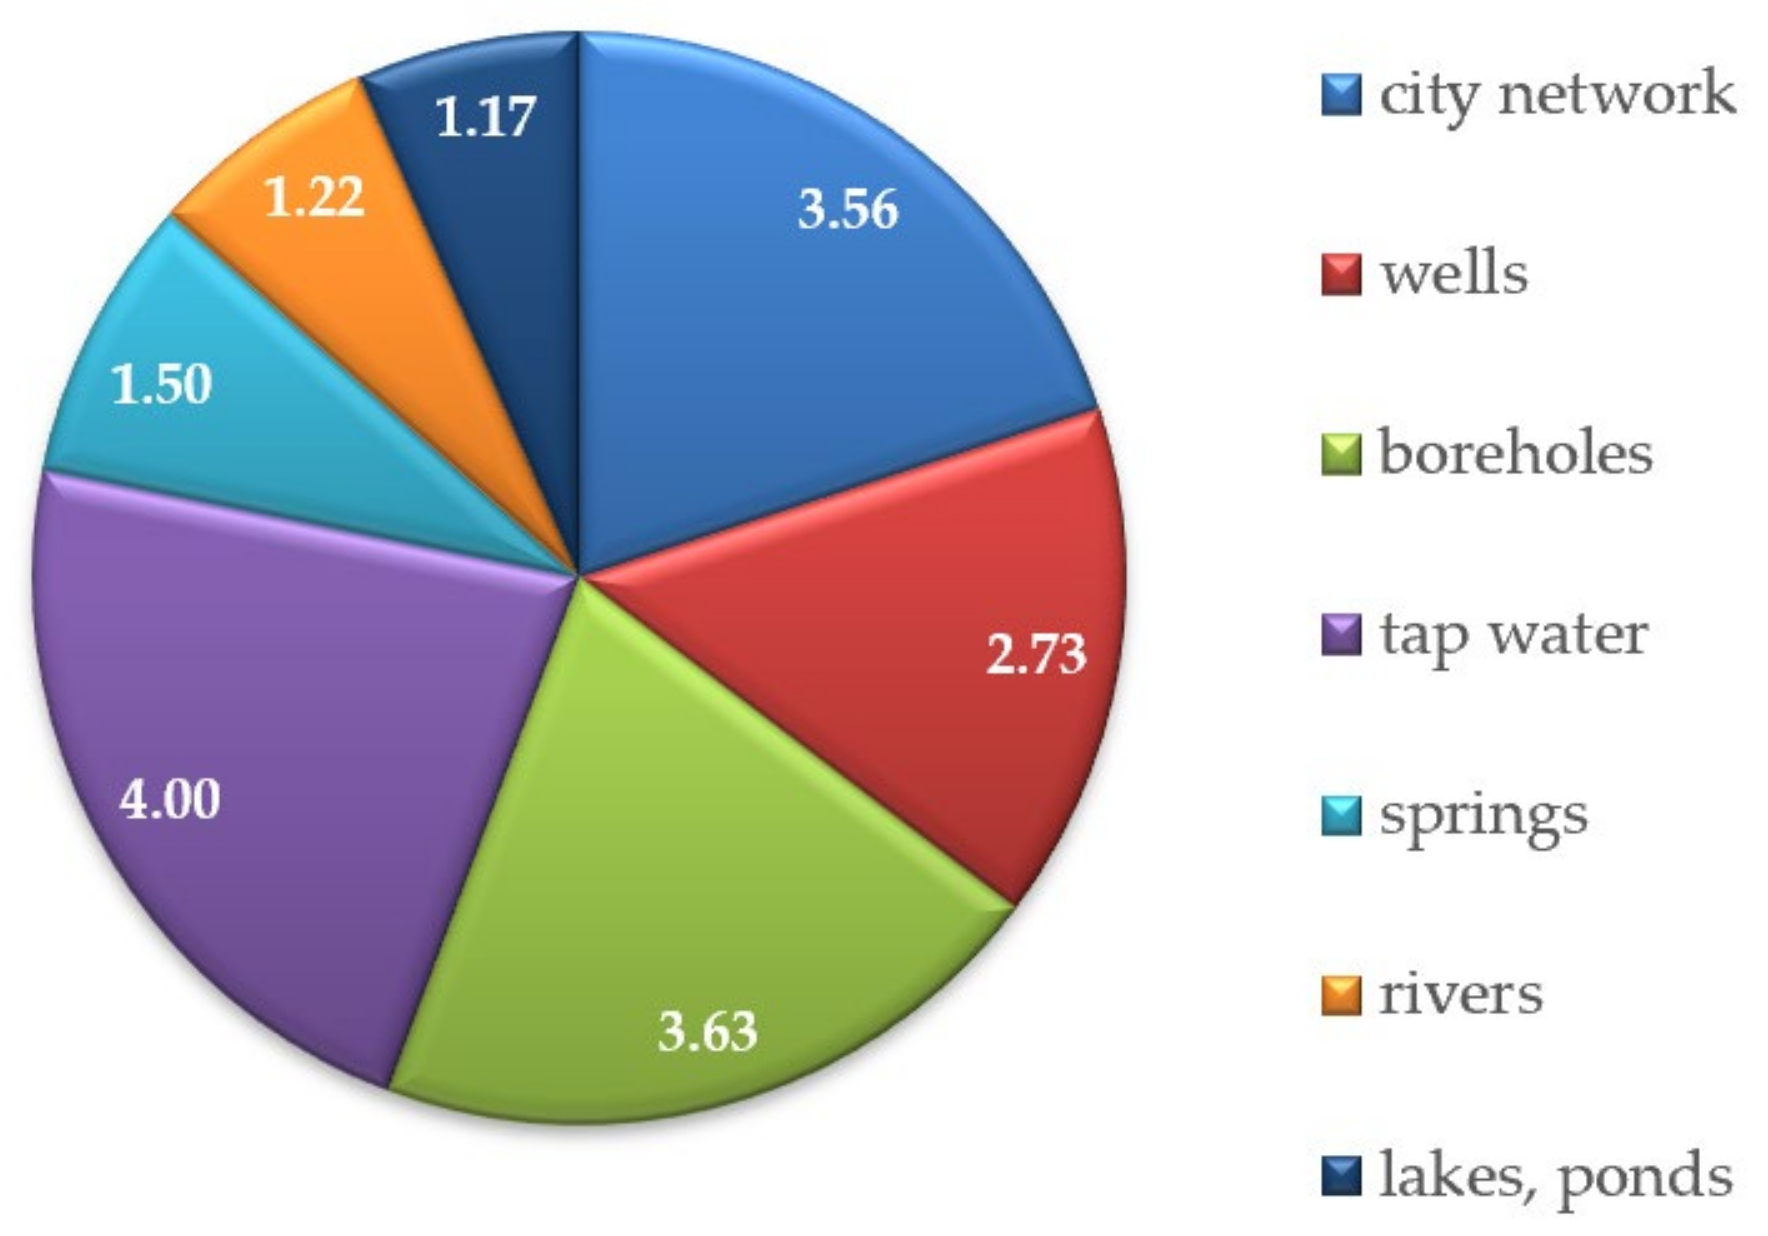
40]. The situation influences the amount of water required for daily hydration of the body and water resources. The present study also included people from rural areas who need a water supply for their current activity in agriculture. Bottled water is easier to handle and is only available in some situations. The primary sources of water necessary for household activities are presented in
Table 5.
When asked about the sensory parameters of the tap water supplied by the local company, about a third of those interviewed recommend its improvement by better filtration to decrease the amount of sand in the water. They also mentioned a request for the reduction and/or elimination of scale and other impurities by improving the conditions of the transport system.
3.4. Tap Water System
Another interesting point of the present investigation concerned the current situation of households regarding the connection of tap water and sewage to the local infrastructure. Almost 60% of respondents are now connected to the general distribution system (
Supplementary Figure S5). Fortunately, about half of them have accessed the system for over two years (
Supplementary Figure S6).
The local situation revealed by our investigation could be considered desirable since there are several places worldwide where the population is not connected to a centralized distribution system or the water quality is improper for human consumption. Ensuring access to the mentioned facilities could be considered a primary need. An important aspect that needs to be underlined is the dependency on natural resources and, in some situations, on the administrative organization [
41].
Consulting the local residents via simple surveys regarding community problems could benefit community consolidation. This approach is facilitated by modern communication, and leads to a better understanding of the population’s needs and expectations of the administration. At the same time, it allows the dissemination of results obtained by the local governance and of plans designed to improve the citizens’ life. Implementation of a digital vision could have a positive impact on the people’s expectations of the authorities [
42]. In our case, we tried to determine the population’s level of information regarding the administration’s intention to improve the facility’s framework.
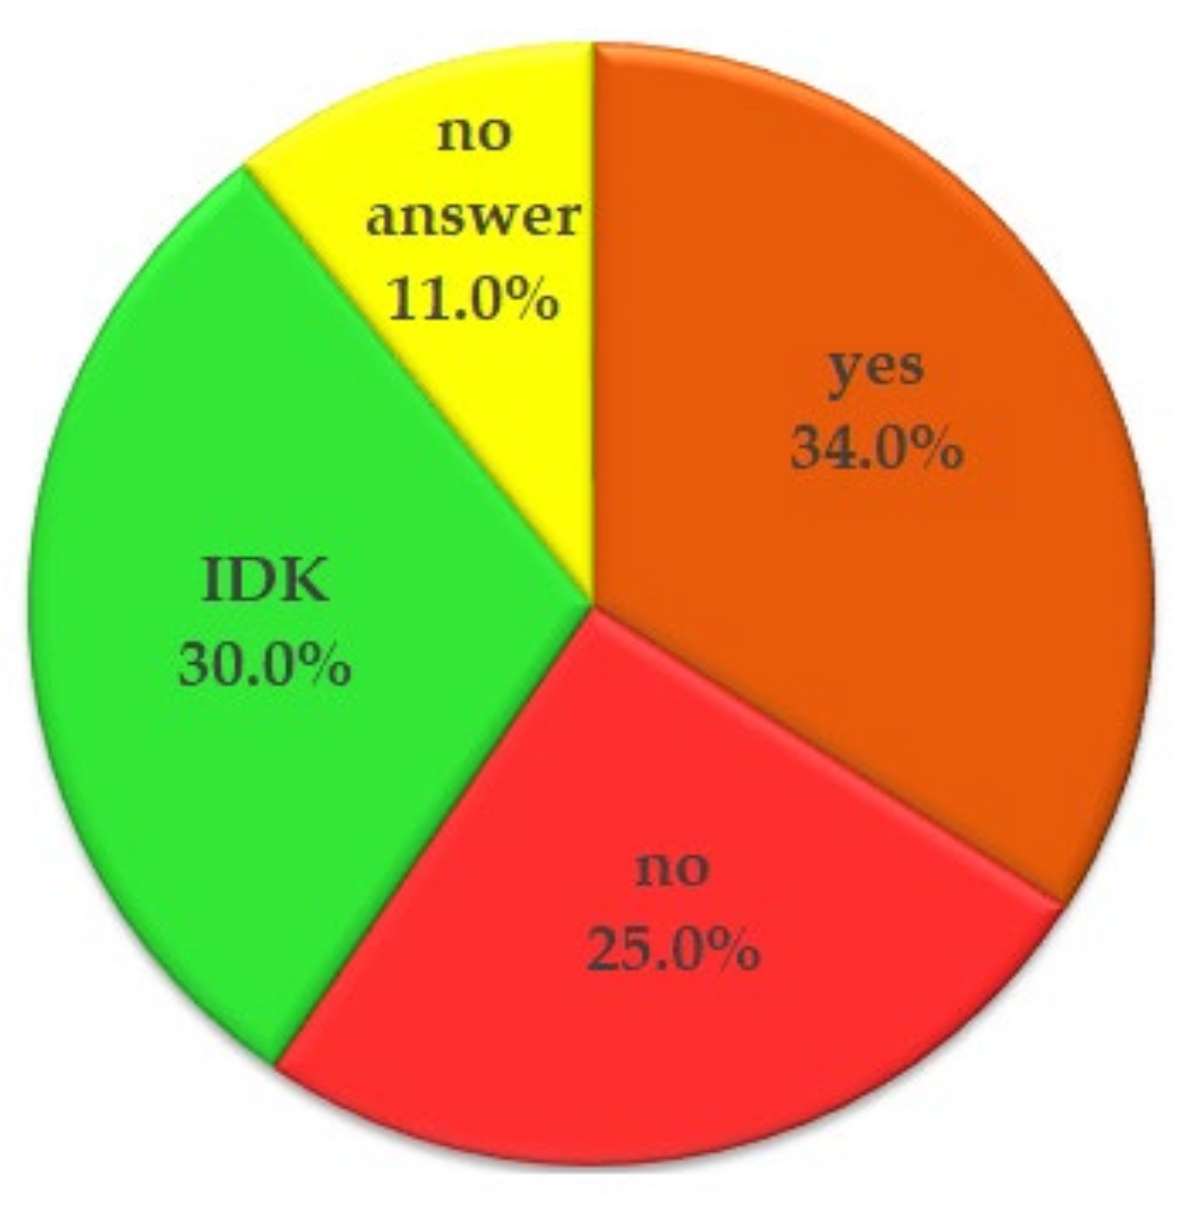
Respondents who do not have access to the local distribution system were asked about the possibility of being connected in the next period. The percentage distribution of responses was approximately equal between those who know about the expansion of the system (34.0%) and those who do not have such information (30.0%) (
Figure 4).
Correlated to the information presented above, we considered it worthwhile to determine the changing dynamics in water quantity used within households with its increasing accessibility. More than a third of the participants declared that aspects like water consumption, access, and drinking water supply have improved compared to previous years (
Table 6).
3.5. Sewage System
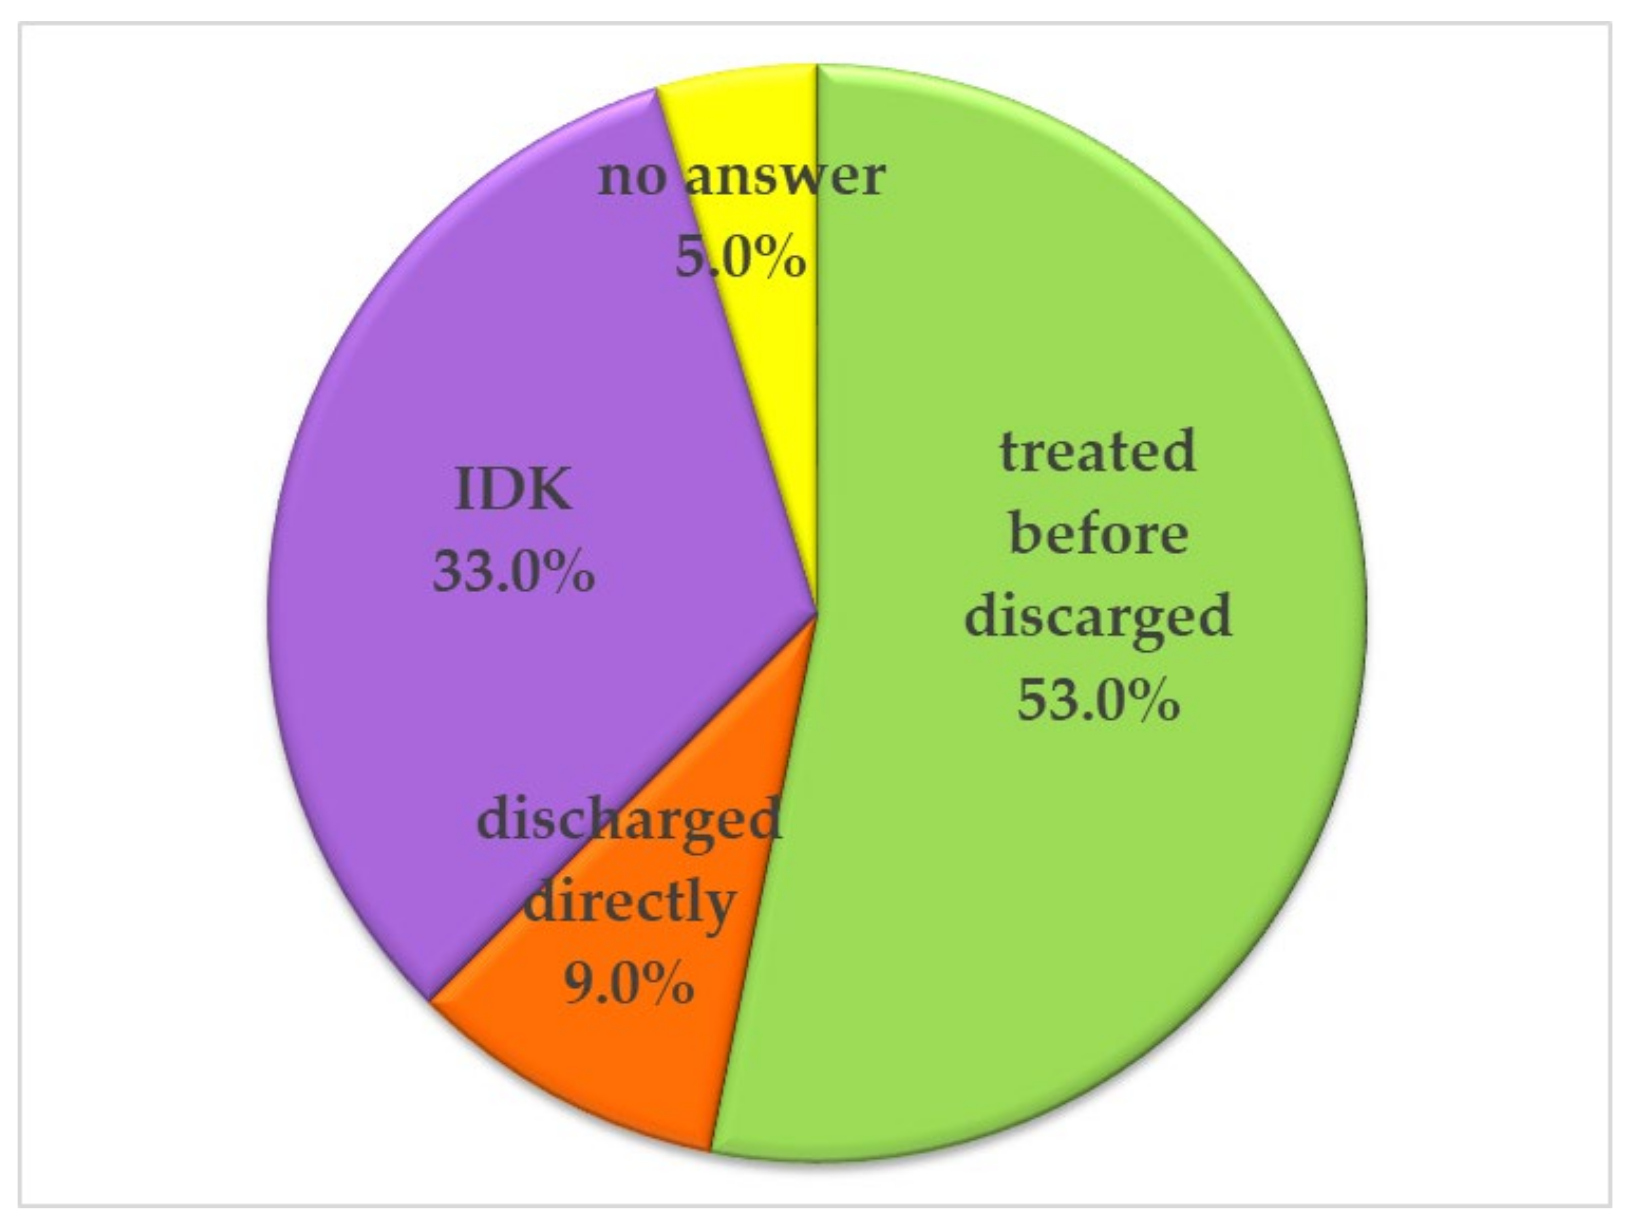
The survey was circularly conceptualized, starting from the perception of drinking water quality, moving on to its access, and ending with the information about wastewater. The first aspect was related to the respondents’ knowledge of the wastewater route through the sewage network. This last element is one of interest because of the growing environmental concerns. About half of the responses indicated a possible treatment before discharge to minimize ecological impact (
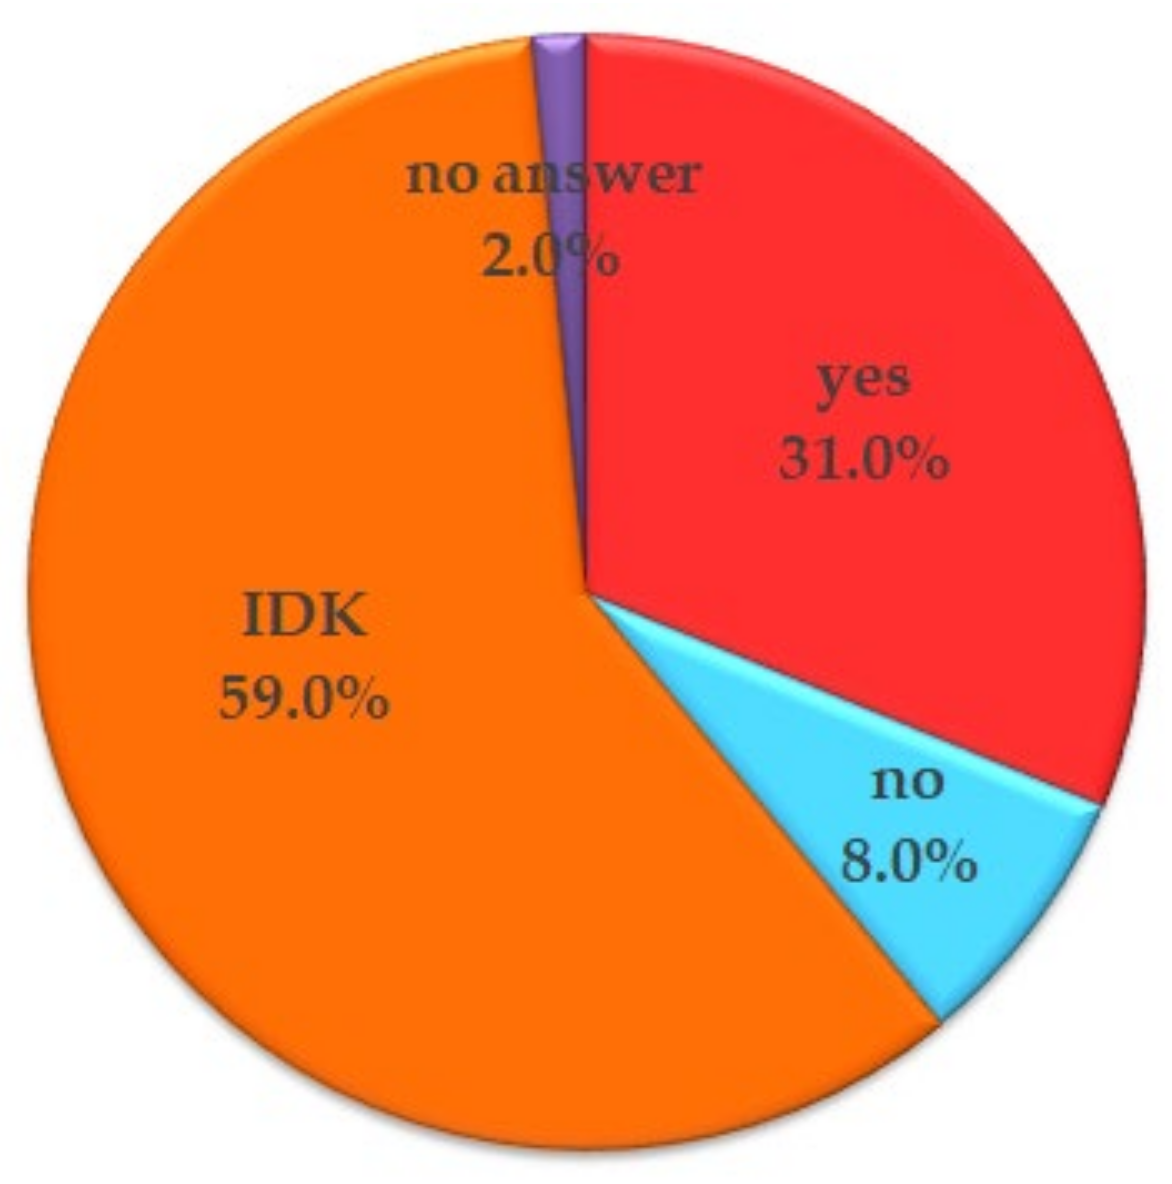
Figure 5). More than 50% of the responses showed that the level of acquaintance with wastewater legislation is still inadequate (
Figure 6).
When asked about the entity responsible for wastewater treatment, approximately 60% of respondents agreed that the polluter should pay for decontamination (
Table 7).
The results presented in
Table 8 show that only one fifth (20.3%) of the respondents have information about the improvement and/or expansion of the drinking water system in their city of residence in recent years. Almost the same distribution of results was observed when they were asked about the development of the wastewater collection and treatment system.
Knowing the source of each investment made for local development in every community is essential. That is why the respondents were asked about the origin of the invested rehabilitation funds. Almost 65% considered that the primary source is the tax paid by each consumer (
Figure 7).
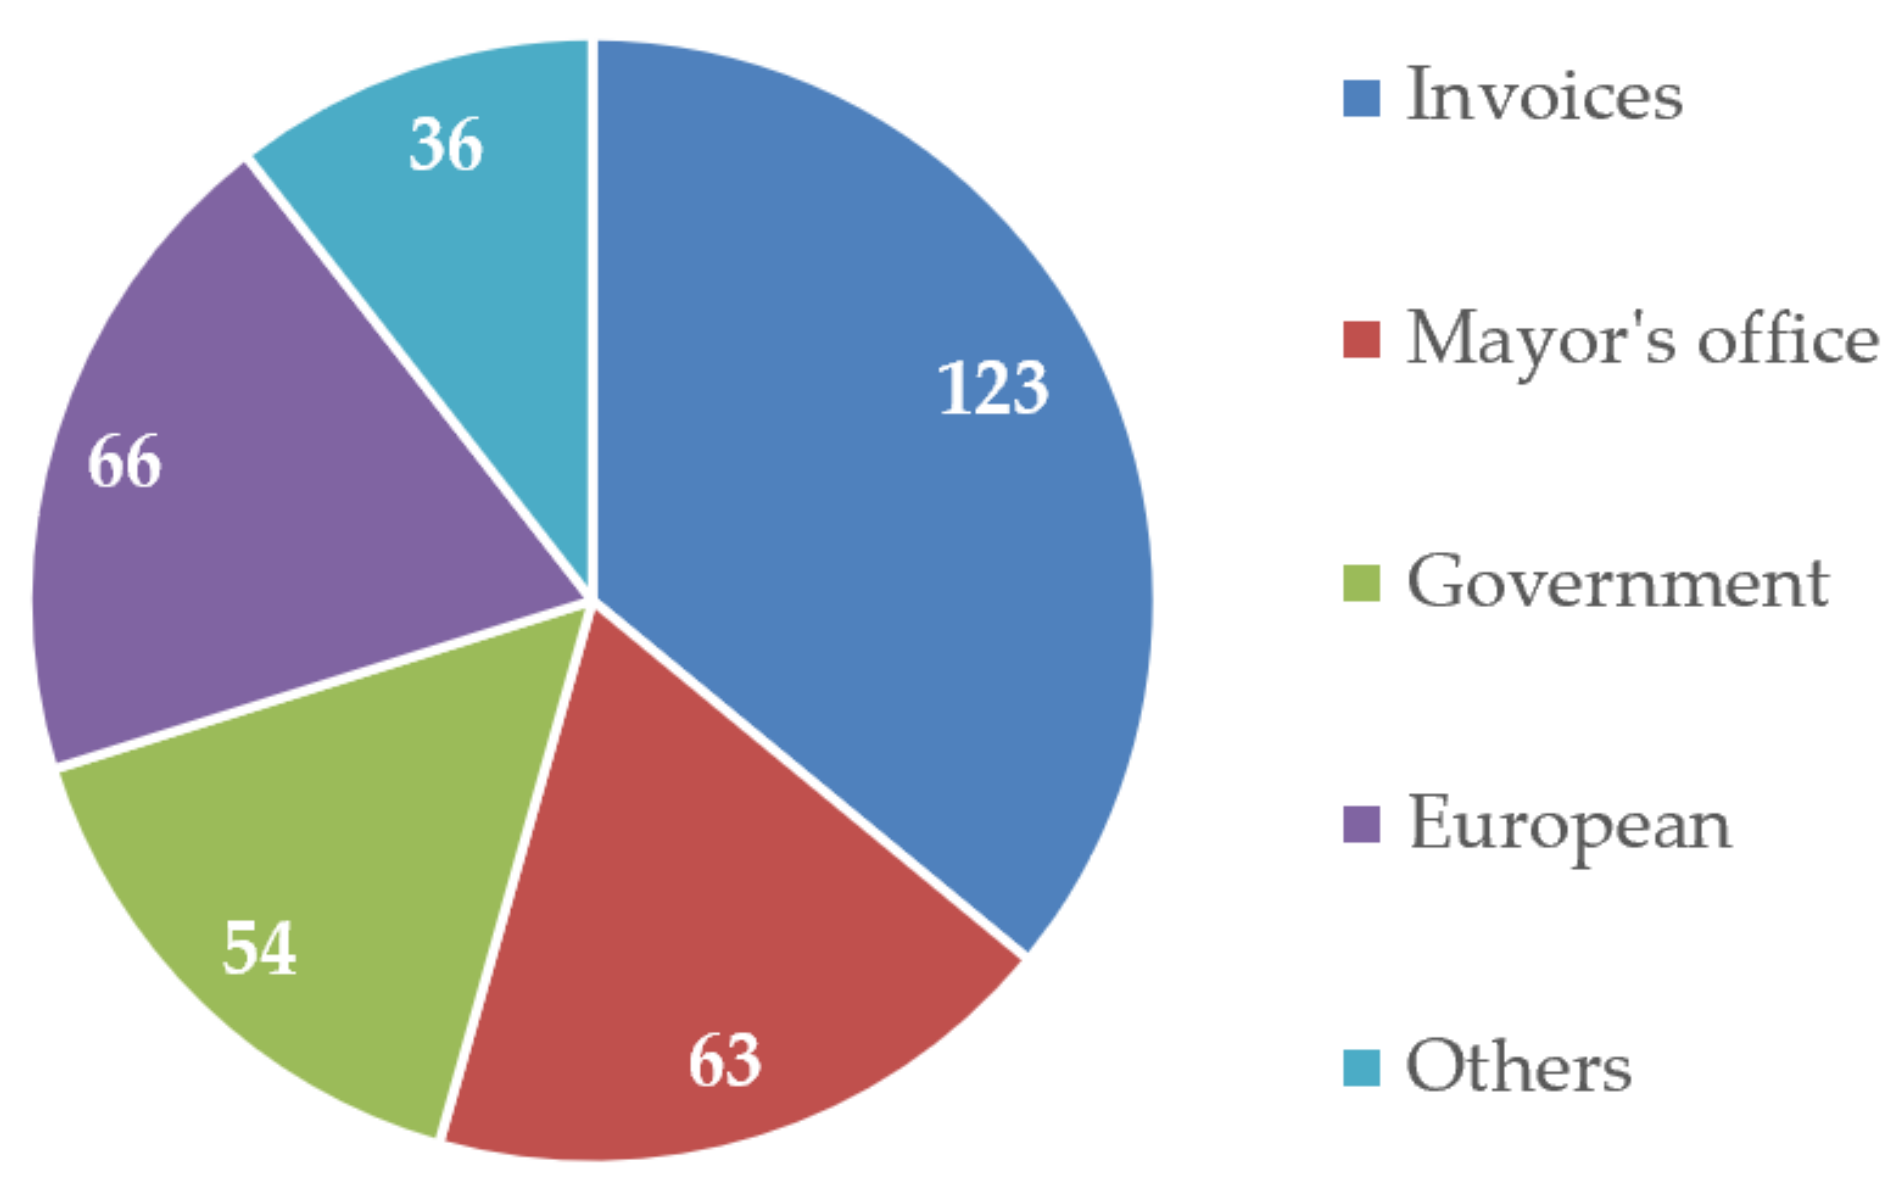
About a third (37.5%) of those interviewed indicated the local mass media as the main information source for the provenance of these funds. In comparison, over half of them (54%) have another, unspecified, source of information (
Figure 8).
Most local community representatives appreciate the benefits of improving the water and sanitation systems (
Table 9). Aspects such as creating a more comfortable home environment, contributing to personal hygiene, saving time, and raising the standard of living, in general, were discussed.
4. Conclusions, Limitations, and Future Perspectives
This study aimed to investigate the perceptions of the inhabitants of the Pecica, Turnu, and Sederhat areas regarding drinking and wastewater in order to evaluate the necessity to improve the way citizens are informed and to provide them with data to help them gain knowledge about the quality and sources of drinking water. At the same time, information is needed on future projects to be implemented for the rehabilitation of the water supply and sewerage systems.
The survey contained questions that covered several topics: water access and quality, opinions on water distribution, sewerage systems, and investments in specific infrastructure.
Even though it was found that water is considered necessary for the lives of respondents and that about 60% of the households are connected to the city water supply system, the water use is dedicated to household activities and cooking. In contrast, the water intake is achieved mainly by bottled water. Therefore, it is considered necessary to inform the citizens that the water supplied to the system meets quality standards in order to increase their trust in its consumption as drinking water.
Although the primary sources of funding for the improvement of drinking water and sewerage systems are taxes paid by citizens and municipalities and funds from European Union projects, citizens obtain this information from the mass media. This leads to the recommendation that the authorities find new sources of dissemination of this information and of plans to modernize these infrastructures so that they reach a higher percentage of citizens in the future.
As an overview of the survey, it can be said that it generally highlighted the citizens’ level of awareness regarding environmental protection and efforts made in this regard by local authorities. Most respondents knew the implications of treated wastewater on ecological conservation. They still had fewer data regarding the quality standards and agreed that the polluter should pay for non-compliance.
The residents of Pecica positively appreciated the changes brought to their lives by the revitalization of the water distribution system and wastewater treatment. These aspects improve their health, hygiene, time, and, in general, their living standard.
The main limitation of the survey was the pandemic situation at the moment of its execution, which negatively influenced the possibility of addressing a more significant number of respondents. Another factor was the limited ability of citizens from the considered villages to use and access information devices.
As the responses to the survey indicate a low level of respondents’ knowledge about the physicochemical characteristics of drinking water, it is necessary to develop educational programs to increase literacy on the importance of water for human health and its quality parameters.
Future studies should consider water consumption, the trends in water saving, and the correlation of these with the price of water, household size and ownership, and income size.


 ,
, 
