Article

Data Knowledge Dual-Driven Rate of Penetration Prediction Method for Horizontal Wells

School of Petroleum and Natural Gas Engineering, Southwest Petroleum University, Chengdu 610500, China
*
Author to whom correspondence should be addressed.
Appl. Sci. 2023, 13(20), 11396; https://doi.org/10.3390/app132011396
Submission received: 14 September 2023 / Revised: 11 October 2023 / Accepted: 16 October 2023 / Published: 17 October 2023

Abstract

:
The prediction and optimization of the rate of penetration (ROP) for horizontal wells are more complicated than for vertical wells, but most of the current ROP prediction studies are for vertical wells, which cannot be adapted to the complex drilling characteristics of horizontal wells. To this end, this paper proposes a data knowledge dual-driven horizontal well ROP prediction method. Firstly, the drilling characteristics of horizontal wells are analyzed, showing that the horizontal wells ROP prediction model cannot be modeled using surface measurement data; secondly, based on the analysis of horizontal well drilling characteristics, a physical model-based horizontal well ROP modeling data pre-processing method is proposed by introducing the drag and torque model. Finally, a data knowledge dual-driven horizontal well ROP prediction method is proposed in conjunction with data-driven algorithms. The proposed horizontal well ROP prediction method is applied to the A1~A4 wells in the Sichuan area. Compared with the conventional data-driven ROP prediction method, the prediction accuracy of this method is improved by 30%. The proposed method can provide a basis for the intelligent optimization and management of ROP during the drilling of horizontal wells.

1. Introduction

Horizontal wells are one of the important ways for the development of unconventional oil and gas reservoirs. Horizontal wells face more complex downhole conditions, hole cleaning [1], drag and torque [2], complex bottom hole assembly (BHA) [3], trajectory control [4], etc., which makes the prediction and optimization of ROP in horizontal wells more complicated than in vertical wells [5]. However, most of the current ROP prediction studies are for vertical wells, which cannot be adapted to the complex drilling characteristics of horizontal wells. Therefore, it is important to analyze the drilling characteristics of horizontal wells, establish a horizontal well ROP prediction model, and clarify the potential relationship between drilling parameters and ROP for horizontal well ROP optimization and management.
Currently, ROP prediction models are mainly divided into mechanistic and data-driven models. Bingham [6] and Bourgoyne [7] proposed that the classical mechanistic ROP prediction model has been successfully applied in the field and widely accepted by the industry, but it is difficult to promote the application of the mechanistic model due to the high requirement of empirical parameters [8]. The data-driven approach can tap the implicit information in the data and is suitable for dealing with complex or unknown mechanism modeling problems, and the study shows that the data-driven ROP prediction approach obtains a better accuracy [9]. In recent years, data-driven ROP prediction models have been developing rapidly. For the problems of strong noise, discontinuity, and outliers in drilling data, wavelet noise reduction [10], kriging difference [11], outlier rejection [12] and other methods are proposed to pre-process the data. To address the complex mechanism in which many factors influence the ROP, the methods of correlation analysis [13] and principal component analysis [14] are introduced to preferentially selected decision variables to improve the training speed and performance of the model. To address the shortcomings of the machine learning algorithm, the bionic optimization algorithm is combined with the machine learning method to optimize the hyperparameters of the machine learning algorithm, which improves the accuracy of the model to a certain extent [13,15,16]. To address the problem in which the model cannot be dynamically updated, the moving-window support vector regression (MW-SVR) algorithm based on a moving window is proposed to dynamically update the ROP model to adapt to the changes in downhole conditions [17,18]. For the special characteristics of horizontal wells and highly deviated wells, Abbas et al. [19] considered the influence of well trajectory on the ROP and developed an artificial neural network (ANN) model for predicting the ROP in highly deviated wells. Hazbeh et al. [20] evaluated the performance of 11 ROP prediction methods with directional section data. Najjarpour et al. [21] proposed a new method based on the apparent thickness of the formation to highlight the difference between horizontal well soundings and vertical depths for ROP management in horizontal wells.
In the past, many scientists have noted that drilling data are noisy, missing and anomalous, but they ignored the validity of drilling data. Due to the high cost of downhole measurement devices, the data currently used for ROP modeling are surface measurements, mainly for vertical wells, and are not applicable to horizontal wells in the absence of downhole measurement tools. Downhole drilling data in horizontal wells are a function of surface drilling parameters and downhole drilling conditions [22]. This paper couples the drag and torque (D&T) model and the data-driven method to propose a data knowledge dual-driven horizontal well ROP prediction model for horizontal wells, which provides a basis for intelligent ROP optimization and management during the drilling process of horizontal wells.

2. Horizontal Well Drilling Characteristics

2.1. Characteristics

A typical horizontal borehole trajectory diagram is shown in Figure 1. The borehole changes from a vertical borehole to a horizontal borehole and extends through the reservoir, causing the horizontal well to have different characteristics than a vertical well.
(1)
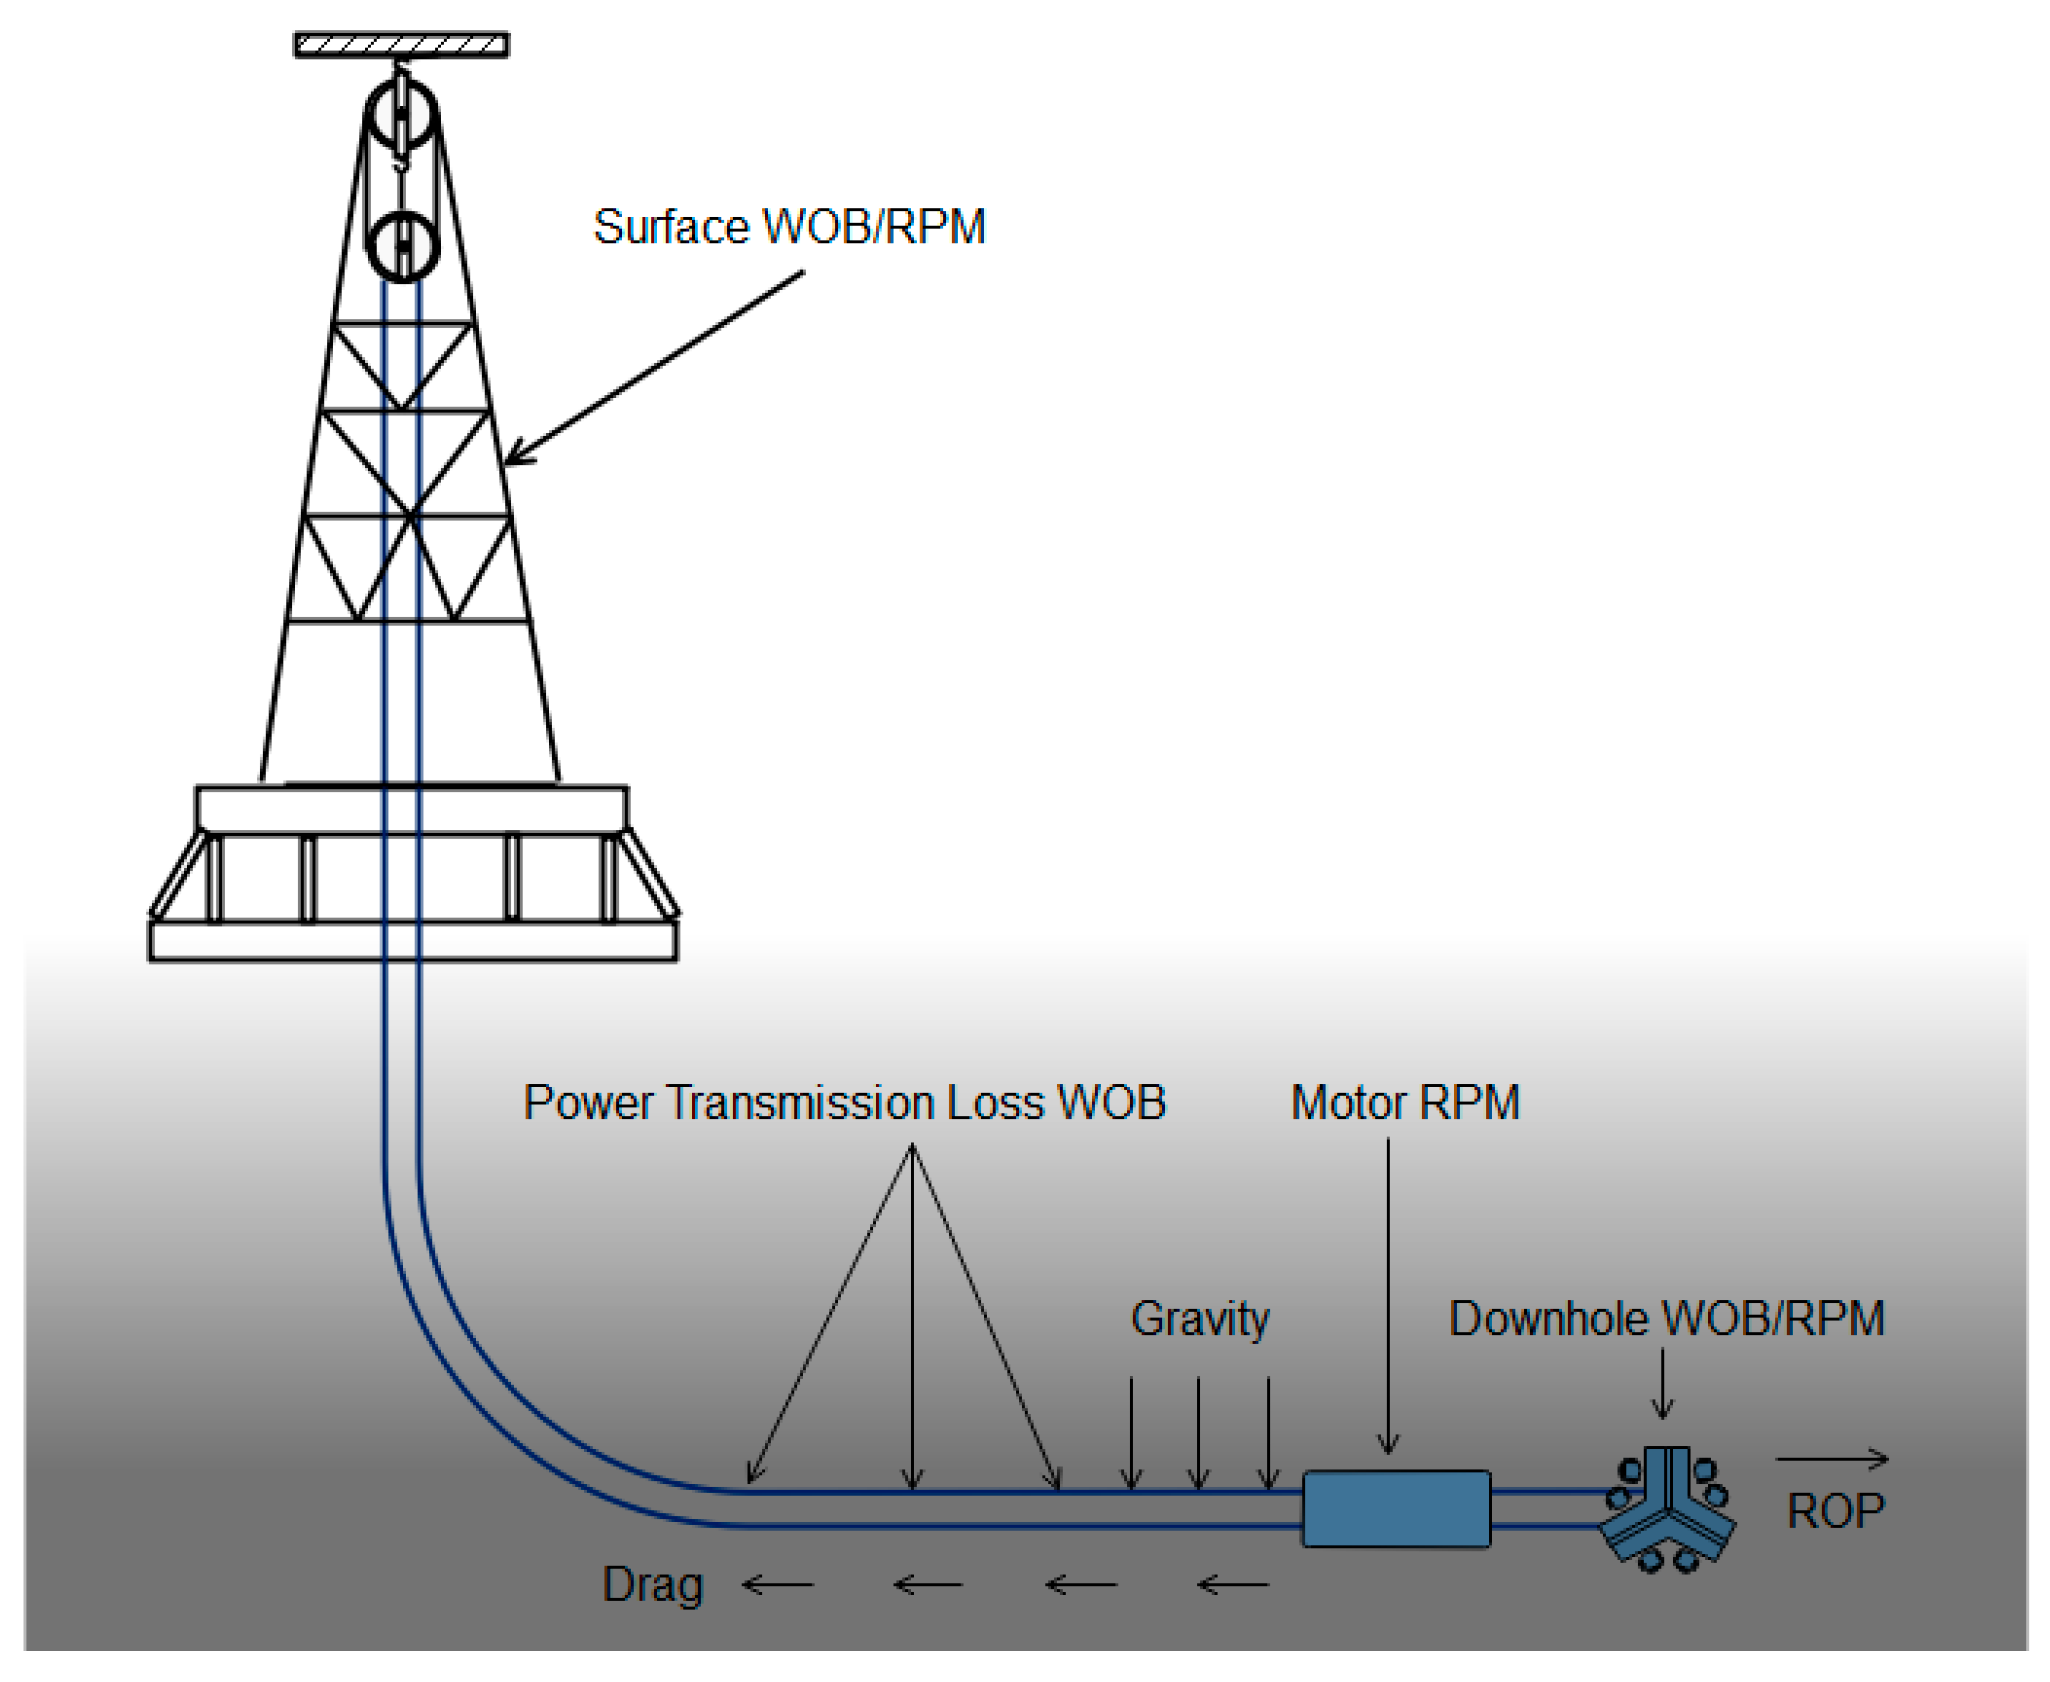
Drag and torque. The direct contact of the BHA with the wellbore under the action of gravity from the build-up section leads to large drag and torque. Drag counteracts part of the weight applied to the bit by BHA, causing the weight on bit (WOB) reflected by the surface WOB (SWOB) to be inconsistent with the downhole WOB [23].
(2)
Eccentric annulus and hole cleaning. The drill string in the horizontal part of the wellbore is eccentric to the lower side by gravity, forming an eccentric annulus, while in the eccentric annulus, the flow velocity is not uniform, and the cuttings settle radially to form a cutting bed in the lower wellbore, which affects the friction coefficient between the drill string and the wellbore and subsequently affects the WOB transfer [24,25].
(3)
Trajectory control. Horizontal wells require directional operations due to the need for a well incline and azimuth adjustment [26]. The positive displacement motor (PDM) is a commonly used tool for trajectory control. In a PDM, the power section converts the hydraulic energy of mud flow into mechanical rotary power to drive the drill bit to rotate rapidly at the bottom hole to achieve trajectory control [27]. Rotary Steerable Systems are employed as tools for trajectory control, which enables directional drilling while the drill string is rotating. However, in order to enhance drilling efficiency, it is commonly deployed in tandem with a PDM. As a result, the bit’s RPM surpass that of the surface RPM.
The above analysis shows that due to the special characteristics of the horizontal well drilling process, the drilling parameters measured at the surface are significantly different from the actual drilling parameters at the bottom hole, and the surface measurement data cannot be used directly to build ROP models in horizontal wells. In order to achieve an accurate prediction of ROP in horizontal wells, the surface measurement data must be pre-processed considering the characteristics of horizontal wells, and then an ROP prediction model build based on a data-driven approach.

2.2. Horizontal Well Data Processing Method

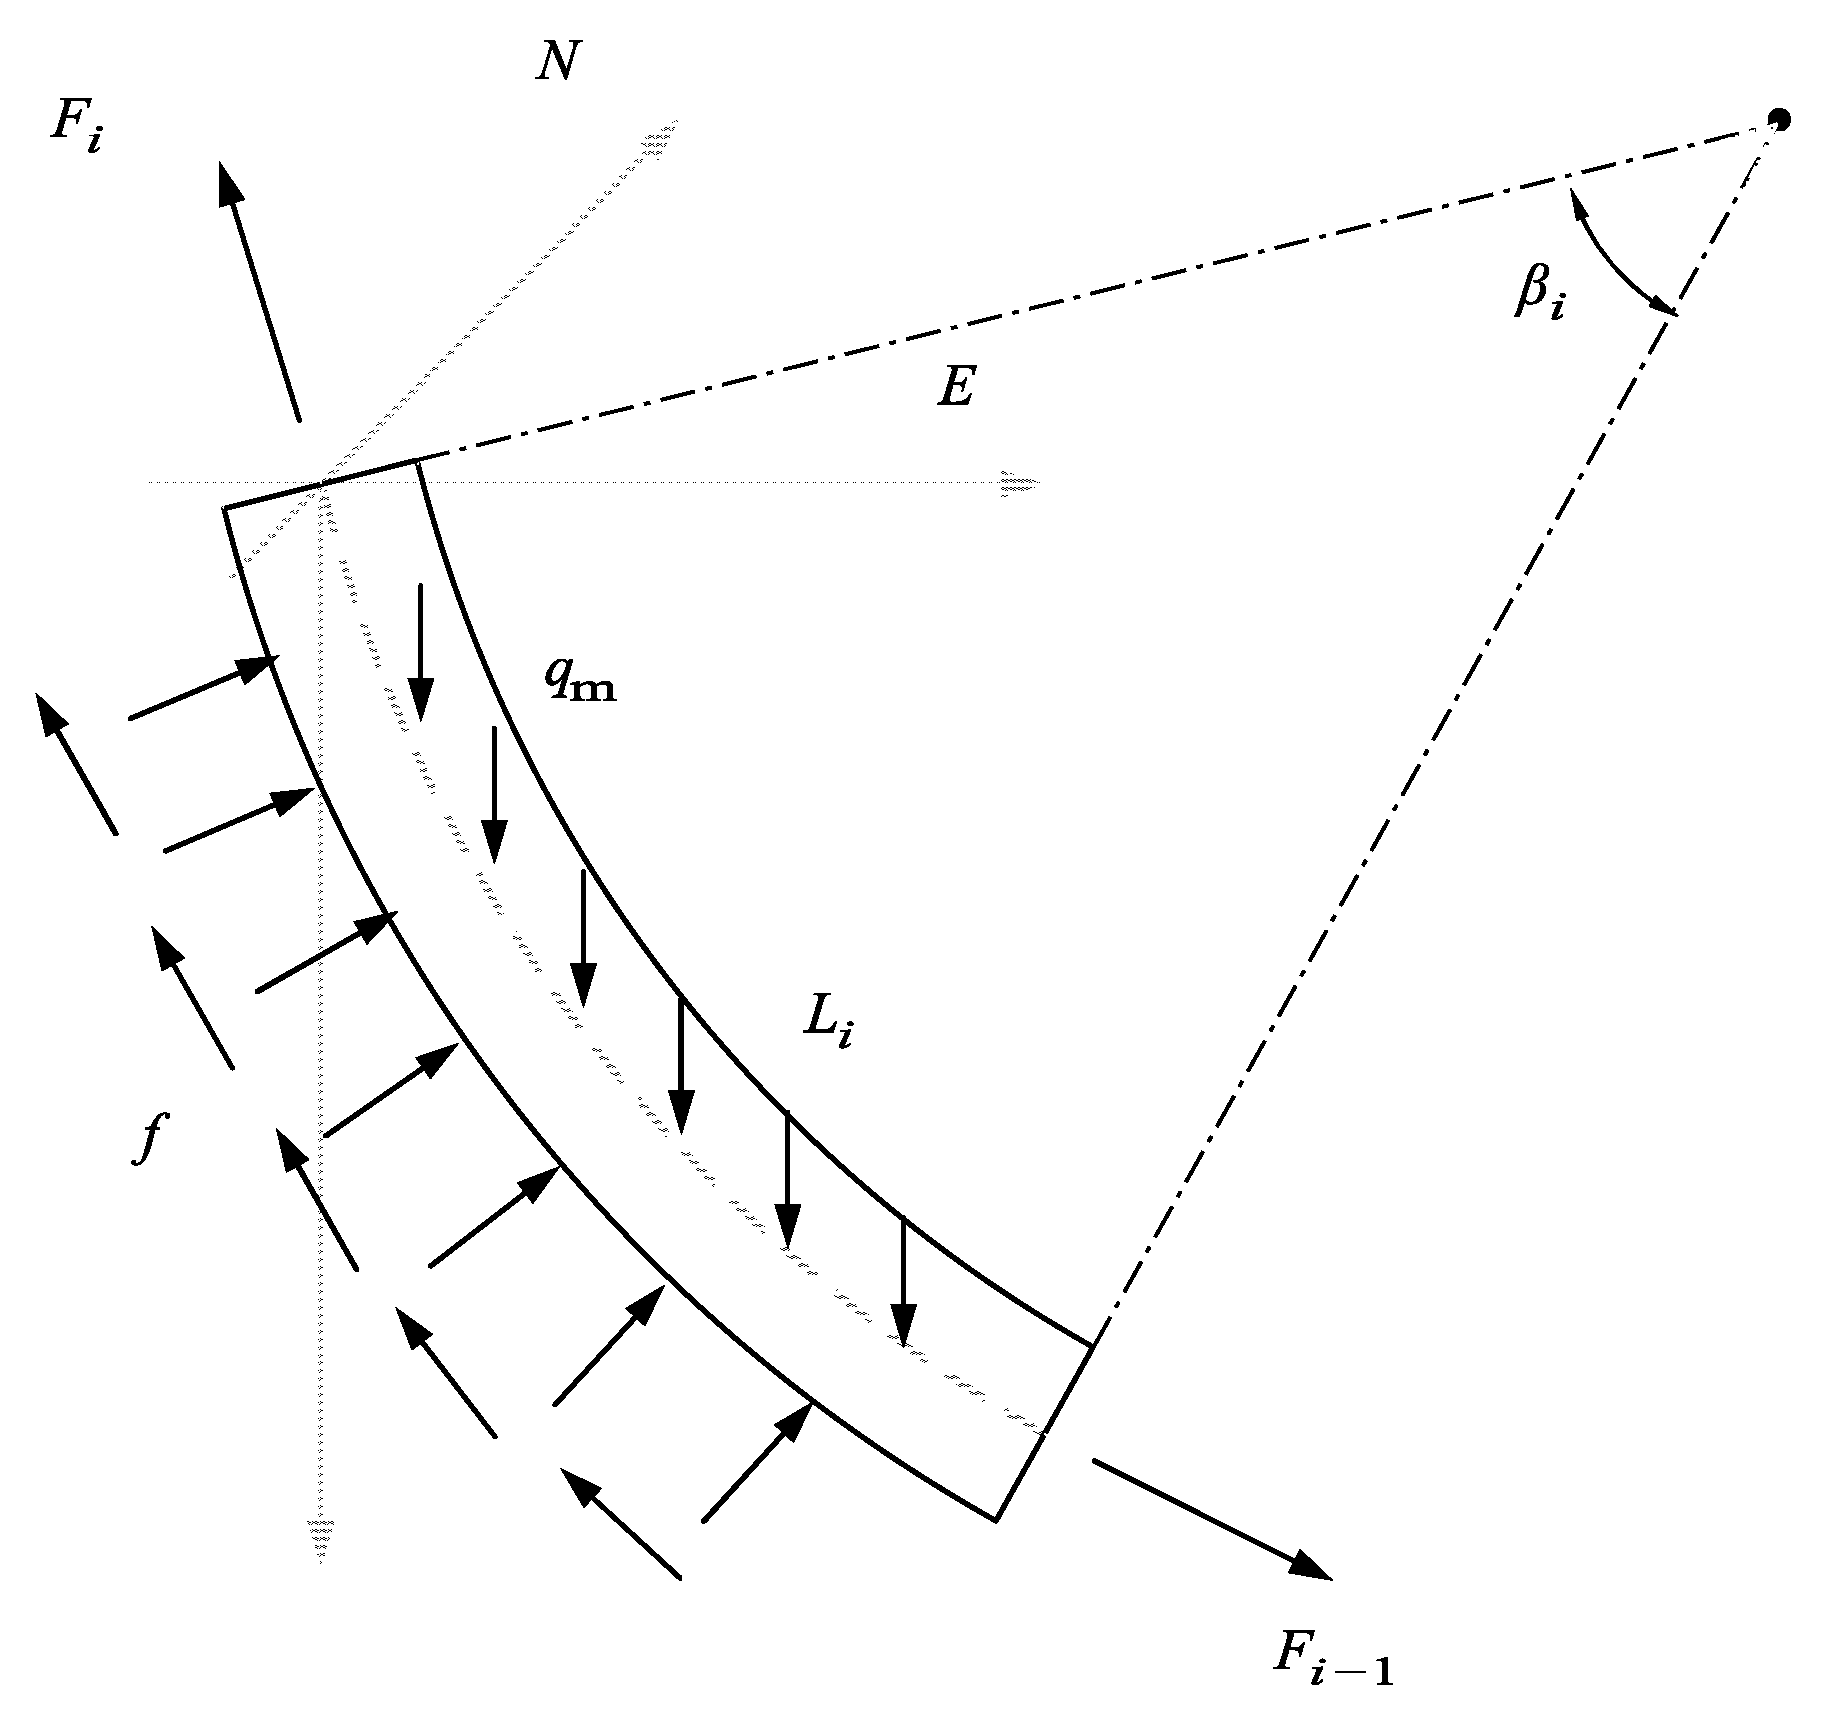
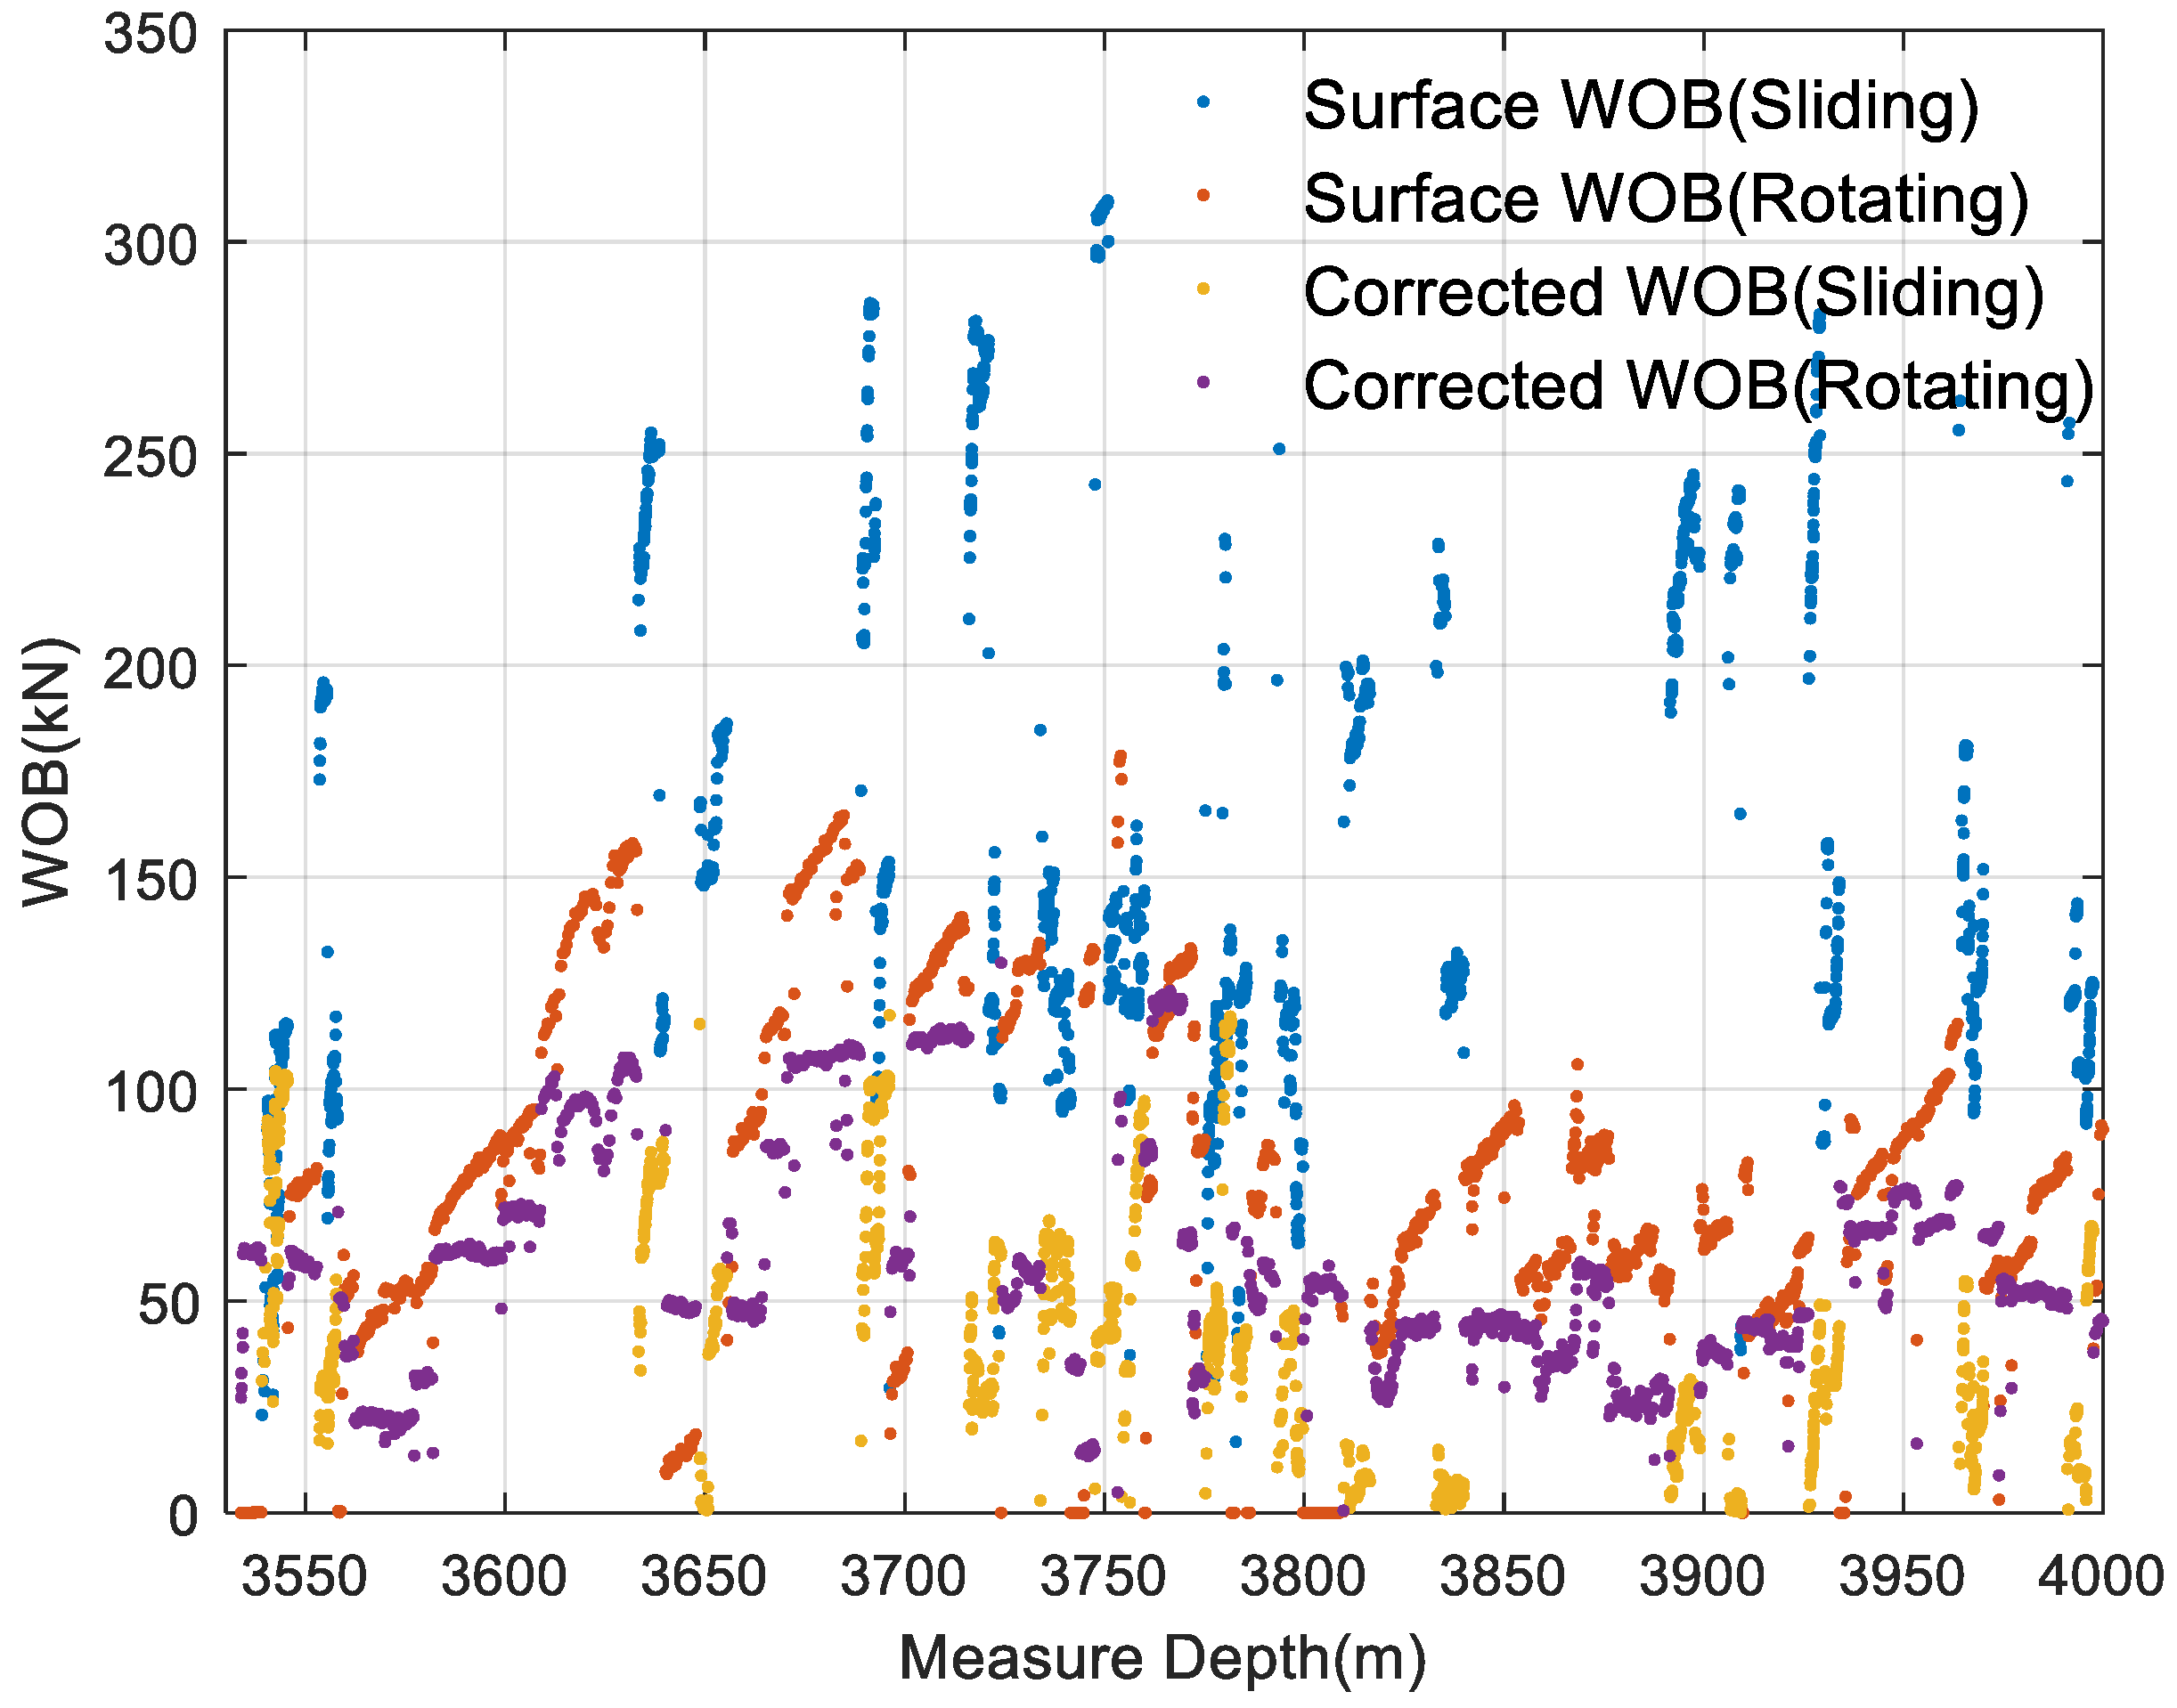
2.2.1. Corrected WOB

The hook load data are recorded in the surface measurement data, which can be used to calculate the DWOB according to the drag torque model proposed by Johancsik [28]. By dividing the drill string into a collection of tubular units as shown in Figure 2, the tensile forces at the ends of the tubular units can be expressed as follows:
F i 1 = F i q m L i cos α ¯ i μ i N i cos β i 2 cos Δ α i 2
N i = F i Δ ϕ i sin α ¯ i 2 + F i Δ α i + q m L i sin α ¯ i 2
where F i ,   F i 1 represent the tension force at both ends of the unit, when i = 0, F i = F 0 , F 0 is the hook load, N. μ i is the friction coefficient between the i-th unit and the wellbore, which is dimensionless. α i ,   φ i , and β i represent the inclination, azimuth, and dogleg angle at both ends of the unit, rad; L i is the length of the i-th unit, m; Δ α i is the inclination angle increment at both ends of the i-th unit, rad; q m is the floating weight of the i-th unit in drilling fluid, N/m; and N i is the normal force of the i-th unit, N.
Once the drill string description, survey data, and friction coefficient are specified, the calculation starts at the top of the drill string and proceeds stepwise down. The tension at the top of the first unit is known to be the hook load; then, the tension at the end of the first unit can be calculated according to Equations (1) and (2). The pulling force at the end of the previous unit is used as the pulling force at the top of the next unit in turn, and the calculation is iterated to the bottom of the drill string; then, the pulling force at the end of the last unit is the downhole WOB.

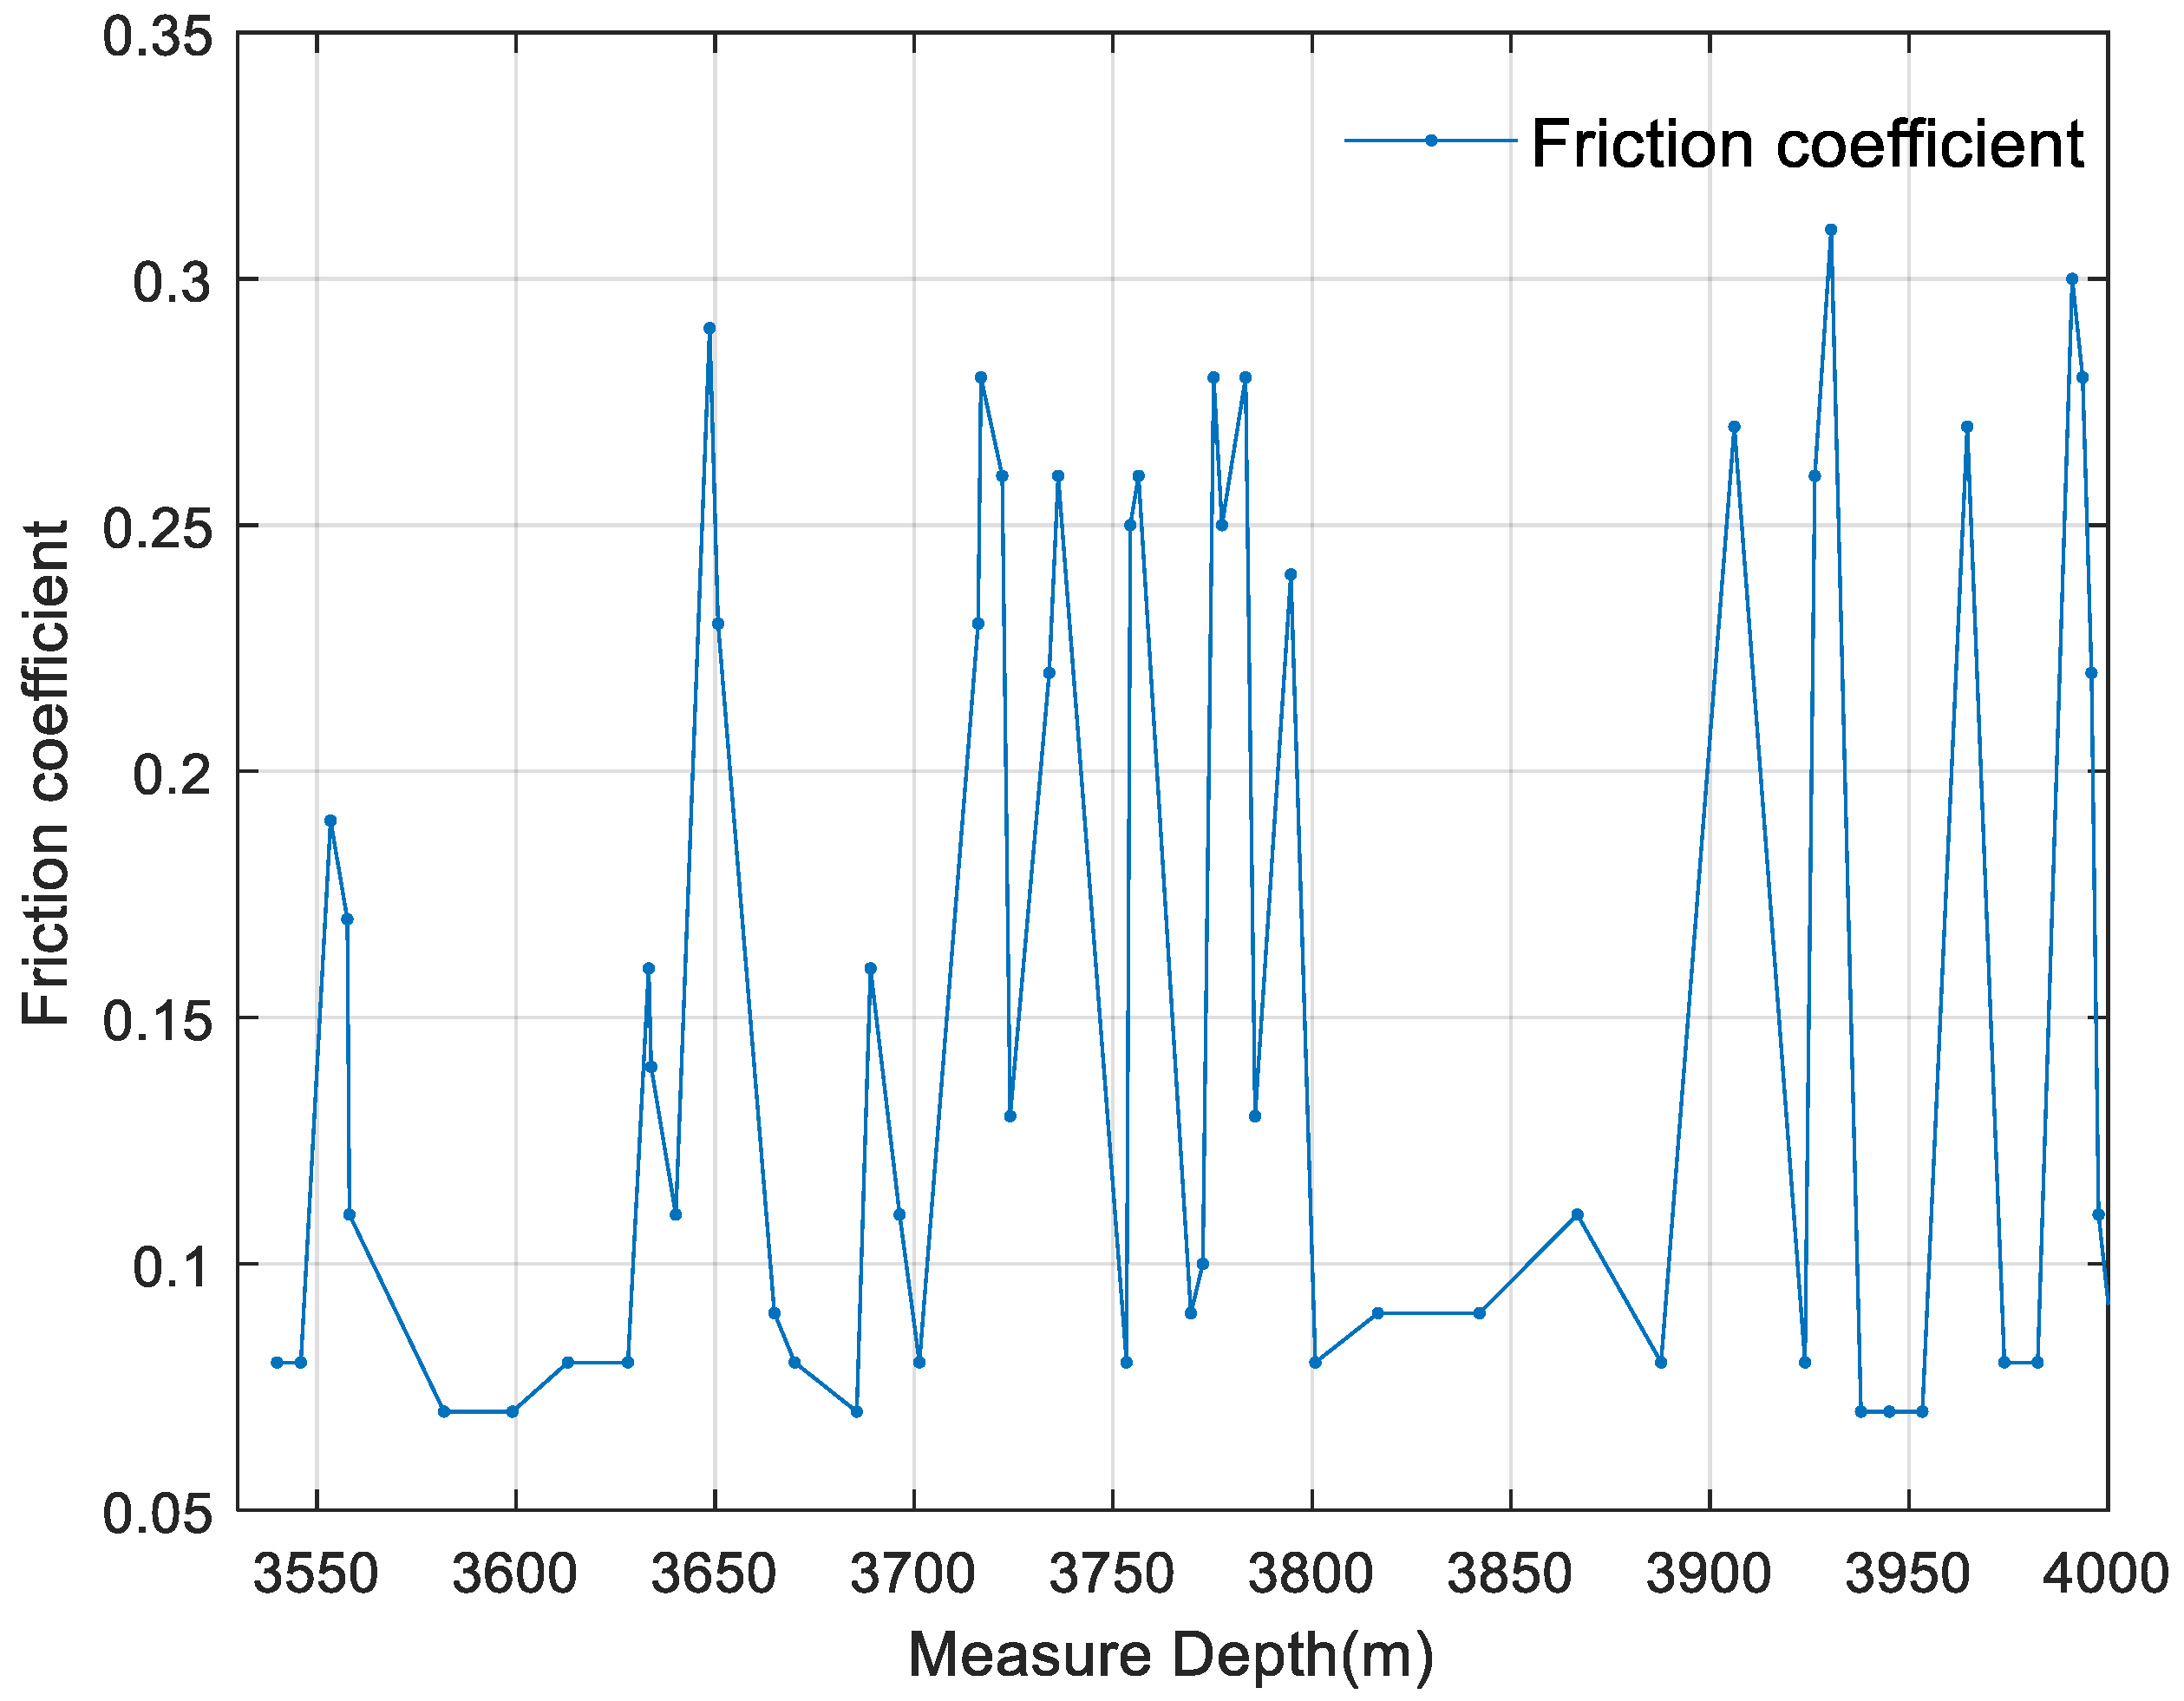
2.2.2. Friction Coefficient Calculation

Due to the dynamic variations in wellbore cleaning conditions, the coefficient of friction between the drill string and wellbore wall changes dynamically. It is essential to inversely calibrate the coefficients of friction based on drilling data in order to accurately calculate the downhole WOB. As illustrated in the Figure 3, two different methods for inverting the friction coefficients during sliding and rotary drilling are presented. Firstly, the drill string description and survey data should be determined; during sliding drilling, the friction coefficient is inverted according to the off-bottom hook load (HL), and the friction coefficient is inverted according to the off-bottom torque during rotary drilling.

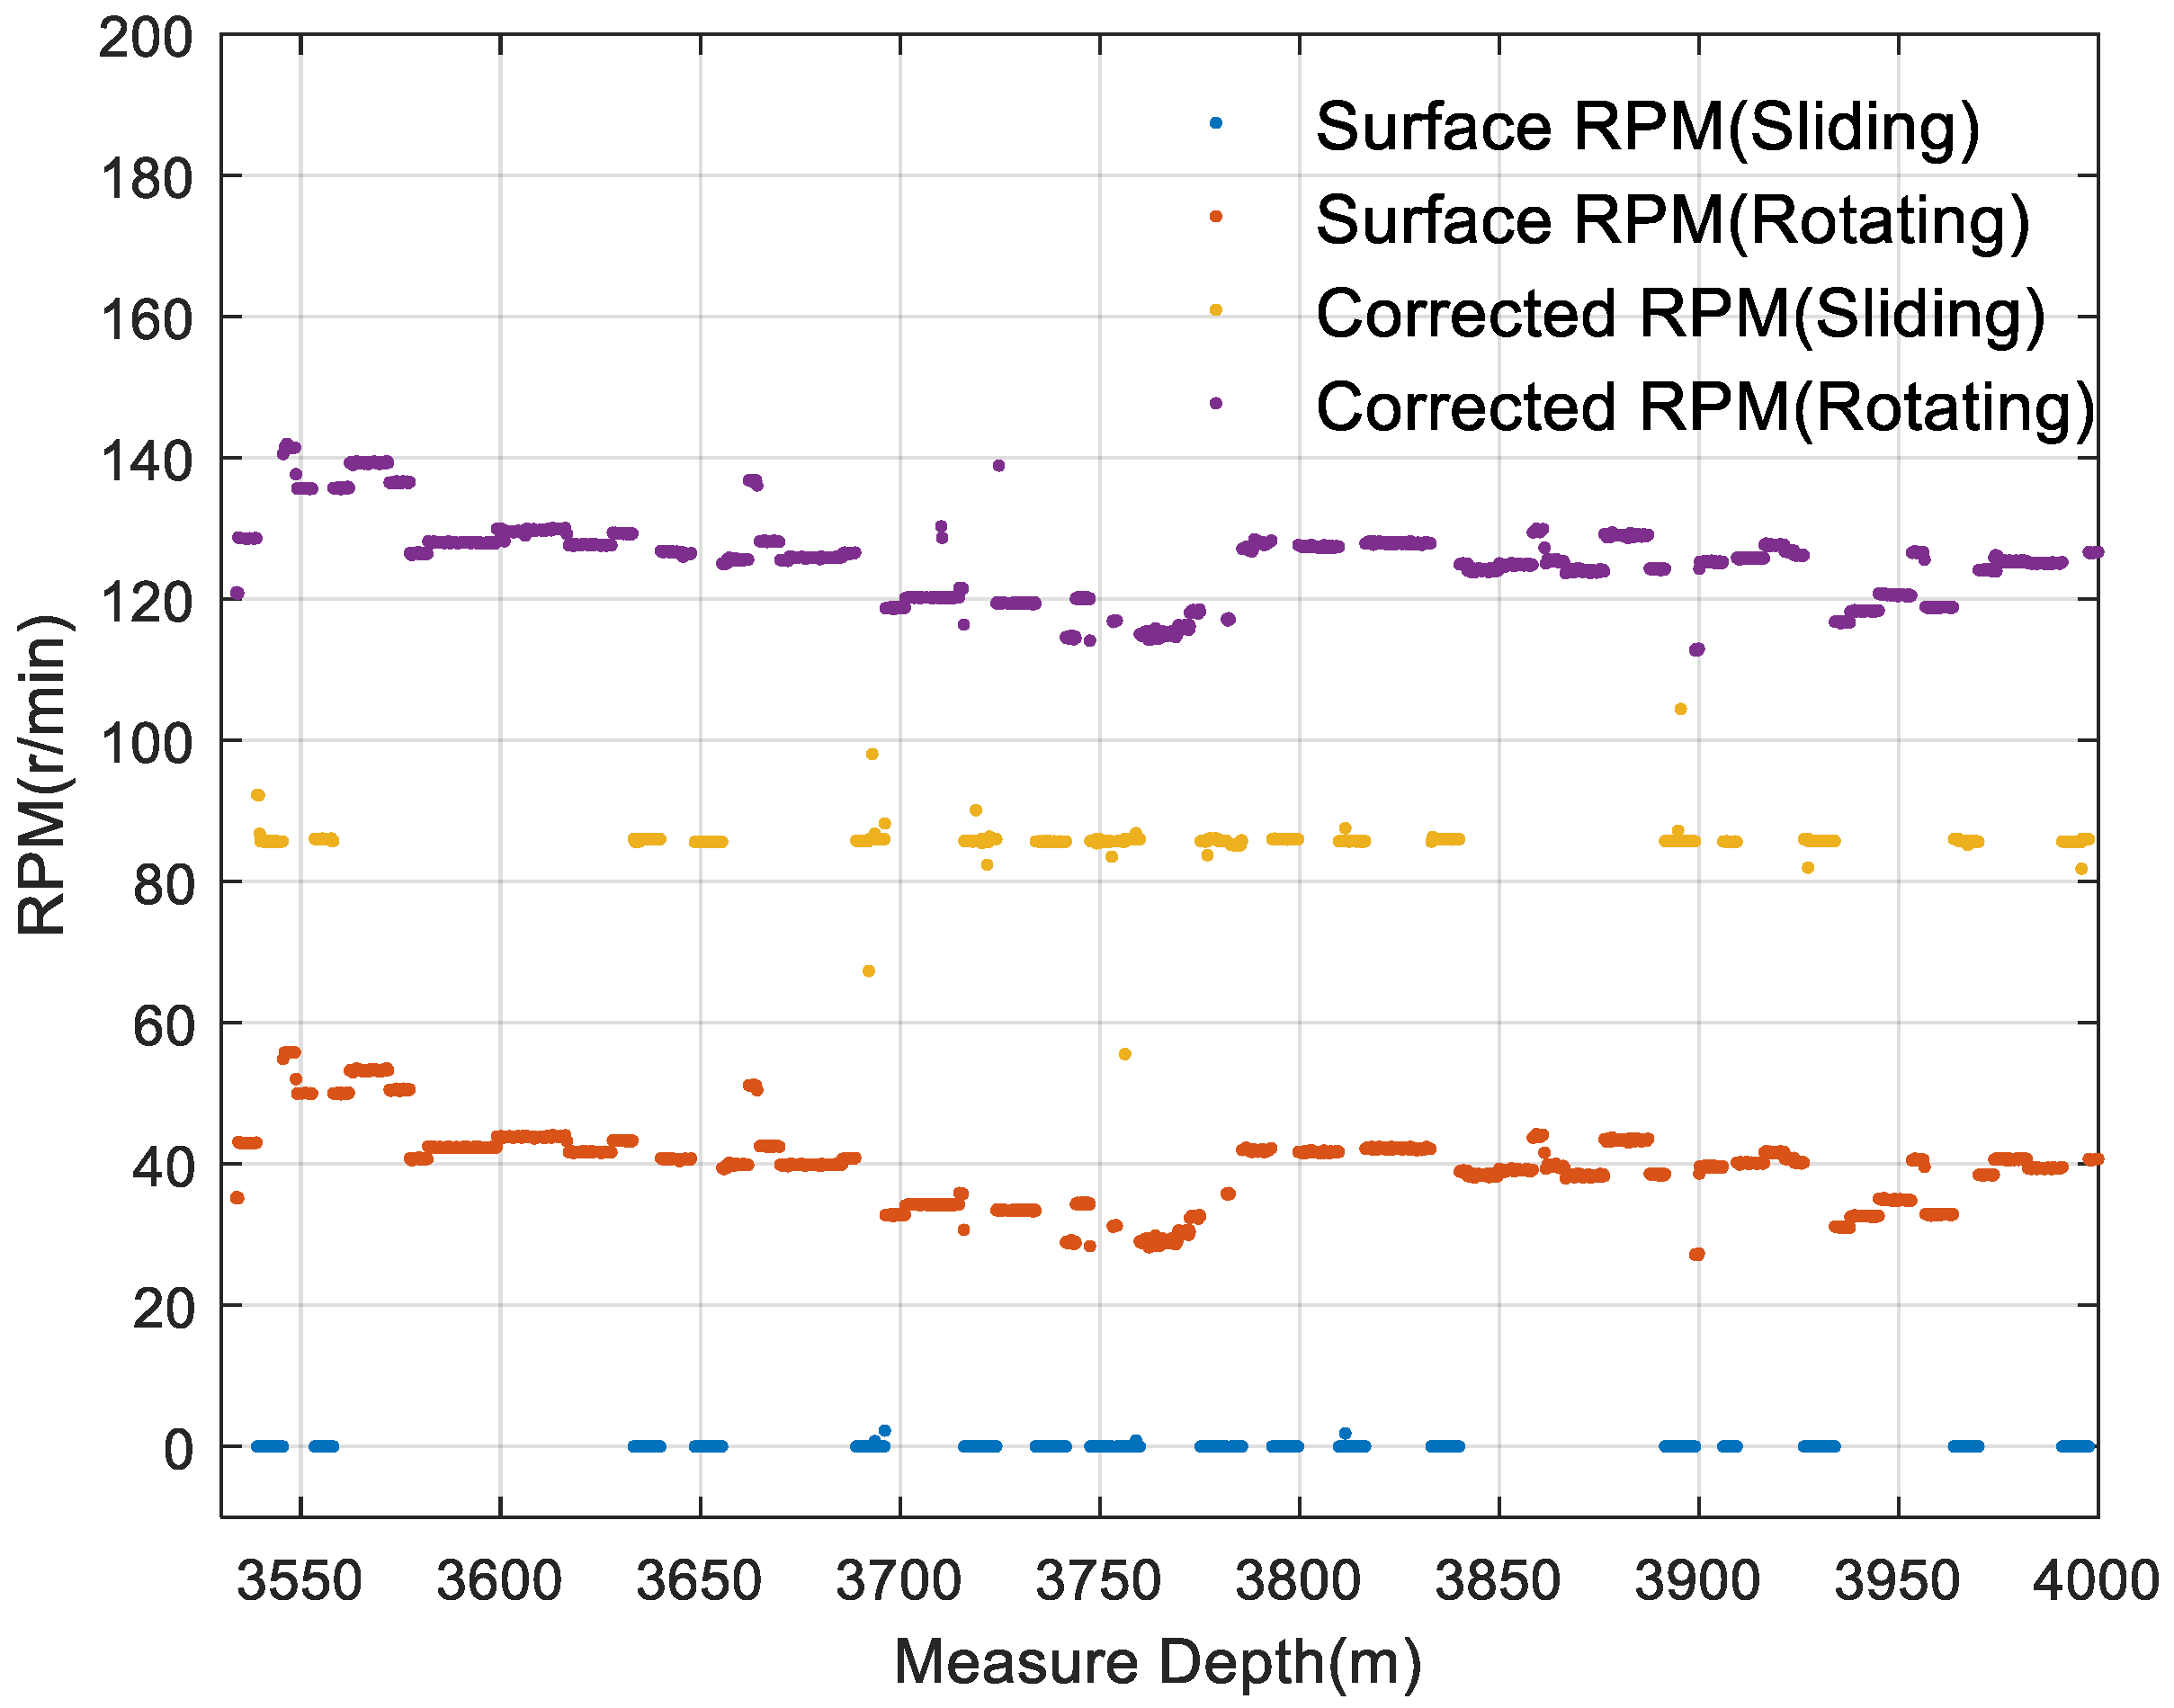
2.2.3. Corrected RPM

The PDM provides additional RPM to the bit during rotating or sliding drilling. According to the definition [29], the ideal PDM output RPM can be expressed as Equation (3):
R P M P D M = 60 Q q
The surface RPM (SRPM) superimposed on the PDM speed is the downhole RPM, which can be expressed as Equation (4):
C o r r e c t e d   R P M = 60 Q q + s u r f a c e   R P M
where Q is flow rate of the drill fluid, L/s; and q is the flow rate-per-revolution of the motor, L/r.

2.3. Data Statistics and Processing Results

In this section, taking the drilling data of a shale gas cluster horizontal well platform in Sichuan as an example, the drilling data of horizontal wells are calculated and analyzed. Table 1 presents the statistical results of drilling data for both sliding and rotary drilling operations. From Table 1, it is evident that rotary drilling achieves a significantly larger footage compared to sliding drilling, accounting for approximately 80% to 90% of the total, while rotary drilling data only constitute 45% to 60% of the total dataset. This disparity can be attributed to the slower ROP during sliding directional drilling. In the same time interval, sliding drilling accumulates more data points per unit of footage. Consequently, a higher proportion of sliding drilling data leads to increased overall data variability, resulting in greater errors in the predictive models developed for ROP. If this part of the data is directly removed as abnormal data, it will lead to insufficient generalization of the model, so it is necessary to consider correcting this part of the data.
Figure 4 illustrates the computed results of the friction coefficients between the drill string and the wellbore wall. Upon observing Figure 4, it becomes evident that the friction coefficients between the drill string and the wellbore wall dynamically fluctuate within the range of 0.07 to 0.32. These fluctuations arise from variations in downhole drilling conditions. As our analysis suggests, friction coefficients are not constants, and therefore, their dynamic variations must be considered when correcting the WOB.
In Figure 5, the corrected and surface WOB values, accounting for the friction between the wellbore wall and the drill string, are depicted. As illustrated in Figure 5, in the case of horizontal wells, the maximum discrepancy between the surface WOB and the corrected WOB, factoring in drag between the wellbore wall and the drill string, can be as high as 200 kN. Particularly notable is the substantial disparity between surface WOB and corrected WOB, which is especially pronounced during the sliding drilling phase. Figure 6 showcases the corrected RPM compared to surface RPM values. As indicated in Figure 6, irrespective of whether it is rotary or sliding drilling, the corrected RPM significantly surpasses surface RPM due to the influence of the PDM.
Figure 7 presents the results of the correlation analysis between drilling data and ROP. From Figure 7, it can be observed that there is a negative correlation between surface WOB and ROP with a correlation coefficient of −0.436. However, after considering drag for WOB correction, the correlation coefficient between the corrected WOB and ROP increases to 0.371. Post-correction, the relationship between WOB and ROP changes from negative to positive, aligning more closely with the theoretical principles of rock break. Furthermore, the correlation coefficient between surface RPM and ROP is 0.532, indicating a positive correlation. After accounting for the influence of the positive displacement motor, the correlation coefficient between the corrected RPM and ROP increases significantly to 0.775. This analysis suggests that by considering the effects of drag and the positive displacement motor for WOB and RPM corrections, it is possible to enhance the accuracy of ROP predictions and improve the precision of drilling parameter optimization.

3. Methodology

Figure 8 illustrates the horizontal well ROP prediction method, including four parts: feature variable selection, data pre-processing, model construction, and model evaluation. The first step involves identifying the appropriate model inputs from the drilling variables. The drilling variables include operational variables, state variables and formation variables; there are nonlinear relationships between these drilling variables and ROP, and appropriate methods are needed to evaluate their correlations. The second step consists of data pre-processing, including conventional data noise reduction, outlier rejection, and correction of drilling parameters based on the physical model. The third step involves building a hybrid model, combining support vector regression (SVR), decision tree (DT), random forest (RF), and artificial neural network (ANN) prediction methods, and constructing an ROP prediction model. The fourth step is the evaluation of the model, comparing the performance of the data knowledge dual-driven ROP prediction method with the conventional ROP prediction method.

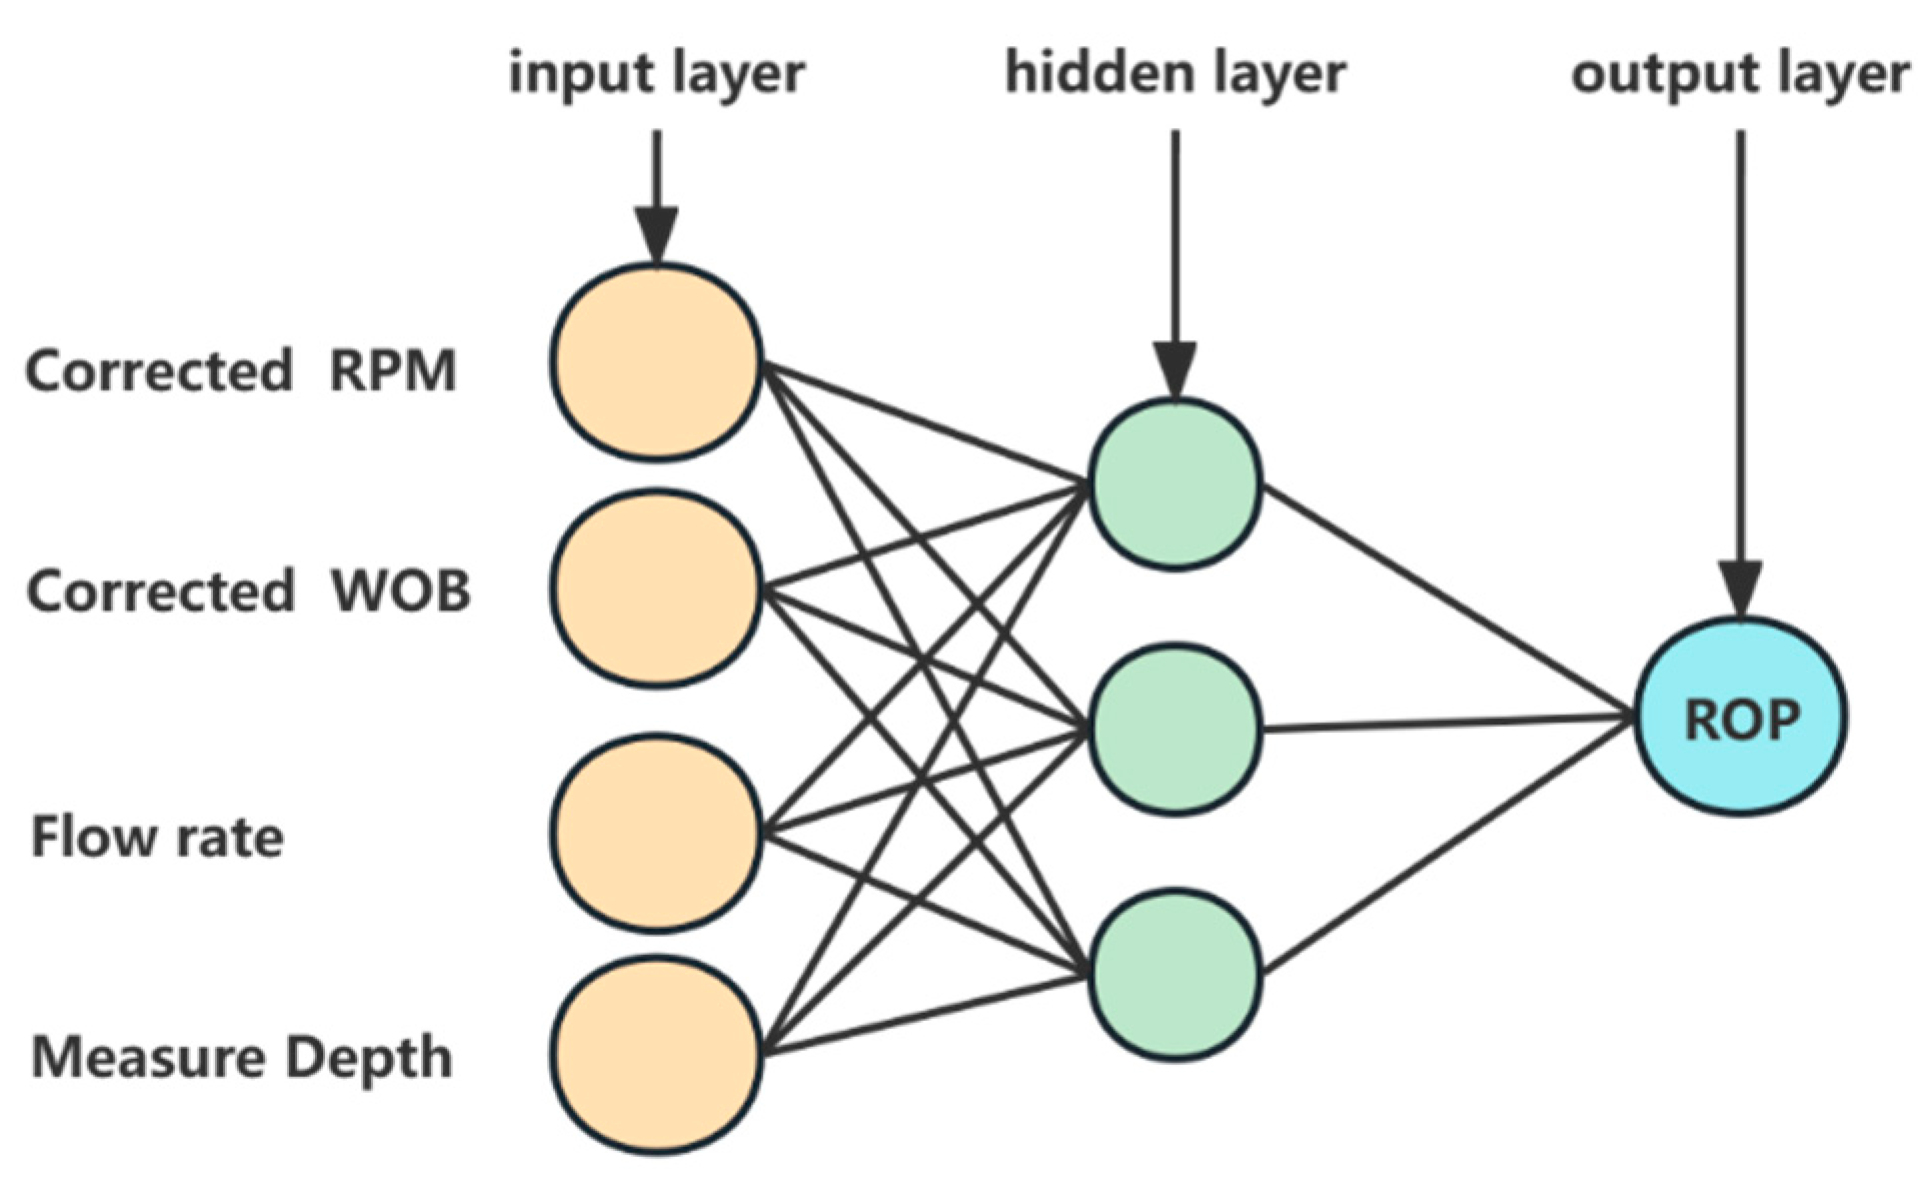
3.1. Feature Selection

To ensure the performance of the model and subsequent drilling optimization efforts, it is necessary to optimize the drilling variables that affect the ROP. Horizontal wells, like vertical wells, achieve rock fragmentation by manipulating the weight on bit (WOB), rotational speed (RPM), and pump flow rate. WOB, RPM, and flow rate all need to be considered as characteristic variables. Torque and standpipe pressure are state variables of drilling efficiency that cannot be directly manipulated during drilling and are not considered characteristic variables [30]. According to previous studies, ROP is not only related to drilling parameters but also influenced by rock strength [31]. However, it is relatively difficult to obtain rock strength data directly, and the simulation data in this paper do not involve formation changes, so the effect of rock strength is not considered directly in the characteristic variables. In general, as the measured depth (MD) increases, the compaction effect is obvious and the ROP becomes slower as the rock strength becomes greater, so the well depth needs to be considered. Based on the above analysis, WOB, RPM, flow rate, and MD are selected as input variables to the ROP prediction model for horizontal wells.

3.2. Data Pre-Processing

Data pre-processing is important for modeling ROP prediction models. The data quality determines the upper limit of the accuracy of the data-driven model, which is similar to ROP prediction. Similar to previous studies, noise reduction and outlier removal are also performed on the data in this paper. The difference is, in this paper, a drag and torque (D&T) model is introduced to correct the drilling parameters for the drilling characteristics of horizontal wells, which is also part of the data pre-processing.

3.3. ROP Prediction

As shown in step 4 in Figure 8, a data knowledge dual-driven ROP prediction model is constructed in this section considering horizontal well characteristics. Unlike the conventional ROP prediction model, the training data are the drilling parameters corrected by the physical model, rather than the surface measurements, as shown in Figure 9. Several well-known supervised machine learning methods, including SVR, DT, RF, and ANN, are used to predict the ROP. The performance of the model is evaluated by comparing the measured values with the predicted values. A conventional data-driven ROP prediction model is also developed to demonstrate whether considering horizontal well characteristics improved the model performance, as shown in Figure 10. The data-driven ROP prediction model is modeled using surface measurements. The prediction results of the two models will be compared to evaluate whether the ROP prediction model performance has been improved.

4. Case Study

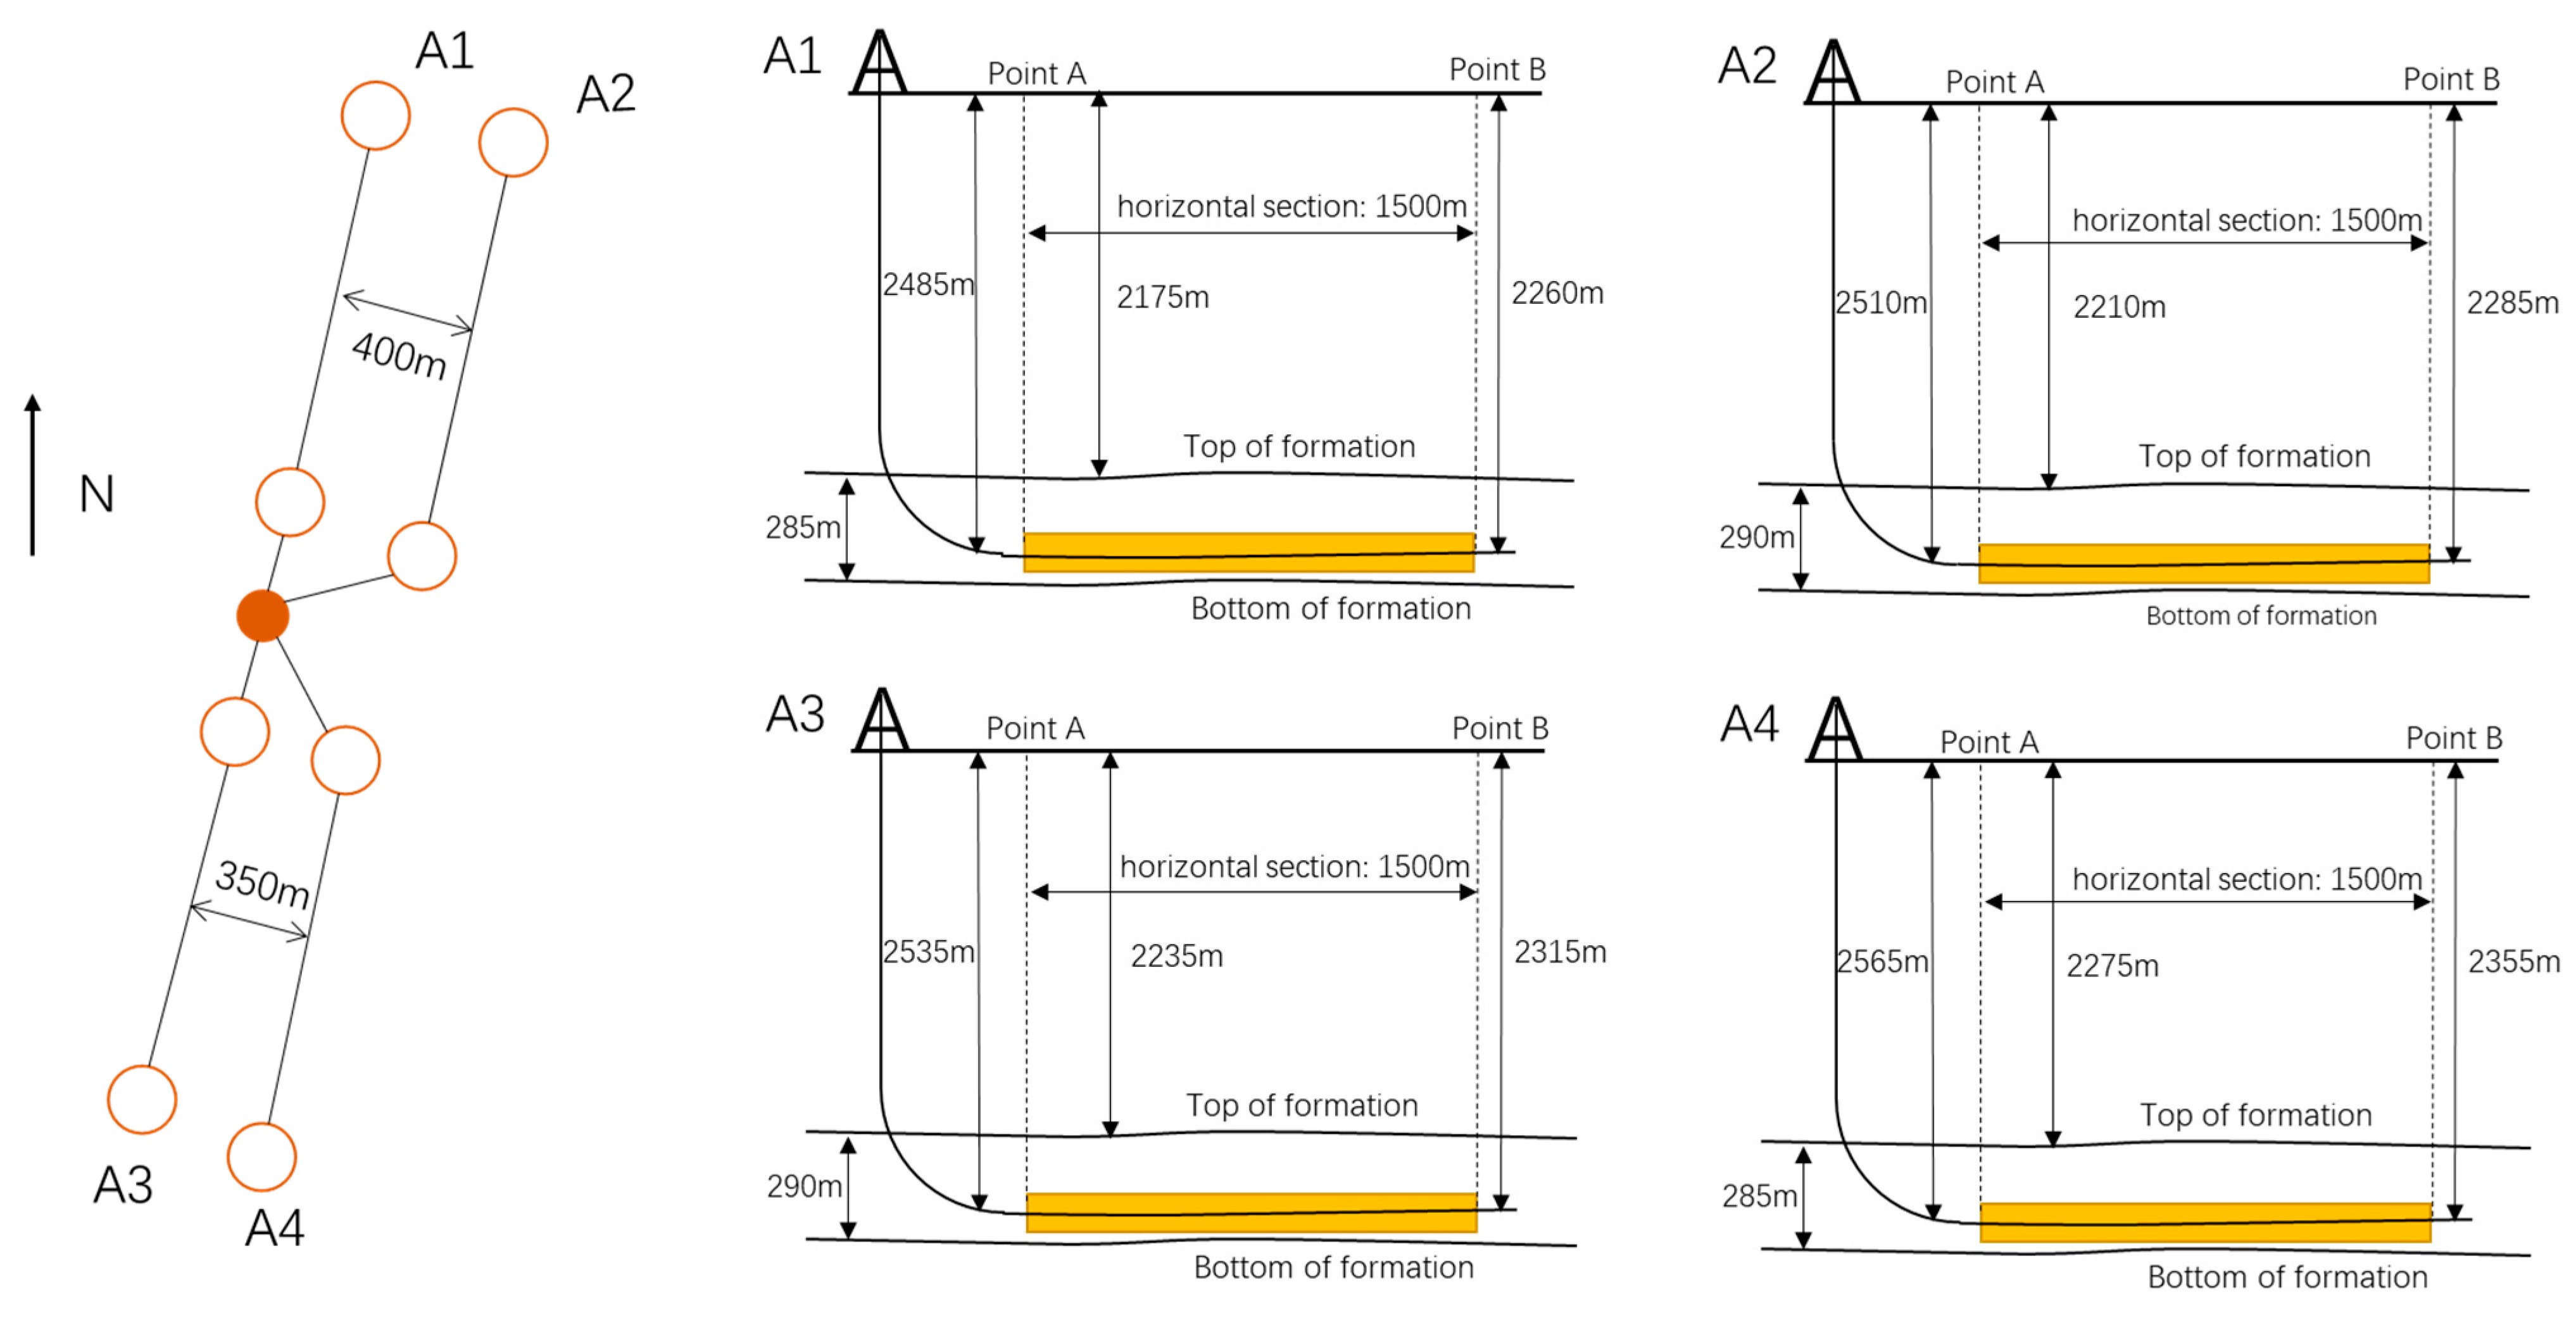
4.1. Data-Set Attributes

As illustrated in Figure 11, this is the horizontal projection map of a multi-well pad targeting area in a shale gas reservoir in Sichuan, China. The platform accommodates a total of four horizontal wells, namely A1 to A4, each with a horizontal section length of 1500 m. The spacing between adjacent wells is less than 400 m. The actual drilling trajectories are confined within a 3.5 m box, and all wells penetrate the high-quality Longmaxi Formation shale reservoir. Therefore, during the modeling process, the impact of geological properties on the mechanical drilling rate model can be disregarded. In this study, we conducted mechanical drilling rate prediction experiments using drilling data from each well’s horizontal section on this platform as an example. The simulation includes data from real-time mudlogging data, drill bit records, drill string description, survey data, drilling logs, and more. Notably, for the testing dataset, all four wells (A1 to A4) are equipped with the same type of drill bit. Consequently, the influence of drill bit types was omitted during the modeling process.
The root mean squared error (RMSE), mean absolute error (MAE) and coefficient of determination (R2) are introduced to measure the prediction performance.
RMSE = 1 n i = 1 n y ^ i y i 2
MAE = 1 n i = 1 n y ^ i y i
R 2 = n i = 1 n y ^ i y i i = 1 n y ^ i i = 1 n y i 2 n i = 1 n y ^ i 2 i = 1 n y ^ i 2 n i = 1 n y i 2 i = 1 n y i 2
where y ^ i and y i are the predicted value and actual value of the i-th sample, respectively; and n is the number of samples.

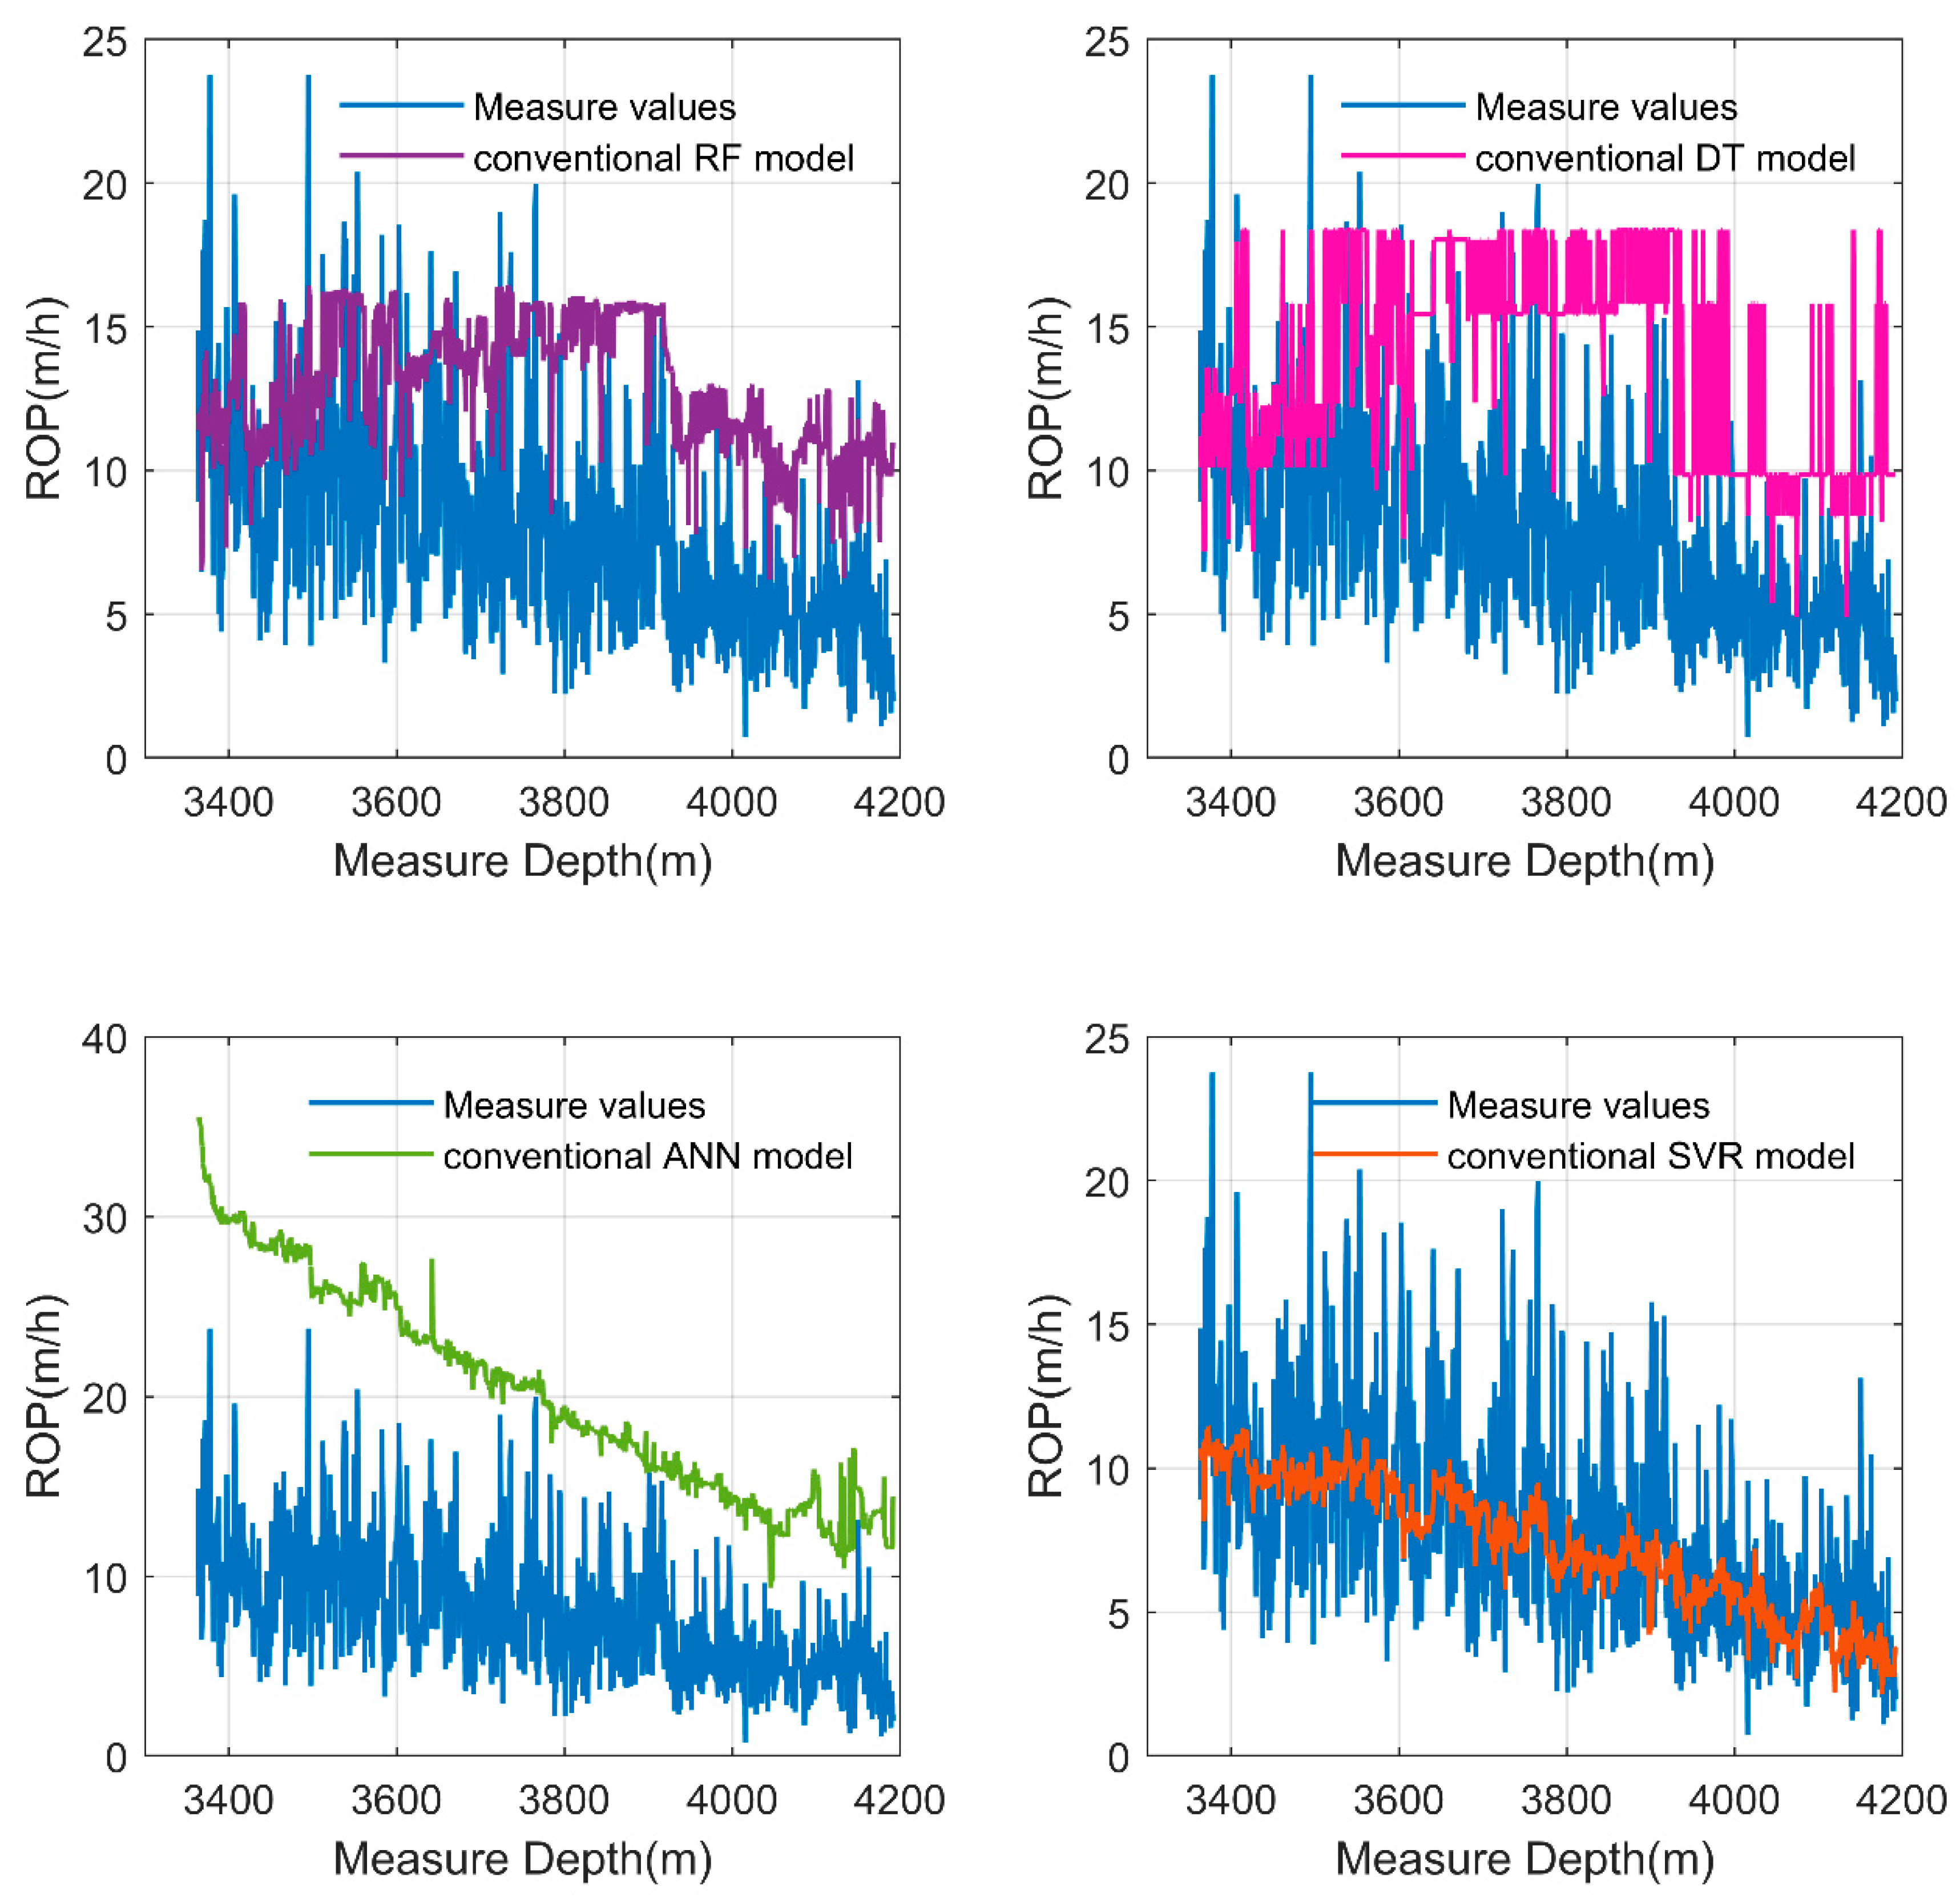
4.2. ROP Prediction Experiments

In this section, two sets of controlled experiments were designed. The first set of experiments utilized the original data from wells A1 to A3 as the training dataset and the original data from well A4 as the test dataset to assess the performance of the conventional model. The second set of experiments employed the corrected data from wells A1 to A3 as the training dataset and the corrected data from well A4 as the test dataset to evaluate the performance of the model proposed in this paper. The results of these two sets of experiments were compared to determine whether considering the friction torque improves the accuracy of the mechanical drilling rate prediction model.
Four different prediction methods, namely support vector regression (SVR), random forest (RF), artificial neural network (ANN), and decision tree (DT), were employed for conventional data-driven ROP prediction as well as data knowledge double-driven ROP prediction in horizontal wells. The performance of the proposed method was evaluated using the model predictions and the measured ROP data, as depicted in Figure 12 and Figure 13. The results presented in Figure 12 and Figure 13, along with the data summarized in Table 2, clearly demonstrate that the proposed data knowledge double-driven approach exhibits a superior capability to capture changes in ROP trends.
In conclusion, the proposed data knowledge double-driven ROP prediction method outperforms the conventional data-driven ROP prediction method. The application of this method in the Sichuan region has yielded promising results, further confirming the validity and reliability of the proposed approach.

4.3. Discussion

The results in Figure 12 and Figure 13 and Table 2 show that the data knowledge dual-driven method proposed in this paper has good prediction accuracy in horizontal wells. Numerically, the RF method has an RMSE of 1.08 and an R2 of 0.98, which meet the needs of drilling engineering. Compared with the measured ROP, the R2 of the proposed data knowledge dual-driven method is on average 30% better than the conventional data-driven ROP prediction method, and the RMSE and MAE are reduced by 50%. It is important to highlight that while techniques like data noise reduction, feature selection, ensemble learning, 10-fold cross-validation, and their integration can enhance the prediction accuracy of ROP, they do not address the fundamental challenge in horizontal well ROP prediction. The core issue lies in the direct impact of drilling parameters on the training data, which essentially determines the upper limit of model accuracy. Building the model based on downhole conditions requires considering factors like the friction coefficient, survey data, and drilling string, which need to be taken into account when applying the model to other wells.

5. Conclusions

For the complex drilling characteristics of horizontal wells, based on the drag and torque model and data-driven method, a data knowledge dual-driven horizontal well ROP prediction method is proposed, and the prediction accuracy of the method is improved by 30% compared with the conventional data-driven ROP prediction method. It shows that the method proposed in this paper can provide the basis for the intelligent optimization and management of ROP in the horizontal well drilling process. In the future, the horizontal well ROP prediction method is considered to be combined with online learning to study the horizontal well ROP prediction while drilling to improve the prediction accuracy of drilling ROP.

Author Contributions

Conceptualization, H.Y. and Q.L.; methodology, X.Z.; software, X.Z.; validation, X.Z. and H.Y.; formal analysis, X.Z.; investigation, X.Z.; resources, X.Z.; data curation, X.Z.; writing—original draft preparation, H.Y.; writing—review and editing, H.Y.; visualization, X.Z.; supervision, Q.L.; project administration, Q.L.; funding acquisition, Q.L. All authors have read and agreed to the published version of the manuscript.

Funding

This work was supported by the China National Key Research and Development Project (2019YFA0708302).

Institutional Review Board Statement

Not applicable.

Informed Consent Statement

Not applicable.

Data Availability Statement

Not applicable.

Conflicts of Interest

The authors declare no conflict of interest.

References

  1. Mahmoud, H.; Hamza, A.; Nasser, M.S.; Hussein, I.A.; Ahmed, R.; Karami, H. Hole cleaning and drilling fluid sweeps in horizontal and deviated wells: Comprehensive review. J. Petrol. Sci. Eng. 2020, 186, 106748. [Google Scholar] [CrossRef]
  2. Zhu, X.; Li, K.; An, J. Calculation and analysis of dynamic drag and torque of horizontal well strings. Nat. Gas Ind. B 2019, 6, 183–190. [Google Scholar] [CrossRef]
  3. Akgun, F. A finite element model for analyzing horizontal well BHA behavior. J. Petrol. Sci. Eng. 2004, 42, 121–132. [Google Scholar] [CrossRef]
  4. Wu, X.; Zhang, K. Three-dimensional trajectory design for horizontal well based on optimal switching algorithms. ISA Trans. 2015, 58, 348–356. [Google Scholar] [CrossRef] [PubMed]
  5. Najjarpour, M.; Jalalifar, H.; Norouzi-Apourvari, S. Half a century experience in rate of penetration management: Application of machine learning methods and optimization algorithms—A review. J. Petrol. Sci. Eng. 2022, 208, 109575. [Google Scholar] [CrossRef]
  6. Bingham, G. A new approach to interpreting rock drillability. Tech. Man. Repr. Oil Gas J. 1965, 93, 1965. [Google Scholar]
  7. Bourgoyne, A.T.; Young, F.S. A multiple regression approach to optimal drilling and abnormal pressure detection. Soc. Pet. Eng. J. 1974, 14, 371–384. [Google Scholar] [CrossRef]
  8. Hegde, C.; Daigle, H.; Millwater, H.; Gray, K. Analysis of rate of penetration (ROP) prediction in drilling using physics-based and data-driven models. J. Petrol. Sci. Eng. 2017, 159, 295–306. [Google Scholar] [CrossRef]
  9. Soares, C.; Daigle, H.; Gray, K. Evaluation of PDC bit ROP models and the effect of rock strength on model coefficients. J. Nat. Gas Sci. Eng. 2016, 34, 1225–1236. [Google Scholar] [CrossRef]
  10. Gan, C.; Cao, W.; Wu, M.; Chen, X.; Hu, Y.; Liu, K.; Wang, F.; Zhang, S. Prediction of drilling rate of penetration (ROP) using hybrid support vector regression: A case study on the Shennongjia area, Central China. J. Petrol. Sci. Eng. 2019, 181, 106200. [Google Scholar] [CrossRef]
  11. Gan, C.; Cao, W.; Wu, M.; Liu, K.; Chen, X.; Hu, Y.; Ning, F. Two-level intelligent modeling method for the rate of penetration in complex geological drilling process. Appl. Soft Comput. 2019, 80, 592–602. [Google Scholar] [CrossRef]
  12. Sabah, M.; Talebkeikhah, M.; Wood, D.A.; Khosravanian, R.; Anemangely, M.; Younesi, A. A machine learning approach to predict drilling rate using petrophysical and mud logging data. Earth Sci. Inform. 2019, 12, 319–339. [Google Scholar] [CrossRef]
  13. Gan, C.; Cao, W.; Liu, K.; Wu, M. A novel dynamic model for the online prediction of rate of penetration and its industrial application to a drilling process. J. Process Control 2022, 109, 83–92. [Google Scholar] [CrossRef]
  14. Elkatatny, S. Real-time prediction of rate of penetration while drilling complex lithologies using artificial intelligence techniques. Ain Shams Eng. J. 2021, 12, 917–926. [Google Scholar] [CrossRef]
  15. Keshavarz Moraveji, M.; Naderi, M. Drilling rate of penetration prediction and optimization using response surface methodology and bat algorithm. J. Nat. Gas Sci. Eng. 2016, 31, 829–841. [Google Scholar] [CrossRef]
  16. Jiang, W.; Samuel, R. Optimization of rate of penetration in a convoluted drilling framework using ant colony optimization. In Proceedings of the IADC/SPE Drilling Conference and Exhibition, Fort Worth, TX, USA, 1–3 March 2016. [Google Scholar] [CrossRef]
  17. Zhou, Y.; Chen, X.; Zhao, H.; Wu, M.; Cao, W.; Zhang, Y.; Liu, H. A novel rate of penetration prediction model with identified condition for the complex geological drilling process. J. Process Control 2021, 100, 30–40. [Google Scholar] [CrossRef]
  18. Soares, C.; Gray, K. Real-time predictive capabilities of analytical and machine learning rate of penetration (ROP) models. J. Petrol. Sci. Eng. 2019, 172, 934–959. [Google Scholar] [CrossRef]
  19. Abbas, A.K.; Rushdi, S.; Alsaba, M. Modeling rate of penetration for deviated wells using artificial neural network. In Proceedings of the Abu Dhabi International Petroleum Exhibition & Conference, Abu Dhabi, United Arab Emirates, 12–15 November 2018. [Google Scholar] [CrossRef]
  20. Hazbeh, O.; Aghdam, S.K.; Ghorbani, H.; Mohamadian, N.; Ahmadi Alvar, M.; Moghadasi, J. Comparison of accuracy and computational performance between the machine learning algorithms for rate of penetration in directional drilling well. Pet. Res. 2021, 6, 271–282. [Google Scholar] [CrossRef]
  21. Najjarpour, M.; Jalalifar, H.; Norouzi-Apourvari, S. The effect of formation thickness on the performance of deterministic and machine learning models for rate of penetration management in inclined and horizontal wells. J. Petrol. Sci. Eng. 2020, 191, 107160. [Google Scholar] [CrossRef]
  22. Kuang, Y.; Lin, W.; Liu, Y.; Wang, Q.; Zhang, J. Numerical modelling and field experimental validation of the axial load transfer on the drill-strings in deviated wells. J. Nat. Gas Sci. Eng. 2020, 75, 103124. [Google Scholar] [CrossRef]
  23. Liu, Y.; Ma, T.; Chen, P.; Yang, C. Method and apparatus for monitoring of downhole dynamic drag and torque of drill-string in horizontal wells. J. Petrol. Sci. Eng. 2018, 164, 320–332. [Google Scholar] [CrossRef]
  24. Guan, Z.; Liu, Y.; Liu, Y.; Xu, Y. Hole cleaning optimization of horizontal wells with the multi-dimensional ant colony algorithm. J. Nat. Gas Sci. Eng. 2016, 28, 347–355. [Google Scholar] [CrossRef]
  25. El Sabeh, K.; Gaurina-Međimurec, N.; Mijić, P.; Medved, I.; Pašić, B. Extended-Reach Drilling (ERD)—The Main Problems and Current Achievements. Appl. Sci. 2023, 13, 4112. [Google Scholar] [CrossRef]
  26. Tunkiel, A.T.; Sui, D.; Wiktorski, T. Training-while-drilling approach to inclination prediction in directional drilling utilizing recurrent neural networks. J. Petrol. Sci. Eng. 2021, 196, 108128. [Google Scholar] [CrossRef]
  27. Chen, X.; Fan, H.; Guo, B.; Gao, D.; Wei, H.; Ye, Z. Real-time prediction and optimization of drilling performance based on a new mechanical specific energy model. Arab. J. Sci. Eng. 2014, 39, 8221–8231. [Google Scholar] [CrossRef]
  28. Johancsik, C.A.; Friesen, D.B.; Dawson, R. Torque and Drag in Directional Wells-Prediction and Measurement. J. Pet. Technol. 1984, 36, 987–992. [Google Scholar] [CrossRef]
  29. Motahhari, H.R.; Hareland, G.; James, J.A. Improved drilling efficiency technique using integrated PDM and PDC bit parameters. J. Can. Pet. Technol. 2010, 49, 45–52. [Google Scholar] [CrossRef]
  30. Alali, A.M.; Abughaban, M.F.; Aman, B.M.; Ravela, S. Hybrid data driven drilling and rate of penetration optimization. J. Petrol. Sci. Eng. 2021, 200, 108075. [Google Scholar] [CrossRef]
  31. Hegde, C.; Soares, C.; Gray, K. Rate of penetration (ROP) modeling using hybrid models: Deterministic and machine learning. In Proceedings of the Unconventional Resources Technology Conference, Houston, TX, USA, 23–25 July 2018. [Google Scholar] [CrossRef]
Figure 1. Schematic diagram of the horizontal well drilling process.
Applsci 13 11396 g001
Figure 2. Force analysis for three-dimensional well section unit.
Applsci 13 11396 g002
Figure 3. Friction coefficient inversion process: (Left) sliding drilling, (Right) rotary drilling.
Applsci 13 11396 g003
Figure 4. Friction coefficients computed results.
Applsci 13 11396 g004
Figure 5. Surface WOB and corrected WOB.
Applsci 13 11396 g005
Figure 6. Surface RPM and corrected RPM.
Applsci 13 11396 g006
Figure 7. Correlation analysis results of drilling data.
Applsci 13 11396 g007
Figure 8. Horizontal well ROP prediction method.
Applsci 13 11396 g008
Figure 9. Data knowledge dual-driven ROP model in horizontal well.
Applsci 13 11396 g009
Figure 10. Conventional data-driven ROP model.
Applsci 13 11396 g010
Figure 11. Horizontal projection map of a multi-well pad targeting area.
Applsci 13 11396 g011
Figure 12. ROP prediction results of the proposed model and measurement.
Applsci 13 11396 g012
Figure 13. ROP prediction results of conventional model and measurement.
Applsci 13 11396 g013
Table 1. Results of statistical analyses of drilling data.
WellFootage (m)Data Amount (Number)Percentage (%)
SlidingRotatingSlidingRotatingRotating DataRotating Footage
A169.56631.9950,66675,73459.92%90.08%
A274.44684.0467,02677,13053.50%90.19%
A393.32697.462,35473,43854.08%88.20%
A4112.9690.683,67469,46345.36%85.95%
Table 2. Performance evaluation results of the two methods.
Proposed MethodR2RMSEMAEConventional MethodR2RMSEMAE
RF0.961.080.65RF0.651.871.31
ANN0.951.120.71ANN0.552.11.53
DT0.931.210.75DT0.522.181.53
SVR0.941.20.68SVR0.61.981.38
Disclaimer/Publisher’s Note: The statements, opinions and data contained in all publications are solely those of the individual author(s) and contributor(s) and not of MDPI and/or the editor(s). MDPI and/or the editor(s) disclaim responsibility for any injury to people or property resulting from any ideas, methods, instructions or products referred to in the content.

