Article

Topology Optimisation of Structural Steel with Non-Penalisation SEMDOT: Optimisation, Physical Nonlinear Analysis, and Benchmarking

1
Department of Civil Engineering and Architecture, University of Beira Interior, 6201-001 Covilhã, Portugal
2
Department of Mechanical Engineering, University of Alberta, Edmonton, AB T6G 1H9, Canada
3
School of Engineering, Faculty of Science Engineering and Built Environment, Deakin University, Geelong, VIC 3216, Australia
*
Author to whom correspondence should be addressed.
Appl. Sci. 2023, 13(20), 11370; https://doi.org/10.3390/app132011370
Submission received: 27 September 2023 / Revised: 10 October 2023 / Accepted: 13 October 2023 / Published: 17 October 2023
(This article belongs to the Special Issue Additive Manufacturing for Architectural and Structural Design)

Abstract

:
In this work, Non-penalisation Smooth-Edged Material Distribution for Optimising Topology (np-SEMDOT) algorithm was developed as an alternative to well-established Topology Optimisation (TO) methods based on the solid/void approach. Its novelty lies in its smoother edges and enhanced manufacturability, but it requires validation in a real case study rather than using simplified benchmark problems. To such an end, a Sheikh-Ibrahim steel girder joint’s tension cover plate was optimised with np-SEMDOT, following a methodology designed to ensure compliance with the European design standards. The optimisation was assessed with Physical Nonlinear Finite Element Analyses (PhNLFEA), after recent findings that topologically optimised steel construction joint parts were not accurately modelled with linear analyses to ensure the required highly nonlinear ultimate behaviour. The results prove, on the one hand, that the quality of np-SEMDOT solutions strongly depends on the chosen optimisation parameters, and on the other hand, that the optimal np-SEMDOT solution can equalise the ultimate capacity and can slightly outperform the ultimate displacement of a benchmarking solution using a Solid Isotropic Material with Penalisation (SIMP)-based approach. It can be concluded that np-SEMDOT does not fall short of the prevalent methods. These findings highlight the novelty in this work by validating the use of np-SEMDOT for professional applications.

1. Introduction

Topology Optimisation (TO) has reached maturity for practical applications in numerous industries after almost thirty-five years of cutting-edge research [1,2,3,4]. This era was leveraged by seminal research by Bendsøe and Kikuchi in developing the now classic homogenisation methods [5,6], and by Suzuki and Kikuchi [7], who solved Kohn and Strang’s material distribution problem [8,9,10,11]. However, despite significant developments, the current density-based TO algorithms continue to create optimised structures that are non-manufacturable. Hence, the latest research has been pursuing other solutions for attaining smoother edges and potential manufacturable outcomes. Within these endeavours, one option is the Smooth-Edged Material Distribution for Optimising Topology (SEMDOT) algorithm [12] and its subsequent non-penalisation (np-SEMDOT) version [13].
Considering the promising results delivered by np-SEMDOT in terms of both optimisation and surface quality [13], its usage in real-world applications and the validation of its ultimate behaviour have been regarded as vital with regard to its adoption within the industry sector.
While TO is already a fundamental step in the industrial design of products for such sectors as automotive, defence, aerospace, medical devices, and new materials design, it is yet to become commonplace in civil and large structural engineering endeavours. Hence, as we face the dawn of TO usage for construction [14], influenced not only by architects’ taste for genuine and meaningful shapes [15,16,17,18] but also by the progress made in code-compliant TO [19,20,21] and TO for multiple loadings [22,23,24,25,26,27,28,29], civil engineering structures can be regarded as the ideal ground for testing new TO solutions.
To address the need for assessment with physically nonlinear analyses of topologically optimised parts subjected to extreme loading for each TO method, this paper investigated the optimisation of the well-known Sheikh-Ibrahim [30] connection’s tension plate. The np-SEMDOT method was benchmarked against the ubiquitous and reliable Solid Isotropic Material with Penalisation (SIMP)-based optimisation tool provided by TOSCA software. The benchmark used the conditions depicted in [21] and the solutions were compared with the Physical Nonlinear Finite Element Analyses (PhNLFEA) solution.
The novel results were expected to provide significant and well-founded conclusions on the usability of TO in steel design, as well as on the prospects of np-SEMDOT.
This work’s main contributions can be considered to validate the use of the np-SEMDOT algorithm for a real-world case study. It was found that np-SEMDOT optimisations slightly outperformed SIMP-based optimisations for the current case, and showed that np-SEMDOT solutions performed adequately in nonlinear conditions until collapse with a remarkable displacement capacity. It was concluded that performing a preliminary parametric analysis was essential to ensure np-SEMDOT solution quality and that the np-SEMDOT solution enhanced the smoothness of the internal voids’ edges, facilitating its manufacture.
In this paper, after introducing the theme and related work and providing a brief on np-SEMDOT in Section 3, the case study is depicted in Section 4. Research methods, including the general methodology for structural code compliant TO and the specific protocol for SEMDOT optimisation and parametric analyses, are explained in Section 5. The results are presented and discussed in Section 6, and conclusions are detailed in Section 7.

2. Related Work

Within the construction industry, steel design, and specifically connections, show an unmatched potential for adding value with TO. Contrary to previous work, where complex properties have delayed the widespread use of TO [31,32,33,34,35,36,37,38,39], steel alloys tend to show isotropic properties for tension and compression stresses, except for buckling failure, which can be restricted with smart design approaches. The usage of TO techniques is facilitating the growth of Additive Manufacturing (AM), which can create manufacturable structures from TO results [40]. Moreover, the potential for weight reduction in connections is substantial [41], as is the prospect of developing new connection concepts [42,43,44,45,46].
However, recent research on the ultimate behaviour of topologically optimised parts of steel connections revealed that the physical nonlinear behaviour of these slender elements can differ critically from their linear behaviour [21]. This can be a considerable problem for topologically optimised structural elements intended to function under extensive levels of damage and deliver substantial ductility to the parent structural systems, since the most widespread TO techniques are linear. Despite the fact that the shortcomings of TO for nonlinear problems are well-documented [42], recent evidence suggests that the ultimate capacity of topologically optimised parts in steel connections must rely on non-linear analyses [21].
While TO remains fundamentally linear in most current methods, nonlinear TO endeavours have recently gained momentum. This is the case with recent codes in FreeFEM [47] by Zhu et al. and Matlb by Zhao et al. [48]. Moreover, a few recent developments, such as Sun and Lueth’s three-dimensional TO method for flexure joints [49], geometrically nonlinear BESO [50], progress in specific issues of nonlinear TO, such as the moving morphable components method [51], and the employment of the Sigmoid function for adaptive moving material [52], moving Wide-Beìzier components [53] or positional finite elements [54] have paved the way for broader use of nonlinear TO in design.

3. Non-Penalisation Smooth-Edged Material Distribution for Optimising Topology

The Smooth-Edged Material Distribution for Optimising Topology (SEMDOT) method proposed by Fu et al. [12] is a newly developed optimisation tool that is capable of forming smooth topological boundaries without needing any post-processing treatments, such as shape optimisation, before fabrication. This improves the manufacturability of the obtained topologies; hence, SEMDOT is widely used in Design for Additive Manufacturing (DfAM) [55,56,57]. Most recently, Fu et al. [13] improved SEMDOT by removing the material penalisation scheme. Compared to penalised SEMDOT, the structural performance and the convergency of non-penalised SEMDOT are significantly improved. Although the effectiveness of non-penalised SEMDOT is validated by representative benchmark problems [13], non-penalised SEMDOT has not been used to solve real-world optimisation problems yet. This work aims to adopt non-penalised SEMDOT to conduct the optimisation of the Sheikh-Ibrahim’s connection tension cover plate.
SEMDOT forms a smooth topological boundary based on the solid/void design of the grid points that are independently assigned to each element [12,13]. In SEMDOT, the Young’s modulus of a grid point is calculated by:
E e ρ e , g = ρ e , g E 1
where ρ e , g is the scaling value of the g th grid point assigned to the e th element, which is named the grid point density; E e ρ e , g is the function of the Young’s modulus with respect to grid point densities; and E 1 is the Young’s modulus of the solid material.
To conduct finite element analysis in SEMDOT, elemental volume fractions that depend on grid point densities are defined as surrogate design variables, which have the form:
X e = 1 N g = 1 N ρ e , g
where X e is the volume fraction of the e th element and N is the total number of grid points in each element.
Based on Equations (1) and (2), the stiffness matrix of a solid or void element is:
K e X e = X e K e 1
where K e 1 is the stiffness matrix of the solid element.
In SEMDOT, the boundary elements are artificially defined as the non-homogenised combination of solid and void materials, and therefore elemental stiffness matrices are estimated using a linear interpolation between the two phases of solid and void:
K e X e = 1 X e K e 0 + X e K e 1
where K e 0 is the stiffness matrix of the void element.
To avoid mesh dependency and checkerboard patterns, the filtering for elemental volume fractions X e is
X ~ e = l = 1 N e ω e l X l l = 1 N e ω e l
where X ~ e is the filtered elemental volume fraction; N e is the neighborhood set of elements within the filter domain for the e th element, which is a circle at the center of this element with a given filter radius r m i n ; and ω e l is a weight factor, which is calculated by
ω e l = m a x 0 , r m i n e , l
where e , l is the center-to-center distance of the l th element within the filter domain to the e th element.
Nodal densities are obtained by:
ρ n = e = 1 M ω n e X ~ e e = 1 M ω n e
where ρ n is the density of the n th node, M is the total number of elements, and ω n e is the weight factor defined as
ω n e = m a x 0 , R m i n n , e
where n , e is the distance between the n th node and the center of the e th element and R m i n is the filter radius. In SEMDOT, R m i n is generally set to 1.
Taking a four-node element as an example, grid point densities ρ ξ , η are calculated using the linear interpolation of nodal densities ρ n :
ρ ξ , η = γ = 1 4 N γ ξ , η ρ n γ ,           ρ ξ , η ρ x , y
where ξ , η is the local coordinate of grid points, ρ n γ is the density for the γ th node of the element, and N γ ξ , η is a shape function.
The Heaviside smooth function is employed to yield solid/void grid points, which is expressed by:
ρ e , g = t a n h β · φ + t a n h β · ρ x , y φ t a n h β · φ + t a n h β · 1.0 φ
where φ is the threshold value, x , y is the global coordinate of grid points, and ρ x , y is the grid point density at x , y .
In the Heaviside smooth function, the scaling parameter β is updated by:
β k = β k 1 + E R
where k is the current iteration, and E R is the evolution rate.
The boundary is implicitly represented with a level-set function Φ x , y :
Φ x , y = ρ x , y φ > 0                           for   solid ρ x , y φ = 0         for   boundary ρ x , y φ < 0                             for   void
where Φ x , y is the level-set function for grid points.
For the next iteration, X ~ e is updated by assembling grid points:
X ~ e n e w = 1 N g = 1 N ρ e , g n e w
where ρ e , g n e w is the updated grid point density.
In SEMDOT, there are two termination criteria: the overall topological alteration and topological boundary error. The overall topological alteration is:
e = 1 M X e k X e k 1 e = 1 M X e k 0.001
The topological boundary error is:
ε = N v M 0.001
where ε is the topological boundary error and N v is the number of intermediate elements that are not along boundaries.

4. Case-Study

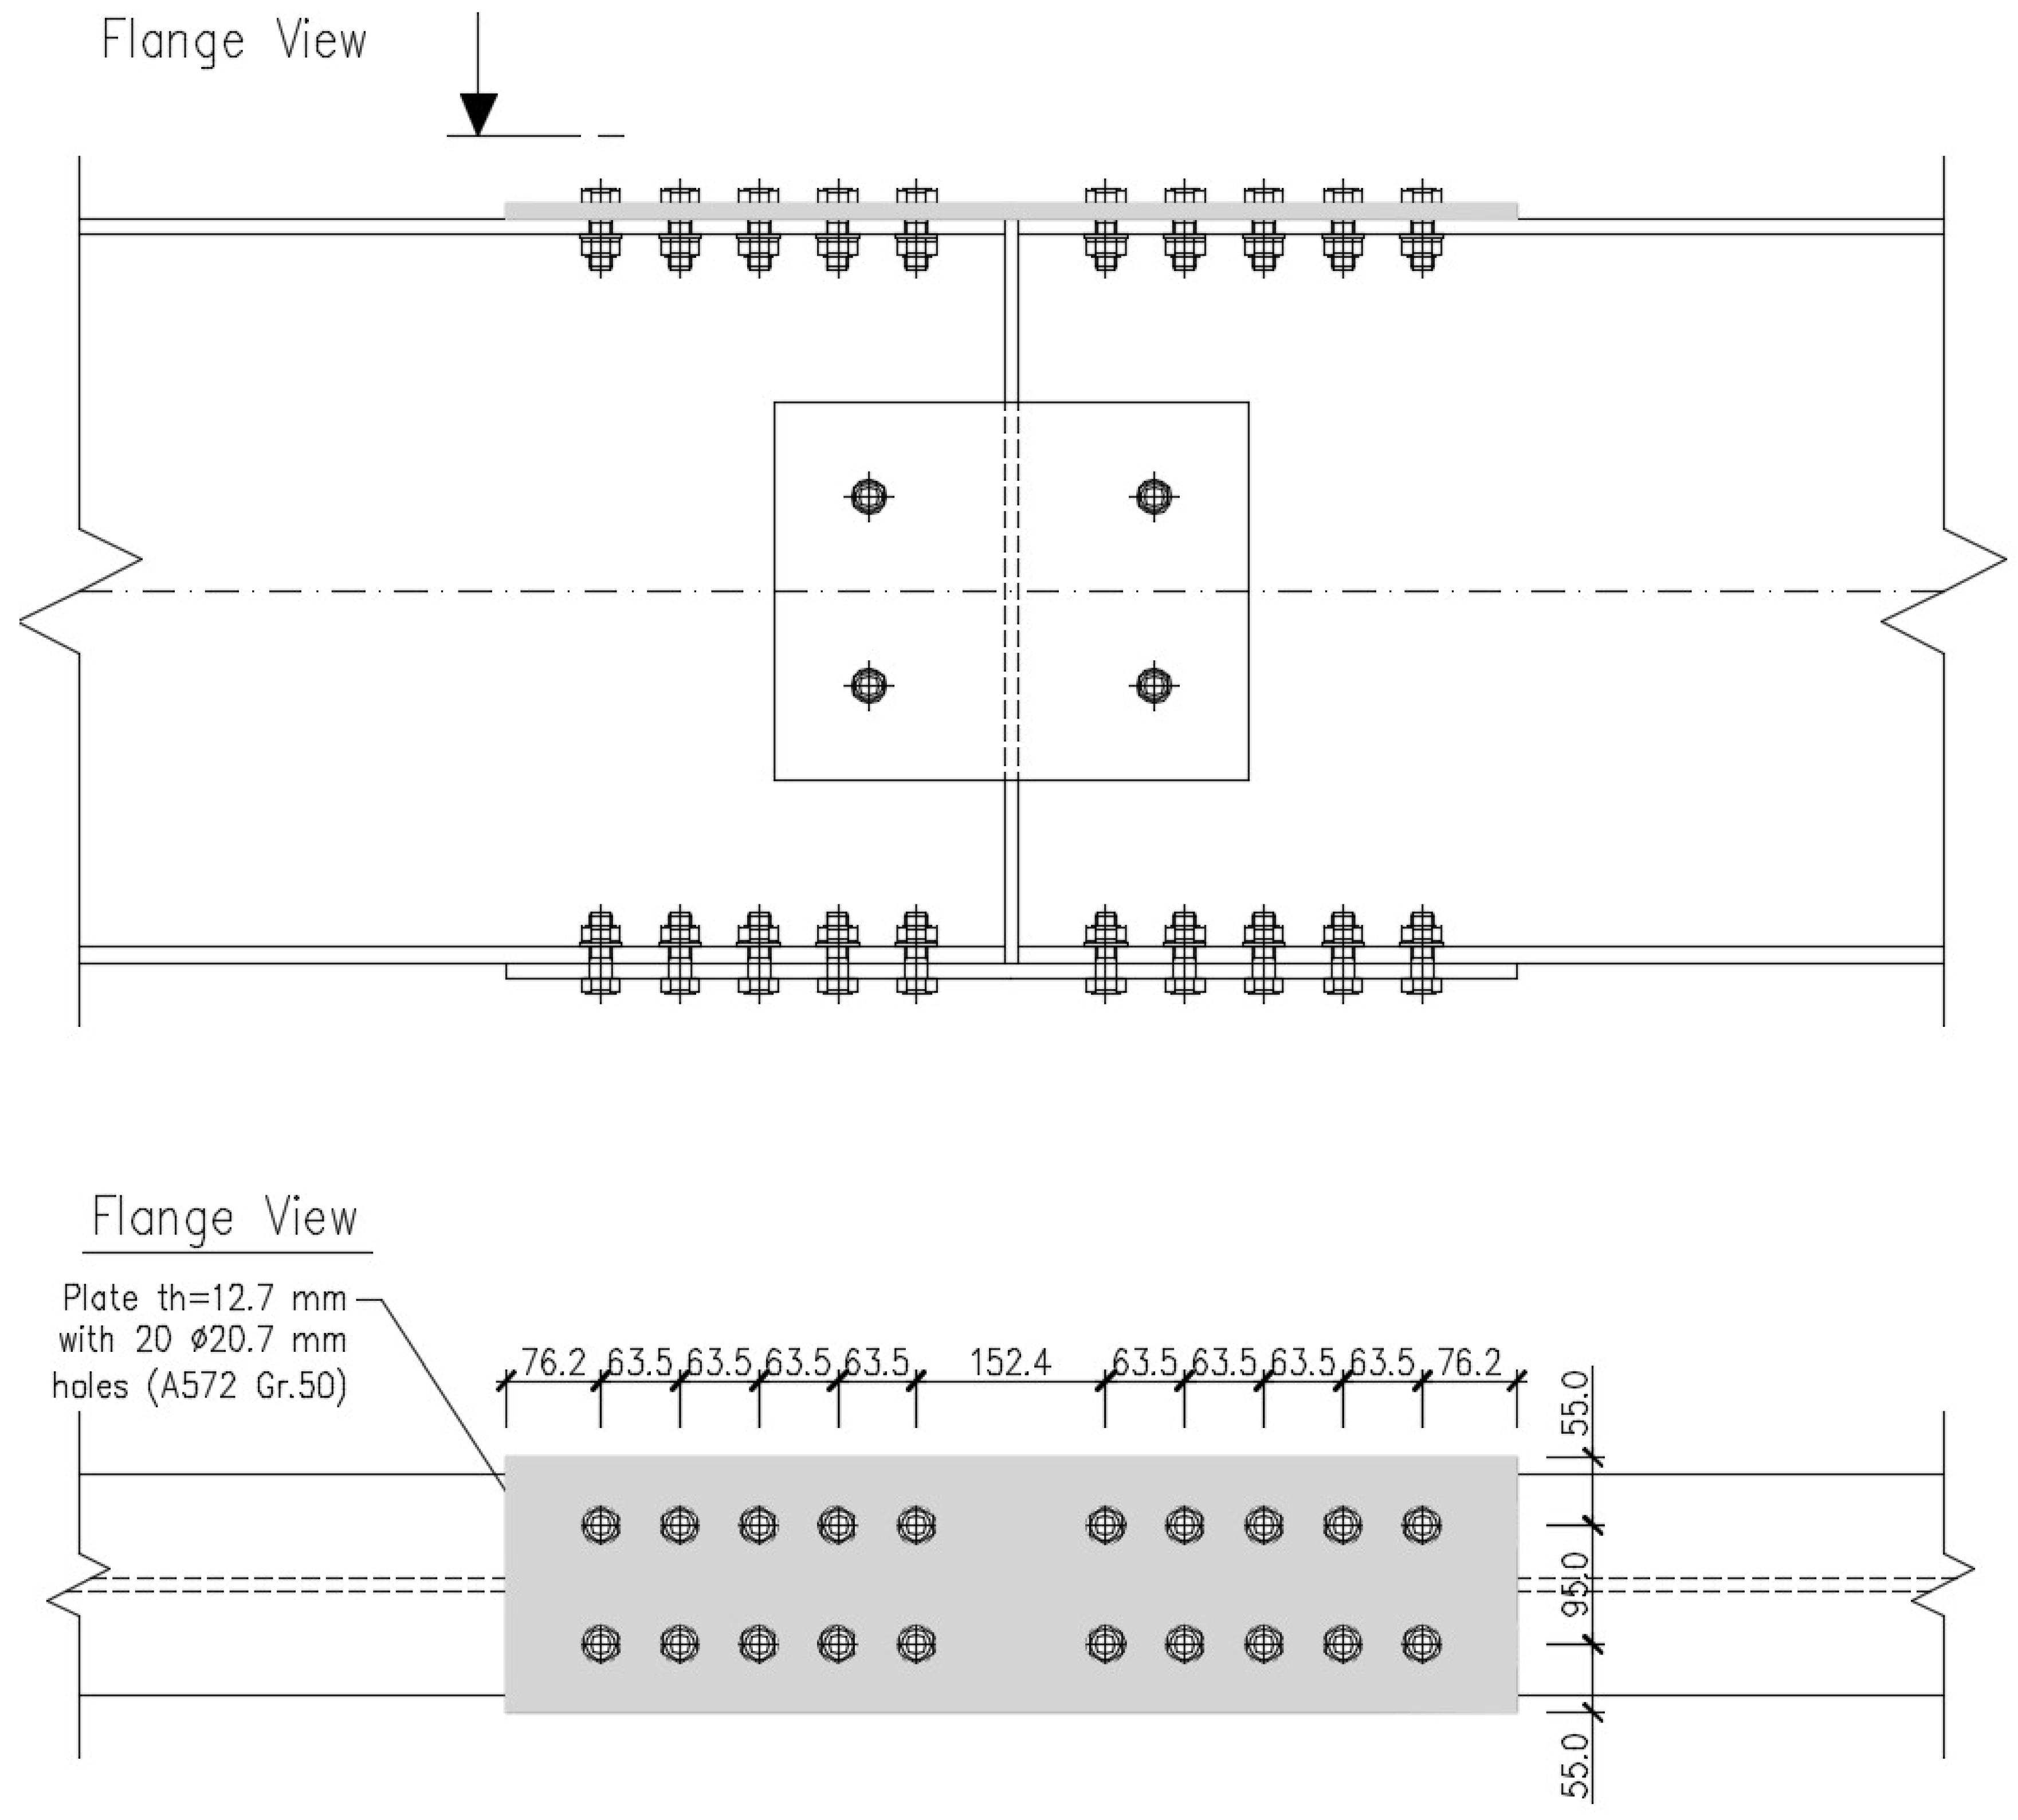
4.1. Sheikh-Ibrahim’s Steel Beam Splice Connection

4.1.1. Geometry

One of the most well-known splice connections in steel girders is the one used by Sheikh-Ibrahim in an experimental programme held at the University of Texas at Austin [30]. This experimental programme is well-known for its role in providing a seminal work on the design of cover plate connections [58,59]. Consequently, after a careful assessment of the programme’s case representativity, Case 1 (out of 32) has been considered the ideal one for a reference connection [21] on which parts optimisation can be assessed and benchmarked.
As shown in Figure 1, where the dimensions are in millimetres, two W24 × 7 × 55 beam segments in A36 steel [60] were joined with two flanges and two web cover plates to resist bending moments and shear loading. The flanges contained cover plates just on their outside surface, allowing them to withstand in-plane loading through the bolts’ simple shear, as shown in Figure 1. These A572 Grade 50 steel [61] splices were 812.8 mm long, 12.7 mm thick, and 205 mm broad, which was 27 mm greater than the width of the beam flange. Their twenty A325 steel bolts were 19.1 mm in diameter and fit into 20.7 mm holes. The flange bolts were positioned in two columns with an expected spacing of 95 mm. Within each column, the bolt spacing was 63.5 mm, and the distance to plate edges was 76.2 mm.
For the reference case, bolt tightening did not involve preloading. The load transfer mechanism was, therefore, ensured by bolt shear. Thence, flange splices are deemed to resist the total applied bending moment, and web splices will resist the applied shear if the flange splices can withstand the total applied moment, as confirmed with the laboratory testing [30].

4.1.2. Material Modelling

Accurate PhNLFEA relies on detailed non-linear material models that include both plasticity and damage. Both standard-defined limit thresholds and information on plausible steel properties are needed to establish these models. Pertaining to the former, the case study steel grade was 50 as per the ASTM A572/A572M standard [61], with a minimum yield strength of 345 MPa, a minimum ultimate strength of 450 MPa, and an elongation no less than 0.18 for a 200 mm gauge and 0.21 for a 50 mm gauge.
Representative values for this alloy’s commercial properties can be found in steel mill test data reports [62] and several research publications [63], including the aforementioned Sheikh-Ibrahim’s works in [30,58].
Moreover, steel properties models are available, such as FHWA-HRT-17-04′s [59], but require sufficient experimental data to calibrate them.
Consequently, a trilinear hardening model, as presented in Figure 2, was suggested. Its Young’s modulus first stage was elastic with E0 = 199.9 GPa, the second stage showed plastic hardening behaviour with a plastic modulus of E = E0/339, and the last stage showed softening (damage) of the instantaneous modulus with E = E0/1000. A standard isotropic yield model was coupled with the non-linear hardening model. The former values were attained, establishing the ASTM A572/A572M standard values as a lower bound and accounting for the published experimental data. This model was named the “Material model, Trilinear with fictitious hardening” and will be employed for the nonlinear analyses.

5. Methods

5.1. General Optimisation Methodology

Both the SEMDOT and TOSCA optimisation procedures followed the methodology for code-compliant TO of tension parts of connections proposed and validated in [21].
This methodology synthesises a plethora of parameters, including collapse modes, code-defined prescriptions, practical geometry issues, and manufacturability constraints, into optimisable and non-optimisable volumes, allowing for an optimised solution that meets the criteria for a fully compliant and professionally designed connection part.

5.2. SEMDOT Optimisation Protocol

Compliance minimisation or stiffness maximisation is taken as the objective function for Sheikh-Ibrahim’s connection tension cover plate. This choice is related to the nature of the problem. Connections in steel construction are deemed to provide continuity to parts that cannot be manufactured as a single piece. Hence, connections must provide the required strength and ductility—or elongation capacity in the case of cover plates—but also stiffness, because a singularity provided by its decrease in rigidity could jeopardise the idealised global structural behaviour, change the internal forces distribution and compromise the serviceability criteria. Therefore, stiffness maximisation should be embedded in the TO process to avoid reaching solutions that match ultimate strength and elongation criteria but fail to ensure this significant property for steel construction connections.
The optimisation problem can be stated as:
m i n : C X e = f T u
s u b j e c t   t o : K X e u = f
e = 1 M   X e V e e = 1 M   V e V * 0
0 < ρ m i n X e 1 : e = 1 ,   2 ,   ,   M
where C X e is the objective function; f and u are global force and displacement vectors, respectively; K X e is the global stiffness matrix; V e is the volume of the e th element; and V * is the target volume.
The sensitivities can be estimated by:
C X e X e 1 X e C X e X e X e = ρ m i n + X e C X e X e X e = 1 = 1 X e ρ m i n + X e u e T K e 1 u e
where u e is the displacement vector of the e th element.
As several impactful choices must be made within an optimisation process, parametric analyses were conducted to find the best result while avoiding significant computational efforts. Hence, the filter radius r m i n and evolution rate E R were tested within the relevant ranges. Other parameters were kept fixed after a previous investigation on SEMDOT [12,13].

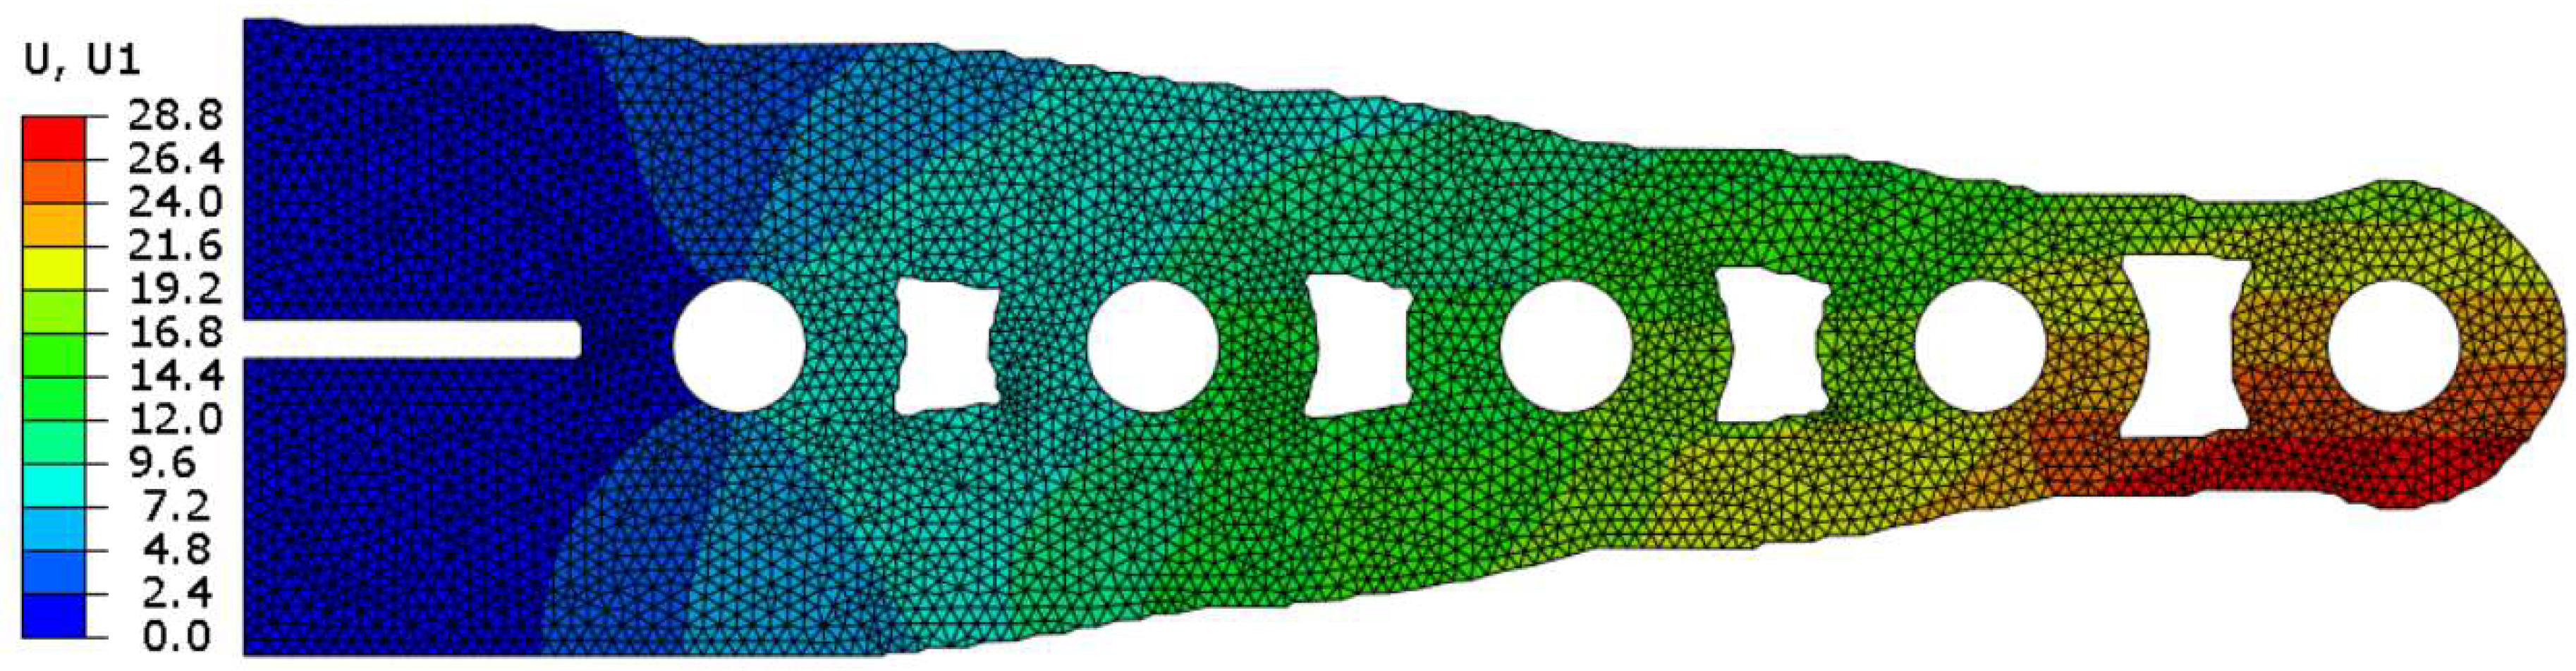
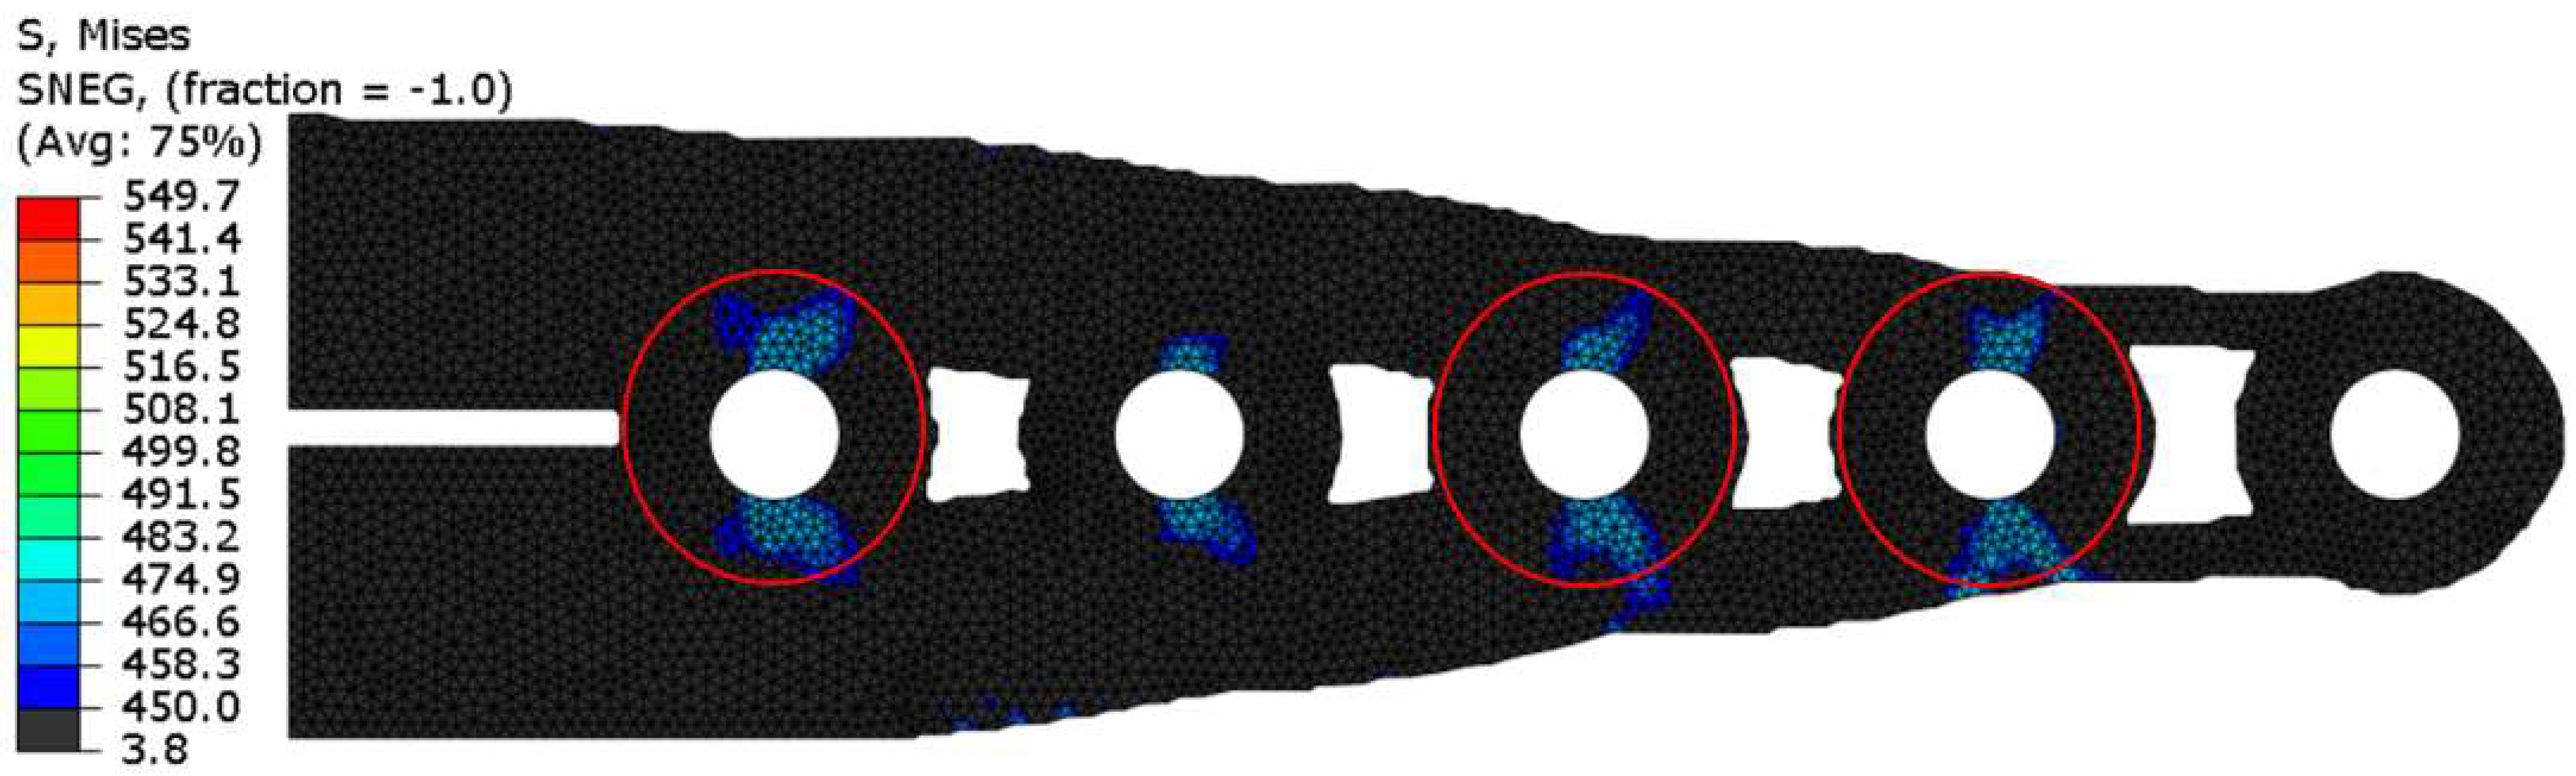
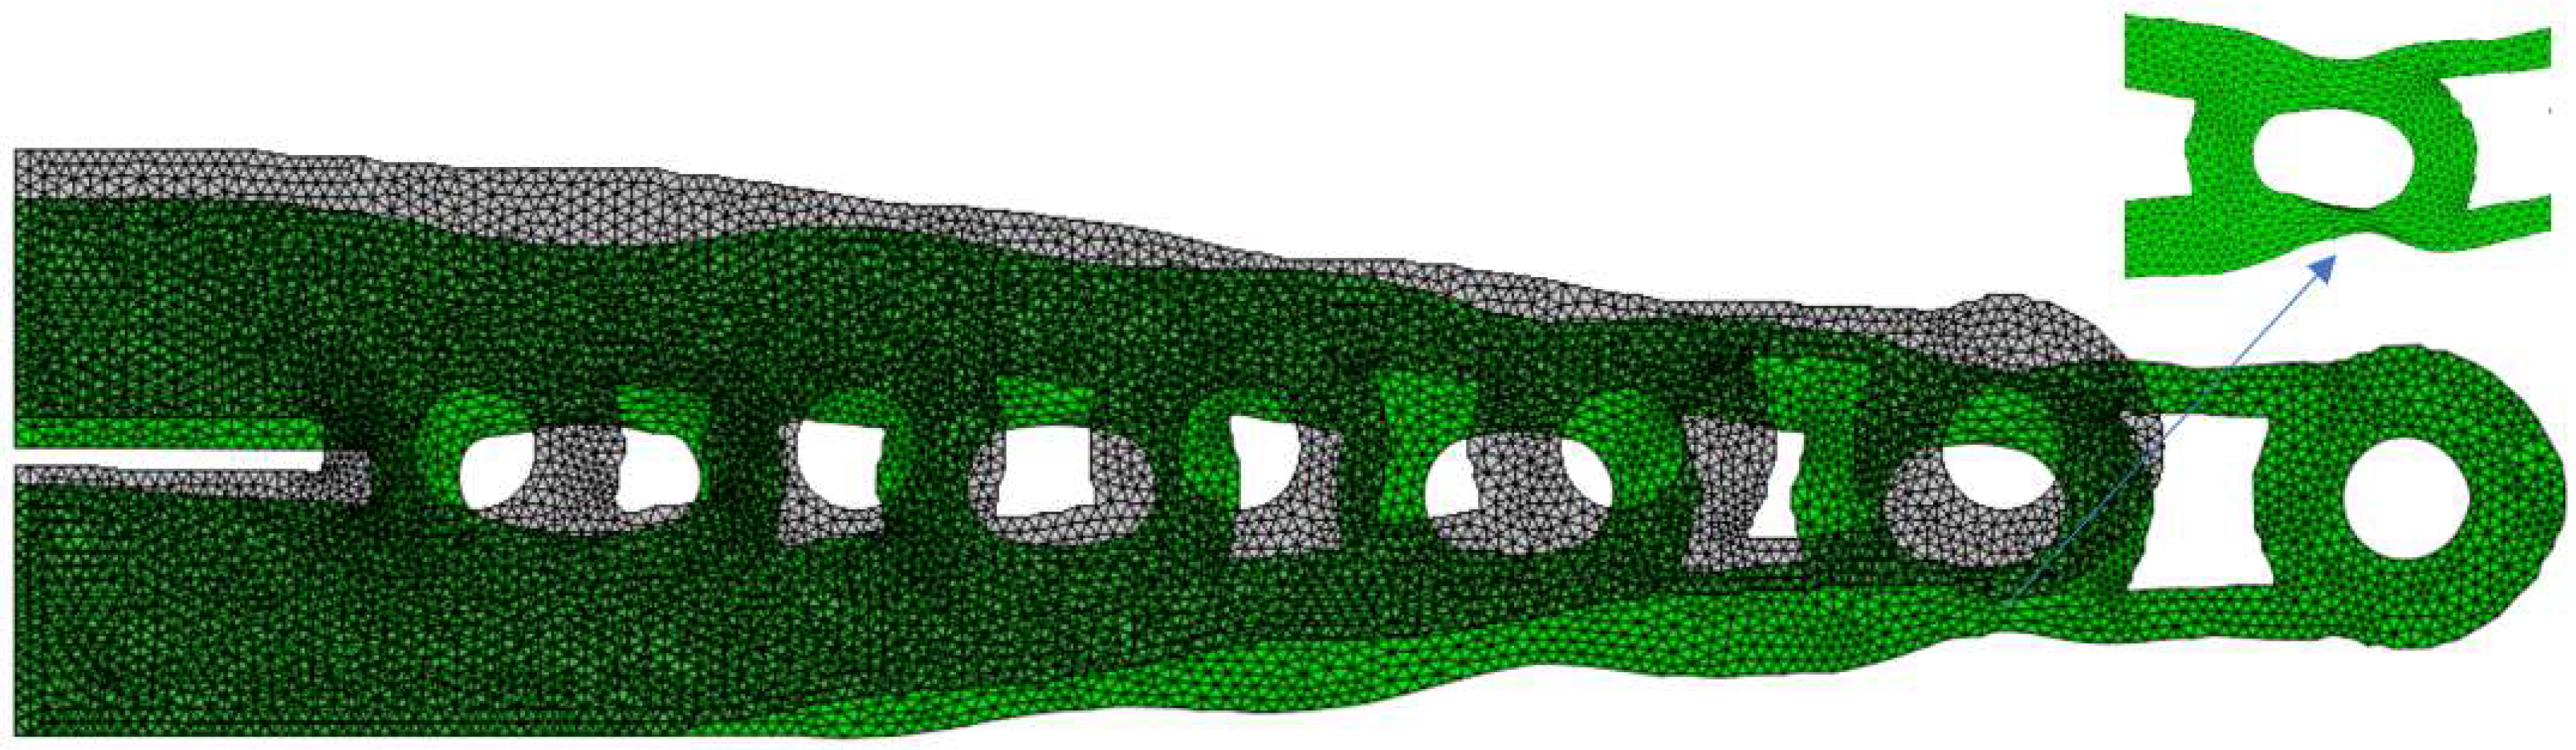
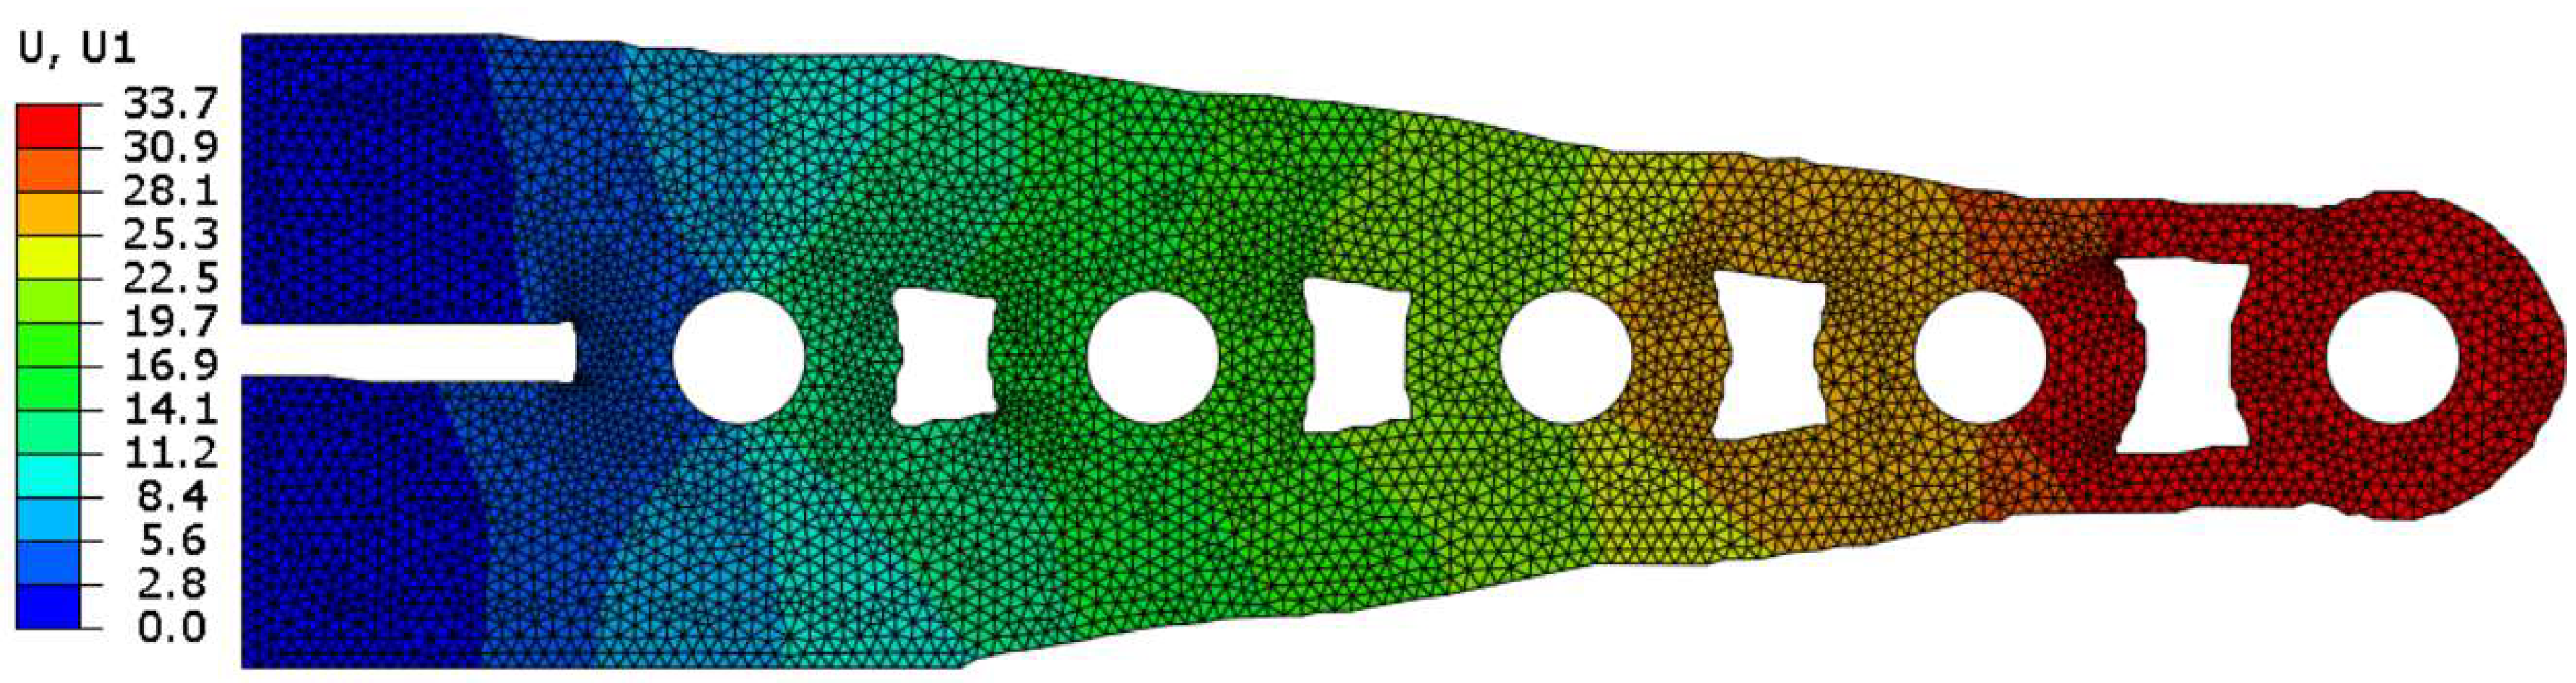
5.3. Structural Assessment with Physically Nonlinear Finite Element Analyses

Optimised solutions were assessed for ultimate behaviour, accounting for the material’s (physically) nonlinear model. To such an end, the Dassault Systèmes Abaqus/CAE 2017 FEA package was employed.
Abaqus FEA package has a reliable track record on advanced nonlinear analysis of complex steel parts [64,65,66,67], including topologically optimised parts [68], using Newton, modified Newton, and quasi-Newton methods.
Following thorough mesh tests on the plate’s non-optimised geometry [21], a triangular quadratic finite-element free mesh using STRI65 elements was installed in a partitioned base geometry. This mesh application for the np-SEMDOT optimised geometry is depicted in Figure 3. Node spacing is approximately 2.5 mm.
To simulate the contact load between the bolt shanks and the plate’s holes, sinusoidal distributed loading was applied on the holes’ half-perimeter, as shown in Figure 4. Further reasoning for this approach can be found in [21,30].
Load increments were set as 0.5% of the total load for each simulation in order to avoid convergence issues in the last steps.
It is important to note that FEA was performed upon the optimised solutions’ quarters (as depicted in Figure 3). The rationale for this decision lay in the computational convenience of running smaller models, ensuring better time management, but also in the fact that the optimised solution was symmetrical to both main axes, enabling the double symmetry property principle, and the fact that the exact equivalence between the behaviour of the quarters and complete models had already been proven [21].

5.4. Benchmarking

Assessing the quality, manufacturability, and practicality of the np-SEMDOT solutions requires a thorough comparison with the state-of-the-art methods with respect to potential mass employment.
To such an end, the behaviour of this optimised solution was compared with the one found for the SIMP-optimised plates. The SIMP (Solid Isotropic Microstructure—or Material—with Penalisation) [1] method was pursued in Dassault Systèmes TOSCA Structure software, with a penalty factor of 3 [69,70], running in a Dassault Systèmes Abaqus environment [71].
The reason for establishing such a solution as the benchmark was because of the completeness and readiness of the TO software package, the reliability provided by the extensively tested Abaqus environment, and the ubiquity of SIMP applications as the leading one for current TO.
Given previous results that proved that a SIMP-based optimisation of the current tension plate could ensure an ultimate capacity that matched the joint ultimate capacity with a volume fraction (of the original plate) of 55%, current np-SEMDOT optimisations were carried out also for a volume fraction of 55%.
Benchmarking after PhNLFEA will discuss the comparison between the solution’s ultimate capacity and behaviour optimised by np-SEMDOT and the TOSCA counterparts.

6. Results and Discussion

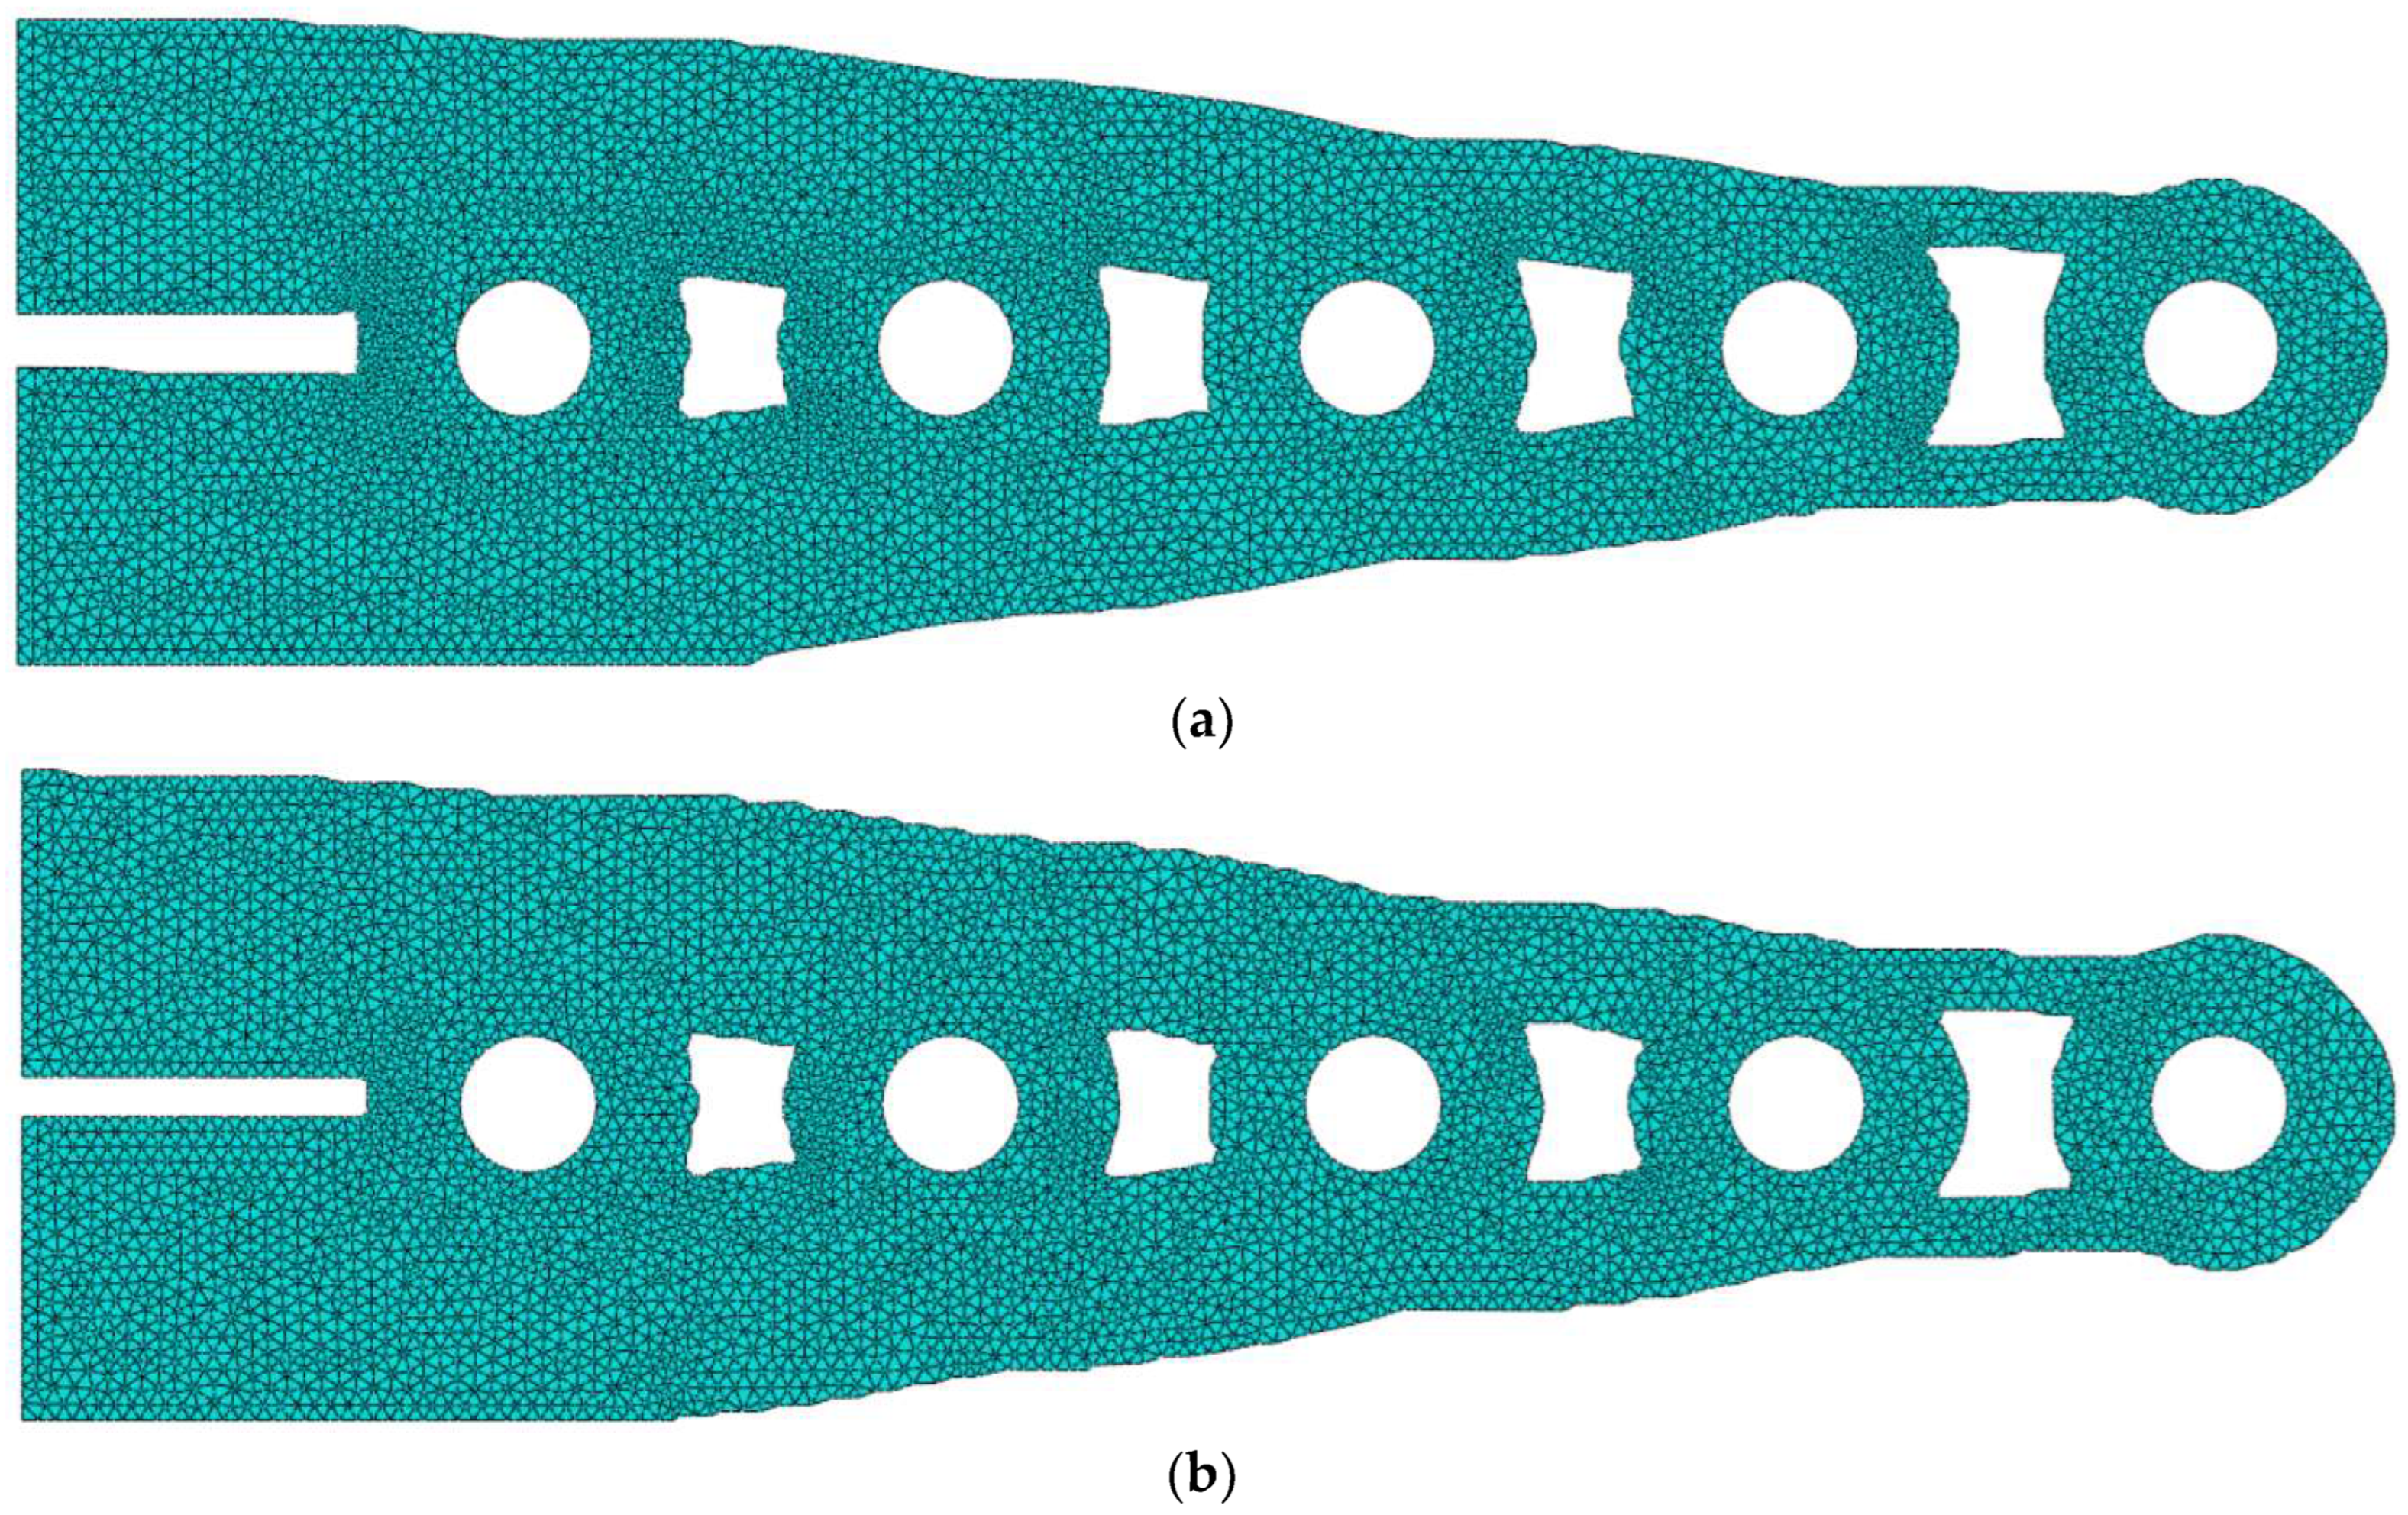
6.1. Optimised Topologies Using Non-Penalisation SEMDOT

A parametric study on the filter radii was performed for the same evolution rate (ER = 0.50). It has been shown that decreasing the radius had the expected beneficial effect on reducing the computation time by reducing the number of iterations (from 175 to 155, 120 and 101) without losing quality for the solution until rmin = 2 (Figure 5). On the other hand, for rmin = 1, which is not a usual value for TO, the solution’s quality was impacted (with 68 iterations). Firstly, the smoothness of its edges and its manufacturability was compromised.
A further parametric investigation was performed to investigate the effect of evolution rate variations, keeping rmin = 2 and testing ER values above and under the initially considered ER = 0.50 (Figure 6).
Compared with the baseline scenario (ER = 0.50 and 101 iterations), the solution with ER = 0.25 yielded 201 iterations, and ER = 0.75 decreased this number to 68. However, while the results for ER = 0.50 and ER = 0.25 were practically indistinguishable, the optimisation for ER = 0.75 was clearly different from the former, exhibiting rougher edges.
It can be concluded that the trend attains improved solutions for smaller ER, but values under ER = 0.50 do not change the solution significantly.
Two solutions were taken for assessment purposes here. The first was defined by rmin = 2, while the second was the rmin = 4 solution. The goal was to assess the nonlinear behaviour of the solutions bounding the rmin acceptable range with large and small radii. Both cases were expected to have similar behaviour, given their topological similarity.
The assessment showed that ER values including and under 0.50 (until 0.25) performed similarly. Hence, the following results were limited to ER = 0.50 and ER = 0.25 case.

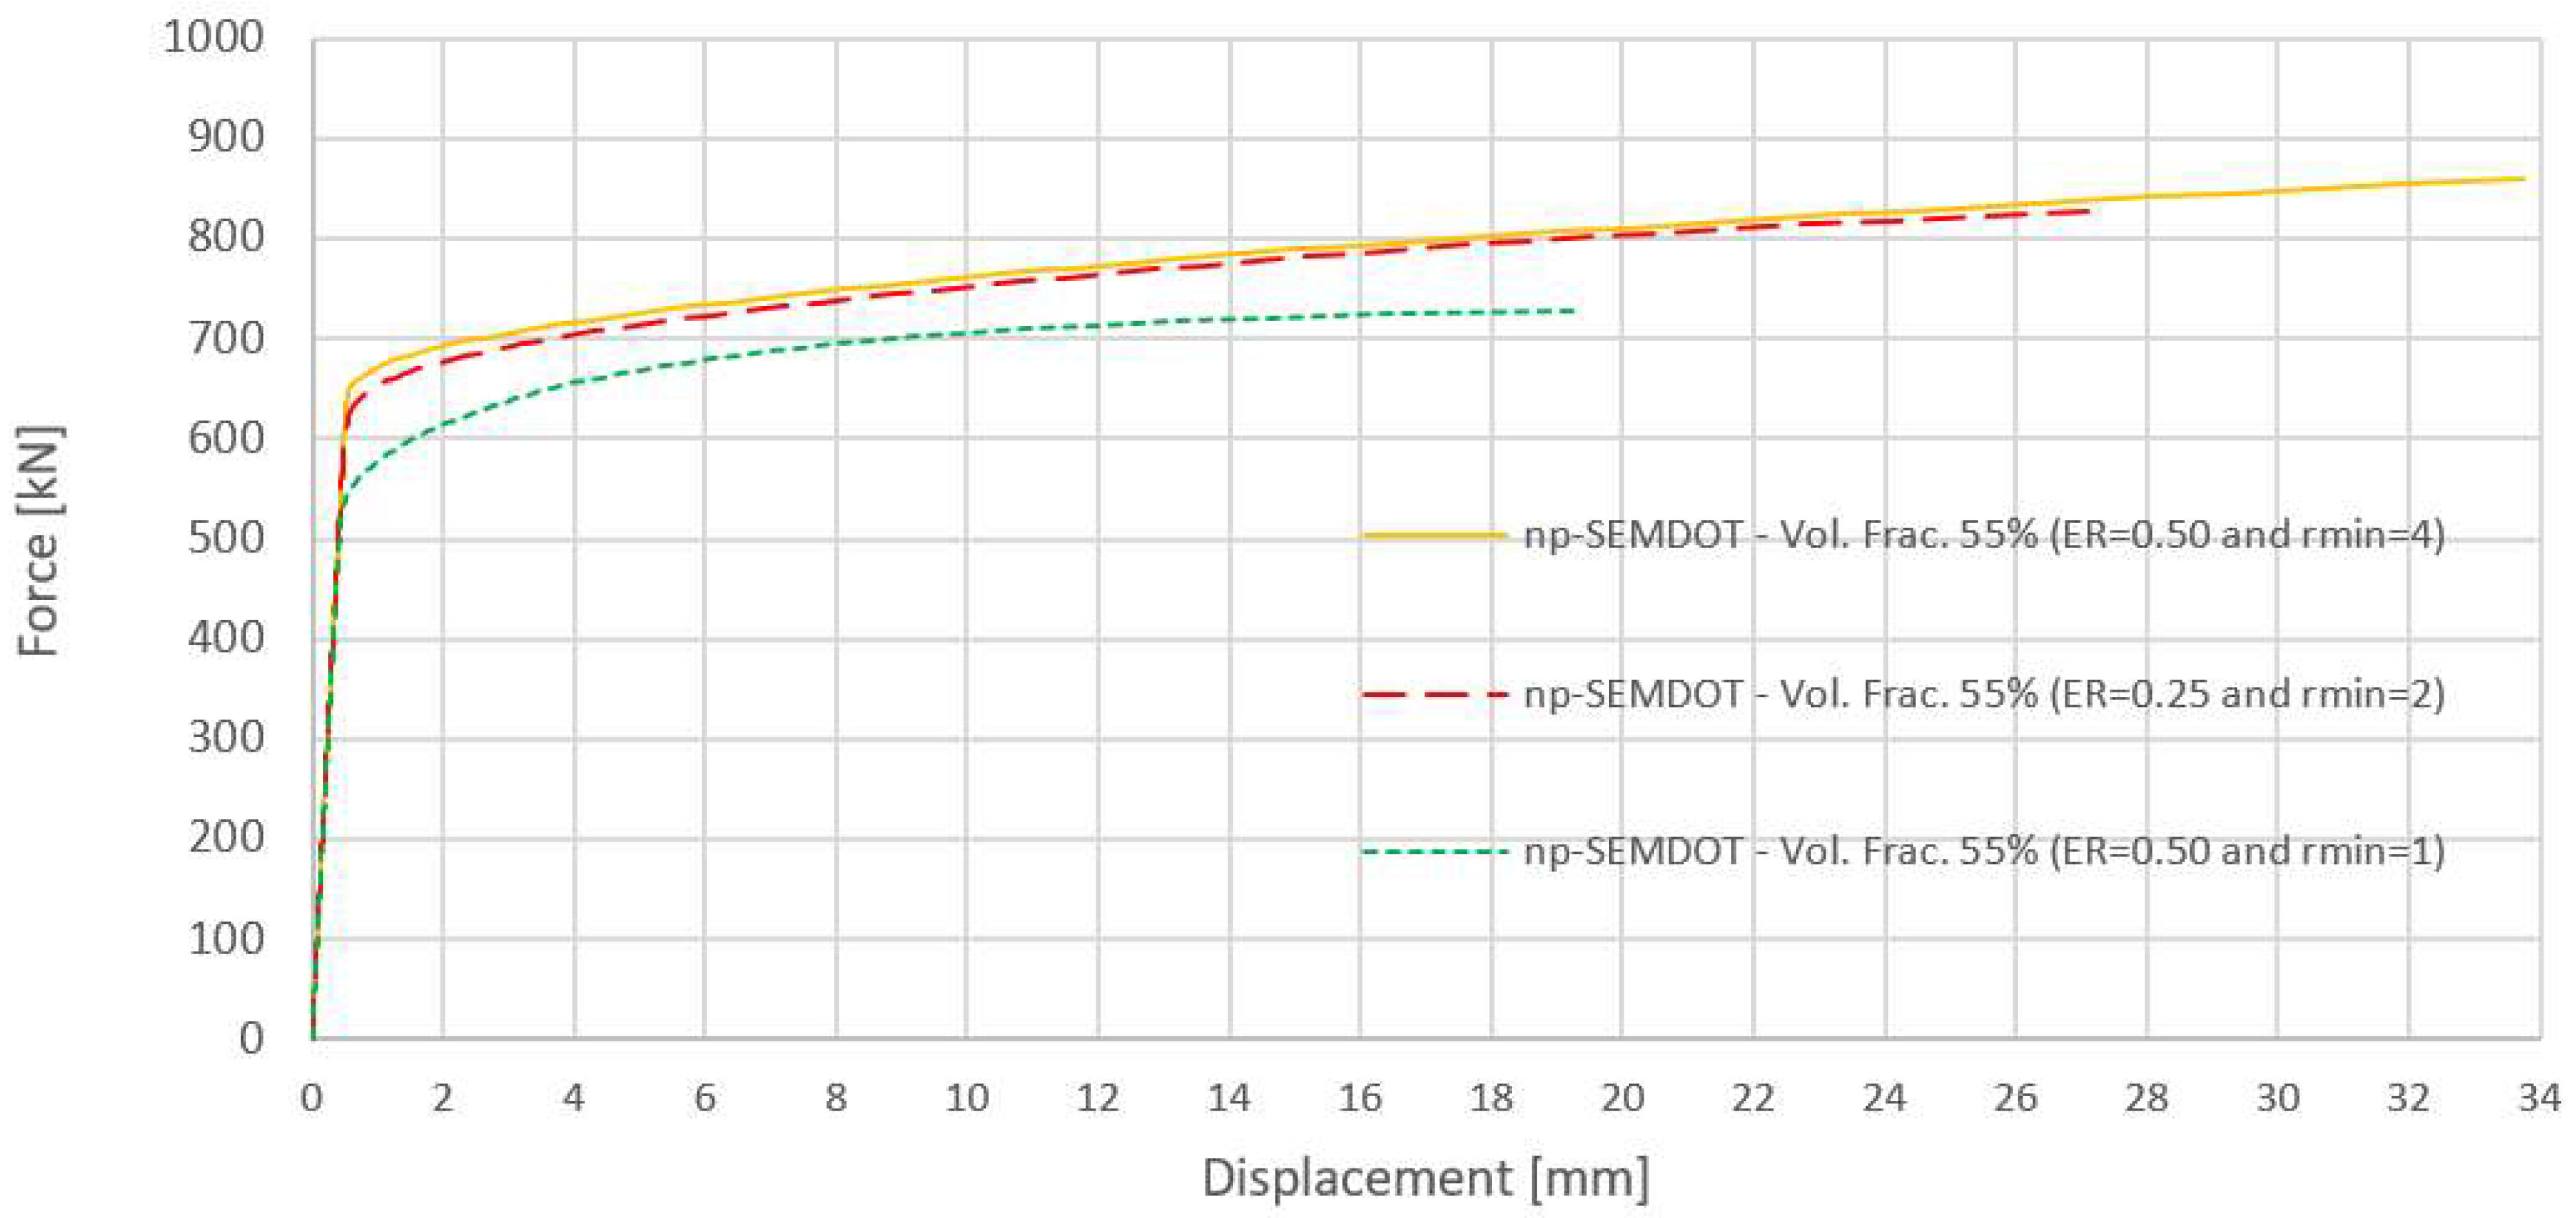
6.2. Optimised Topologies Using Non-Penalisation SEMDOT

The first solution (ER = 0.25 and rmin = 2) analysis provided insight into its nonlinear behaviour, as shown in Figure 7 (ultimate displacement shape), Figure 8 (longitudinal displacement map), Figure 9 (von Mises stress map), Figure 10 (stress map for areas exceeding the yield threshold), and Figure 11 (stress map for areas exceeding the ultimate threshold).
These results show adequate behaviour until the plate’s ultimate state, including large and global displacements, dispersion of plasticity in four out of five bolt holes, and absence of local plasticity in the additional internal voids created by the TO process. The ultimate stress was achieved mainly within the non-optimisable domain with a mostly symmetric pattern. Hence, not only was the ultimate behaviour balanced (in the sense that it distributed yielding and plasticity almost uniformly), but the optimisation procedure was also proven to subtract material where it was not needed, even considering the ultimate nonlinear behaviour to which the plate was not optimised.
The second solution (ER = 0.50 and rmin = 4) nonlinear behaviour is depicted in Figure 12 (ultimate displacement shape), Figure 13 (longitudinal displacement map), Figure 14 (von Mises stress map), Figure 15 (stress map for areas exceeding the yield threshold), and Figure 16 (stress map for areas exceeding the ultimate threshold).
This second batch of results depicts a slightly different scenario, with extensive plastic damage in the first four bolt holes and less prominent damage near the second hole, but with a much more widespread plasticisation by the first hole.
The main difference between the first case and this second one lies in the latter’s ability to keep the straightness of the large displacements in the fourth hole. Hence, despite a noticeable asymmetry in this hole, nearby plastic phenomenon, similarly to what happened for the first case, the in-plane transverse displacement was better controlled, avoiding this first likely local collapse and providing the conditions to develop the ultimate plastic phenomenon in the first hole, where there was more material, and therefore a longer ultimate displacement.
The previously depicted differences in the two batches of results did not significantly impact the ultimate resistance, but fostered a non-negligible difference in the ultimate displacement.
As shown in the force-displacement plot in Figure 17, while the first case (ER = 0.25 and rmin = 2) plate reached a leading tension force of 827 kN—notably close to the optimisation goal of 840 kN to meet the original connection’s strength—the second case (ER = 0.50 and rmin = 4) plate was shown to achieve 859 kN, differing by approximately 3.8%.
Nevertheless, it shall be noted that these values, by corresponding to large nonlinear displacements, were very sensitive to local geometry features and relied heavily on the steel hardening properties. Hence, these values should be read cautiously.
Additionally, for the aforementioned reason, the ultimate displacements showed a much more pronounced dissemblance between the two solutions. While for ER = 0.25 and rmin = 2, the ultimate displacement was approximately 27.1 mm, for the ER = 0.50 and rmin = 4 solution, this value rose to 33.7 mm, or 24% more.
If a solution with ER = 0.50 and rmin = 1 were considered, the ultimate capacity would be at least 12% inferior, and the ultimate displacement would not surpass 20 mm, limited by local failure at the third hole section.

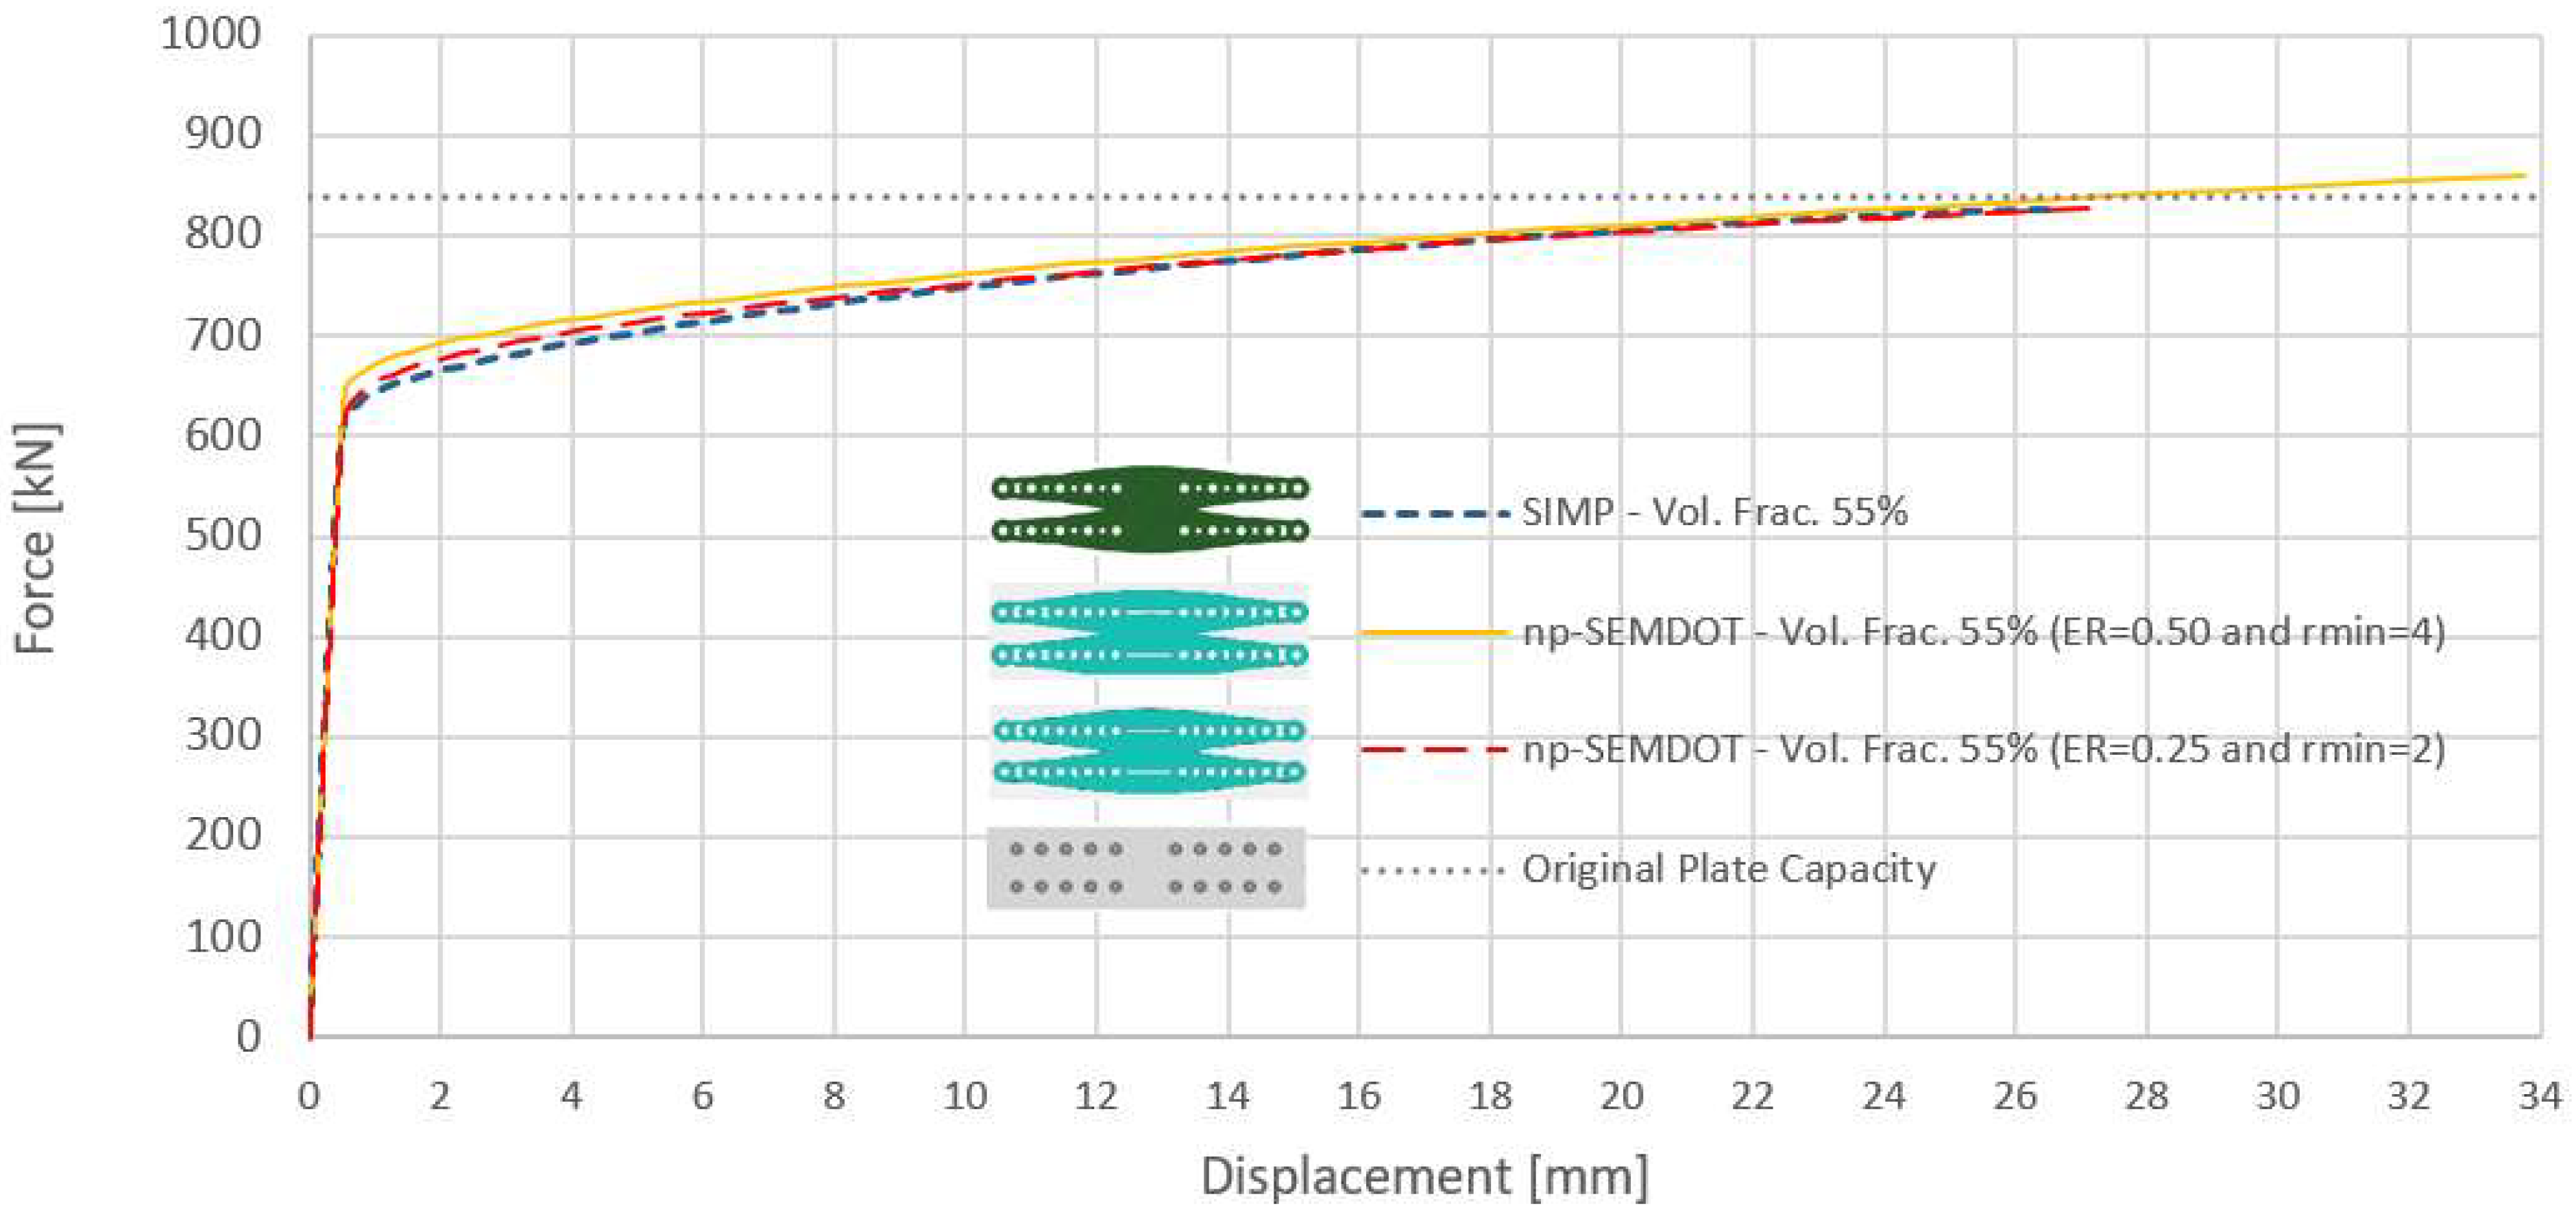
6.3. Benchmarking SEMDOT Solutions against SIMP-Based TOSCA Optimisations

The PhNLFEA to the SIMP-based TOSCA optimisation of the same original plate to a volume fraction of 55% showed an ultimate strength of 827 kN, achieved with an ultimate longitudinal displacement of 26.5 mm [21].
Comparatively, the optimal np-SEMDOT-optimised solution was able to resist 827 to 859 kN at a longitudinal displacement of 27.1 to 33.7 mm.
Not only did the previously depicted results perfectly match in terms of strength and displacement capacity—the latter with a slight superiority of 2% to 4% for the np-SEMDOT solution—but the complete force-displacement relation with its stages through elastic and plastic domains (see Figure 18) was also almost coincident for both plates, except for the best (ER = 0.50 and rmin = 4) np-SEMDOT solution, which adds a further displacement plateau, increasing the ultimate displacement by approximately 27%.
Assessing the failure mode of each solution, one can observe that np-SEMDOT was more successful in involving four out of the five bolt holes in the ultimate plastic phenomena, whilst the TOSCA solution essentially mobilised significant plastic damage in three [21]. This may explain why the former achieved a superior ultimate displacement.
Recent findings on bolted connections have shown that reaching the ductility requirements for topologically optimised parts largely depends on ensuring that all critical sections—the hole sections—have the same relation between loading and resistance. The current results corroborate these findings.
In the context of the performed PhNLFEA, np-SEMDOT and SIMP-based optimisations can be concluded to be equivalent for engineering purposes. Significantly, both approaches meet the behavioural requirements of strength and ductility for steel connections in the context of structural engineering, and are code-compliant, making them suitable for real-world applications.
Another significant aspect that should be considered in comparing the two solutions is the accuracy in ensuring the volume fraction. In TOSCA and np-SEMDOT, the target volume fraction was defined for 0.55 (55%), but in neither of those was the outcome exactly 0.55. While the TOSCA solution’s volume fraction was slightly under 0.550, both np-SEMDOT solutions resulted in volume fractions of 0.528. Therefore, while for engineering purposes, the solutions would be referred to as 55% target volume fractions, for analysis purposes it should be highlighted that the np-SEMDOT solutions slightly outperformed the reference solution, with marginally less material.
Concerning the boundary smoothness of each solution, a critical issue for manufacturability, a comparison between the np-SEMDOT and SIMP-based solutions illustrated in Figure 19 shows that, for external boundaries, the np-SEMDOT solution’s large irregularities were less exuberant, meaning that it made large portions of inefficient material less likely to accumulate. On the other hand, both solutions were equivalent in terms of small irregularities or roughness.
Concerning the manufacturability of the SIMP-based solution, it is important to note that several specimens of excellent quality have already been produced by subtractive manufacturing using standard cutting technology (as shown in Figure 20a).
A further step has been taken with the np-SEMDOT solution in the form of a prototype produced by additive manufacturing (as shown in Figure 20b), proving its expected excellent manufacturability.
Another critical issue in the assessment of the potential for mass employment of TO resources is its ease of use by practitioners. In the case of the SIMP-based commercial solutions, such as the TOSCA package and its competitors (such as Altair HyperWorks, NASTRAN, ANSYS Mechanical, GENESIS, Intes PERMAS, or COMSOL, to name a few [1]), knowledge of Abaqus, Ansys, or similar graphical environments, already used for engineering advanced calculations, will suffice, although these approaches may drive TO towards an undesired black-box type of procedure.
Contrarily, np-SEMDOT runs as an open-source code in the Matlab environment, as do a plethora of SIMP-based codes [1]. This allows practitioners to have a full understanding of the optimisation procedure and to avoid significant software costs. As Matlab programming is quite straightforward and not graphical, it allows almost instantaneous assessment of the produced geometries. Matlab-based codes are thus a viable solution for professional endeavours. To such an end, CAD-based input and output drawing-to-code and code-to-drawing applications could provide much-needed leverage.

7. Conclusions

Non-penalisation Smooth-Edged Material Distribution for Optimising Topology (np-SEMDOT) and a SIMP-based approach used a novel methodology to ensure the solutions’ design code compliance and adequate structural behaviour under an extreme nonlinear regimen.
It was found that the baseline SIMP-based and np-SEMDOT optimisations attained similar results in terms of ultimate strength, both achieving the connection’s reference capacity. Both options provided an extensive ultimate displacement and showed adequate behaviour with distributed plasticity and ductility. Moreover, the best np-SEMDOT solution was able to significantly outperform all the others (remaining np-SEMDOT and reference) at the ultimate displacement capacity.
On the other hand, it was also shown that, despite remarkable stability in np-SEMDOT solutions when the significant optimisation parameters are tested, attaining an adequate design will always require preliminary parametric analyses. The reason for this is to avoid the use of parameters that could lead to visibly worse results, especially if the optimisation is carried out by engineering professionals, rather than specialists in TO.
Concerning the smoothness of the edges, np-SEMDOT successfully limited the occurrence of large edge irregularities, but small irregularities (or roughness) remained.

Author Contributions

Conceptualisation, T.R. and L.B.; methodology, T.R., Y.-F.F. and L.B.; software, Y.-F.F. and B.R.; validation, T.R., Y.-F.F. and L.B.; formal analysis, T.R. and L.B.; investigation, T.R., Y.-F.F. and L.B.; resources, Y.-F.F., L.B. and B.R.; data curation, T.R. and Y.-F.F.; writing—original draft preparation, T.R. and Y.-F.F.; writing—review and editing, T.R. and Y.-F.F.; visualisation, T.R. and Y.-F.F. and L.B.; supervision, L.B. and B.R.; project administration, T.R. and Y.-F.F. All authors have read and agreed to the published version of the manuscript.

Funding

This research received no external funding.

Institutional Review Board Statement

Not applicable.

Informed Consent Statement

Not applicable.

Data Availability Statement

Not applicable.

Acknowledgments

Louis N. S. Chiu, from Monash University, Australia is acknowledged for his support with the SEMDOT prototype printing.

Conflicts of Interest

The authors declare no conflict of interest.

References

  1. Ribeiro, T.; Bernardo, L.; Andrade, J. Topology Optimisation in Structural Steel Design for Additive Manufacturing. Appl. Sci. 2021, 11, 2112. [Google Scholar] [CrossRef]
  2. Bendsøe, M.P.; Sigmund, O. Topology Optimization—Theory, Methods, and Applications; Springer: Berlin/Heidelberg, Germany, 2012; ISBN 9783642076985. [Google Scholar]
  3. Haftka, R.T.; Gurdal, Z. Elements of Structural Optimization; Kluwer Academic Publishers: Alphen aan den Rijn, The Netherlands, 2002. [Google Scholar]
  4. Rozvany, G.I.N.; Lewiński, T. Topology Optimization in Structural and Continuum Mechanics; Springer: Berlin/Heidelberg, Germany, 2014; ISBN 978-3-7091-1642-5. [Google Scholar]
  5. Bendsøe, M.P.; Kikuchi, N. Generating optimal topologies in structural design using a homogenization method. Comput. Methods Appl. Mech. Eng. 1988, 71, 197–224. [Google Scholar] [CrossRef]
  6. Bendsøe, M.P. Optimal shape design as a material distribution problem. Struct. Optim. 1989, 1, 193–202. [Google Scholar] [CrossRef]
  7. Suzuki, K.; Kikuchi, N. Shape and topology optimization by a homogenization method. Am. Soc. Mech. Eng. Appl. Mech. Div. AMD 1990, 115, 15–30. [Google Scholar] [CrossRef]
  8. Kohn, R.V.; Strang, G. Optimal Design and Relaxation of Variational Problems, I. Commun. Pure Appl. Math. 1986, 39, 113–137. [Google Scholar] [CrossRef]
  9. Kohn, R.V.; Strang, G. Optimal design and relaxation of variational problems, II. Commun. Pure Appl. Math. 1986, 39, 139–182. [Google Scholar] [CrossRef]
  10. Kohn, R.V.; Strang, G. Optimal design and relaxation of variational problems, III. Commun. Pure Appl. Math. 1986, 39, 113–137. [Google Scholar] [CrossRef]
  11. Strang, G.; Kohn, R. Optimal Design in Elasticity and Plasticity. Int. J. Numer. Methods Eng. 1986, 22, 183–188. [Google Scholar] [CrossRef]
  12. Fu, Y.F.; Rolfe, B.; Chiu, L.N.S.; Wang, Y.; Huang, X.; Ghabraie, K. SEMDOT: Smooth-edged material distribution for optimizing topology algorithm. Adv. Eng. Softw. 2020, 150, 102921. [Google Scholar] [CrossRef]
  13. Fu, Y.F.; Long, K.; Rolfe, B. On Non-Penalization SEMDOT Using Discrete Variable Sensitivities. J. Optim. Theory Appl. 2023, 198, 644–677. [Google Scholar] [CrossRef]
  14. Sarkisian, M.; Beghini, A.; Long, E.; Shook, D.; Krebs, A.; Diaz, A. Innovation in the sustainable design process of Earthquake resistant buildings: From topology optimization to staged construction analysis. Eng. Prog. Nat. People 2014, 102, 1192–1199. [Google Scholar] [CrossRef]
  15. Spaeth, A.B. Editorial. Archit. Sci. Rev. 2020, 63, 103–104. [Google Scholar] [CrossRef]
  16. Brown, N.C.; Mueller, C.T. Design for structural and energy performance of long span buildings using geometric multi-objective optimization. Energy Build. 2016, 127, 748–761. [Google Scholar] [CrossRef]
  17. Baker, W.F.; Beghini, A.; Mazurek, A. Applications of Structural Optimization in Architectural Design. In Proceedings of the 20th Analysis & Computation Specialty Conference, Chicago, IL, USA, 29–31 March 2012; pp. 207–218. [Google Scholar]
  18. Beghini, A.; Beghini, L.L.; Baker, W.F. Applications of structural optimization in architectural design. In Proceedings of the Structures Congress 2013: Bridging Your Passion with Your Profession—Proceedings of the 2013 Structures Congress, Pittsburgh, PA, USA, 2–4 May 2013; pp. 2499–2507. [Google Scholar]
  19. Kravanja, S.; Žula, T. Cost optimization of industrial steel building structures. Adv. Eng. Softw. 2010, 41, 442–450. [Google Scholar] [CrossRef]
  20. Ribeiro, T.; Bernardo, L.; Carrazedo, R.; Domenico, D. De Eurocode-compliant Topology Optimisation and Analysis of a Steel Cover-plate in a Splice Moment Connection. In Proceedings of the Materials Today: Proceedings—Recent Advancements in Construction Materials & Structures, ICCMS-2021, Kerala, India, 15–17 December 2021; Elsevier: Amsterdam, The Netherlands. [Google Scholar]
  21. Ribeiro, T.; Bernardo, L.; Carrazedo, R.; De Domenico, D. Eurocode-compliant topology optimisation of steel moment splice connections. J. Build. Eng. 2022, 62, 105346. [Google Scholar] [CrossRef]
  22. Simões, L.; Templeman, A. Entropy-based Synthesis of Pretensioned Cable Net Structures. Eng. Opt. 1989, 15, 121–140. [Google Scholar]
  23. Marler, R.T.; Arora, J.S. Survey of multi-objective optimization methods for engineering. Struct. Multidiscip. Optim. 2004, 26, 369–395. [Google Scholar] [CrossRef]
  24. Luo, Z.; Chen, L.P.; Yang, J.; Zhang, Y.Q.; Abdel-Malek, K. Fuzzy tolerance multilevel approach for structural topology optimization. Comput. Struct. 2006, 84, 127–140. [Google Scholar] [CrossRef]
  25. Li, H.; Gao, L.; Li, P. Topology optimization of structures under multiple loading cases with a new compliance-volume product. Eng. Optim. 2014, 46, 725–744. [Google Scholar] [CrossRef]
  26. Alkalla, M.G.; Helal, M.; Fouly, A. Revolutionary Superposition Layout Method for Topology Optimization of Non-Concurrent Multi-load Models: Connecting-Rod Case Study. Int. J. Numer. Methods Eng. 2020, 122, 1378–1400. [Google Scholar] [CrossRef]
  27. Pintér, E.; Lengyel, A.; Lógó, J. Structural topology optimization with stress constraint considering loading uncertainties. Period. Polytech. Civ. Eng. 2015, 59, 559–565. [Google Scholar] [CrossRef]
  28. Lógó, J.; Balogh, B.; Pintér, E. Topology optimization considering multiple loading. Comput. Struct. 2018, 207, 233–244. [Google Scholar] [CrossRef]
  29. Tsavdaridis, K.D.; Efthymiou, E.; Adugu, A.; Hughes, J.A.; Grekavicius, L. Application of structural topology optimisation in aluminium cross-sectional design. Thin-Walled Struct. 2019, 139, 372–388. [Google Scholar] [CrossRef]
  30. Sheikh-Ibrahim, F. Development of Design Procedures for Steel Girder Bolted Splices. Ph.D. Thesis, The University of Texas at Austin, Austin, TX, USA, 1995. [Google Scholar]
  31. Jacobsen, R.S.; Andersen, K.N.; Borel, P.I.; Fage-Pedersen, J.; Frandsen, L.H.; Hansen, O.; Kristensen, M.; Lavrinenko, A.V.; Moulin, G.; Ou, H.; et al. Strained silicon as a new electro-optic material. Nature 2006, 441, 199–202. [Google Scholar] [CrossRef]
  32. Jensen, J.S.; Sigmund, O. Topology optimization for nano-photonics. Laser Photonics Rev. 2011, 5, 308–321. [Google Scholar] [CrossRef]
  33. Alexandersen, J.; Aage, N.; Andreasen, C.S.; Sigmund, O. Topology optimisation for natural convection problems. Int. J. Numer. Methods Fluids 2014, 76, 699–721. [Google Scholar] [CrossRef]
  34. Clausen, A.; Wang, F.; Jensen, J.S.; Sigmund, O.; Lewis, J.A. Topology Optimized Architectures with Programmable Poisson’s Ratio over Large Deformations. Adv. Mater. 2015, 27, 5523–5527. [Google Scholar] [CrossRef]
  35. Sousa, A.M.; Andrade, T.A.; Errico, M.; Coelho, P.; Filipe, R.M.; Matos, H.A. Fatty Acid Content in Biomasses: State-of-the-Art and Novel Physical Property Estimation Methods. Int. J. Chem. Eng. 2019, 2019, 2430234. [Google Scholar] [CrossRef]
  36. Alexandersen, J.; Andreasen, C.S. A review of topology optimisation for fluid-based problems. Fluids 2020, 5, 29. [Google Scholar] [CrossRef]
  37. Andersen, M.N.; Wang, F.; Sigmund, O. On the competition for ultimately stiff and strong architected materials. Mater. Des. 2021, 198, 109356. [Google Scholar] [CrossRef]
  38. Sousa, A.M.; Matos, H.A.; Pereira, M.J. Properties of Crude Oil-in-Water and Water-in-Crude Oil Emulsions: A Critical Review. Ind. Eng. Chem. Res. 2022, 61, 1–20. [Google Scholar] [CrossRef]
  39. Wang, Y.; Sigmund, O. Multi-material topology optimization for maximizing structural stability under thermo-mechanical loading. Comput. Methods Appl. Mech. Eng. 2023, 407, 115938. [Google Scholar] [CrossRef]
  40. Kazakis, G.; Kanellopoulos, I.; Sotiropoulos, S.; Lagaros, N.D. Topology optimization aided structural design: Interpretation, computational aspects and 3D printing. Heliyon 2017, 3, e00431. [Google Scholar] [CrossRef] [PubMed]
  41. Li, Z.; Tsavdaridis, K.D. A Review of Optimised Additively Manufactured Steel Connections for Modular Building Systems. Ind. Addit. Manuf. 2021, 1, 357–373. [Google Scholar] [CrossRef]
  42. Lange, J.; Feucht, T.; Erven, M. 3D printing with steel: Additive Manufacturing for connections and structures. Steel Constr. 2020, 13, 144–153. [Google Scholar] [CrossRef]
  43. Wang, L.; Du, W.; He, P.; Yang, M. Topology Optimization and 3D Printing of Three-Branch Joints in Treelike Structures. J. Struct. Eng. 2020, 146, 04019167. [Google Scholar] [CrossRef]
  44. Kanyilmaz, A.; Berto, F. Robustness-oriented topology optimization for steel tubular joints mimicking bamboo structures. Mater. Des. Process. Commun. 2019, 1, e43. [Google Scholar] [CrossRef]
  45. Kanyilmaz, A.; Berto, F.; Paoletti, I.; Caringal, R.J.; Mora, S. Nature-inspired optimization of tubular joints for metal 3D printing. Struct. Multidiscip. Optim. 2020, 63, 767–787. [Google Scholar] [CrossRef]
  46. Hassani, V.; Khabazi, Z.; Mehrabi, H.A.; Gregg, C.; O’Brien, R.W. Rationalization algorithm for a topologically-optimized multi-branch node for manufacturing by metal printing. J. Build. Eng. 2020, 29, 101146. [Google Scholar] [CrossRef]
  47. Zhu, B.; Zhang, X.; Li, H.; Liang, J.; Wang, R.; Li, H.; Nishiwaki, S. An 89-line code for geometrically nonlinear topology optimization written in FreeFEM. Struct. Multidiscip. Optim. 2021, 63, 1015–1027. [Google Scholar] [CrossRef]
  48. Zhao, Y.; Guo, G.; Zuo, W. MATLAB implementations for 3D geometrically nonlinear topology optimization: 230-line code for SIMP method and 280-line code for MMB method. Struct. Multidiscip. Optim. 2023, 66, 146. [Google Scholar] [CrossRef]
  49. Sun, Y.; Lueth, T.C. Enhancing Torsional Stiffness of Continuum Robots Using 3-D Topology Optimized Flexure Joints. IEEE/ASME Trans. Mechatron. 2023, 28, 1844–1852. [Google Scholar] [CrossRef]
  50. Habashneh, M.; Rad, M.M.; Fischer, S. Bi-directional Evolutionary, Reliability-based, Geometrically Nonlinear, Elasto-Plastic Topology Optimization, of 3D Structures. Acta Polytech. Hung. 2023, 20, 169–186. [Google Scholar] [CrossRef]
  51. Lu, S.; Zhang, Z.; Guo, H.; Park, G.J.; Zuo, W. Nonlinear dynamic topology optimization with explicit and smooth geometric outline via moving morphable components method. Struct. Multidiscip. Optim. 2021, 64, 2465–2487. [Google Scholar] [CrossRef]
  52. Nguyen, V.T.; Tao, N.L.; Nguyen, T.T.; Bui, N.T. Adaptive Plan Using Sigmoid Function for Nonlinear Topology Optimization. Int. J. Mech. Eng. Robot. Res. 2021, 10. [Google Scholar] [CrossRef]
  53. Zhu, B.; Wang, R.; Zhang, H.; Li, H.; Liang, J.; Zhang, X.; Li, H.; Nishiwaki, S. An Approach for Geometrically Nonlinear Topology Optimization Using Moving Wide-Beìzier Components with Constrained Ends. J. Mech. Des. 2021, 144, 4051872. [Google Scholar] [CrossRef]
  54. Paulino, D.M.S.; Leonel, E.D. Topology optimization and geometric nonlinear modeling using positional finite elements. Optim. Eng. 2022, 23, 1439–1469. [Google Scholar] [CrossRef]
  55. Fu, Y.F.; Ghabraie, K.; Rolfe, B.; Wang, Y.; Chiu, L.N.S. Smooth design of 3d self-supporting topologies using additive manufacturing filter and semdot. Appl. Sci. 2021, 11, 238. [Google Scholar] [CrossRef]
  56. Yi, L.; Wu, X.; Nawaz, A.; Glatt, M.; Aurich, J.C. Improving energy performance in the product design for additive manufacturing using a multi-player competition algorithm. J. Clean. Prod. 2023, 391, 136173. [Google Scholar] [CrossRef]
  57. Liu, M.; Wang, Y.; Wei, Q.; Ma, X.; Zhang, K.; Li, X.; Bao, C.; Du, B. Topology optimization for reducing stress shielding in cancellous bone scaffold. Comput. Struct. 2023, 288, 107132. [Google Scholar] [CrossRef]
  58. Sheikh-Ibrahim, F.I.; Frank, K.H. The ultimate strength of symmetric beam bolted splices. Eng. J. 2001, 38, 100–117. [Google Scholar]
  59. Richter, C. Behavior of a Steel Girder Bolted Splice Connection; US Department of Transportation, Federal Highway Administration, McLean: Washington, DC, USA, 2017.
  60. ASTM A36/A36M-19; Standard Specification for Carbon Structural Steel. ASTM: West Conshohocken, PA, USA, 2019.
  61. ASTM A572/A572M-15; High-Strength Low-Alloy Columbium-Vanadium Structural Steel. ASTM: West Conshohocken, PA, USA, 2015.
  62. Rex, C.; Samuel Easterling, W. Behavior and Modeling of Mild and Reinforcing Steel; Department of Civil and Environmental Engineering, Virginia Polytechnic Institute and State University: Blacksburg, VA, USA, 1996. [Google Scholar]
  63. Barbosa, V.S.; Ruggieri, C. Effects of increased span on fracture toughness using non-standard PCVN specimens and implications for the reference temperature, T 0. Procedia Struct. Integr. 2018, 13, 367–372. [Google Scholar] [CrossRef]
  64. Wang, Y.; Pasiliao, C.L. Modeling ablation of laminated composites: A novel manual mesh moving finite element analysis procedure with ABAQUS. Int. J. Heat Mass Transf. 2018, 116, 306–313. [Google Scholar] [CrossRef]
  65. Lee, S.H.; Abolmaali, A.; Shin, K.J.; Lee, H. Du ABAQUS modeling for post-tensioned reinforced concrete beams. J. Build. Eng. 2020, 30, 101273. [Google Scholar] [CrossRef]
  66. Yussof, M.M.; Silalahi, J.H.; Kamarudin, M.K.; Chen, P.S.; Parke, G.A.R. Numerical evaluation of dynamic responses of steel frame structures with different types of haunch connection under blast load. Appl. Sci. 2020, 10, 1815. [Google Scholar] [CrossRef]
  67. Sreenivas, A.; Abeyrathna, B.; Rolfe, B.; Weiss, M. Development of a reversible top-hat forming approach for reducing flange wrinkling in flexible roll forming. Int. J. Mech. Sci. 2023, 252, 108359. [Google Scholar] [CrossRef]
  68. Fedulov, B.; Fedorenko, A.; Khaziev, A.; Antonov, F. Optimization of parts manufactured using continuous fiber three-dimensional printing technology. Compos. Part B Eng. 2021, 227, 109406. [Google Scholar] [CrossRef]
  69. Tyflopoulos, E.; Steinert, M. Messing with boundaries—Quantifying the potential loss by pre-set parameters in topology optimization. Procedia CIRP 2019, 84, 979–985. [Google Scholar] [CrossRef]
  70. Pedersen, C.B.W.; Allinger, P. Industrial implementation and applications of topology optimization and future needs. Solid Mech. Its Appl. 2006, 137, 229–238. [Google Scholar] [CrossRef]
  71. Matos, M. Sizing Optimization for Industrial Applications. In Proceedings of the 11th World Congress on Structural and Multidisciplinary Optimization (WCSMO-11), Sydney, Australia, 7–12 June 2015; Volume 51, pp. 799–800. [Google Scholar]
Figure 1. Splice connection layout.
Applsci 13 11370 g001
Figure 2. ASTM A572-Gr50 steel stress–strain PhNL model. in refs. [30,58,59,61,62,63]
Applsci 13 11370 g002
Figure 3. Finite-elements mesh general view for (a) ER = 0.50 and rmin = 4, and (b) ER = 0.25 and rmin = 2.
Applsci 13 11370 g003
Figure 4. Loading pattern application in the holes’ half-perimeters.
Applsci 13 11370 g004
Figure 5. Resulting topologies with ER = 0.5 and (a) rmin = 4, (b) rmin = 3.5, (c) rmin = 2.5, and (d) rmin = 2.
Applsci 13 11370 g005
Figure 6. Resulting topologies with (a) ER = 0.25 and rmin = 2, and (b) ER = 0.75 and rmin = 2.
Applsci 13 11370 g006
Figure 7. Ultimate displacement shape (x2), with the undeformed shape (in grey) for comparison.
Applsci 13 11370 g007
Figure 8. Longitudinal displacement map [mm].
Applsci 13 11370 g008
Figure 9. Von Mises stress map [MPa].
Applsci 13 11370 g009
Figure 10. Map of areas above yield stress of 345 MPa.
Applsci 13 11370 g010
Figure 11. Map of areas above ultimate stress of 450 MPa.
Applsci 13 11370 g011
Figure 12. Ultimate displacement shape (x2), with the undeformed shape (in grey) for comparison.
Applsci 13 11370 g012
Figure 13. Longitudinal displacement map [mm].
Applsci 13 11370 g013
Figure 14. Von Mises stress map [MPa].
Applsci 13 11370 g014
Figure 15. Map of areas above yield stress of 345 MPa.
Applsci 13 11370 g015
Figure 16. Map of areas above ultimate stress of 450 MPa.
Applsci 13 11370 g016
Figure 17. Ultimate capacity and force-displacement relation for the np-SEMDOT optimised solutions with ER = 0.25 and rmin = 2, with ER = 0.50 and rmin = 4, and with ER = 0.50 and rmin = 1.
Applsci 13 11370 g017
Figure 18. Ultimate capacity and force-displacement relation for the np-SEMDOT best solution and for the baseline SIMP (in TOSCA software) optimised solution.
Applsci 13 11370 g018
Figure 19. Superposition of the edges of the np-SEMDOT (ER = 0.25 and rmin = 2) and SIMP-based solutions.
Applsci 13 11370 g019
Figure 20. Manufacturing the (a) SIMP-based and (b) np-SEMDOT-based solutions.
Applsci 13 11370 g020
Disclaimer/Publisher’s Note: The statements, opinions and data contained in all publications are solely those of the individual author(s) and contributor(s) and not of MDPI and/or the editor(s). MDPI and/or the editor(s) disclaim responsibility for any injury to people or property resulting from any ideas, methods, instructions or products referred to in the content.

