
Stress Measurements of GIS Epoxy Composite with Transverse Waves Based on the Ultrasonic Pulse-Echo Method

 , ,
, ,
Abstract
:1. Introduction
2. Detection Principle
2.1. Acoustoelastic Effect
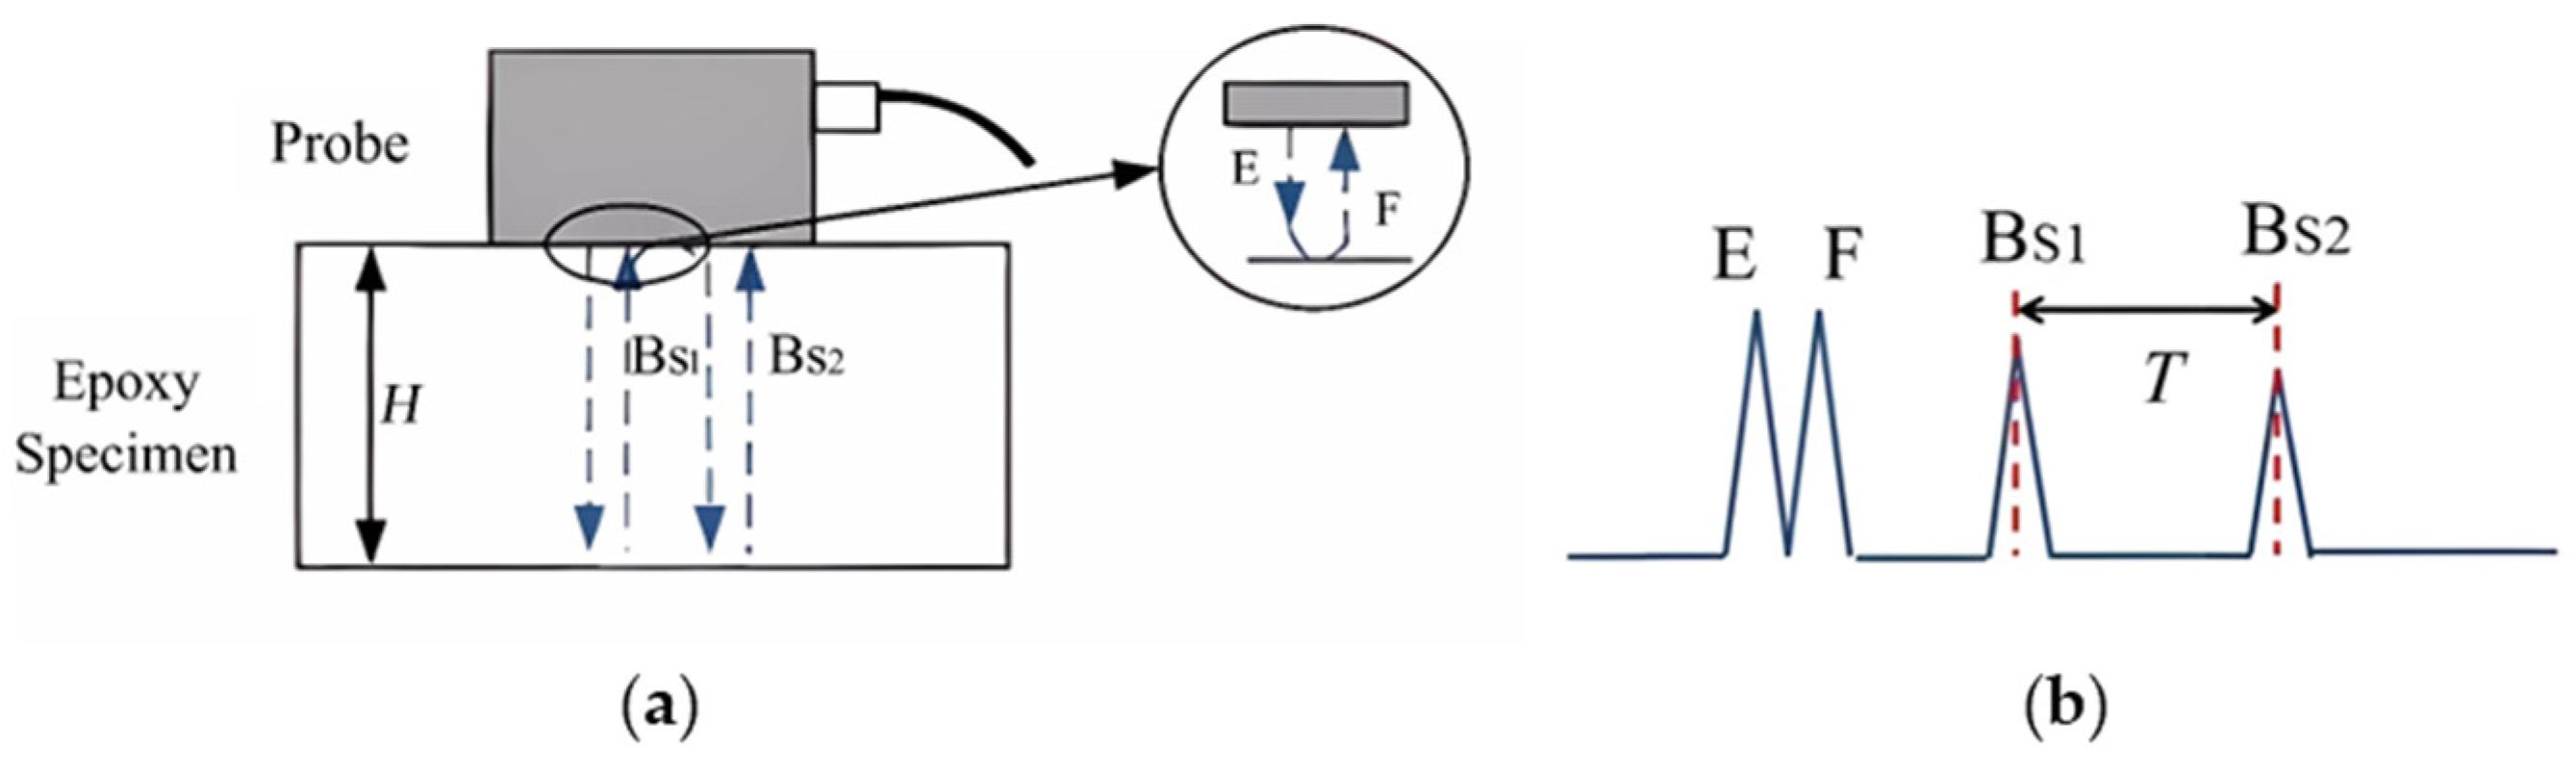
2.2. Propagation Model of Pulse-Echo Method
2.3. Ultrasonic Propagation Velocity
3. Experiment
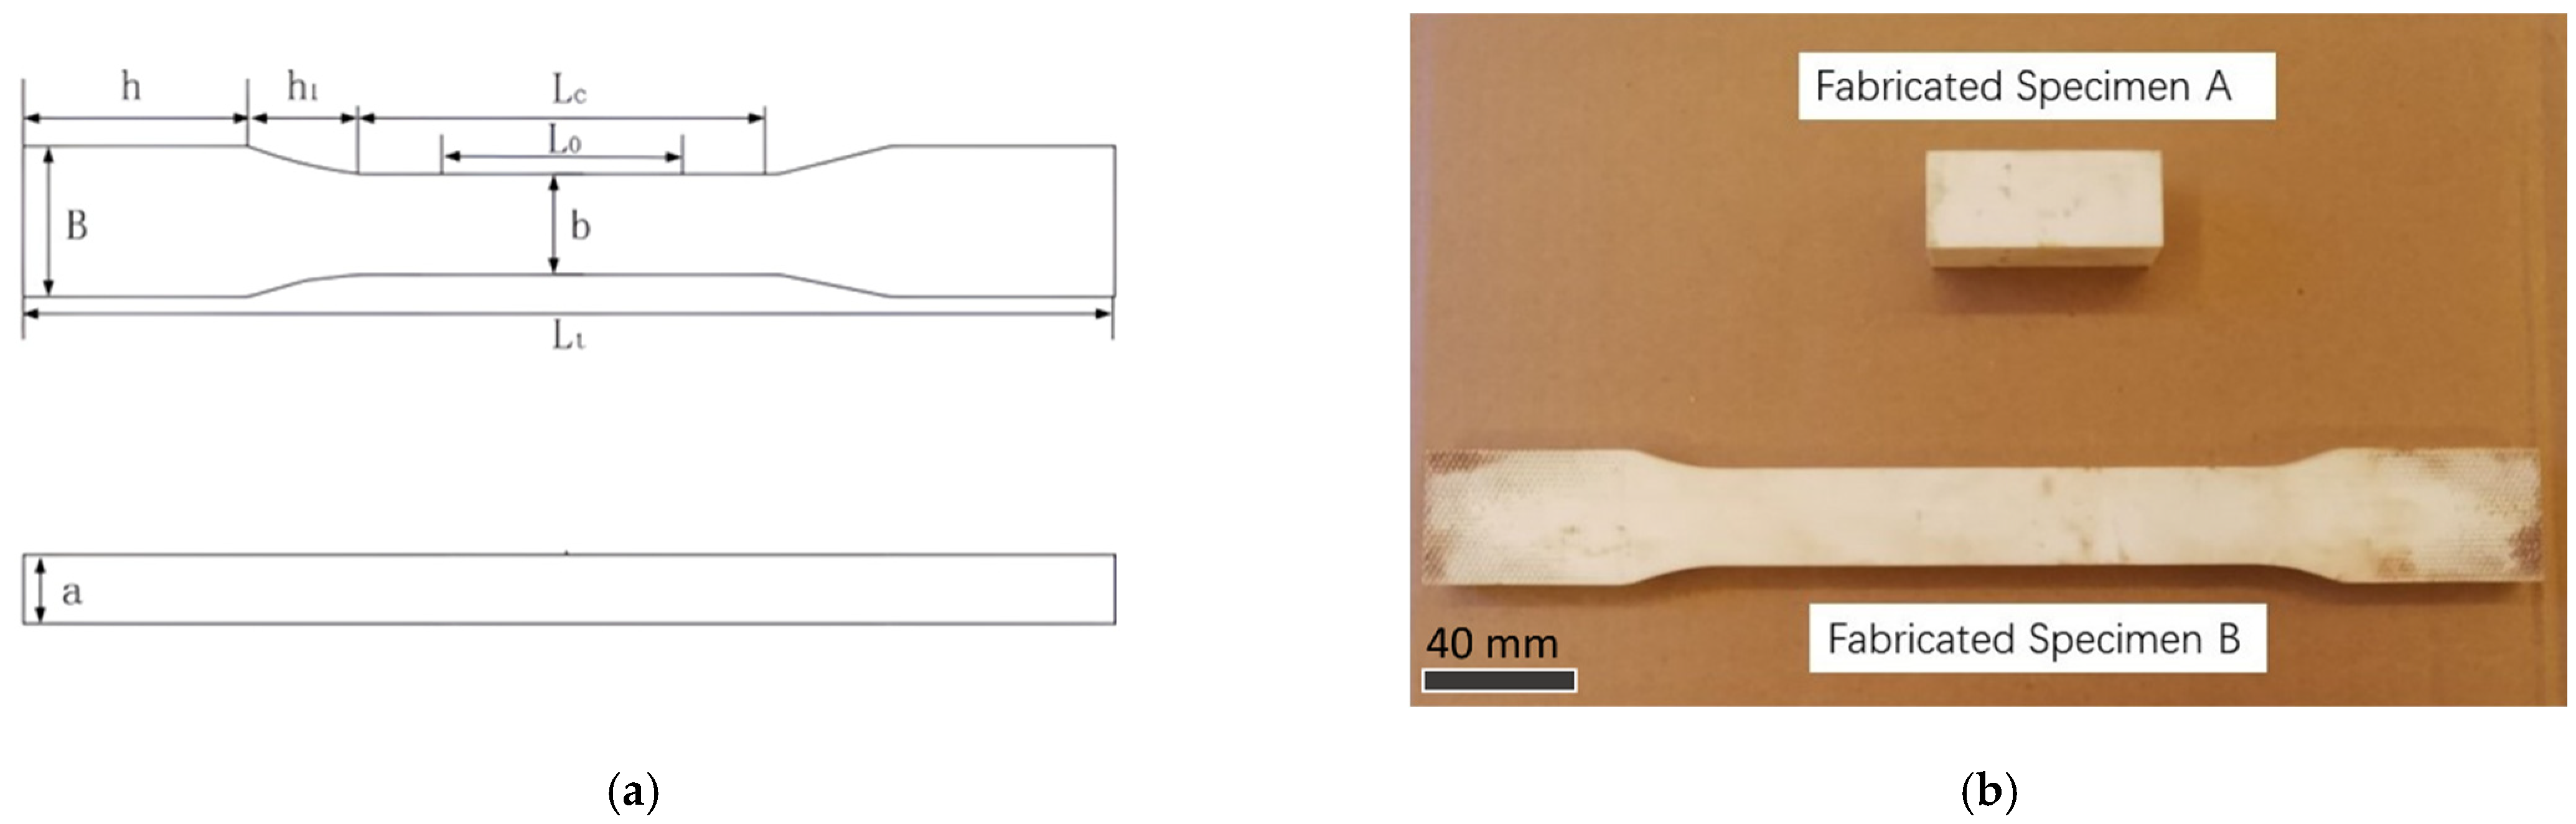
3.1. Specimen
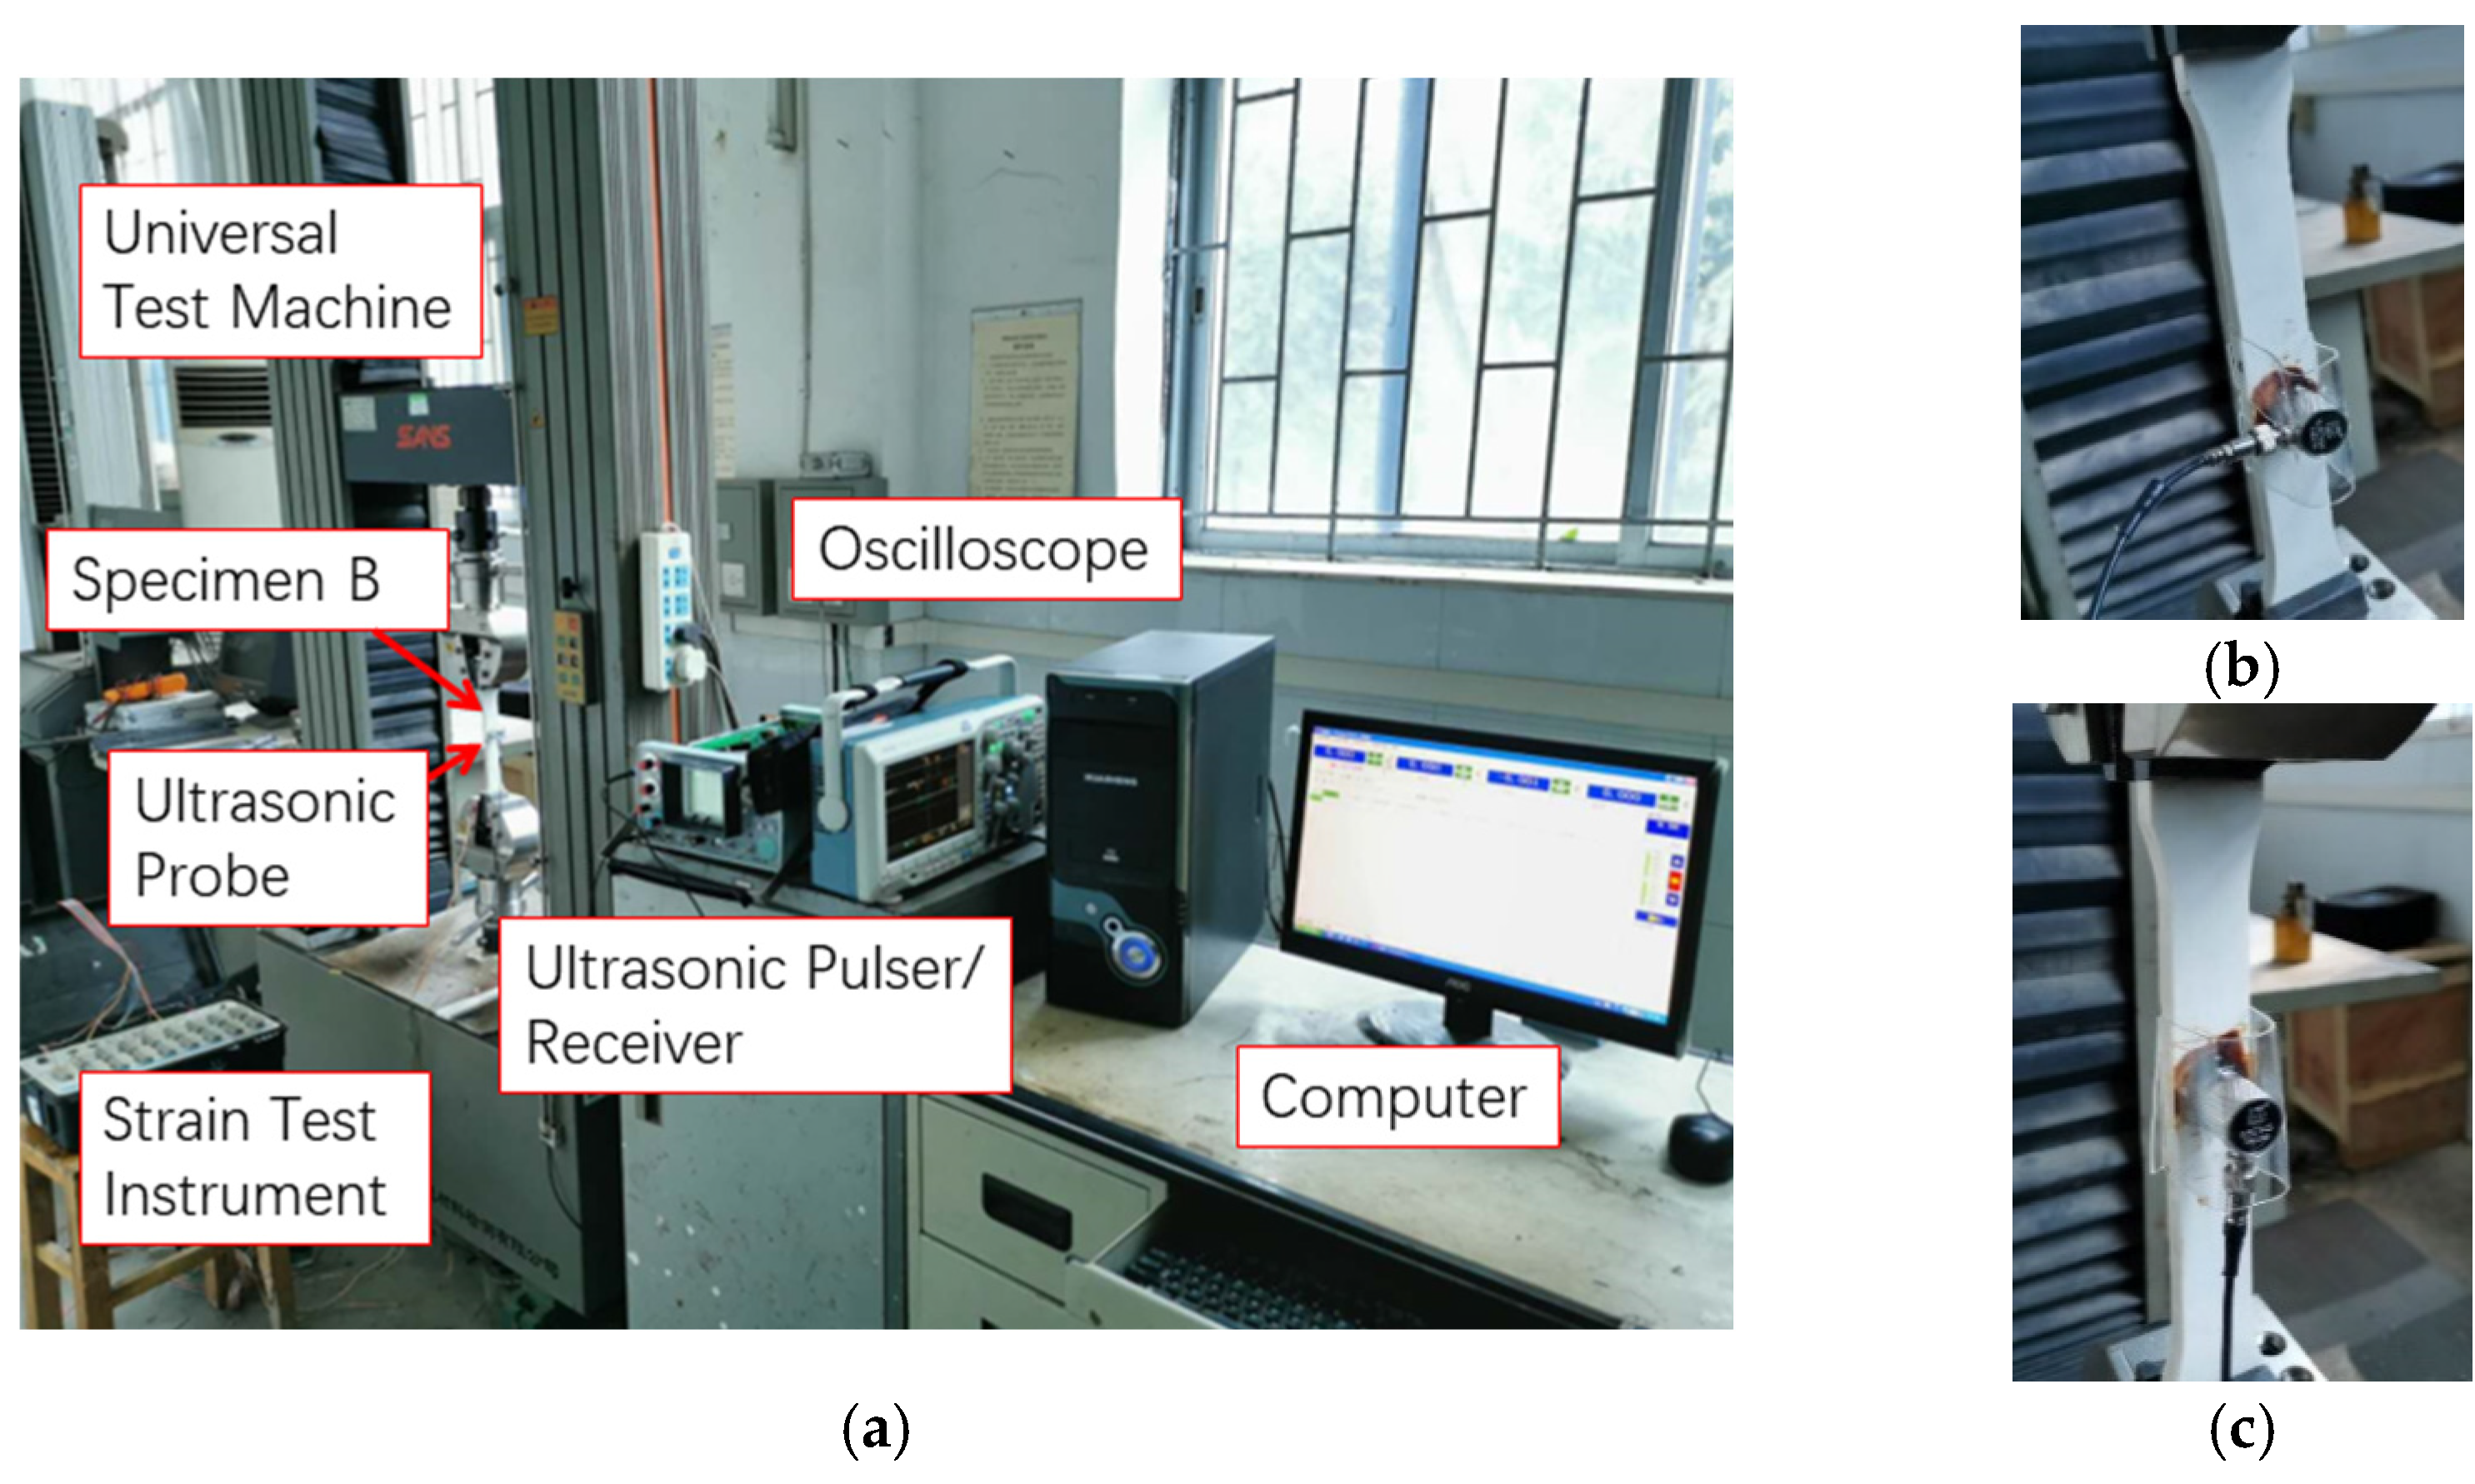
3.2. Acoustoelastic Coefficient Measurement System
3.3. Mechanical Simulation
4. Results and Discussion
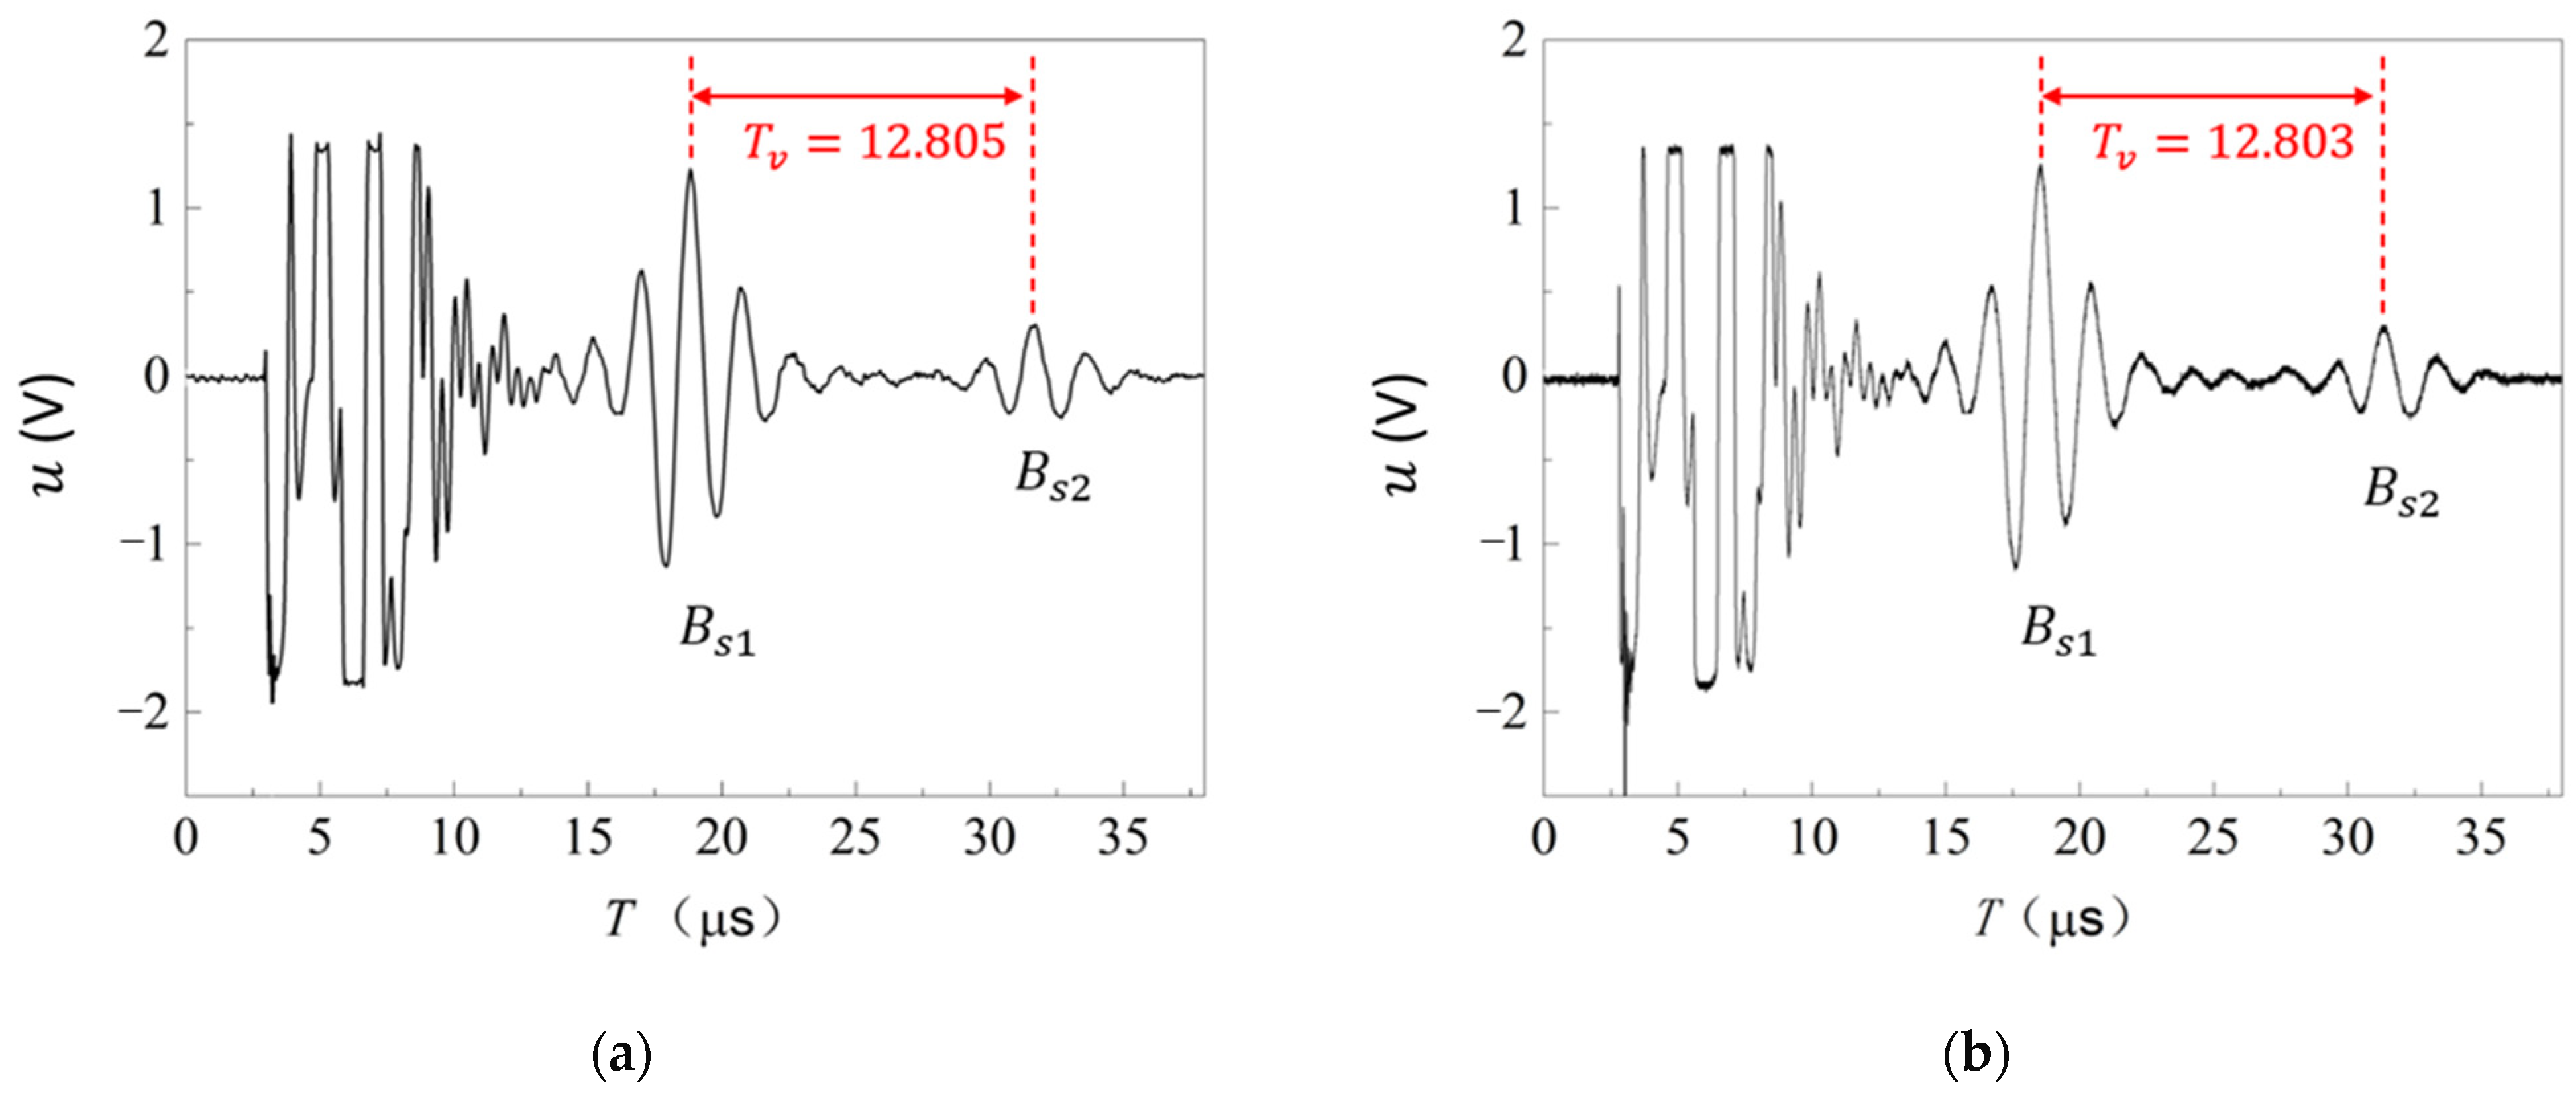
4.1. Ultrasonic Testing
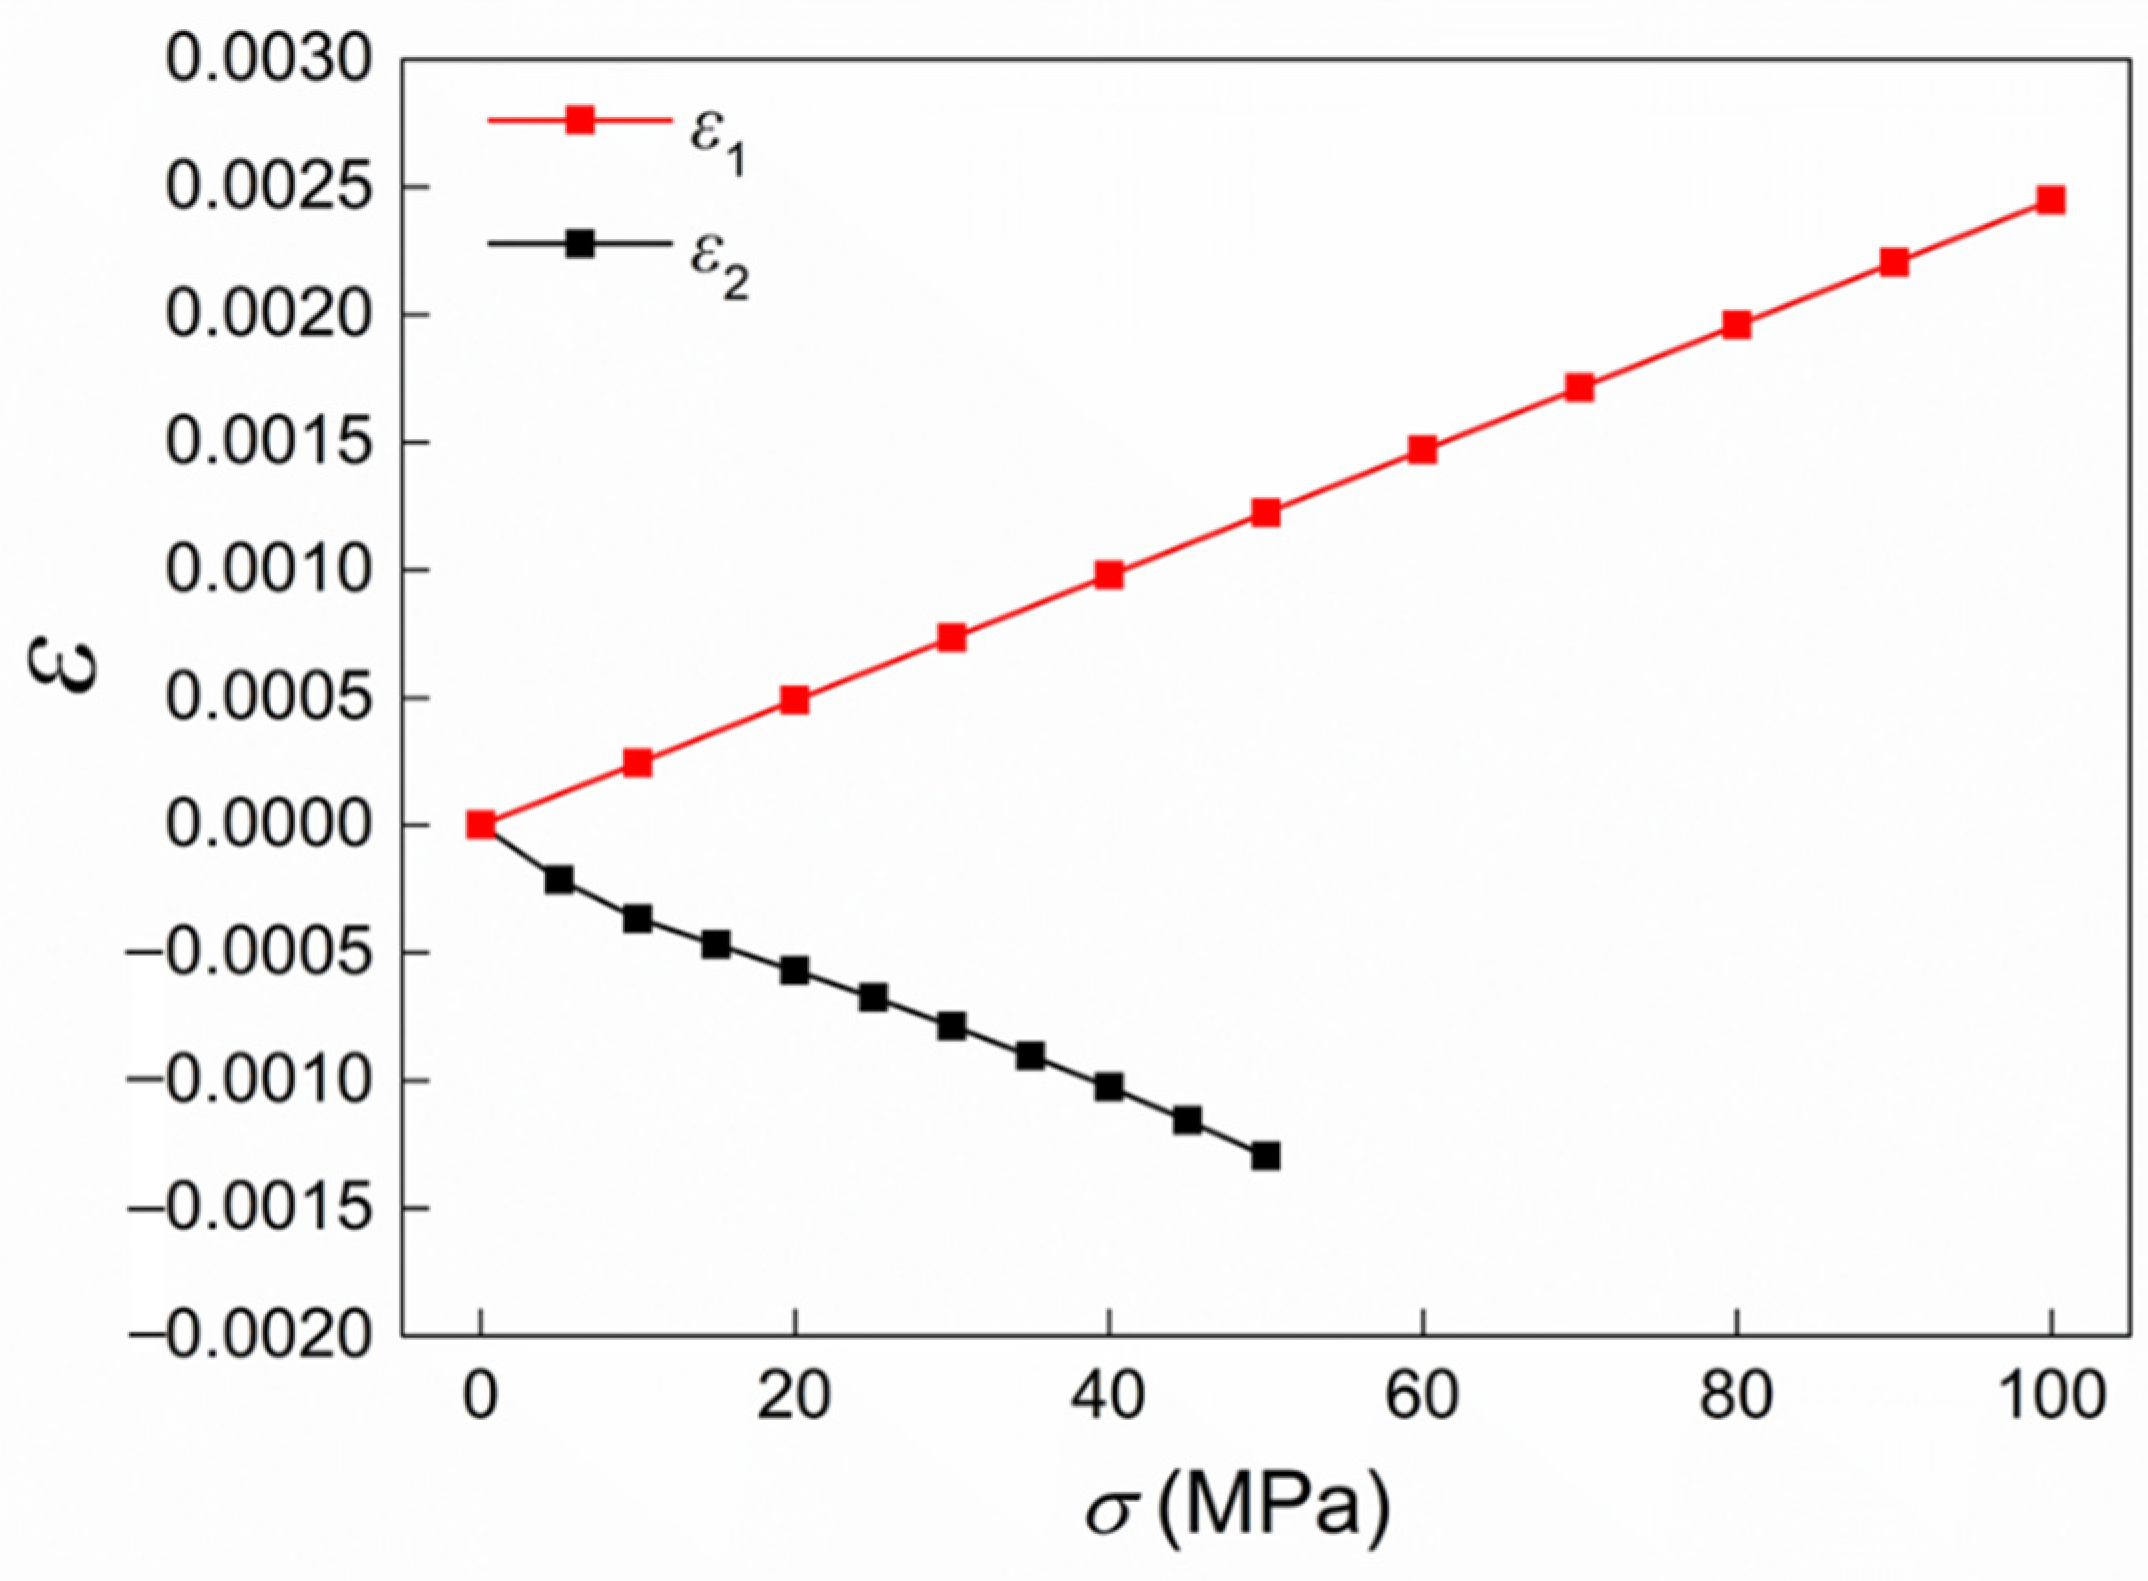
4.2. Deformation in the Direction of Ultrasonic Propagation
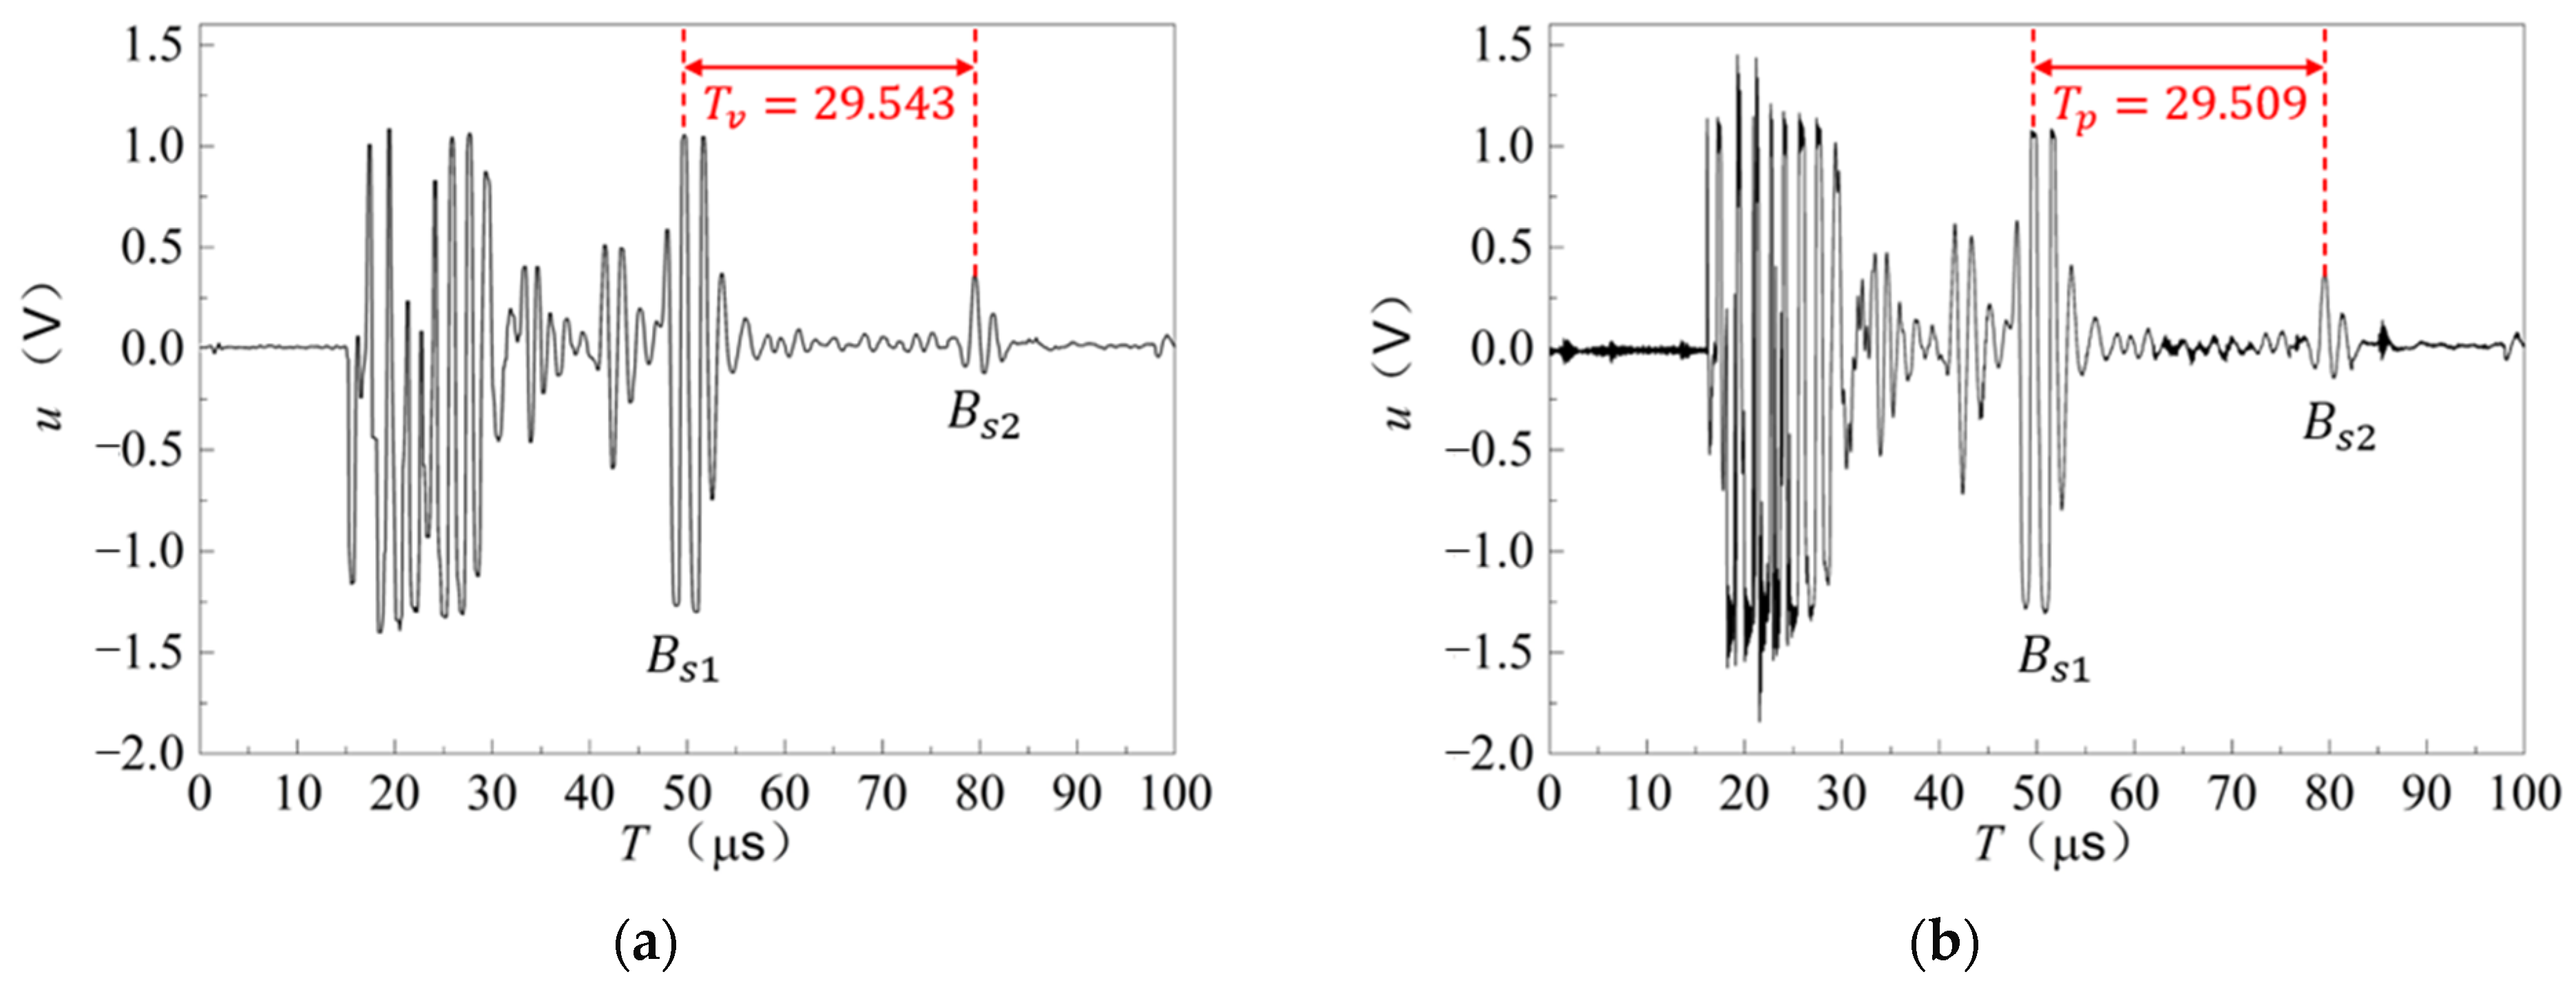
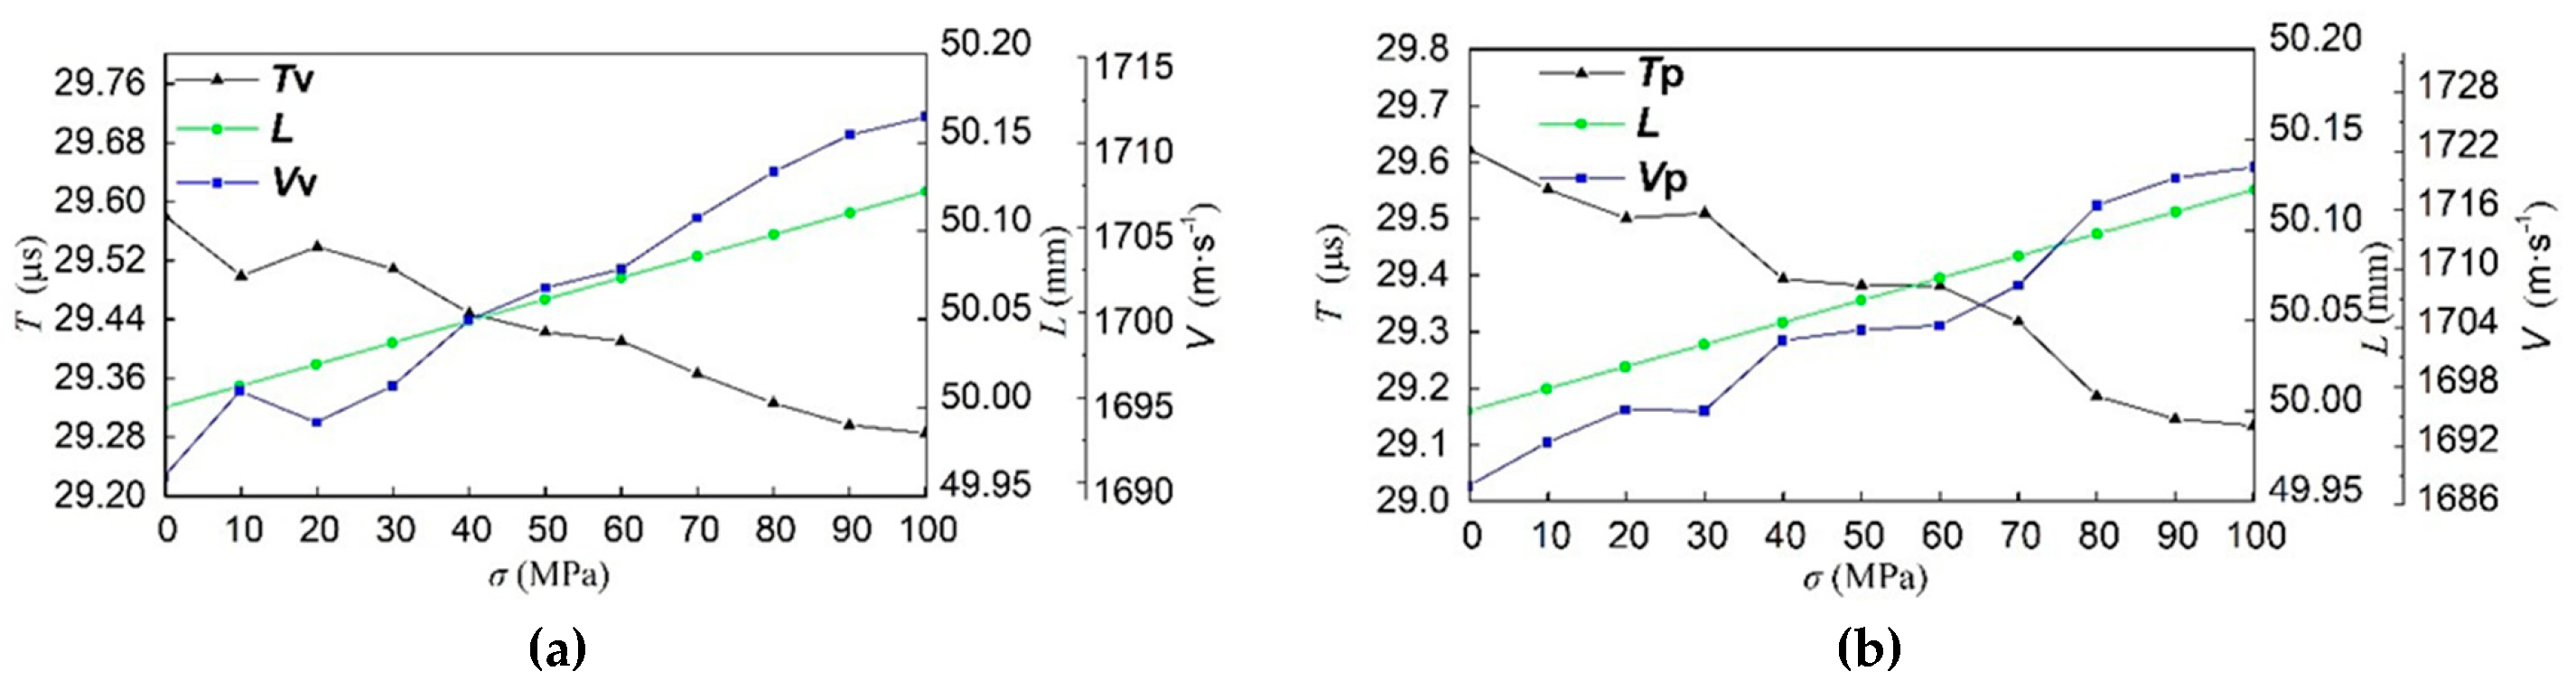
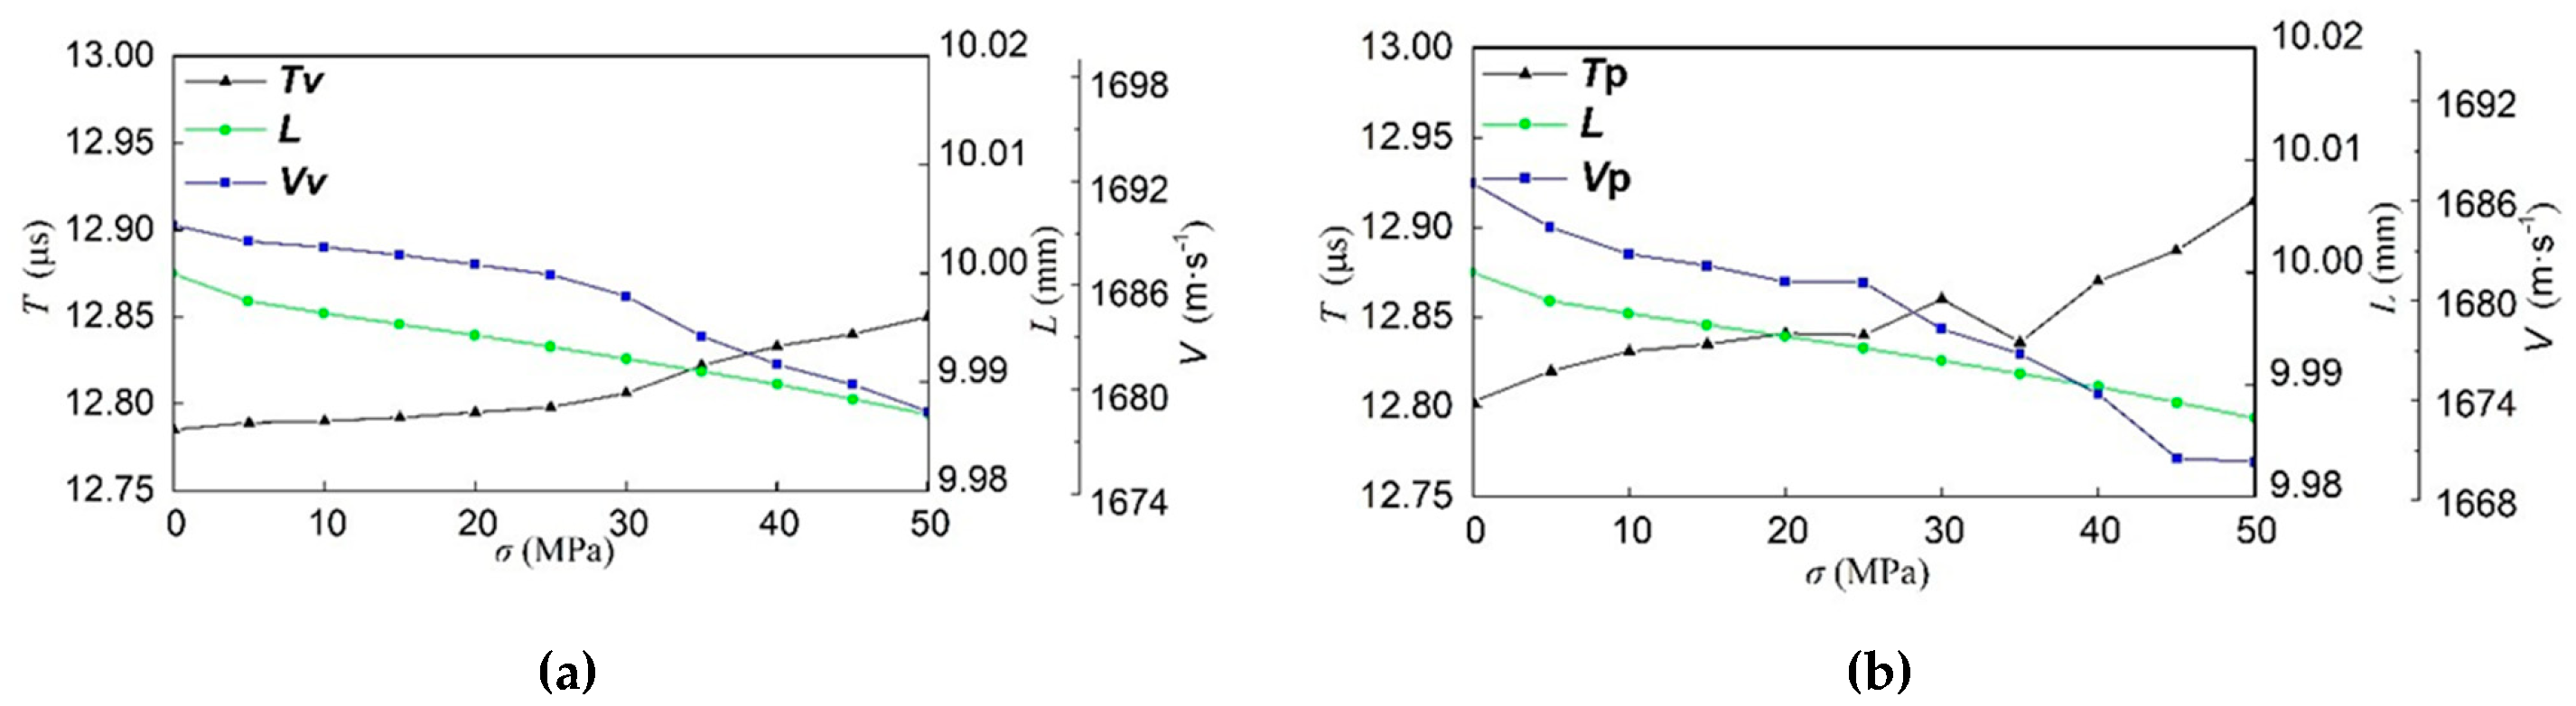
4.3. Ultrasonic Propagation Time, Distance, and Wave Velocity
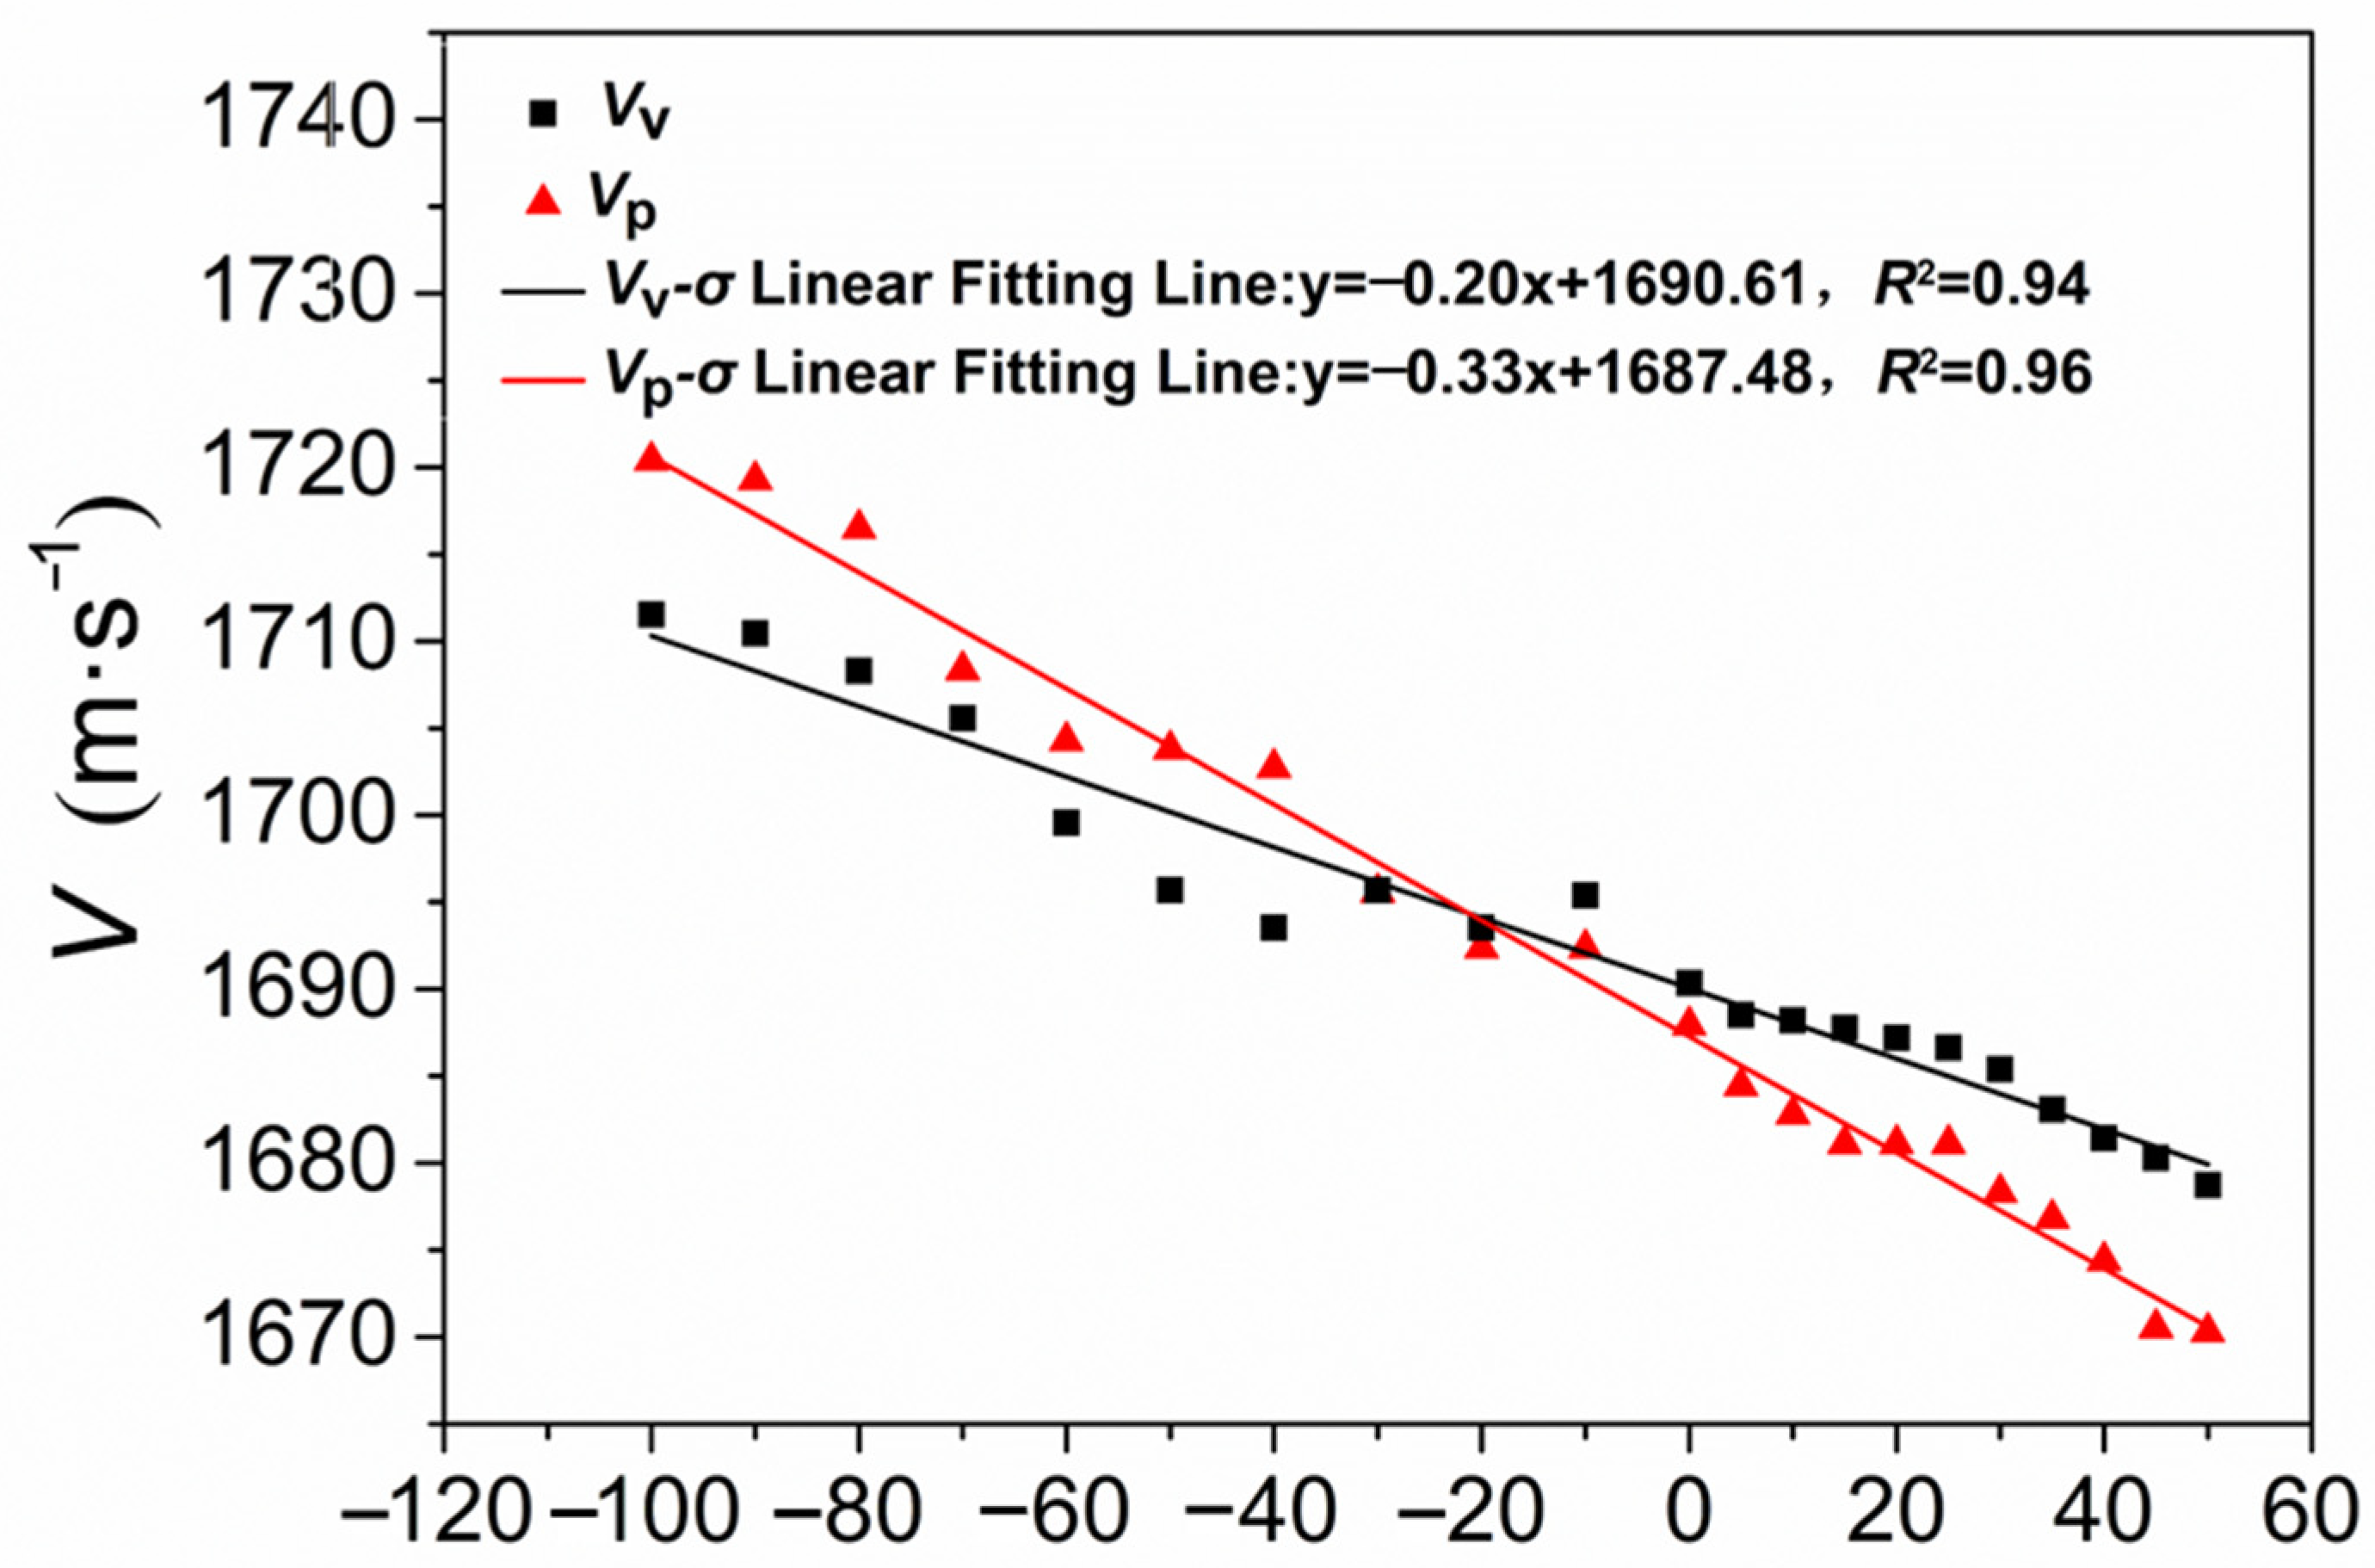
4.4. Relationship between Transverse Wave Velocity and Stress
4.5. Stress Measurement
5. Conclusions
- The acoustoelastic effect is verified using the transverse waves in GIS epoxy composites. The velocities of ultrasonic transverse waves increase linearly with the compressive stress and decrease linearly with the tensile stress. The acoustoelastic coefficients are −1.18 × 10⁻⁴ /MPa for transverse wave polarization vertical to stress and −1.96 × 10⁻⁴ /MPa for transverse waves parallel to stress.
- The maximum absolute values of relative errors are 35.4% and 26.3% for stress measurements with transverse wave polarization vertical and parallel to the stress direction, respectively.
- For the tangential internal stress measurements in GIS epoxy composites, in low-stress states, applying the transverse wave with polarization parallel to the stress obtains more accurate results compared to the transverse wave with polarization vertical to the stress and longitudinal waves. The maximum absolute value of relative error is 26.3% under 10 MPa compressive stress.
Supplementary Materials
Author Contributions
Funding
Institutional Review Board Statement
Informed Consent Statement
Data Availability Statement
Conflicts of Interest
References
- Qi, B.; Gao, C.; Li, C.; Xiong, J. The influence of surface charge accumulation on flashover voltage of GIS/GIL basin insulator under various voltage stresses. Int. J. Electr. Power Energy Syst. 2019, 105, 514–520. [Google Scholar] [CrossRef]
- Zou, Z.; Hao, Y.; Tian, F.; Zheng, Y.; He, W.; Yang, L.; Li, L. An Ultrasonic Longitudinal Through-Transmission Method to Measure the Compressive Internal Stress in Epoxy Composite Specimens of Gas-Insulated Metal-Enclosed Switchgear. Energies 2020, 13, 1248. [Google Scholar] [CrossRef]
- Exner, W.; Hein, R.; Mahrholz, T.; Wierach, P.; Monner, H.; Sinapius, M. Impact of nanoparticles on the process-induced distortions of carbon fiber reinforced plastics: An experimental and simulative approach. J. Appl. Polym. Sci. 2018, 136, 47031. [Google Scholar] [CrossRef]
- Li, B. The Design for SF6 High Voltage Apparatus; Machine Industry Press: Beijing, China, 2019; pp. 50–56. [Google Scholar]
- Fei, L.; Gong, X.; Chen, W. Factors influencing the water pressure of insulating spacer in GIS/GCB. High Volt. Appar. 2014, 50, 125–130. [Google Scholar]
- NB/T 42105-2016; Basin Insulator for High-Voltage Alternating Current Gas-Insulated Mental-Enclosed Switchgear. National Energy Administration: Beijing, China, 2016.
- Chen, Y.; Cui, B.Y.; Wang, N.H.; Liu, Y.; Wu, L.Y.; Cheng, P. Study of improving mechanical strength for 1100 kV spacer insulator. High Volt. Appar. 2015, 51, 52–62. [Google Scholar]
- Shu, N.Q.; Guan, X.Y.; Kang, B.; Li, Z.P.; Zou, M.H. Dynamic Electromagnetic Force Analysis of Three Phase Enclosure Type GIB Based on Field-Circuit Coupling Theory. Power System Technol. 2015, 39, 1456–1462. [Google Scholar]
- Wu, L.Y.; Wang, C.Y.; Chen, Y.; Cui, B.Y. Test and Analysis on mechanical properties of 252 kV basin-type insulator. Insul. Surge Arresters 2017, 1, 132–137. [Google Scholar]
- Yang, X.X.; Jia, L.C.; Meng, Q. A quantitative detection method for stress corrosion cracks in turbine discs using a BPSO-RBFNN model. Measure. Sci. Technol. 2019, 29, 095014. [Google Scholar] [CrossRef]
- Hao, Y.P.; Zheng, Y.; He, W.M.; Liang, X.; Zhang, Z.; Liu, L.; Yang, L.; Wang, G.; Gao, C.; Zhou, F. A Measurement Method of Ultrasonic Critical Refraction Longitudinal Wave for Thermal Stress in GIS Basin-Type Insulators. IEEE Transact. Instrument. Measure. 2022, 71, 6001009. [Google Scholar] [CrossRef]
- IEC 61462:2007; Composite Hollow Insulators–Pressurized and Unpressurized Insulators for Use in Electrical Equipment with Rated Voltage greater than 1000 V–Definitions, Test Methods, Acceptance Criteria and Design Recommendations. International Electrotechnical Commission: Geneva, Switzerland, 2007.
- Shi, Y.; Zhang, X.; Li, X.; Huang, R.H.; Wei, J.R.; Yao, S.J. Judgement method of basin insulator rupture process based on the analysis of stress and strain. Insul. Surge Arresters 2015, 2, 19–22. [Google Scholar]
- Guo, Z.H.; Wang, H.R.; Li, H.; Wang, C.; Peng, Z.R. Calculation and Experimental Study on Strain and Stress Distribution of UHV GIS Spacer During Hydrostatic Test. High Volt. Eng. 2018, 44, 993–1002. [Google Scholar]
- Wang, C.; Jia, J.; Zhao, L.; Bu, Y.; Jia, R.; Peng, Z. Discussion on the formation and action process of interface stress between the center conductor and the insulation material of the UHV spacer used in 110 kV GIS. J. Xi’an Univ. Technol. 2019, 35, 155–162. [Google Scholar]
- Dos Santos, A.A.; Ambiel, L.B.; Garcia, R.H.; Rodovalho, T.G. Stress analysis in carbon/epoxy composites using Lcr waves. J. Compos. Mater. 2013, 48, 3425–3434. [Google Scholar] [CrossRef]
- Bray, D.E.; Junghans, P. Application of the LCR ultrasonic technique for evaluation of post-weld heat treatment in steel plates. NDT E Int. 1995, 28, 235–242. [Google Scholar] [CrossRef]
- He, J.B.; Li, Z.H.; Teng, J.; Li, M.; Wang, Y. Absolute stress field measurement in structural steel members using the Lcr wave method. Measurement 2018, 122, 679–687. [Google Scholar] [CrossRef]
- Ling, Z.W.; Zhou, H.L.; Zhang, H.J. Nondestructive Pressure Measurement in vessels Using Rayleigh Waves and LCR Waves. IEEE Transact. Instrument. Measure. 2009, 58, 1578–11584. [Google Scholar] [CrossRef]
- Jhang, K.; Quan, H.; Ha, J.; Kim, N. Estimation of clamping force in high-tension bolts through ultrasonic velocity measurement. Ultrasonics 2006, 44, e1339–e1342. [Google Scholar] [CrossRef]
- Fukuoka, H.; Toda, H.; Yamane, T. Acoustoelastic Stress Analysis of Residual Stress in a Patch-weld Disk. Exp. Mech. 1978, 7, 277–280. [Google Scholar] [CrossRef]
- Karen, F.B.; Vladimir, G.H. Ultrasonic tests in the evaluation of the stress level in concrete prisms based on the acoustoelasticity. Construct. Build. Mater. 2018, 162, 740–750. [Google Scholar]
- Mark, E.F.; Allison, S.G. Interrupted Ultrasonic Bolt Load Measurements Using the Pulsed Phase-Locked Loop System. IEEE Transact. Instrument. Measure. 1996, 45, 112–116. [Google Scholar]
- Hirao, M.; Ogi, H.; Yasui, H. Contactless measurement of bolt axial stress using a shear-wave Electromagnetic acoustic transducer. NDT E Int. 2001, 34, 179–183. [Google Scholar] [CrossRef]
- Kudryavtsev, Y.; Kleiman, J. Non-Destructive Measurement of Residual Stresses in railway Wheels by Ultrasonic Method. In Proceedings of the 18th International Wheelset Congress, Chengdu, China, 7–10 November 2016. [Google Scholar]
- Masumi, H.; Yasutoshi, S. Acoustoelastic birefringence effect in wood III: Ultrasonic Stress Determination of Wood by Acoustoelastic Birefringence Method. J. Wood Sci. 2004, 50, 108–114. [Google Scholar]
- Li, J.; Xue, R.; Zhao, R.; He, J.; Chen, Y. Residual Stress Detection Technology for Aramid Reinforced Epoxy Composites Based on Acoustic-Elastic Effect. Transact. China Electrotech. Soc. 2023, 38, 2519–2527. [Google Scholar]
- Zou, Z.; Hao, Y.P.; Zheng, Y.; Tian, F.; Yang, L.; Li, L. Subsurface Stress Measurement in GIS Epoxy Composite by Using LCR Waves. Energies 2020, 13, 3725. [Google Scholar] [CrossRef]
- GB/T 1040.2:2006; Determination of the Tensile Properties. General Administration of Quality Supervision, Inspection and Quarantine of the People’s Republic of China and National Standardization Administration of China: Beijing, China, 2006.
- GB/T 13283:2008; Accuracy Class of Measuring Instruments and Display Instruments for Industrial Process Measurement and Control. General Administration of Quality Supervision, Inspection and Quarantine of the People’s Republic of China and National Standardization Administration of China: Beijing, China, 2008.


| Ultrasonic Waves to Measure Tangential Internal Stress | Linear Fitting Line Slope k (m/s/MPa) | Acoustoelastic Coefficient K (×10−4/MPa) |
|---|---|---|
| Transverse waves with polarization vertical to stress | −0.2 | −1.18 |
| Transverse waves with polarization parallel to stress | −0.3 | −1.96 |
| Longitudinal waves [2] | 0.141 | 0.456 |
Disclaimer/Publisher’s Note: The statements, opinions and data contained in all publications are solely those of the individual author(s) and contributor(s) and not of MDPI and/or the editor(s). MDPI and/or the editor(s) disclaim responsibility for any injury to people or property resulting from any ideas, methods, instructions or products referred to in the content. |
© 2023 by the authors. Licensee MDPI, Basel, Switzerland. This article is an open access article distributed under the terms and conditions of the Creative Commons Attribution (CC BY) license (https://creativecommons.org/licenses/by/4.0/).
Share and Cite
Zou, Z.; Qiu, H.; Tian, F.; Kuang, C.; He, W.; Zhou, F.; Gu, Y.; Ma, H.; Ruan, Y.; Huang, Z. Stress Measurements of GIS Epoxy Composite with Transverse Waves Based on the Ultrasonic Pulse-Echo Method. Appl. Sci. 2023, 13, 11317. https://doi.org/10.3390/app132011317
Zou Z, Qiu H, Tian F, Kuang C, He W, Zhou F, Gu Y, Ma H, Ruan Y, Huang Z. Stress Measurements of GIS Epoxy Composite with Transverse Waves Based on the Ultrasonic Pulse-Echo Method. Applied Sciences. 2023; 13(20):11317. https://doi.org/10.3390/app132011317
Chicago/Turabian StyleZou, Zhouyiao, Haian Qiu, Fangyuan Tian, Cuizhe Kuang, Weiming He, Fusheng Zhou, Yu Gu, Haomin Ma, Youde Ruan, and Zhiming Huang. 2023. "Stress Measurements of GIS Epoxy Composite with Transverse Waves Based on the Ultrasonic Pulse-Echo Method" Applied Sciences 13, no. 20: 11317. https://doi.org/10.3390/app132011317
APA StyleZou, Z., Qiu, H., Tian, F., Kuang, C., He, W., Zhou, F., Gu, Y., Ma, H., Ruan, Y., & Huang, Z. (2023). Stress Measurements of GIS Epoxy Composite with Transverse Waves Based on the Ultrasonic Pulse-Echo Method. Applied Sciences, 13(20), 11317. https://doi.org/10.3390/app132011317