Article

High-Frequency Harmonic Suppression Strategy and Modified Notch Filter-Based Active Damping for Low-Inductance HPMSM

The State Key Laboratory of Electrical Insulation and Power Equipment, Xi’an Jiaotong University, Xi’an 710049, China
*
Author to whom correspondence should be addressed.
Appl. Sci. 2023, 13(20), 11309; https://doi.org/10.3390/app132011309
Submission received: 2 September 2023 / Revised: 2 October 2023 / Accepted: 12 October 2023 / Published: 14 October 2023
(This article belongs to the Special Issue New Technologies for Power Electronic Converters and Inverters)

Abstract

:
The voltage inverters have the high-frequency switching characteristic, which will generate massive high-frequency harmonics in the motors. Especially, the inductance of the high-speed permanent magnet synchronous motor (HPMSM) is designed to be small, and the high-frequency harmonic content will be higher than that of ordinary motors, which adversely affects the system. To overcome this problem, this paper proposed a harmonic suppression method based on the LC filter and the adaptive notch filter for HPMSMs. The LC filter is connected between the inverter and the HPMSM to filter out high-frequency harmonics, however, at the cost of the system resonance. Therefore, the adaptive notch filter with the frequency tracking capability is designed to offset specific resonant peaks by constructing an antiresonant peak. The least mean square adaptive algorithm automatically adjusts the filter parameters according to the variation of the input signal to ensure accurate filtering in complex cases. Simulation and experiment results prove the practicability and effectiveness of the proposed scheme. The harmonic contents of HPMSM are significantly reduced, and the dynamic response performance of the control system is improved.

1. Introduction

The advantages of the high-speed permanent magnet synchronous motor (HPMSM) include high power density, high reliability, fast operation, and the possibility of direct connection to the load. Therefore, it is widely used in industry, especially in compressor machines, vacuum cleaners, generators, etc. [1,2,3]. However, the structural characteristics and operating conditions of HPMSM determine that the stator inductance is generally designed to be small, and the electrical frequency is also much higher than that of conventional motors [4,5]. The voltage source inverter (VSI) is a common driver device for motor control, which has a high switching frequency and will generate a large number of high-frequency current harmonics. The harmonics mainly appear around the switching frequency and its integer multiples, causing distortion of the current in the motor windings [6,7,8]. Abundant harmonic currents will induce large noise, iron loss, and torque turbulence, leading to the reduction of motor capability and system efficiency [9,10,11].
To restrain the current harmonics, increasing the equivalent inductance is the most simple and intuitive method. In [12], series inductors are connected in series in each phase of the stator winding to increase the equivalent inductance and successfully reduce the harmonic component of the stator current. Nevertheless, the series inductors will inevitably enlarge the volume and weight of the system. It has been proposed to add LC filters between the three-phase stator winding and the inverter, which can effectively reduce the increase in system size while providing filtering effects [13]. However, the introduction of the LC filter brings about a resonance peak in the system. Due to the low circuit impedance, the voltage and current oscillations will appear, which brings challenges to the stability of the drive system.
To overcome this, many papers have proposed damping technologies for suppressing the resonant peak, which are mainly divided into two categories: the passive damping method and the active damping method. One of the most commonly used passive damping schemes is to connect the damping resistance with the filter capacitor in series, because of its simple design and implementation [14]. In order to obtain good high-frequency attenuation and very low damping loss, many improved passive filter topologies have been proposed and verified [15,16,17]. Additionally, in [18], the “critical damping ratio” metric is first introduced and solved, which provides an efficient and accurate method for the damping design of filters. However, although the passive damping method has the effect of suppressing resonance, it will inevitably cause additional power losses, which decreases the efficiency of the system [19]. As a result, the active damping scheme with no additional loss has been favored by the industry, and the active damping strategy has been widely studied and developed in academic circles. In [20], a virtual impedance system is built by using the transfer function equivalent method. The impedance is emulated using the feedback current of the filter capacitor to provide the damping effect, so it will not consume any extra energy of the system. Other active damping methods such as high-pass filters [21], hysteresis networks [22,23,24], infinite impulse response (IIR) digital filters [25,26], weighted feedback currents (WAC) [27], etc. have been investigated. However, in most cases, those methods require additional sensors, which enlarge the system volume, increase cost, and enhance the possibility of interference.
Subsequently, a filter-based active damping technique was proposed in [28]. It was achieved by simply inserting a low-pass filter or notch filter in the forward path of the current control loop; thus, no extra sensors are required, which makes the method emerge as a promising alternative to active damping. Actually, the trap filter concept was primarily implemented in [28], where a genetic algorithm was applied to regulate the trap filter. Furthermore, in [29], active filter-based damping techniques are summarized and analyzed in the literature, and through simulations and experiments, the trap filter solution proves to be the most flexible and effective active damping method, but the robustness of the scheme may face challenges when parameter variations are taken into account, which severely limits the application of the method. In addition, unlike the relatively constant frequency in grid systems, the frequency of the motor varies considerably during operation, so the frequency-tracking performance of the notch filter is critical [30].
In this paper, a high-frequency harmonic suppression method based on the LC filter and the adaptive notch filter (ANF) is proposed. The LC filter is used to suppress the high-frequency harmonic components of the stator current, and its parameter design method is given after considering the applicable range and voltage drop. The ANF is set to eliminate the consequent resonant peak. Noteworthily, the least mean square (LMS) algorithm is applied as an adaptive law to the notch filter, whose characteristics can vary with harmonics and noise, thus making the system adaptable. Moreover, through the speed feedback, the notch filter is able to track the shift of the system resonant frequency and achieve frequency adaption. The robustness and dynamic response capability of the HPMSM are improved.
The remainder of the article is organized as follows. In Section 2, the mathematical model of the HPMSM is established, and the high-frequency current harmonics are analyzed. In Section 3, the HPMSM system with LC filter is introduced, and the damping technology of resonance peak suppression is discussed. Section 4 describes the modified ANF structure and the implementation of the control system. In Section 5, the simulation results are analyzed. In Section 6, experiments are carried out, and the practicability and effectiveness of the scheme are proved. Finally, Section 7 concludes this article.

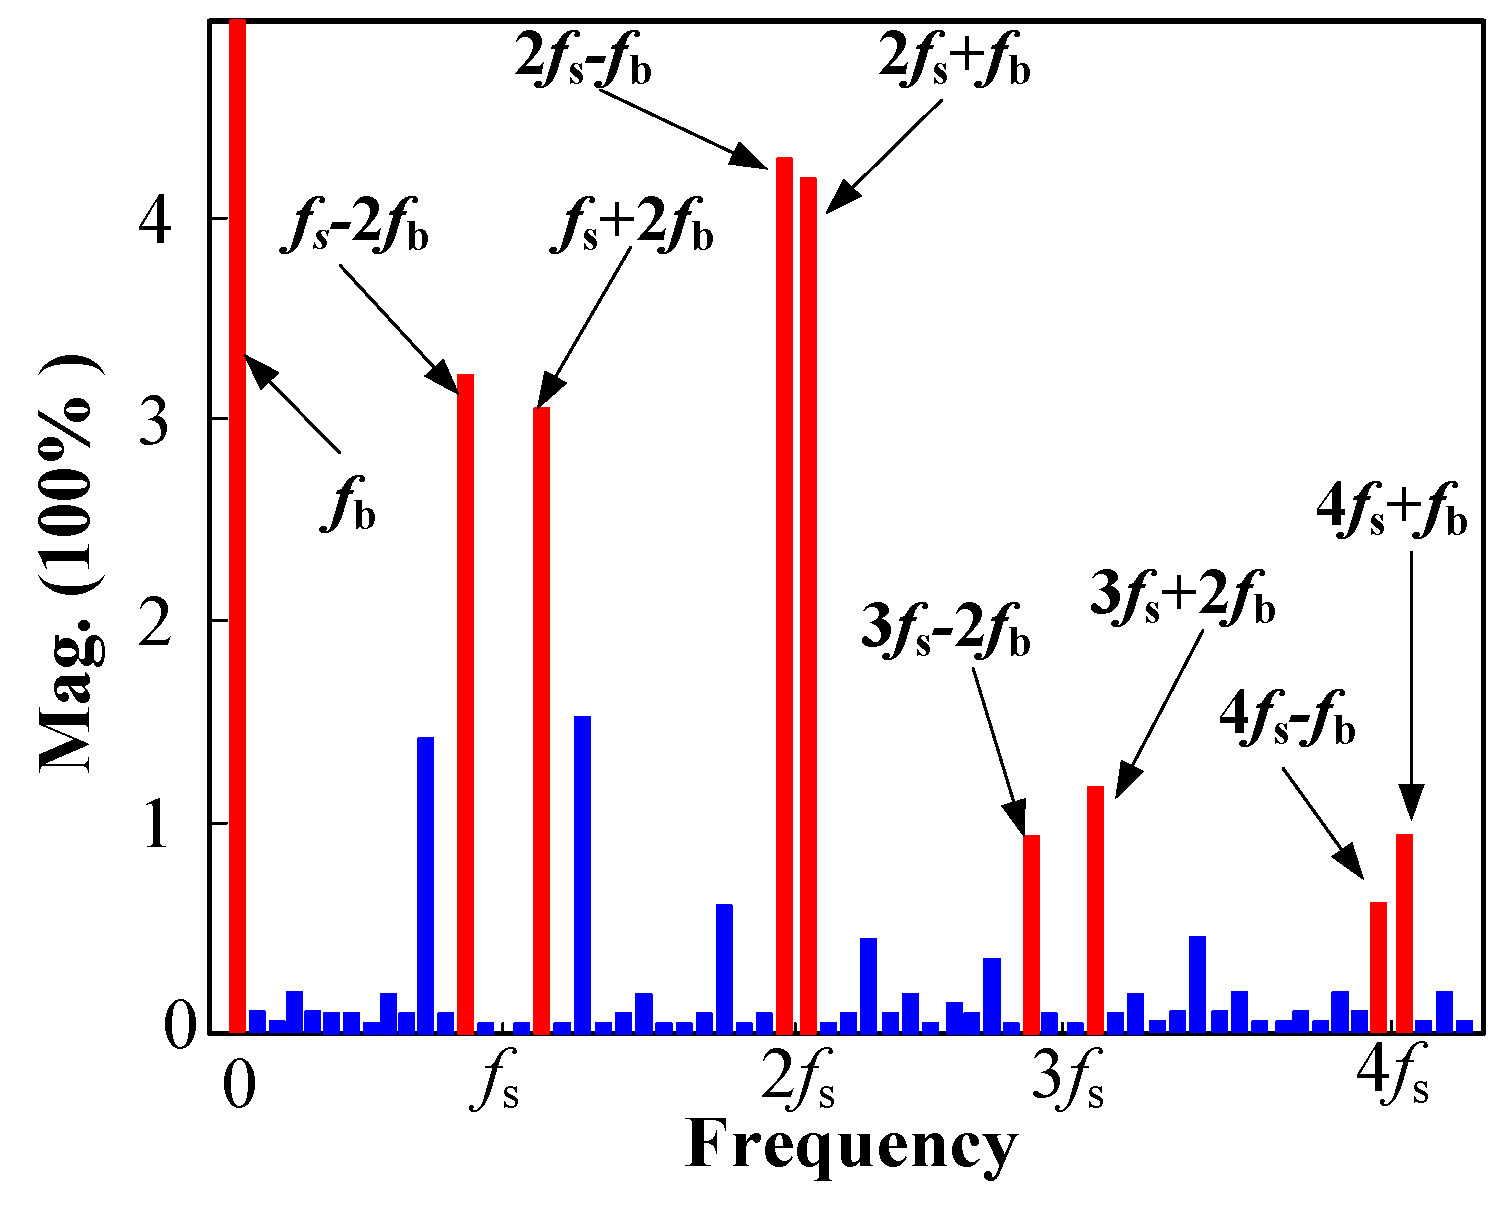
2. High-Frequency Current Harmonics Analysis of HPMSM

In order to analyze the high-frequency current harmonics of HPMSM, it is necessary to establish its mathematical model. The mathematical model of PMSM is studied in [31]. Because the circuit topology is the same, this model is also applicable to HPMSM. The voltage equation for the three-phase winding of HPMSM in the three-phase coordinate system can be written as
u A = R i A + d ψ A d t ,
u B = R i B + d ψ B d t ,
u C = R i C + d ψ C d t .
where uA, uB, uC represent three-phase voltages respectively; iA, iB, iC represent three-phase currents; ψA, ψB, ψC represent three-phase flux linkages. R is the stator winding resistance.
The HPMSM is a complex nonlinear system, and, for its high-performance control, vector control methods are proposed, which require the reconstruction of the motor mathematical model in the d-q coordinate system.
By using Clark transformation and Park transformation, the following current expression in d-q coordinate system is obtained as
i d i q = 2 3 cos θ e cos ( θ e 2 π 3 ) cos ( θ e + 2 π 3 ) sin θ e sin ( θ e 2 π 3 ) sin ( θ e + 2 π 3 ) i A i B i C .
where id, iq are the stator currents in d-q axis; θ e is the electrical angle of the rotor.
The flux linkage equation in d-q coordinate system can be expressed as
ψ d = L d i d + ψ f ψ q = L q i q ,
where ψd, ψq are the flux linkages in d-q axis; Ld, Lq are the winding inductances in d-q axis; ψf is the flux linkage generated by the permanent magnet.
The voltage equation in d-q coordinate system is
u d = R i d + L d d i d d t ω e L q i q u q = R i q + L q d i q d t + ω e ( L d i d + ψ f ) ,
where ud, uq are the d-axis and q-axis stator voltages; ω e is the electrical angular speed of the rotor.
For the purpose of achieving efficient control of the HPMSM, a drive control method based on the SVPWM technology is used.
The SVPWM drive voltage signal contains a large number of PWM harmonics and their sideband components in steady-state operation, and the odd and even times sideband harmonics of the carrier wave have different variation patterns, respectively. The harmonic frequency contained in the three-phase stator currents can be expressed as [9]
n f s ± k f b ,
where fs, fb are the switching frequency and fundamental frequency, respectively; n, k are the harmonic orders of the switching frequency and the fundamental frequency, respectively. When n is odd, k is a positive even number that is not an integer multiple of 3. When n is even, k is a positive odd number that is not an integer multiple of 3.
Set fs to 10 kHz and fb to 500 Hz; the three-phase current harmonics are plotted in Figure 1. The Harmonics with high content are marked in red, and the other harmonics are represented by blue bars. As shown in the figure, the main current harmonics appear in the vicinity of the switching frequency, which is consistent with (7).
The current harmonic content is further studied in [9], where the amplitude of the first and second harmonic sidebands have been obtained as
I s _ ω s ± 2 ω b = U d c M 2 2 + N 1 2 + 2 M 2 N 1 cos ( 2 φ 0 ) 8 π ( f s ± 3 f b ) I s _ ω s ± 4 ω b = U d c M 1 2 + N 2 2 + 2 M 1 N 2 cos ( 2 φ 0 ) 8 π ( f s ± 3 f b ) ,
I s _ 2 ω s ± ω b = U d c C 1 8 π f s sin 2 φ 0 L d 2 + cos 2 φ 0 L q 2 I s _ 2 ω s ± 5 ω b = U d c M 4 2 + N 3 2 + 2 M 4 N 3 cos ( 2 φ 0 ) 8 π ( 2 f s ± 6 f b ) I s _ 2 ω s ± 7 ω b = U d c M 3 2 + N 4 2 + 2 M 3 N 4 cos ( 2 φ 0 ) 8 π ( 2 f s ± 6 f b ) .
where Udc is the bus voltage; φ 0 is the initial phase of stator voltage vector; M1–4 and N1–4 are the constants which can be expressed as
M 1 = C 2 L d C 2 L q , M 2 = C 2 L d + C 2 L q , M 3 = C 5 L d C 5 L q , M 4 = C 5 L d + C 5 L q , N 1 = C 4 L d C 4 L q , N 2 = C 4 L d + C 4 L q , N 3 = C 7 L d C 7 L q , N 4 = C 7 L d + C 7 L q , .
where C1–7 are the constants expressed as Bessel functions, which is related to the modulation coefficient.
According to (8)–(10), the magnitude of the three-phase current harmonics will be high when d-q axis inductances are small, so the filtering of harmonics is necessary.
The harmonics around the primary and secondary switching frequencies have been resolved above, and higher harmonics can be analyzed similarly.

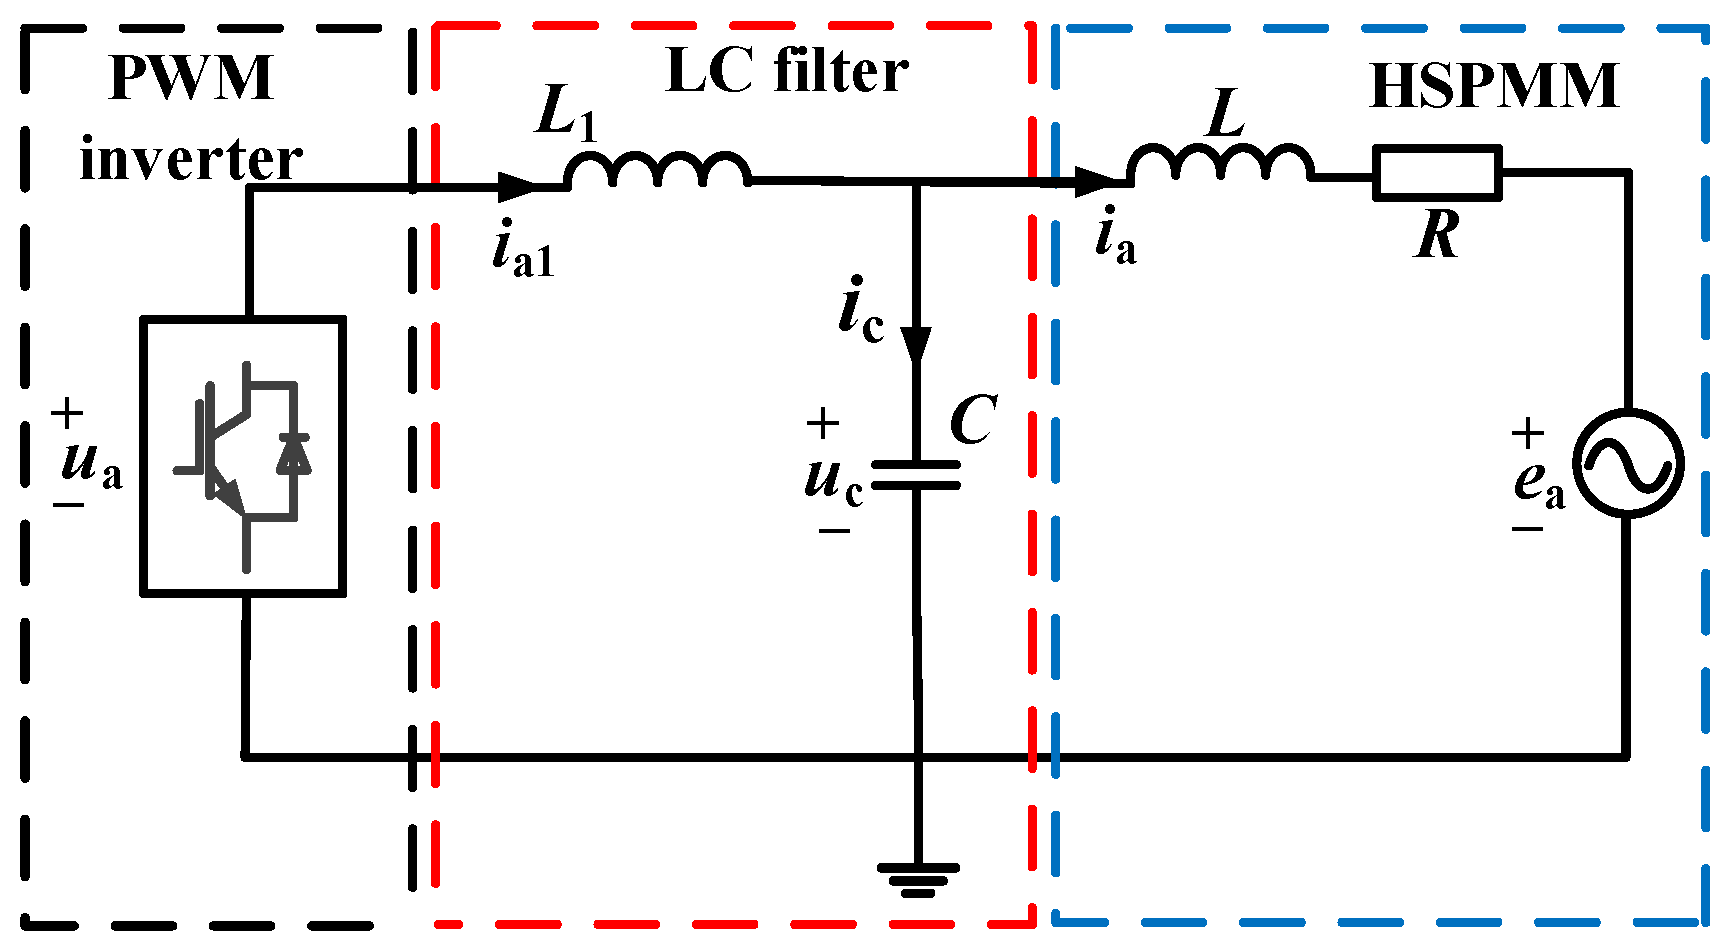
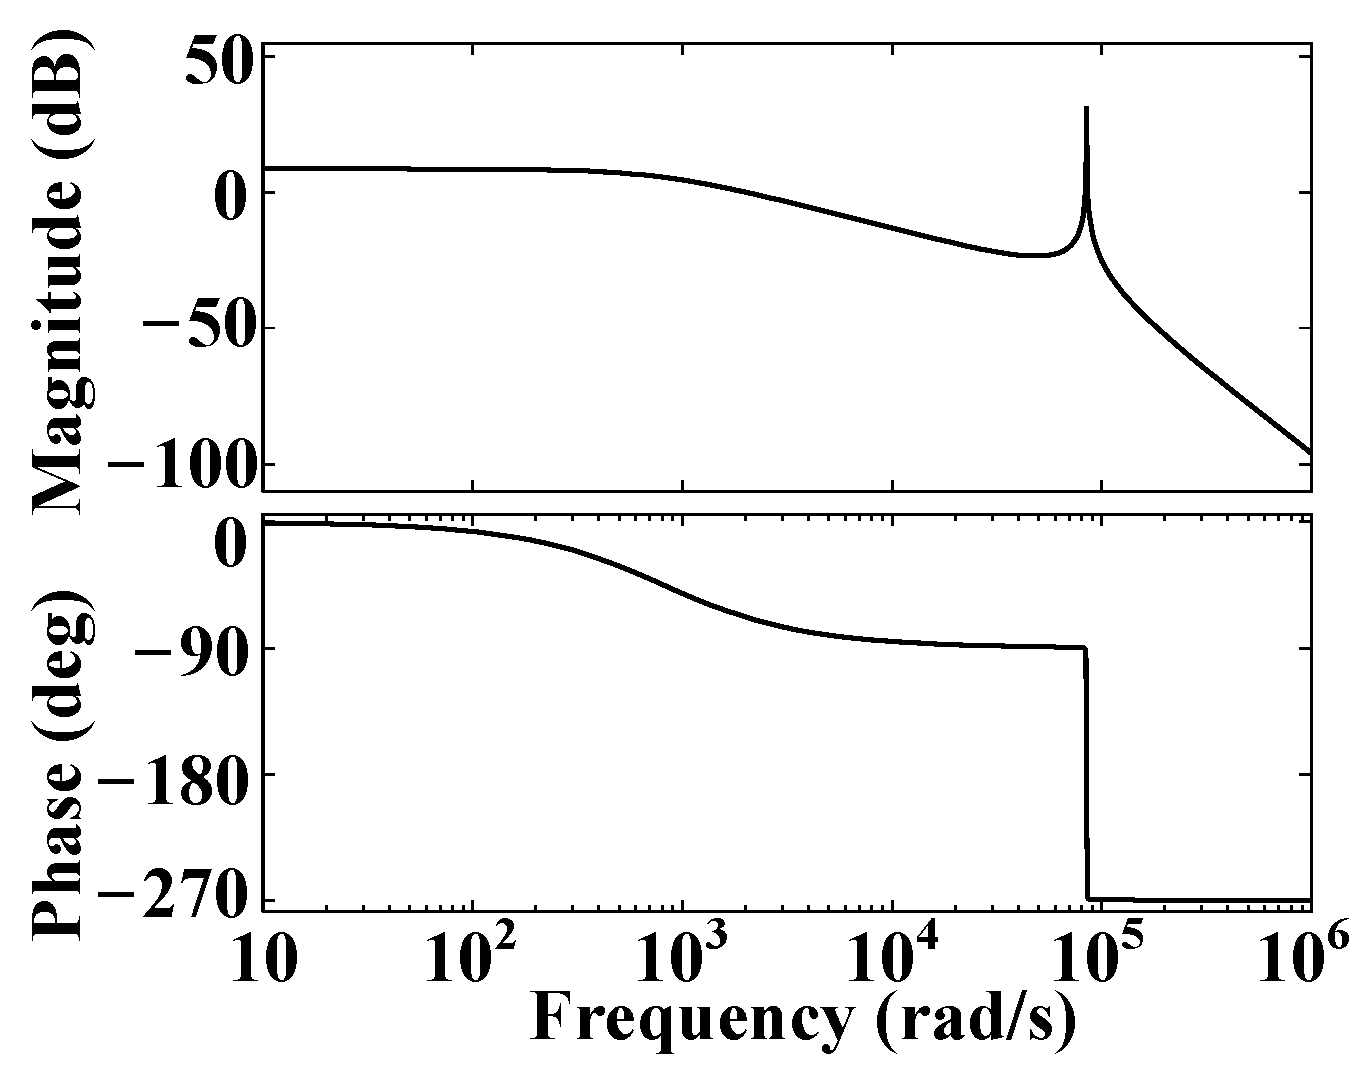
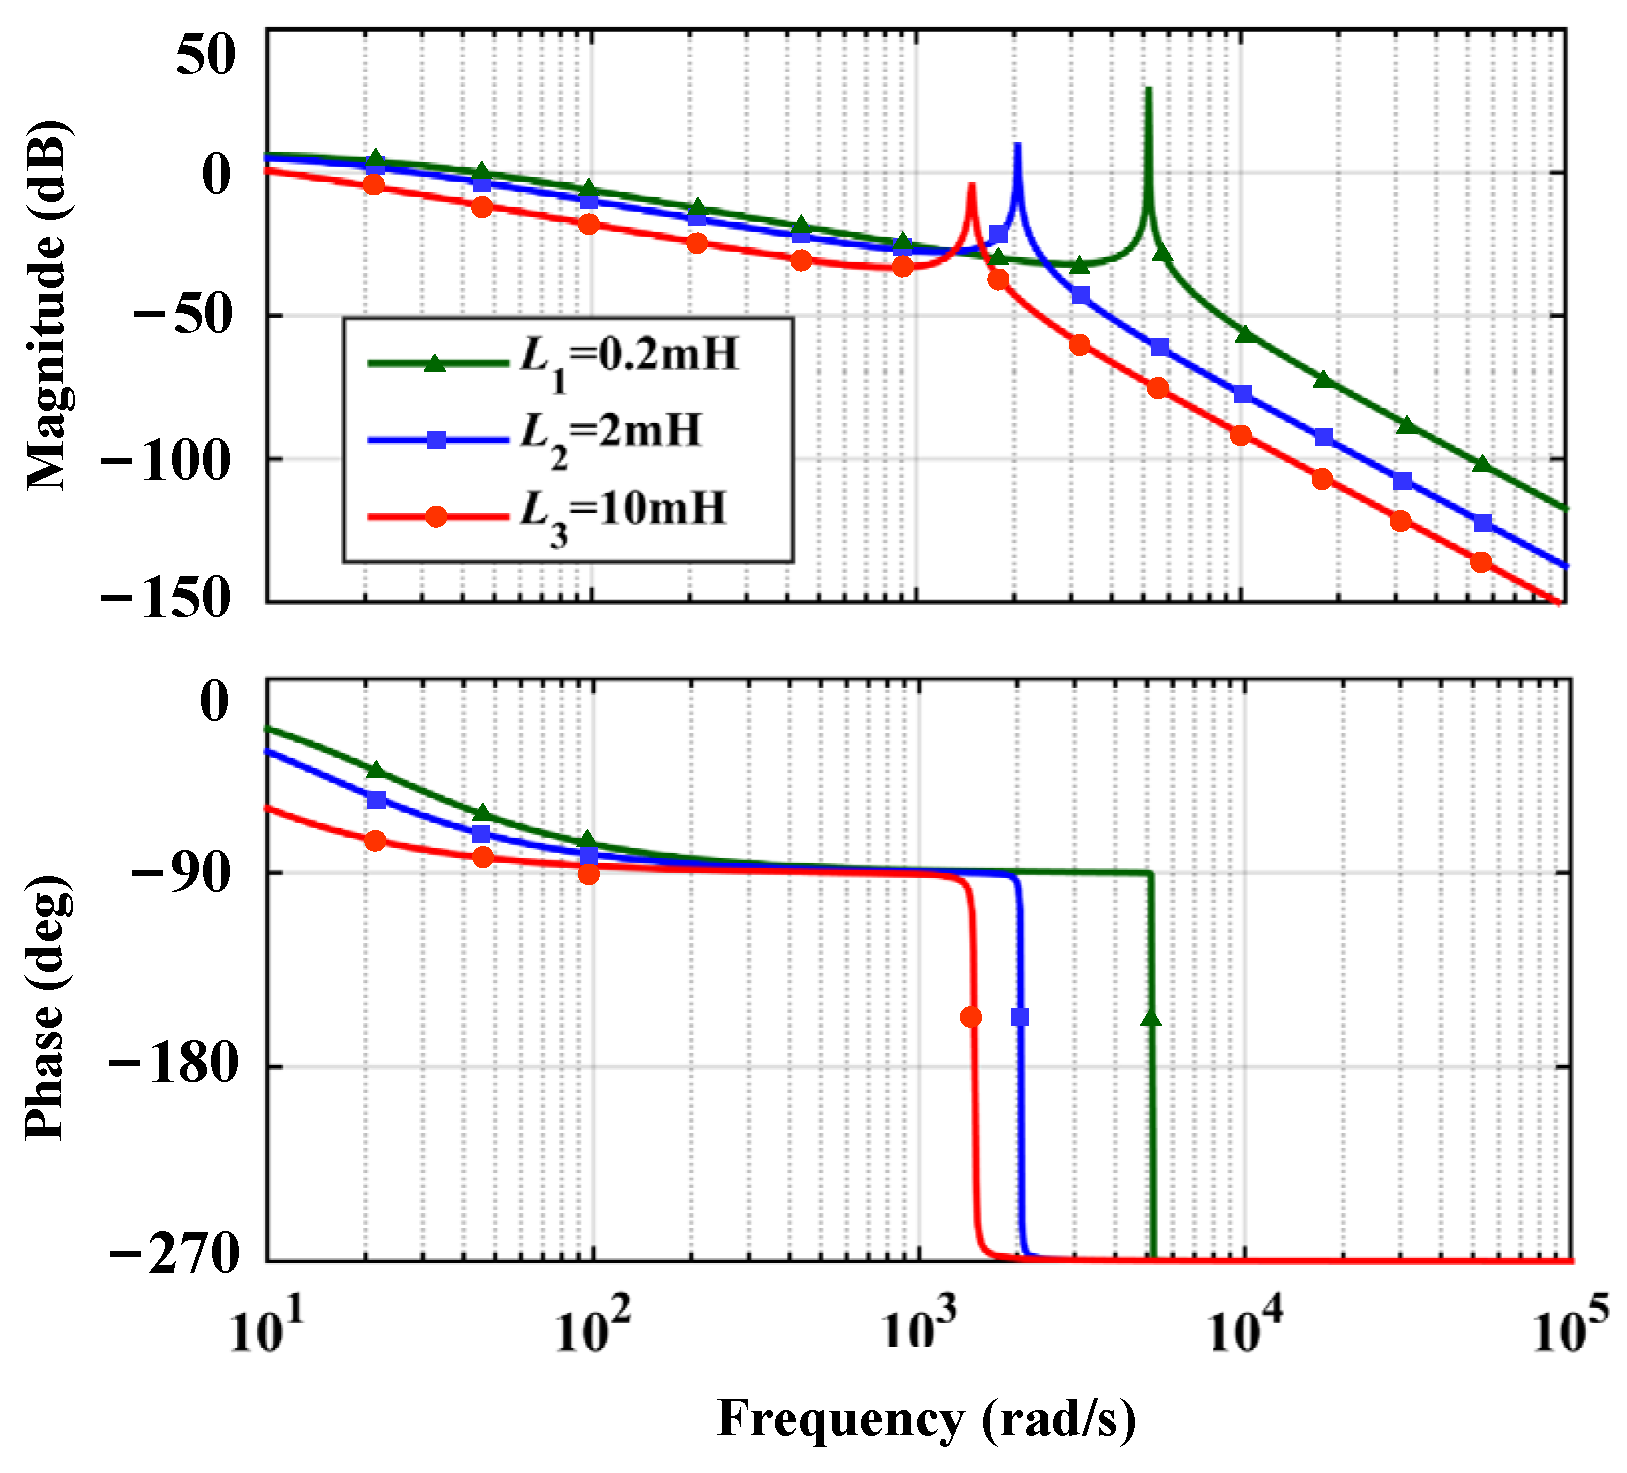
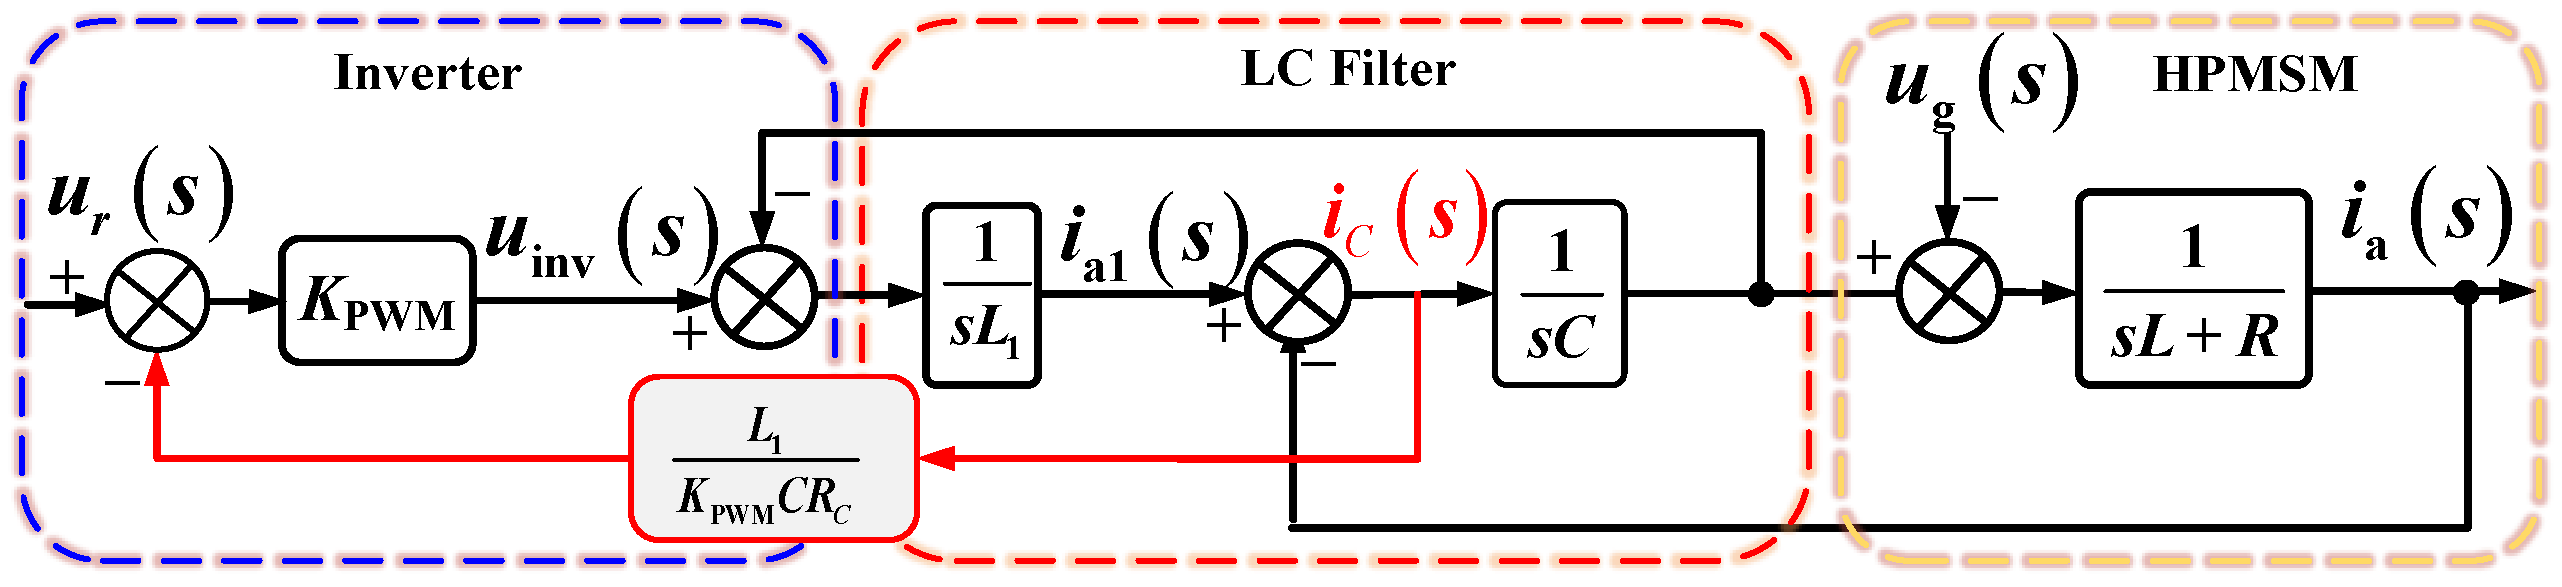
3. HPMSM System with Output LC Filter

In order to restrain the high-frequency harmonics, the three-phase output LC filter is connected between the inverter and the HPMSM. The single-phase circuit topology of the HPMSM drive system is illustrated in Figure 2.
Based on the circuit topology, the following voltage and current equations can be obtained:
u c = L d i a d t + R i a + e a ,
i a 1 = i a + C d u c d t = L C d 2 i a d t + R C d i a d t + i a + C d e a d t ,
u a = u c + L 1 d i a 1 d t = L L 1 C d 3 i a d t 3 + R L 1 C d 2 i a d t 2 + ( L + L 1 ) d i a d t + R i a + L 1 C d 2 e a d t 2 + e a .
Depending on (11)–(13), the transfer function of the HPMSM with the LC filter can be written as
ϕ ( s ) = I a ( s ) U a ( s ) = 1 L L 1 C s 3 + R L 1 C s 2 + ( L + L 1 ) s + R .
From (14), it can be deduced that in the low-frequency bands, the above system can be simplified into a first-order inertial system, and the transfer function is equivalent to
ϕ ( s ) 1 ( L + L 1 ) s + R .
According to (15), the cut-off frequency in the low-frequency bands can be calculated as
ω c u t L + L 1 ( L + L 1 ) 2     4 R 2 L 1 C 2 R L 1 C R L + L 1 .
The setting of the cut-off frequency needs to consider two aspects. Firstly, to filter out all the major harmonic components, the cut-off frequency should be set lower than the main harmonic of the lowest frequency, which is fsfb according to (7). Secondly, to avoid adverse impact on the fundamental component, the cut-off frequency should be higher than the motor fundamental frequency and retain a certain margin, for example, not less than twice the fundamental frequency. Therefore, the cut-off frequency needs to satisfy:
2 f b < ω c u t 2 π < f s f b .
It is worth noting that there is an optimal scope of application for this scheme. It can be seen from (17) that if the fundamental frequency of the motor is too high, the frequency band of the fundamental wave and the harmonics will cross, and the LC filter will not be able to filter out some harmonics. Therefore, the condition under which this scheme can be effectively applied is:
f b < 1 3 f s .
Typically, fs is 10 kHz, so fb should be below 3.33 kHz, which encompasses most HPMSM operating ranges.
In addition, the problem of voltage drop on LC filters should also be considered. The voltage drop will affect the transmission of electrical energy, resulting in additional reactive power loss. In general, the voltage drop should not be greater than 10% of the input voltage. As shown in Figure 2, the voltage drop can be calculated by obtaining the relationship between Uc and Ua, and their relationship can be expressed as:
U c U a = R + j ω L R ( 1 ω 2 C L 1 ) + j ω ( L + L 1 ω 2 C L L 1 ) = R 2 + ω 2 L 2 R 2 ( 1 ω 2 C L 1 ) 2 + ω 2 ( L + L 1 ω 2 C L L 1 ) 2
Since the inductance of the high-speed motor is very small, the required LC filter capacitance and inductance values are also small, and the following approximations can be made:
ω 2 C L 1 0 ω 2 C L L 1 0
Therefore, (19) can be further simplified to
U c U a = R 2 + ω 2 L 2 R 2 + ω 2 ( L + L 1 ) 2
It can be seen from (21) that the voltage drop mainly depends on the inductance of the LC filter, and, the larger the inductance L1, the more severe the voltage drop.
In summary, the selection of LC filter inductance needs to consider the setting of the cut-off frequency and the amplitude of voltage drop, and the specific calculation method is given from (16) to (21).
Figure 3 shows the Bode diagram of HPMSM with the LC filter. As shown in the diagram, although the introduction of the LC filter enhances the system’s ability to suppress high-frequency harmonics, it leads to the appearance of the resonance in the control system at high frequency and also produces phase changes by −180 degrees. This phase change brings a pair of closed-loop poles in the right half of the s-plane, leading to instability of the system. To solve this problem, the resonant frequency needs to be determined.
Based on (14), at high frequencies, the system can be reduced to a series connection of an integral link and a second-order oscillation link. The equivalent transfer function is
ϕ ( s ) 1 s ( L L 1 C s 2 + R L 1 C s + L + L 1 ) .
From (18), it can be derived that the resonant frequency is
f = 1 2 π L + L 1 L L 1 C R 2 2 L 2 .
The system’s Bode diagram is depicted in Figure 4 when the inductance of the LC filter varies. The cut-off frequency and resonance peak of the system decrease with the increase of the inductance, so it seems that the system resonance can be suppressed by simply increasing the inductance. In reality, however, increasing the filter inductance will enlarge the volume and weight of the LC filter, which is not conducive to the design of the drive system. Therefore, the resonance peak can be suppressed using alternative techniques. The most commonly used methods include passive and active damping methods.

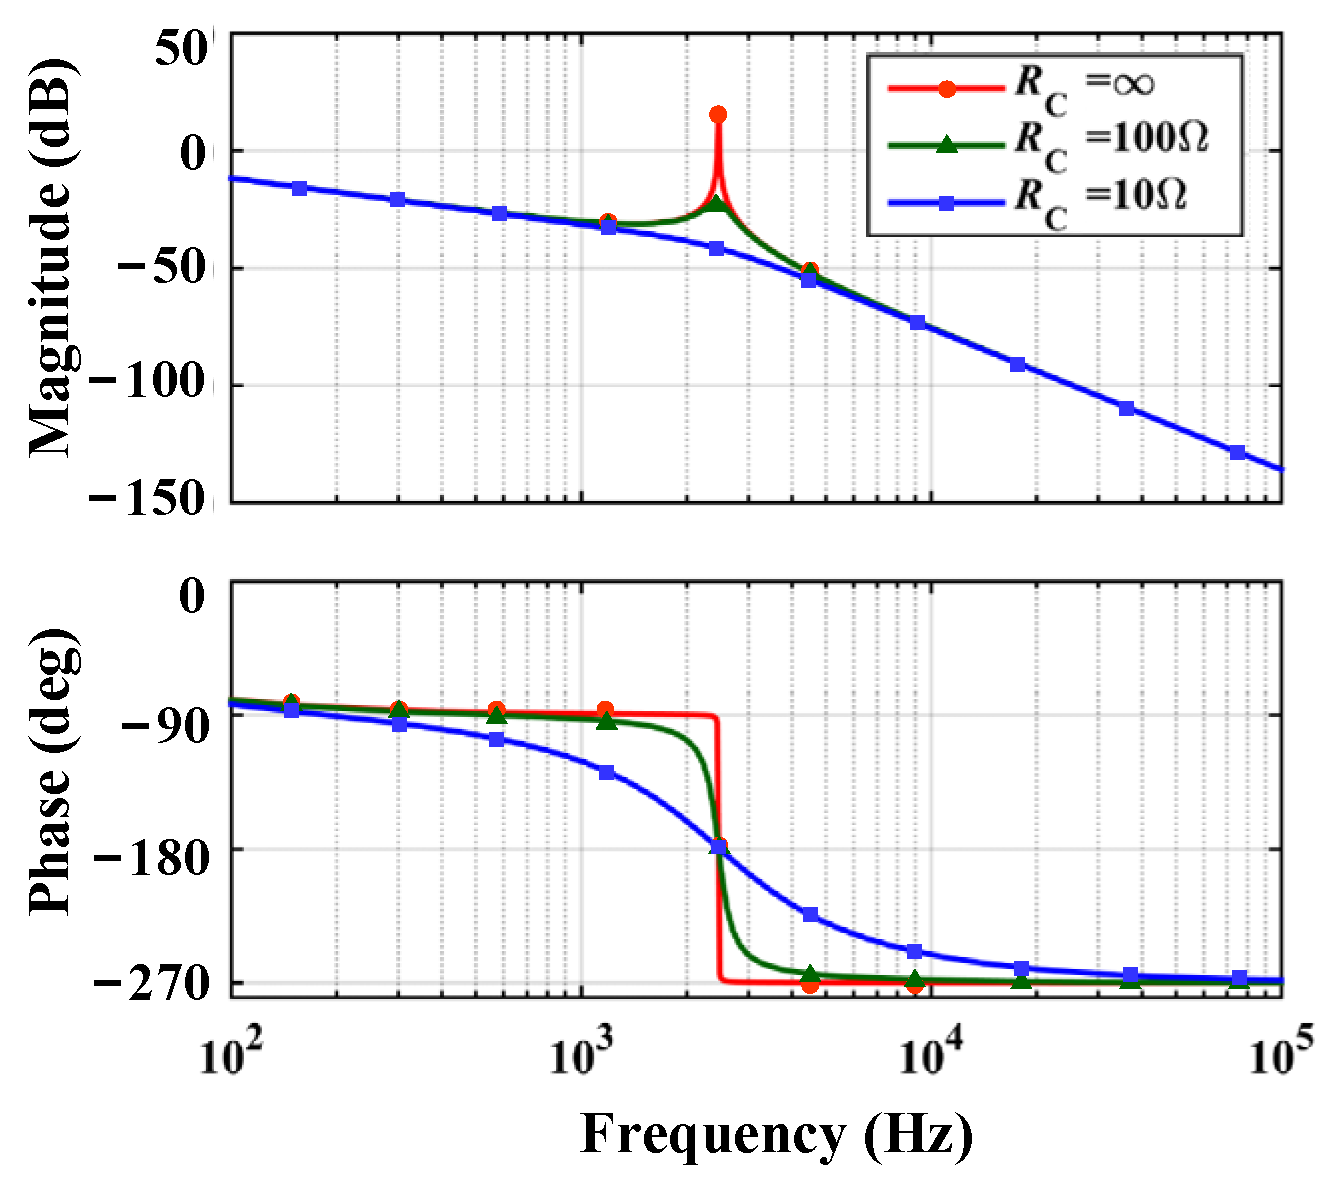
3.1. Passive Damping Method

In passive damping, a resistor is connected in parallel to the capacitor ends of the filter. The control diagram of the network is shown in Figure 5, where RC is the parallel resistance. The transfer function from the output voltage of the inverter to the current of HPMSM can be calculated as
ϕ ( s ) = I a ( s ) U i n v ( s ) = 1 L L 1 C s 3 + ( R L 1 C + L L 1 R C ) s 2 + ( L + L 1 + L 1 R R C ) s + R .
Choose RC as 1 ohm, 10 ohm, and infinity, respectively, the Bode diagram of the system is shown in Figure 6. It can be seen that when the parallel resistance of the filter capacitor is infinite, there is no suppression effect on the resonance peak, and with the decrease of the resistance, the resonance peak is restrained more effectively. However, the introduction of resistors will result in additional power losses, which can be obtained as
P n = 3 U c 2 R c .
According to (25), the power absorbed by the resistance will be extremely high when RC is small, hence affecting the efficiency of HPMSM, which becomes the main drawback of the passive damping method. Therefore, it was replaced by the later active damping method.

3.2. Traditional Active Damping Methods

The traditional active damping method based on state variable feedback contributes to obtaining the same damping effect as the actual resistance by simulating a virtual resistance on the control. This suppresses the resonant peaks of the system without increasing the system losses.
Figure 7 shows the control block diagram of the capacitor current proportional feedback method, which is a virtual resistor construction scheme with excellent performance. Define the proportional feedback coefficient Hi as
H i = L 1 K P W M C R C ;
Then, the Bode diagram can be drawn as shown in Figure 8. It is clear that by adjusting Hi, the active damping method can have a similar effect as the passive damping method without introducing additional energy losses. Nevertheless, as shown in Figure 7, to achieve the capacitor current proportional feedback method, the capacitor current i C is needed. Since the LC filter is connected between the inverter and the motor, the current hall sensor is often used to obtain the current value of the capacitor. Figure 7 shows the control diagram of a single phase. In fact, all three phases of capacitive current need to be sampled, so at least two additional current sensors are required. This increases the costs and reduces the reliability of the system, which limits the application of the traditional active damping method in practice.
As a comparison case, the specific simulation results of the capacitor current proportional feedback method are given in Section 5.

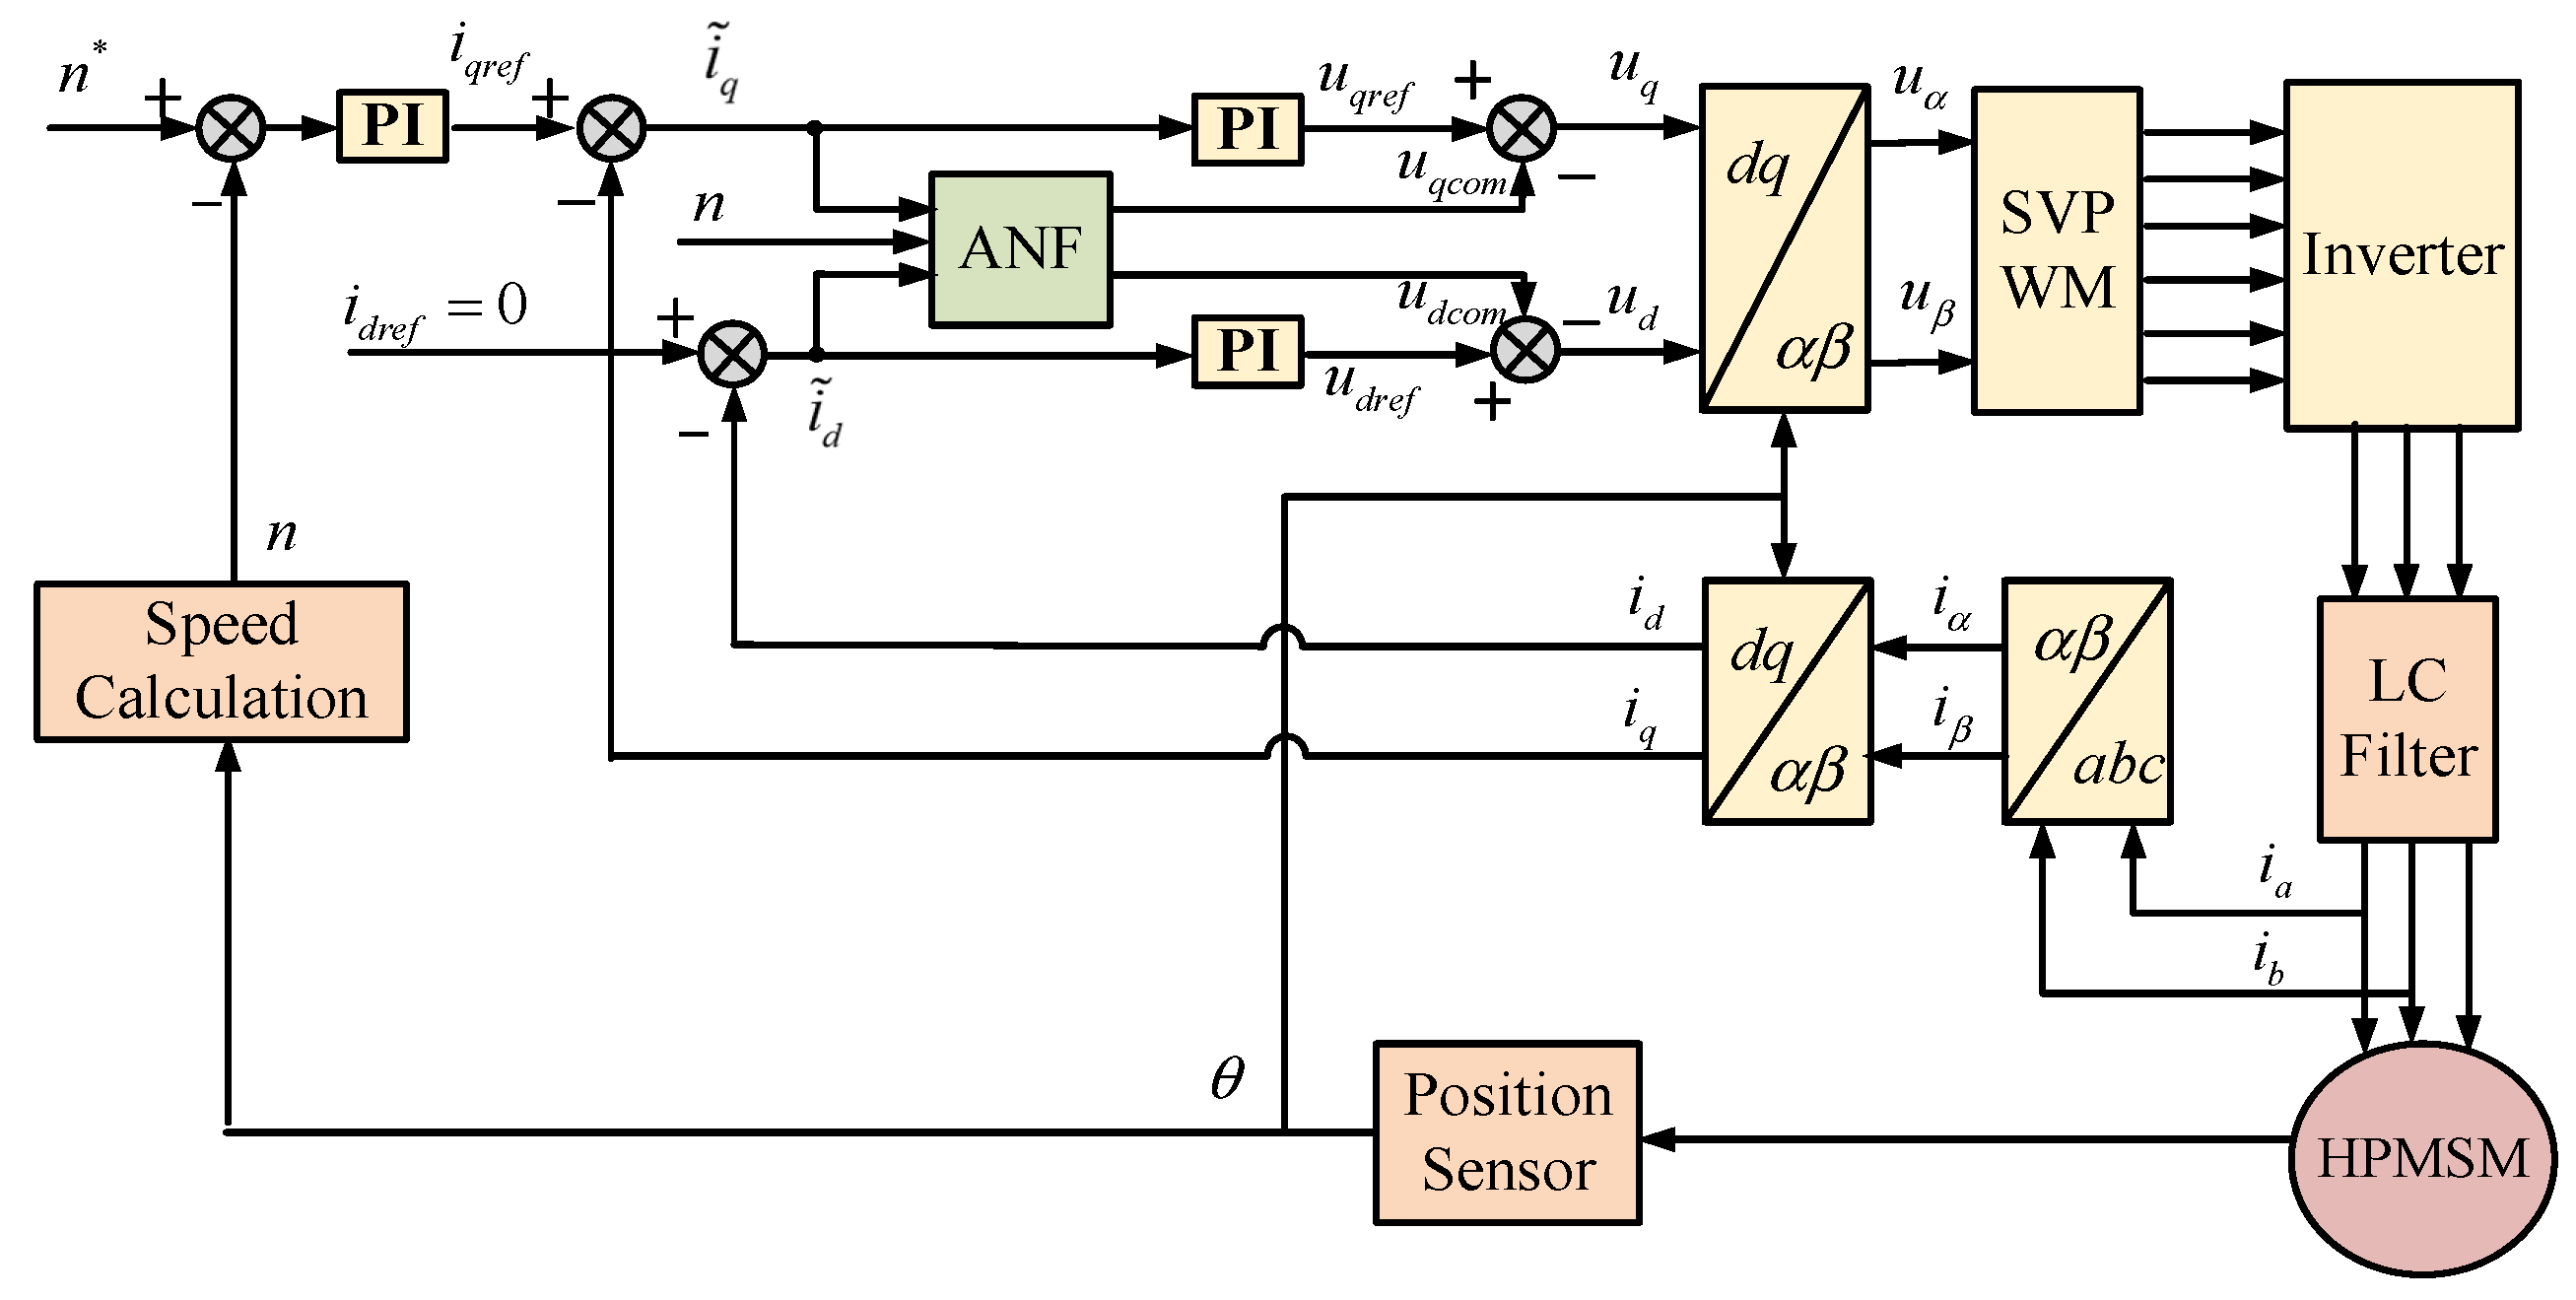
4. ANF Based Active Damping
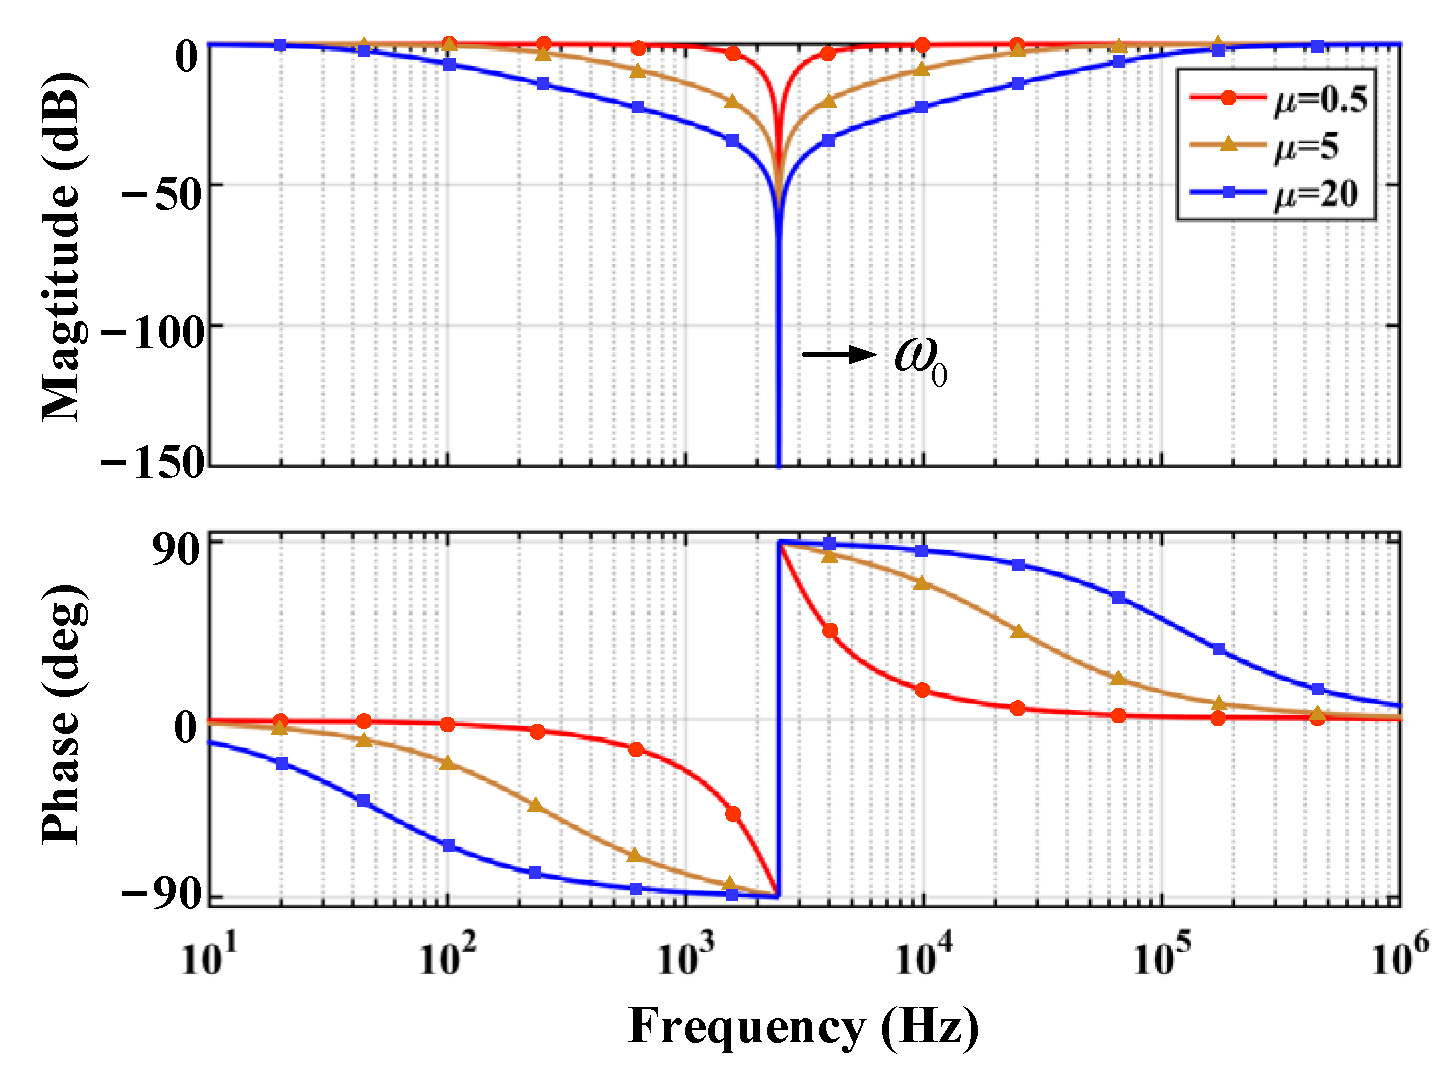
4.1. ANF

As a new active damping scheme, the ANF can suppress the resonance peak without additional sensors. It also has the ability to adjust its own coefficient using adaptive algorithms when the external environment changes. Accordingly, when the magnitude of harmonics and noise changes, the ANF can calculate the optimal filtering parameters in real-time and maintain a good filtering effect, which improves the stability of the system.
The structure of ANF is shown in Figure 9, where x(t) represents the input signal, which can be divided into the original fundamental signal and the interference signal. s(t) is the fundamental signal; r(t) is the interference signal to be filtered by the ANF; rs(t) and rc(t) are the reference signals generated by the controller and have the same frequency as r(t), and A is their amplitude. ω 1   and   ω 2 represent the accommodative coefficients; y(t) is the generated anti-resonant signal, and e(t) stands for the output of the ANF, which is obtained by subtracting the anti-resonant signal from the original signal. LMS is the chosen adaptive algorithm. On the basis of the target of minimizing the mean square error e2(t), the LMS algorithm can regulate the accommodative coefficient ω 1   and   ω 2 according to the error signal e(t) and the reference input signals rs(t) and rc(t). The specific algorithm of LMS can be sorted into the formula
y k = ω 1 k r s k + ω 2 k r c k e k = x k y k ω 1 k + 1 = ω 1 k + μ e k r s k ω 2 k + 1 = ω 2 k + μ e k r c k
where μ represents the iterative step length; k represents the iterative order. Note that there is t = k τ ,   where  τ represents the sampling time.
According to (27), the transfer function of the ANF is derived as
e ( s ) x ( s ) = s 2 + ω o 2 s 2 + μ A 2 τ s + ω o 2 ,
where ω 0 = 2 π f . Based on (28), set different step sizes and draw the Bode diagram, as shown in Figure 10. Let μ A 2 / τ = ω 0 / Q , where Q represents the quality factor, and then the ANF can be equivalent to a band-stop filter with a center frequency of ω 0 . The step size μ is an important factor in the filtering capability. As shown in Figure 11, the original signal has a fundamental frequency of 500 Hz with a 4500 Hz harmonic superimposed. When μ = 0.01, the filtered waveform still has significant harmonics, but when μ = 0.001, harmonics are filtered out completely. However, the former takes only 0.05 s to converge, while the latter takes 0.2 s. Therefore, it is necessary to consider the filtering effect as well as the convergence time and choose a suitable step size. Generally, μ is not less than 0.01.
The center frequency of the ANF only depends on the frequency of the reference input signal. As a result, the ANF can change the frequency of the reference signal when the external disturbance signal varies, thus achieving adaptability.

4.2. Design of ANF with Frequency Adaption

The control system structure is shown in Figure 12. The FOC control method is adopted with a double closed-loop structure of speed and current, and the id = 0 control mode is used. The PI controllers are used for both loops. The parameters of the PI controller should be chosen carefully because they have a significant impact on the performance of the control system. The design of traditional double closed-loop PI controllers has been studied in [32,33].
For the speed loop PI controller, the parameter design is as follows:
K p ω = β J 1.5 P n ψ f K i ω = β K p ω ,
where β   is the bandwidth of the speed loop; J   is the rotational inertia; P n is the pole pairs; and K p ω , K i ω represent the proportional link and integration link coefficient, respectively.
For the current loop PI controller, there are:
K p d = α L d K i d = α R K p q = α L q K i q = α R ,
where α   is the bandwidth of the current loop; K p d , K i d represent the d-axis proportional link and integration link coefficient, respectively, and K p q , K i q represent the q-axis proportional link and integration link coefficient, respectively. For optimal results, the parameters can be fine-tuned based on the calculated results.
In Figure 12, a three-phase LC filter is connected in series at the output end of the inverter to suppress the high-frequency harmonics, and the three-phase capacitor adopts the star connection. To counteract the resonance peaks introduced by the LC filter, it is necessary to compensate for the voltage reference signal udqref given by the current loop. According to the characteristics of the ANF, the specific harmonic components of the current error signal i ~ d q can be extracted. Therefore, the d-q axis ANF is set after the current loop, and its output udqcom is used as voltage compensation signals so that the resonant peak can be eliminated.
The internal structure of q-axis ANF is illustrated in Figure 13, and the d-axis one is similar. In the stable state, y(t) represents the harmonic component of i ~ d q ( t ) at the resonant frequency, generating voltage compensation signal uqcom after a PI controller. The transfer function of the ANF can be written as
y ( s ) x ( s ) = μ A 2 τ s s 2 + μ A 2 τ s + ω o 2 .
The first step in setting up the notch filter is to determine the resonant frequency. From (23), it is easy to calculate the resonant frequency of the control system in the three-phase coordinate system. However, the input signals of proposed ANF are the currents in the d-q coordinate system, and the resonant frequency will be changed by the coordinate system transformation.
In the design of HPMSM, the star connection method is generally used in the three-phase winding. According to the characteristics of three-phase symmetry and half-wave symmetry, even harmonics and odd harmonics with an integer multiple of three do not exist in the HPMSM. Therefore, the three-phase current considering harmonics can be written as
i a = i 1 cos ( ω t + θ 1 ) + i 5 cos ( 5 ω t + θ 2 ) + i 7 cos ( 7 ω t + θ 3 ) + i 11 cos ( 11 ω t + θ 4 ) + i 13 cos ( 13 ω t + θ 5 ) + i b = i 1 cos ( ω t + θ 1 2 3 π ) + i 5 cos ( 5 ω t + θ 2 2 3 π ) + i 7 cos ( 7 ω t + θ 3 2 3 π ) + i 11 cos ( 11 ω t + θ 4 2 3 π ) + i 13 cos ( 13 ω t + θ 5 2 3 π ) + i c = i 1 cos ( ω t + θ 1 + 2 3 π ) + i 5 cos ( 5 ω t + θ 2 + 2 3 π ) + i 7 cos ( 7 ω t + θ 3 + 2 3 π ) + i 11 cos ( 11 ω t + θ 4 + 2 3 π ) + i 13 cos ( 13 ω t + θ 5 + 2 3 π ) + .
where i1, i5, i7, i11, and i13 represent the current components of the fundamental wave and the corresponding harmonics separately; θ 1 5 correspond to the initial angles of the above currents; ω is the fundamental rotating frequency.
On the basis of the rotating magnetic field theory, the rotation direction of the fundamental current and that of the rotor are the same, while the 5th harmonic and the fundamental wave rotate in the opposite direction, and the rotation speed of the fifth harmonic can be expressed as 5 ω . The seventh harmonic has the same rotation direction with the fundamental wave, so the rotation speed is 7 ω , and so on. Based on (4), the current can be transformed into d-q coordinate system, which is written as
i d = i d 1 + i 5 cos ( 6 ω t + θ 2 ) + i 7 cos ( 6 ω t + θ 3 ) + i 11 cos ( 12 ω t + θ 4 ) + i 13 cos ( 12 ω t + θ 5 ) + i q = i q 1 + i 5 sin ( 6 ω t + θ 2 ) + i 7 sin ( 6 ω t + θ 3 ) + i 11 sin ( 12 ω t + θ 4 ) + i 13 sin ( 12 ω t + θ 5 ) + .
It can be concluded from (33) that the angular speed of harmonics of order (6n ± 1) are ±6 nω. According to this, by adjusting the inductance of the LC filter appropriately, the resonant frequency obtained by (23) can be close to (6n ± 1) in the three-phase coordinate system. Then, based on the conclusion obtained from (33), the resonance frequency can be simply converted to 6 n in the d-q coordinate system, and this is also the center frequency that needs to be set in the ANF.
However, the speed of HPMSM is bound to vary during operation, which in turn leads to the change of the current fundamental frequency. To ensure the ANF works properly at various speeds, it needs to be modified. The speed feedback is introduced to determine the motor resonant frequency, and then the resonant frequency can be calculated by the following formula:
f = f a b c   f e = f a b c     P n ω n 2 π .
where f represents the notch frequency; fabc represents the resonant frequency in the three-phase static coordinate system; fe represents the fundamental frequency of the stator current; and ω n   is the mechanical angular velocity. As shown in Figure 13, the adaptive notch appliance is equipped with a frequency tracking capability through the frequency calculation module.
When the resonant frequency f is determined by the above calculations, the controller can generate the reference input signals rs(t) and rc(t). Finally, select an appropriate step size considering the bandwidth and convergence speed, and then the ANF is completed. It is worth adding that the parameters of PI controller in Figure 13 should be consistent with the current loop PI controller.
During the HPMSM operation, the adaptive coefficients are continuously updated using the LMS algorithm according to (27), which allows the filter to work at the optimal state. Therefore, y(t) is approximately equal to the resonant component in the input signal.

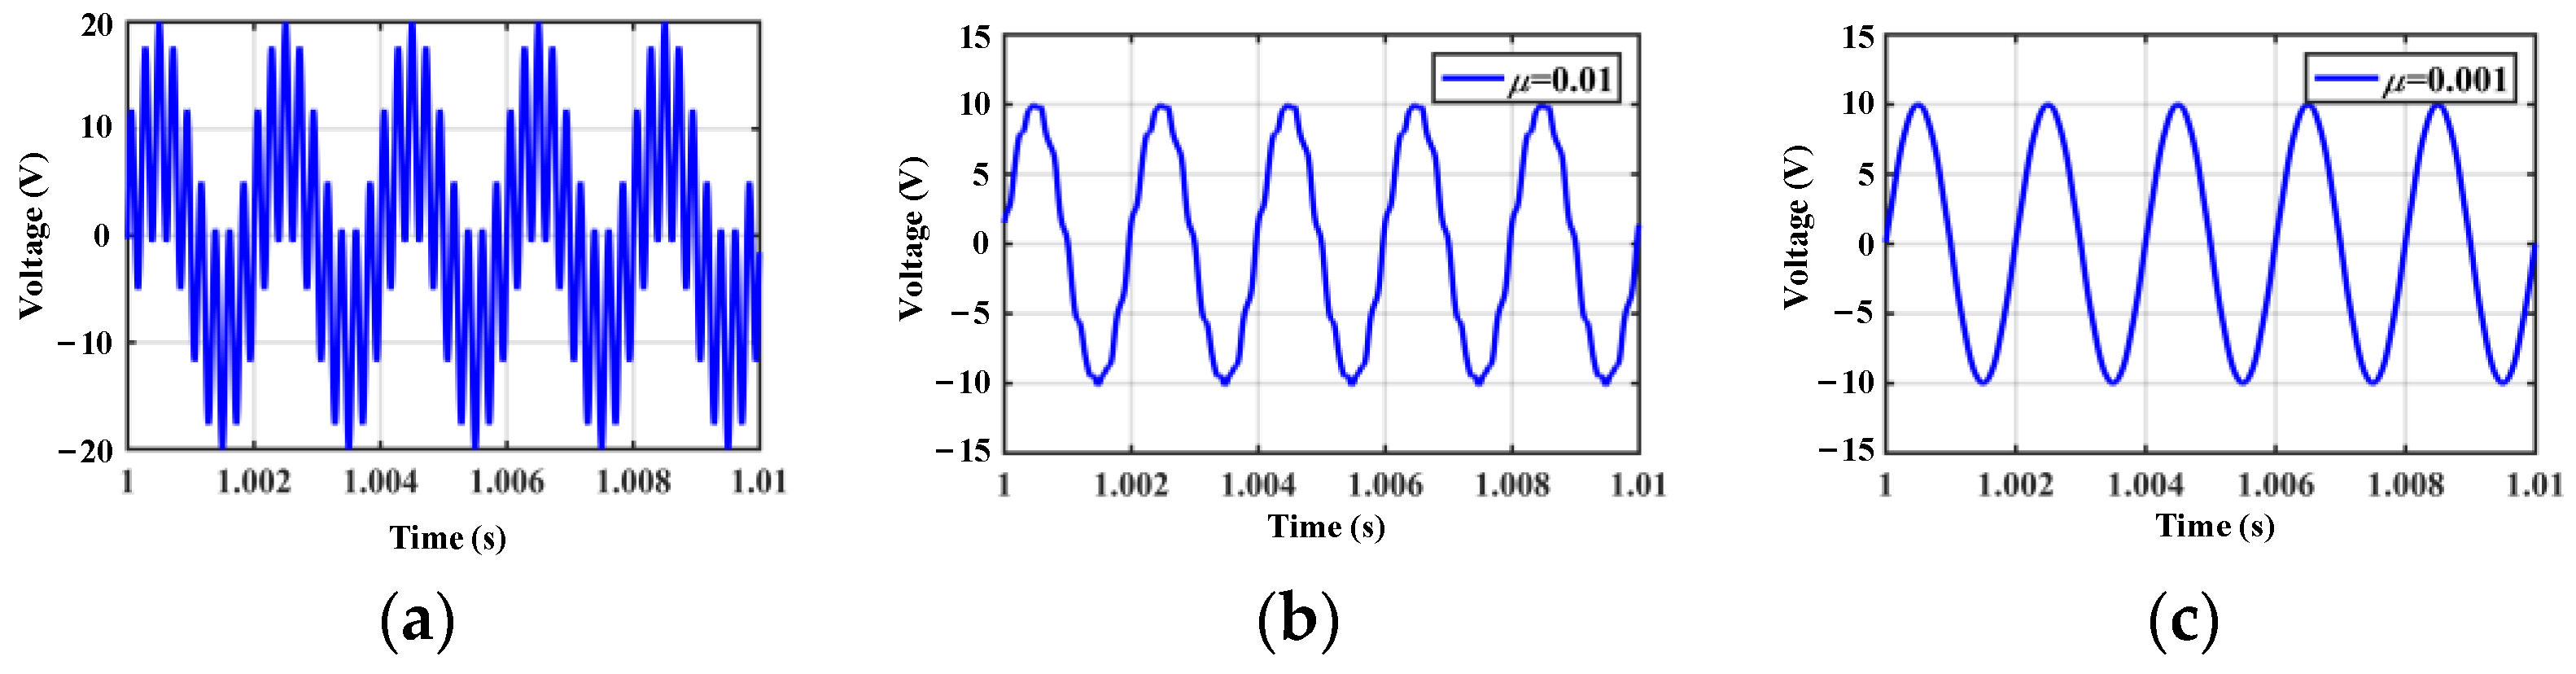
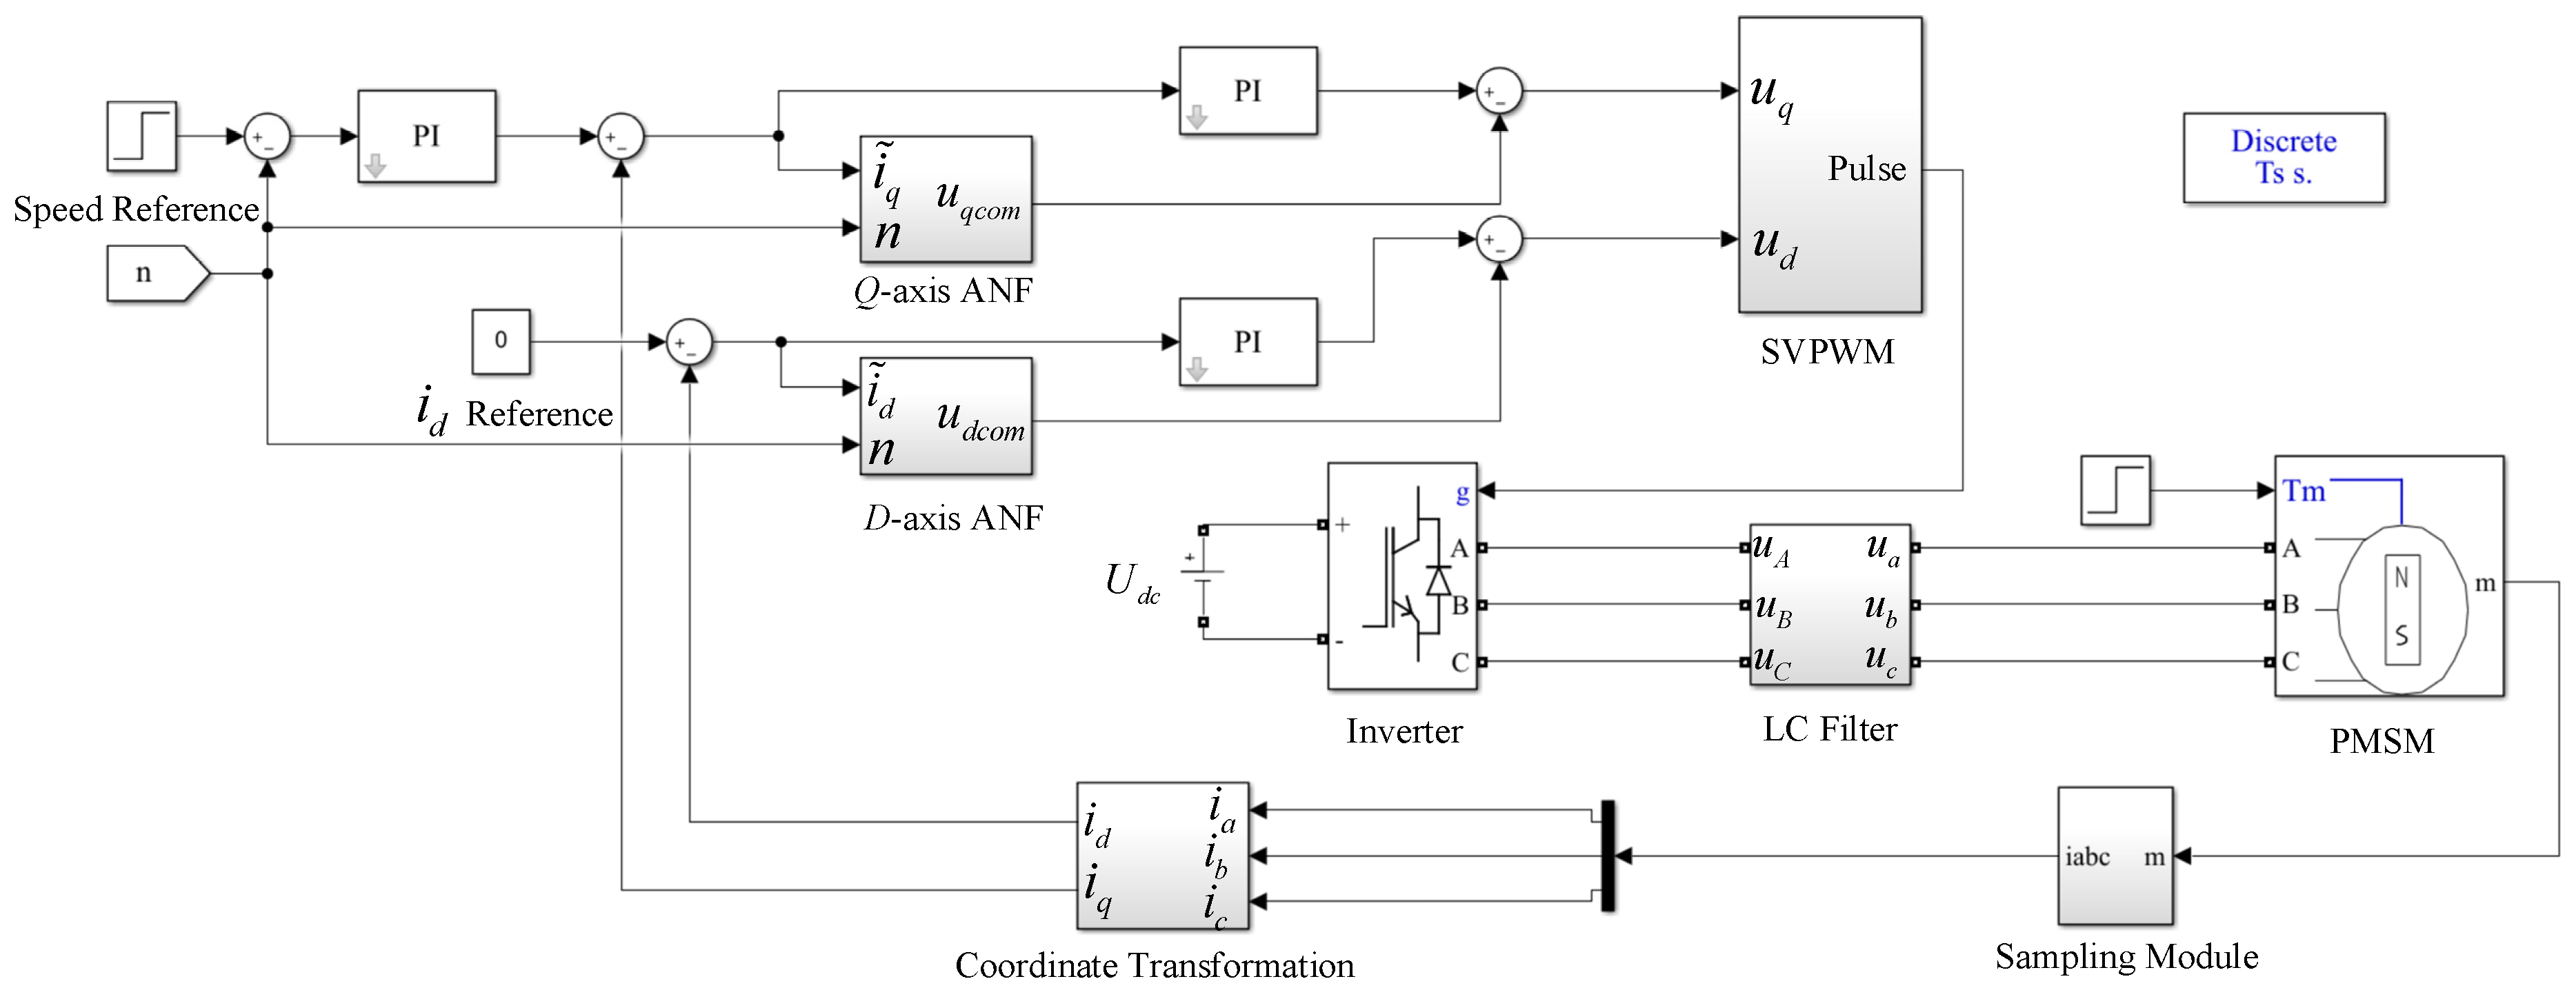
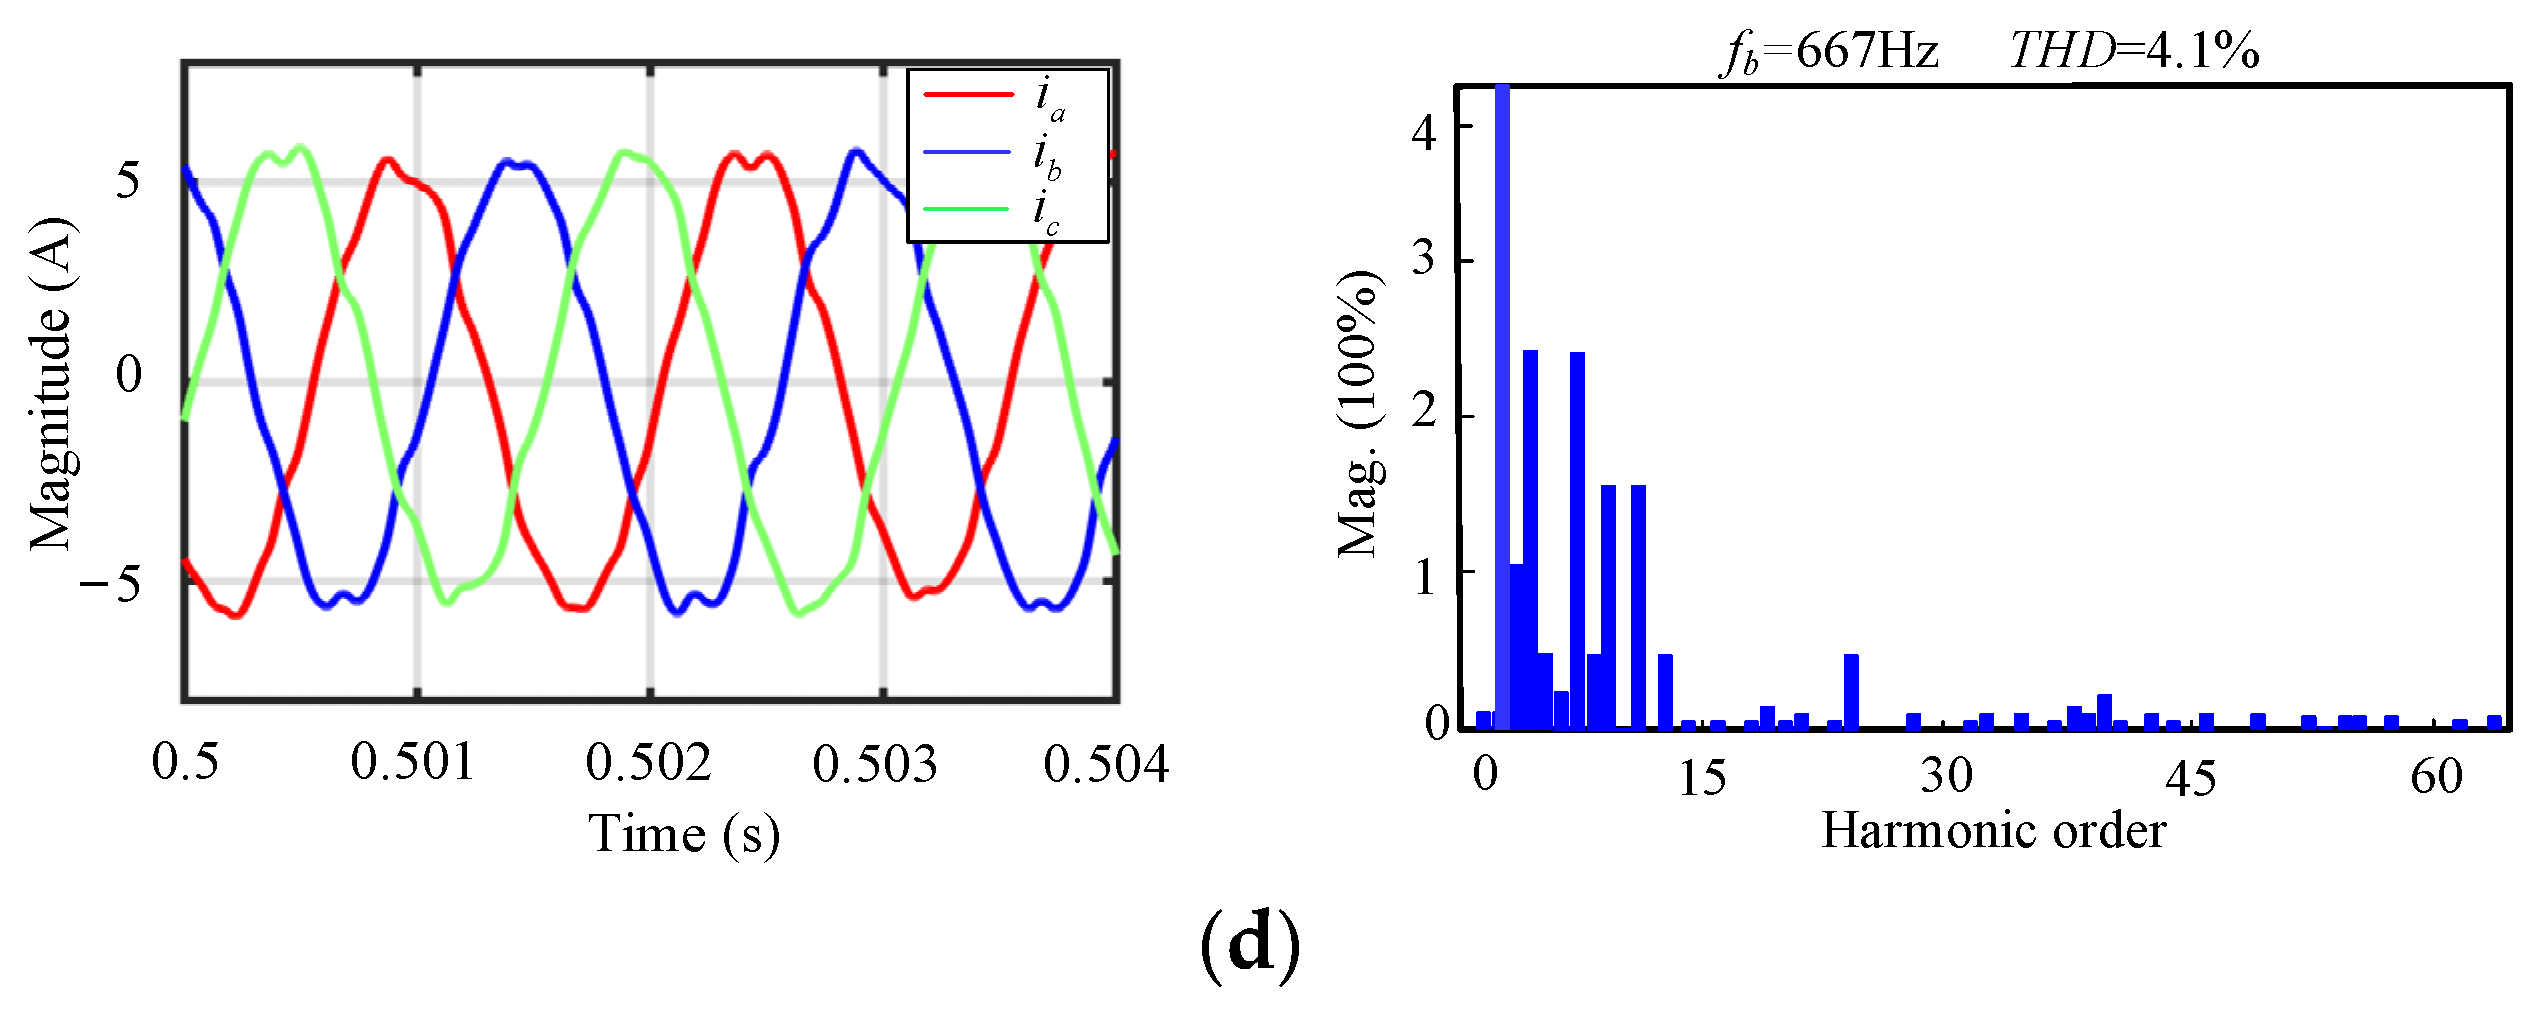
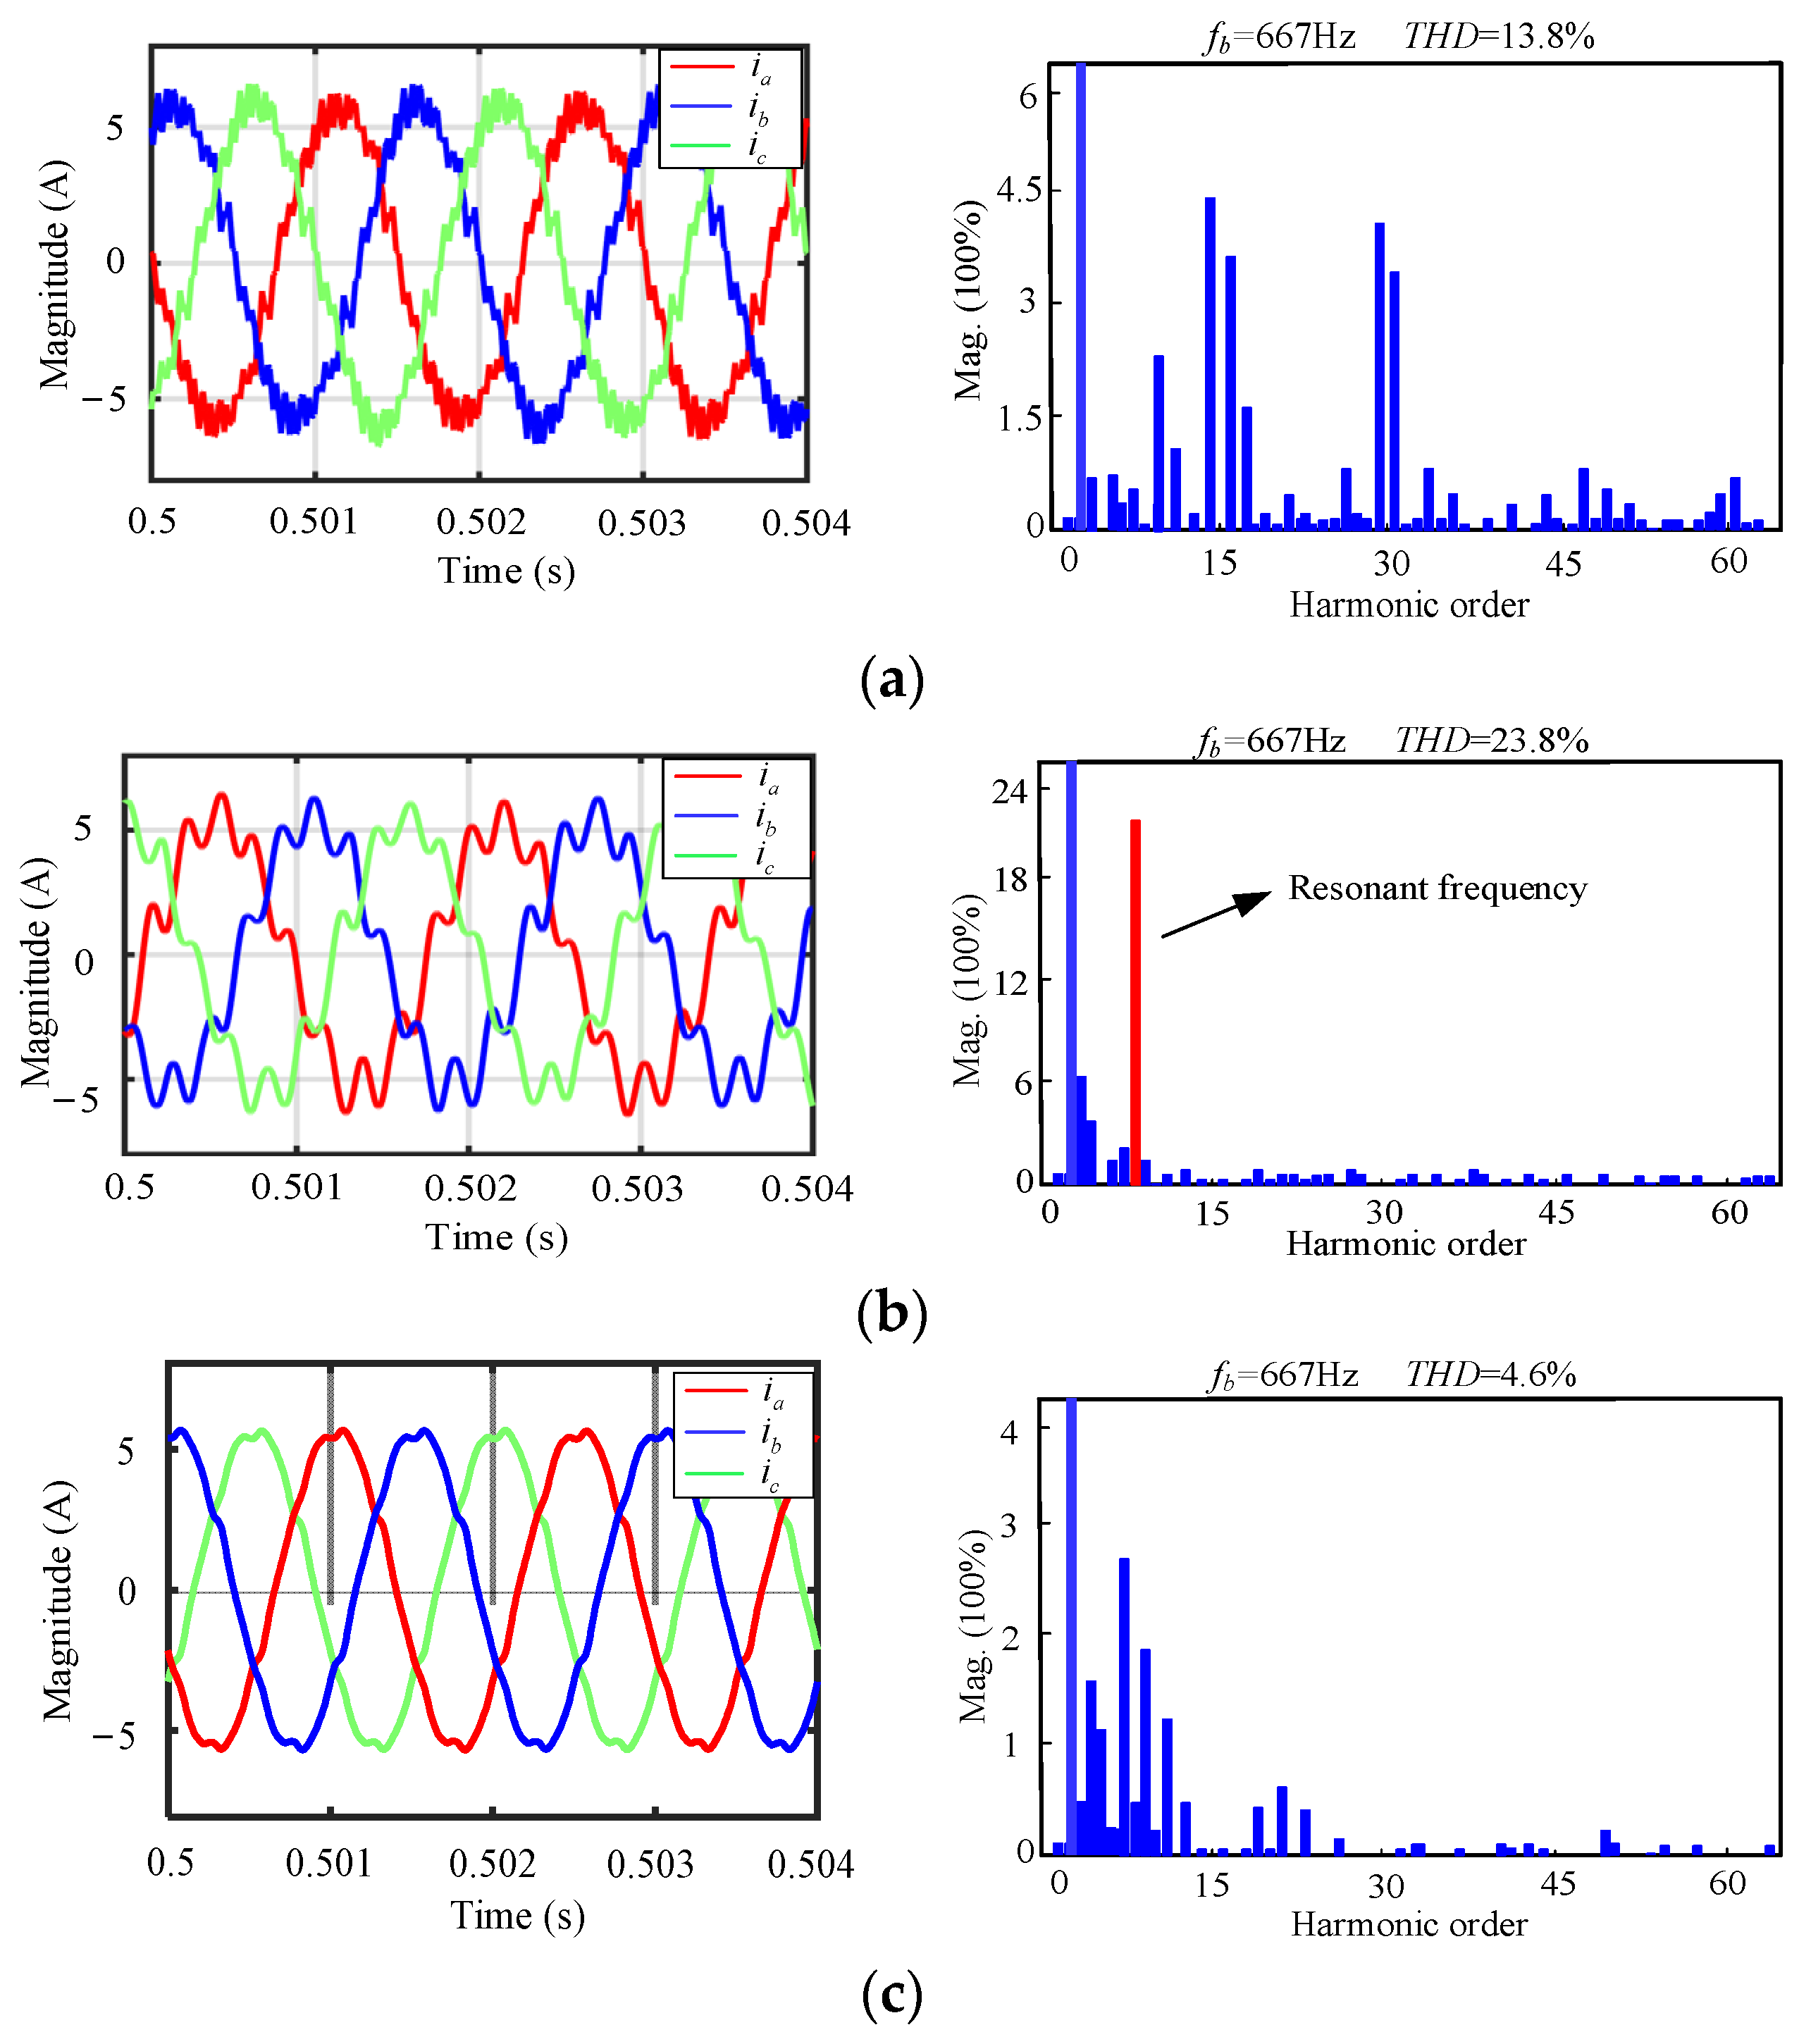
5. Simulation Analysis

For the purpose of verifying the effectiveness of the proposed harmonic suppression strategy for HPMSM based on the LC filter and ANF, the simulations based on MATLAB/Simulink R2020b are carried out. The simulation model of the proposed scheme is shown in Figure 14. To ensure the reliability of the simulation, the same parameters are used in the simulation and experiment, as detailed in Table 1. The parameters of the PI controller are selected as follows: K p ω   is   0.5 ,   K i ω   is   20 ;   K p d , K p q are 0.1, and   K i d , K i q   are   200. In the simulation, the load torque is 0.5 N m, and the rotor speed is 8000 rpm, which is equivalent to 20,000 rpm for a 2-pair pole motor.
Figure 15 gives the three-phase current waveforms and the FFT analysis using different schemes, where Figure 15a is without the harmonic suppression method; Figure 15b adopts the harmonic suppression method based on the LC filter; Figure 15c adopts the traditional active damping method based on proportional feedback of capacitance current, and Figure 15d adopts the harmonic suppression method based on the LC filter and ANF. It should be noted that in order to make it easier for readers to distinguish the content of each harmonic, the FFT waveforms have different scales.
By simulation, it can be seen that the phase current in Figure 15a is obviously distorted due to the existence of harmonic current. The current harmonics of HPMSM are considerably large, with a total harmonic content of 13.8%. The harmonics are mainly distributed around the integer multiples of the switching frequency, and the distribution law satisfies (7). When the LC filter is introduced, the high-frequency jitter of the current is suppressed; however, the sinusoidality of the waveform decreases. From FFT analysis, it is clear that the use of the LC filter effectively suppresses the high-frequency harmonics, but it brings the system resonance peak as shown by the red column in Figure 15b. The amplitude of the resonance peak reaches 22%. Consequently, the total harmonic content of the system increases instead. From Figure 15c,d, it can be seen that, with the use of the active damping method, the current waveform becomes smooth, and the sinusoidality improves dramatically. The resonant peak is suppressed extremely well, and the resonance peak has completely disappeared. At the same time, it can be concluded that the damping capacity of the two schemes are almost the same, and they both make the three-phase current harmonic content of the HPMSM drops to about 4%, which is 10% lower than the case without filtering. In contrast, the ANF is more advantageous because it does not require additional sensors. Therefore, the simulation results prove the effectiveness of the proposed scheme.

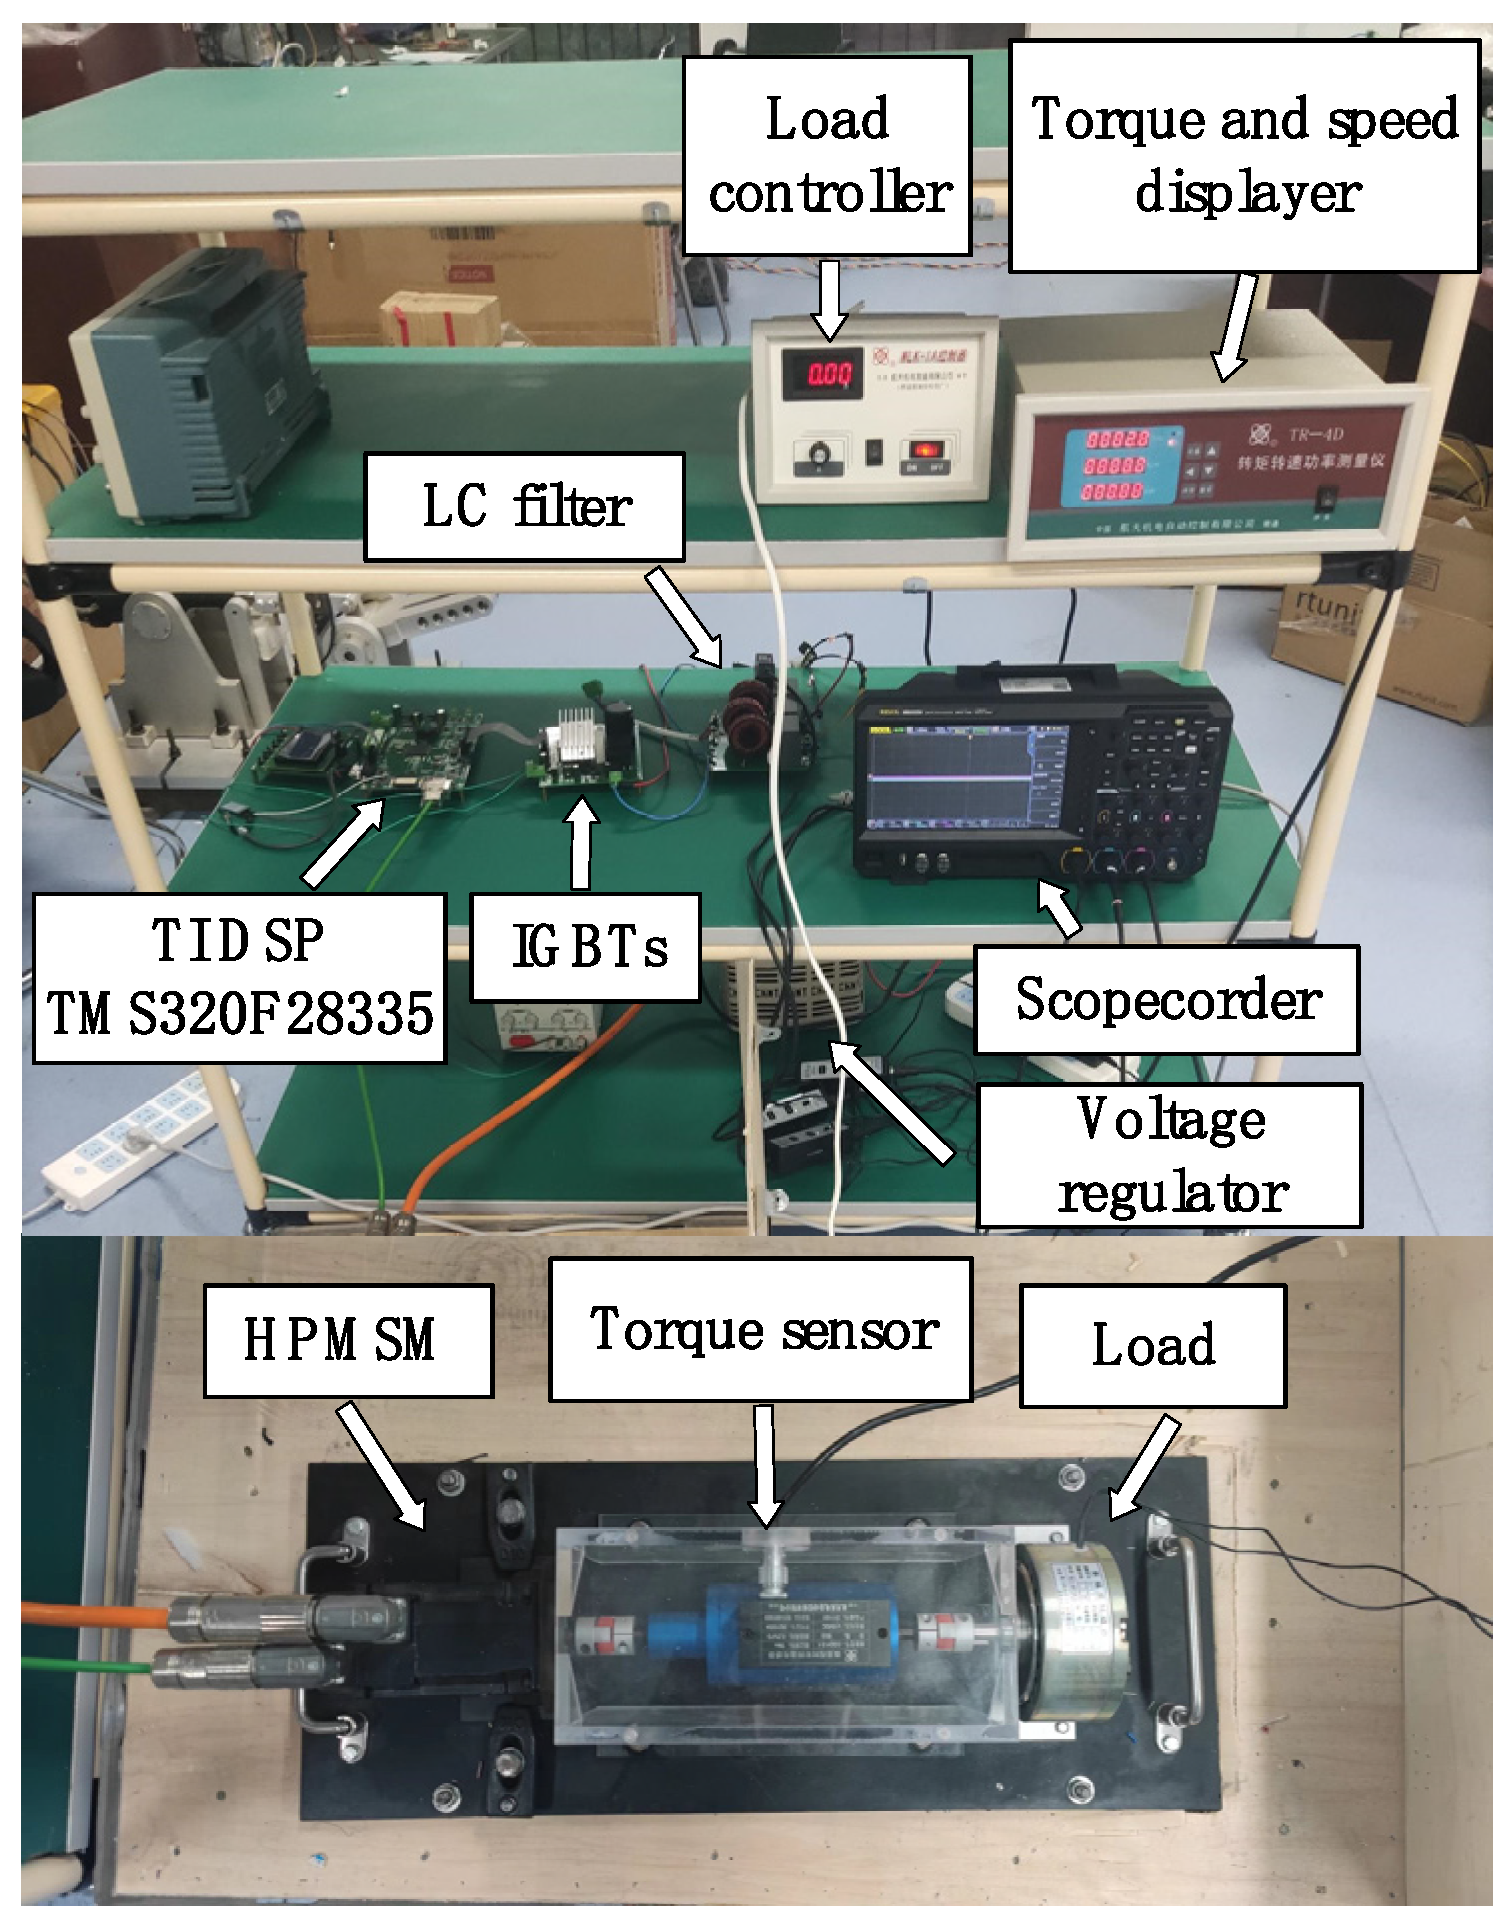
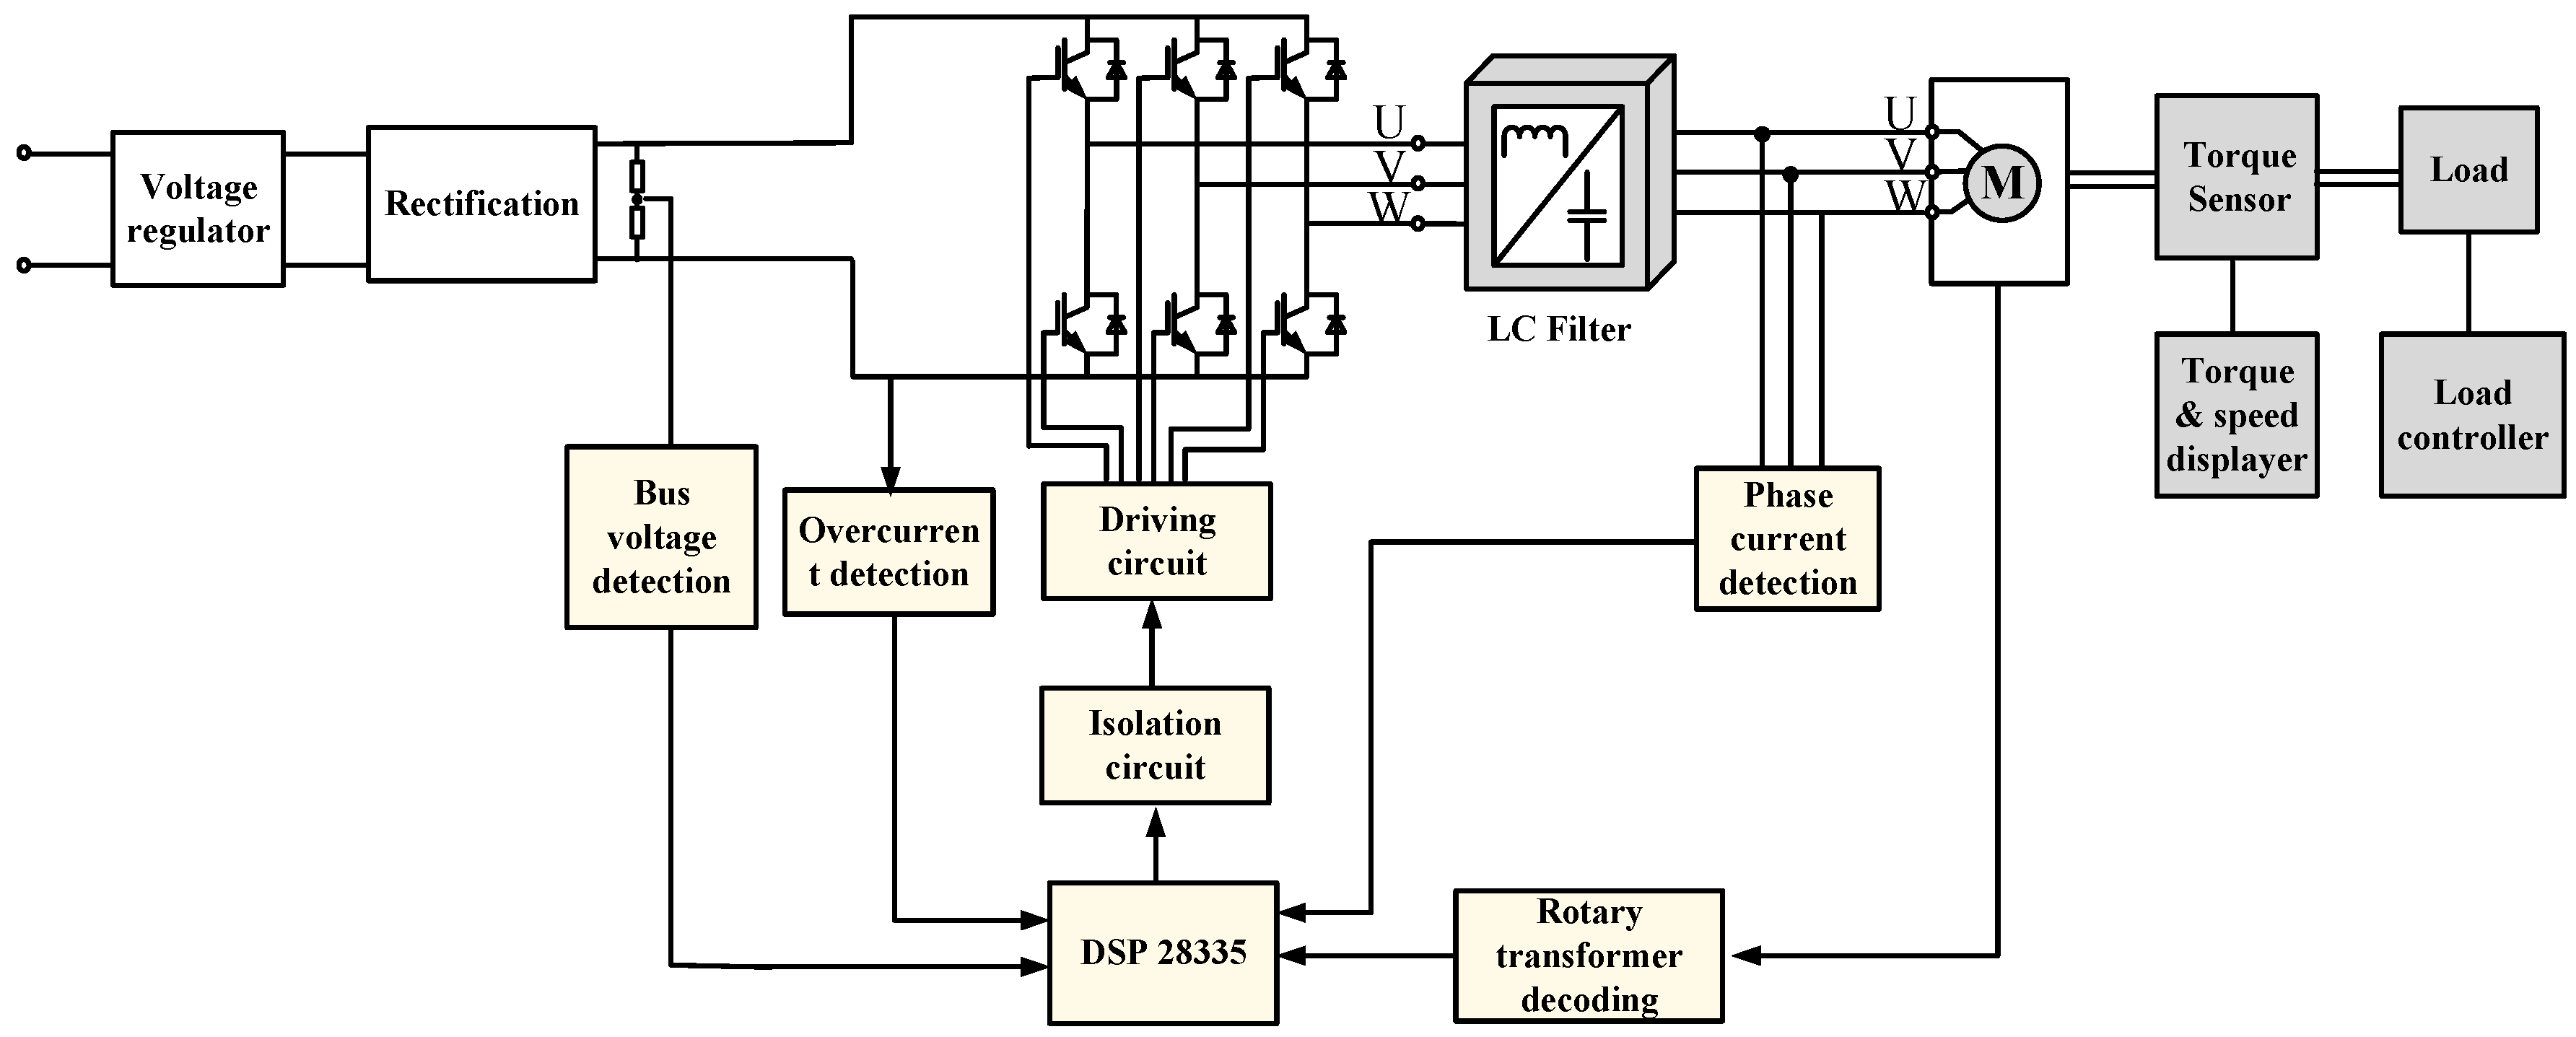
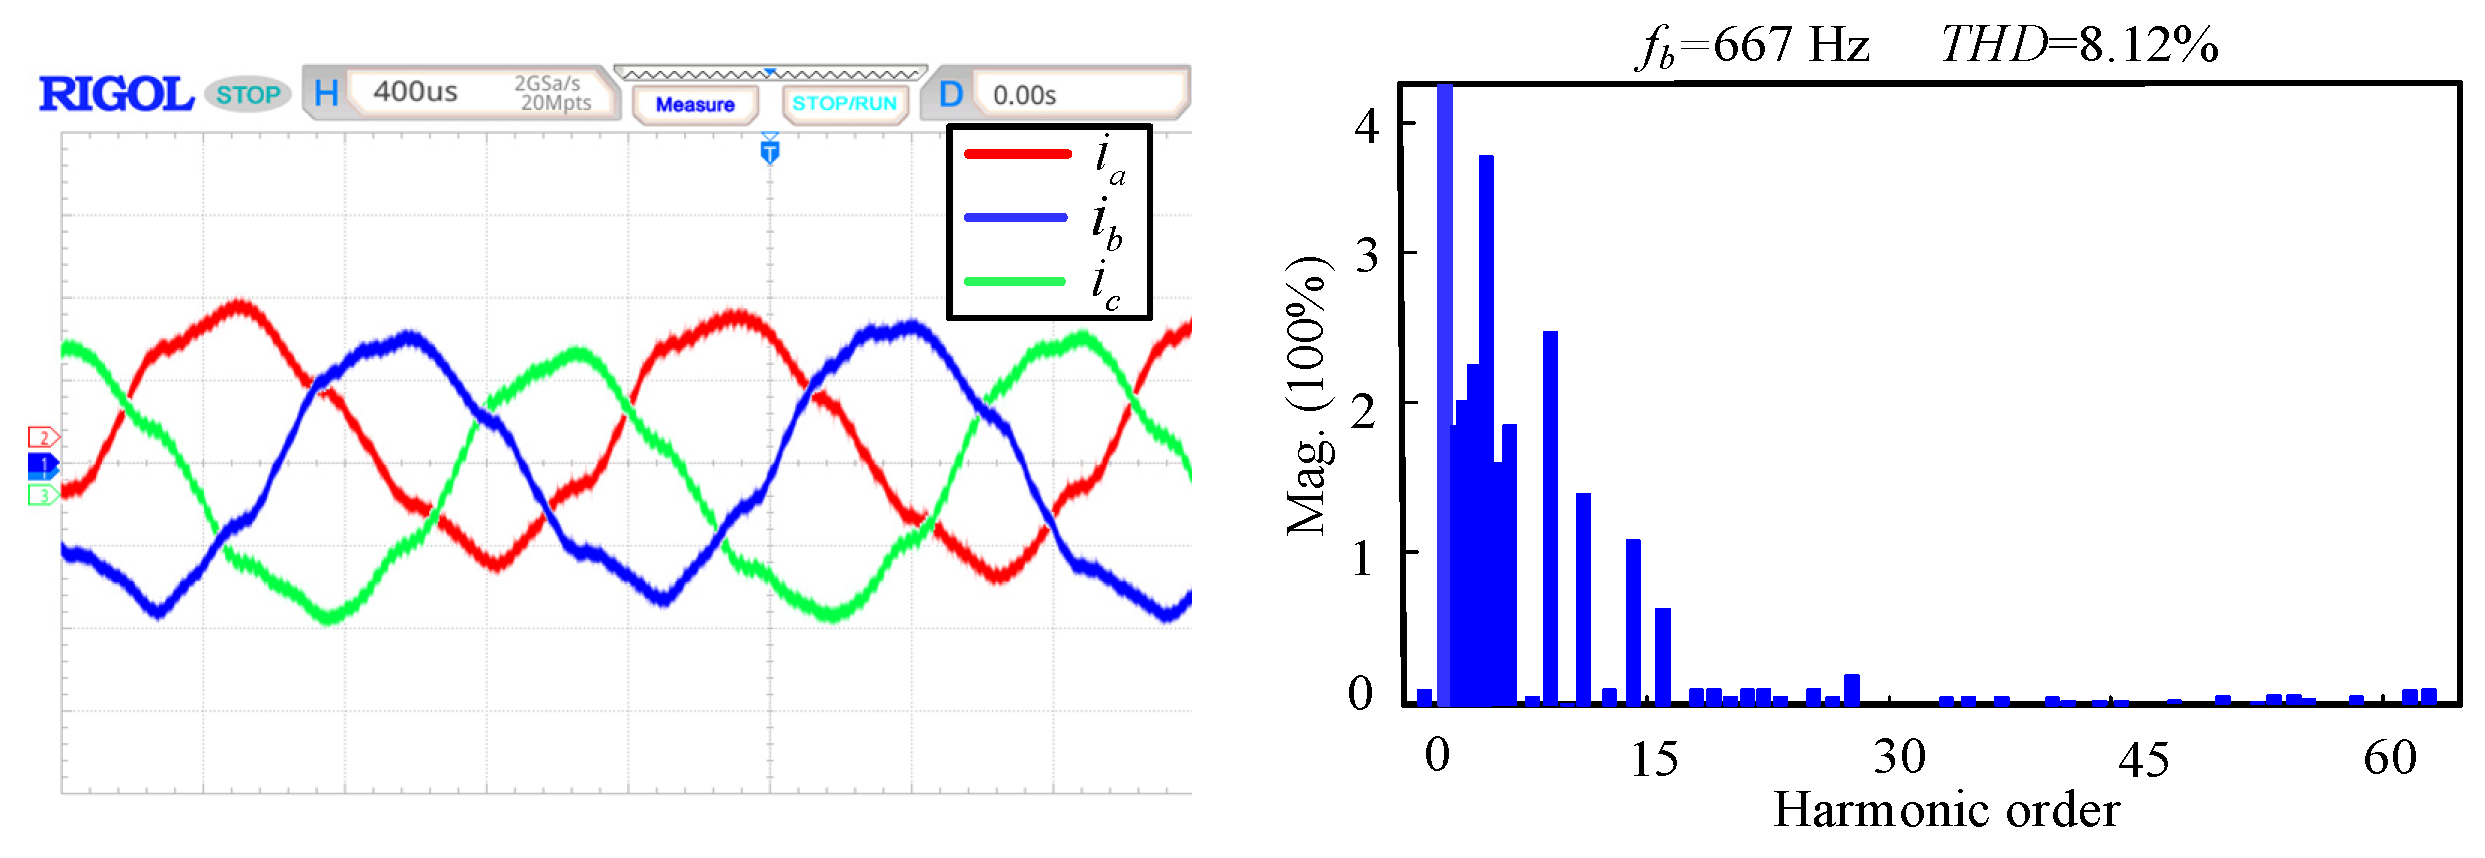
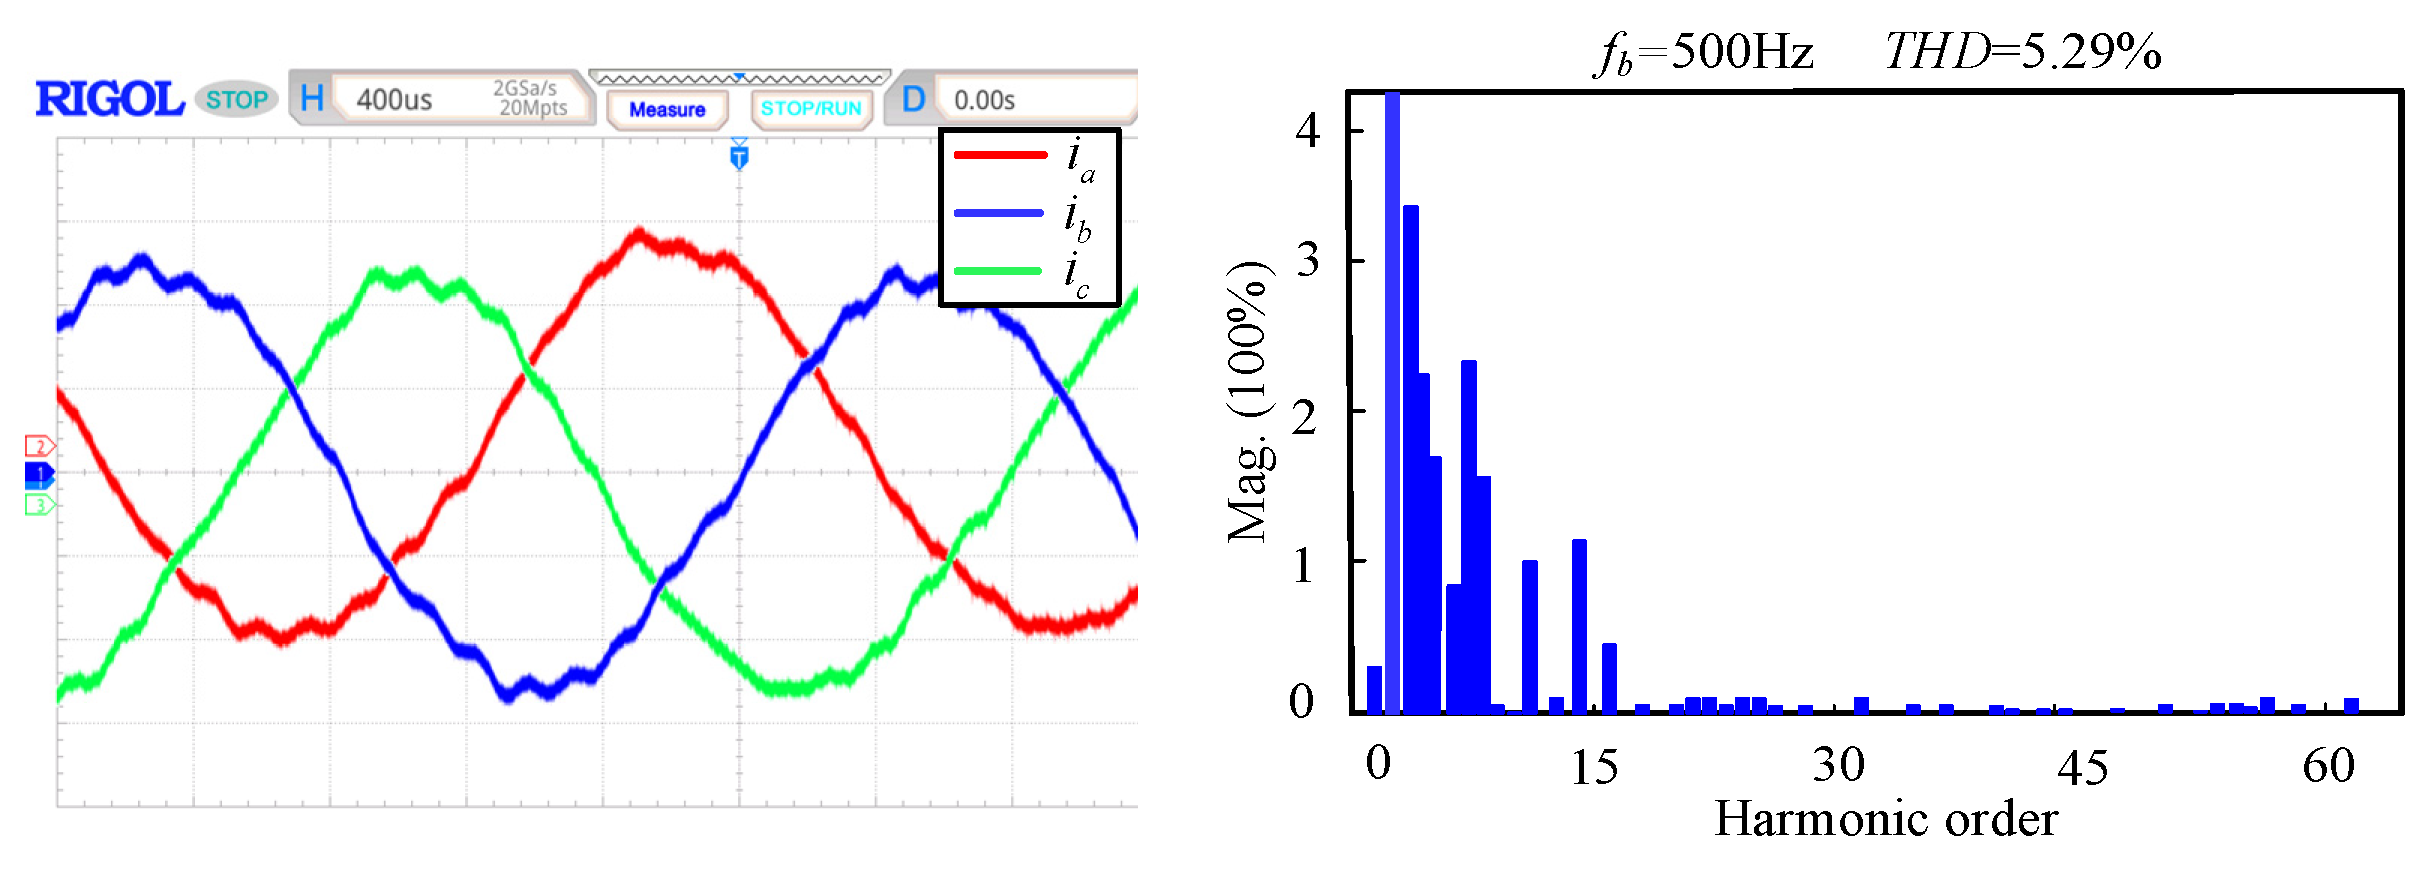
6. Experimental Verification

The experimental test setup is shown in Figure 16, and the LC filter is connected between the inverter and the HPMSM. The experiment is powered by a single-phase regulator with an output voltage of up to 250 V and a rated power of 3 kVA. The torque sensor is coaxially connected with the HPMSM, whose maximum measured torque is 1 N/m, and the measurement accuracy is 0.2%. The measured speed and torque are displayed in real-time on the torque and speed displayer. The hysteresis brake is used as the load; its rated torque is 2 N/m; and the load torque can be changed by the load controller. In order to demonstrate the experimental platform clearly, the schematic diagram of the system is given in Figure 17. Figure 17 shows the connection of the above measurement systems and, in addition, how the control system works. The sampled current and speed position information is processed by TMS320F28335, and the corresponding switching signal is generated in real-time to control the inverter bridge.
The traditional vector control model using double closed loops of speed and current with id = 0 mode is built and implemented in the TMS320F28335 digital signal controller. The system parameters are given in Table 1, where the choice of the ANF step size weighs the convergence speed and accuracy.

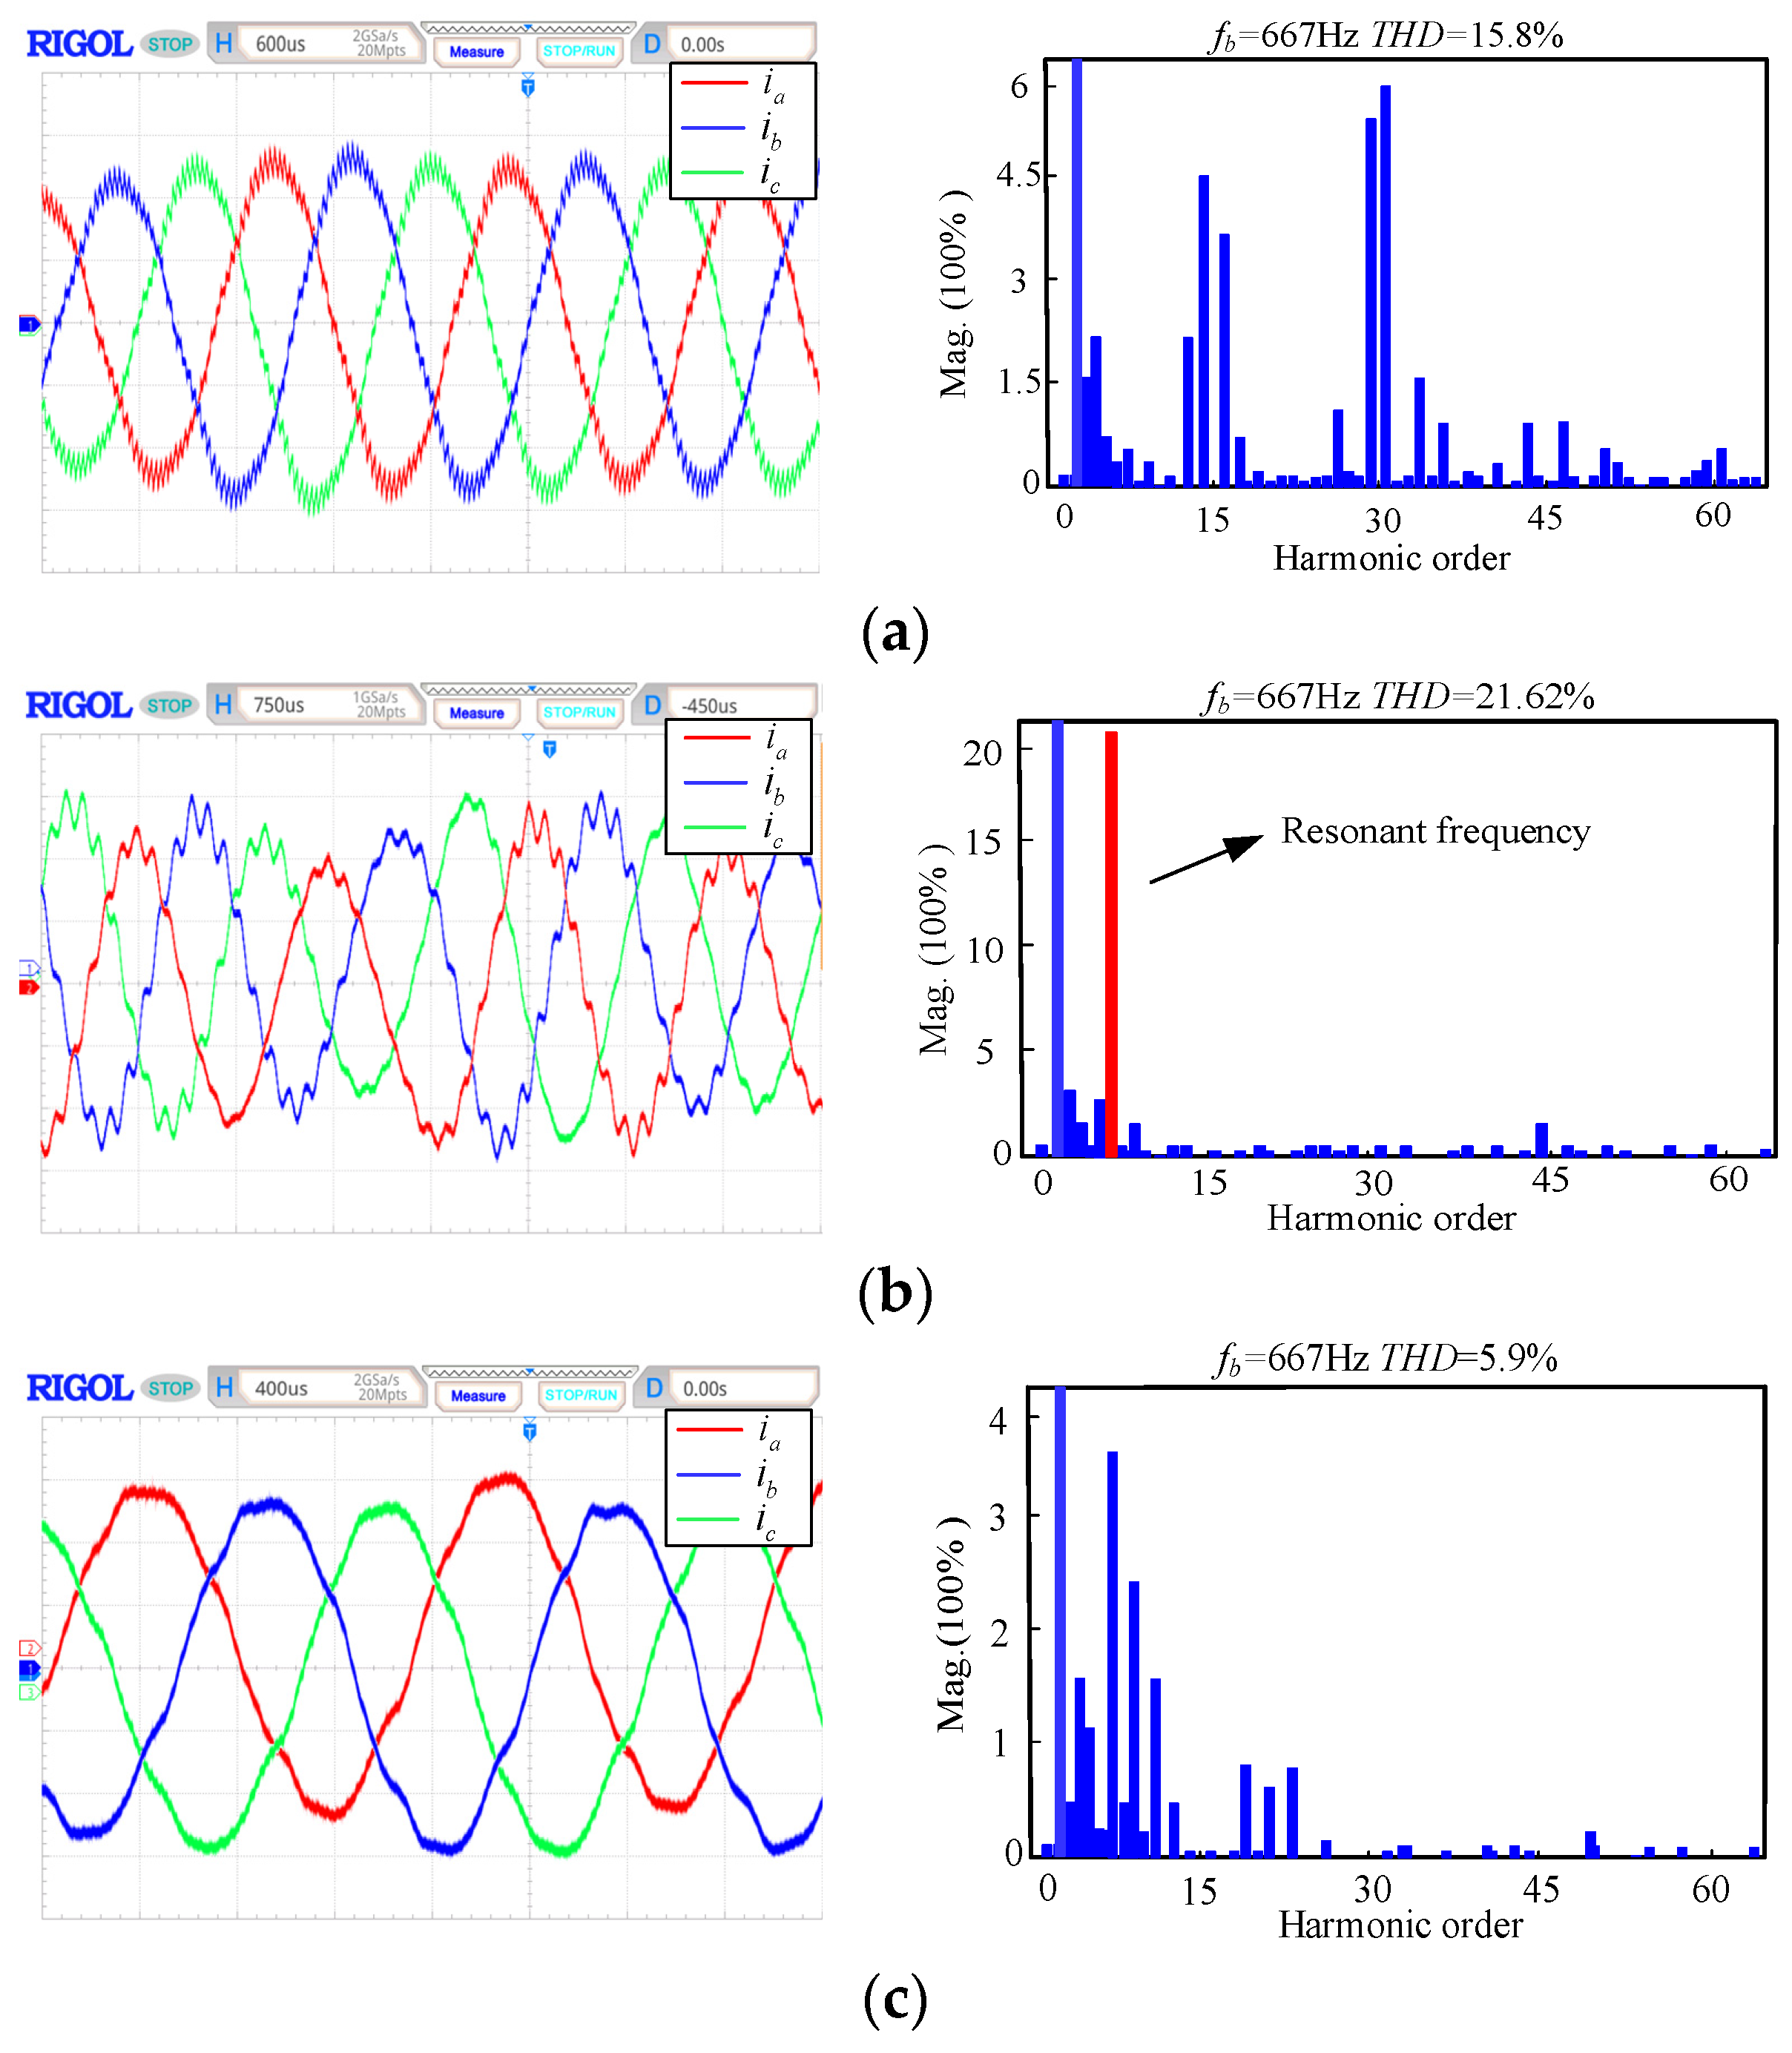
6.1. Harmonic Suppression Performance Tests

To verify the effectiveness and feasibility of the proposed scheme, the load current waveforms under different strategies are observed. In each group of experiments, the speed is set to 8000 rpm; the fundamental frequency is 666.7 Hz; and a load of 0.5 N/m is applied to HPMSM.
Figure 18 shows the three-phase current waveforms and its FFT analysis. The experiments are divided into three groups: without the LC filter, with the LC filter, and with the LC filter and ANF at the same time. It should be noted that to make it easier for readers to distinguish the content of each harmonic, the FFT waveforms have different scales. When harmonic filtering is not considered, as shown in Figure 18a, the current waveforms are three-phase symmetry but contain severe saw tooth spikes. FFT analysis revealed a large number of high-frequency harmonics, and the harmonics are mainly distributed around the multiples of the switching frequency, which is consistent with the theoretical analysis and simulation results. Figure 18b illustrates the case of introducing the LC filter. The high-frequency harmonics content drops significantly, but the system has a resonant peak near 4000 Hz which is highlighted by the red column, causing the FFT to rise by 5.82% instead. The waveforms show that the saw tooth spikes of the currents are suppressed, and the jitter of the waveforms becomes less significant. However, the sinusoidality of waveforms decreases, and the three-phase current becomes unbalanced. In Figure 18c, the ANF is introduced. The sinusoidality of the currents is improved, and the waveform becomes relatively smooth and regains three-phase symmetry. The FFT result shows that the high-frequency harmonics are almost completely filtered out, and the ANF precisely suppresses the resonant peak of the system, reducing the harmonic content by 9.9% and 15.72%, respectively, compared to the above strategy.
The three-phase current waveforms and FFT analysis results at 8000 rpm with a 0.1 N load of HPMSM, and are added further to demonstrate the ability of ANF to eliminate resonant peaks, as shown in Figure 19. When the load is reduced, the current value also decreases, and the waveform contains more ripple. However, the symmetry of the current is good, and there is no resonant peak in the FFT, indicating that the ANF can adjust the parameters automatically to achieve active damping under different load conditions.

6.2. Frequency Adaptive Performance Tests

In order to verify the frequency adaptive performance of the ANF, the speed of HPMSM was suddenly reduced from 8000 rpm to 6000 rpm, and the current waveforms and FFT analysis results are illustrated in Figure 20. Figure 20 shows that when the frequency of HPMSM is changed from 667 Hz to 500 Hz, the high-frequency harmonics of the stator currents are successfully suppressed with an extremely low harmonic content of 5.29%. Importantly, there is no need to adjust any parameters, and the resonance peak is still precisely filtered out. The experimental results show that the resonant peak is able to be suppressed when the HPMSM is running at various speeds due to the introduction of speed feedback.

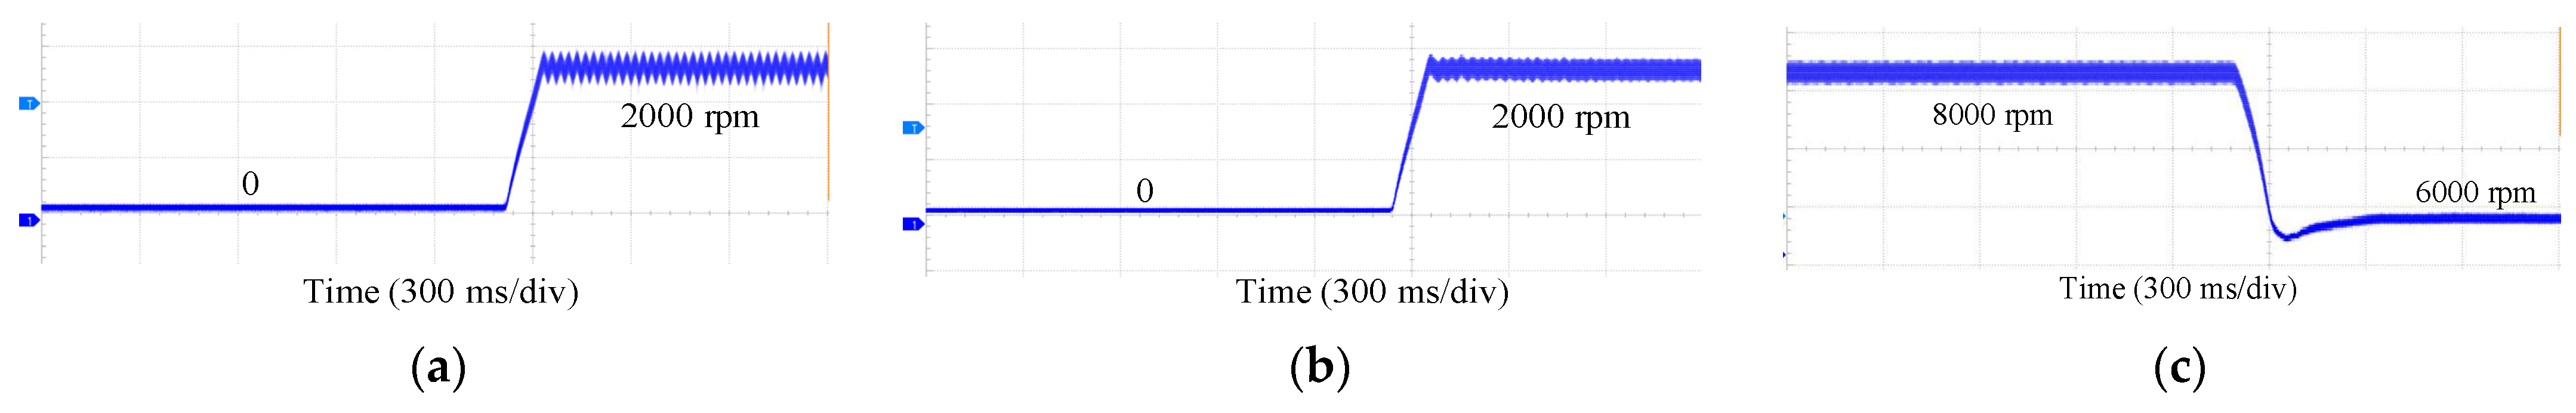
6.3. Speed Regulation Performance Tests

To demonstrate the advantages of the proposed scheme for HPMSM further, speed regulation experiments with and without the proposed scheme are carried out, as shown in Figure 21.
Comparing Figure 21a,b, it can be seen that without filtering high-frequency harmonics, the HPMSM shows a large speed fluctuation reaching the set speed of 2000 rpm, and the speed regulation performance is poor. But when the proposed harmonics suppression scheme is adopted, the speed fluctuation is significantly reduced, and the speed regulation performance is enhanced. Figure 21c supplements the result of the HPMSM with a sudden speed dropping from 8000 rpm to 6000 rpm. After the sudden speed change, HPMSM responds quickly with low overshoot and small steady-state error, which validates its excellent speed regulation performance.

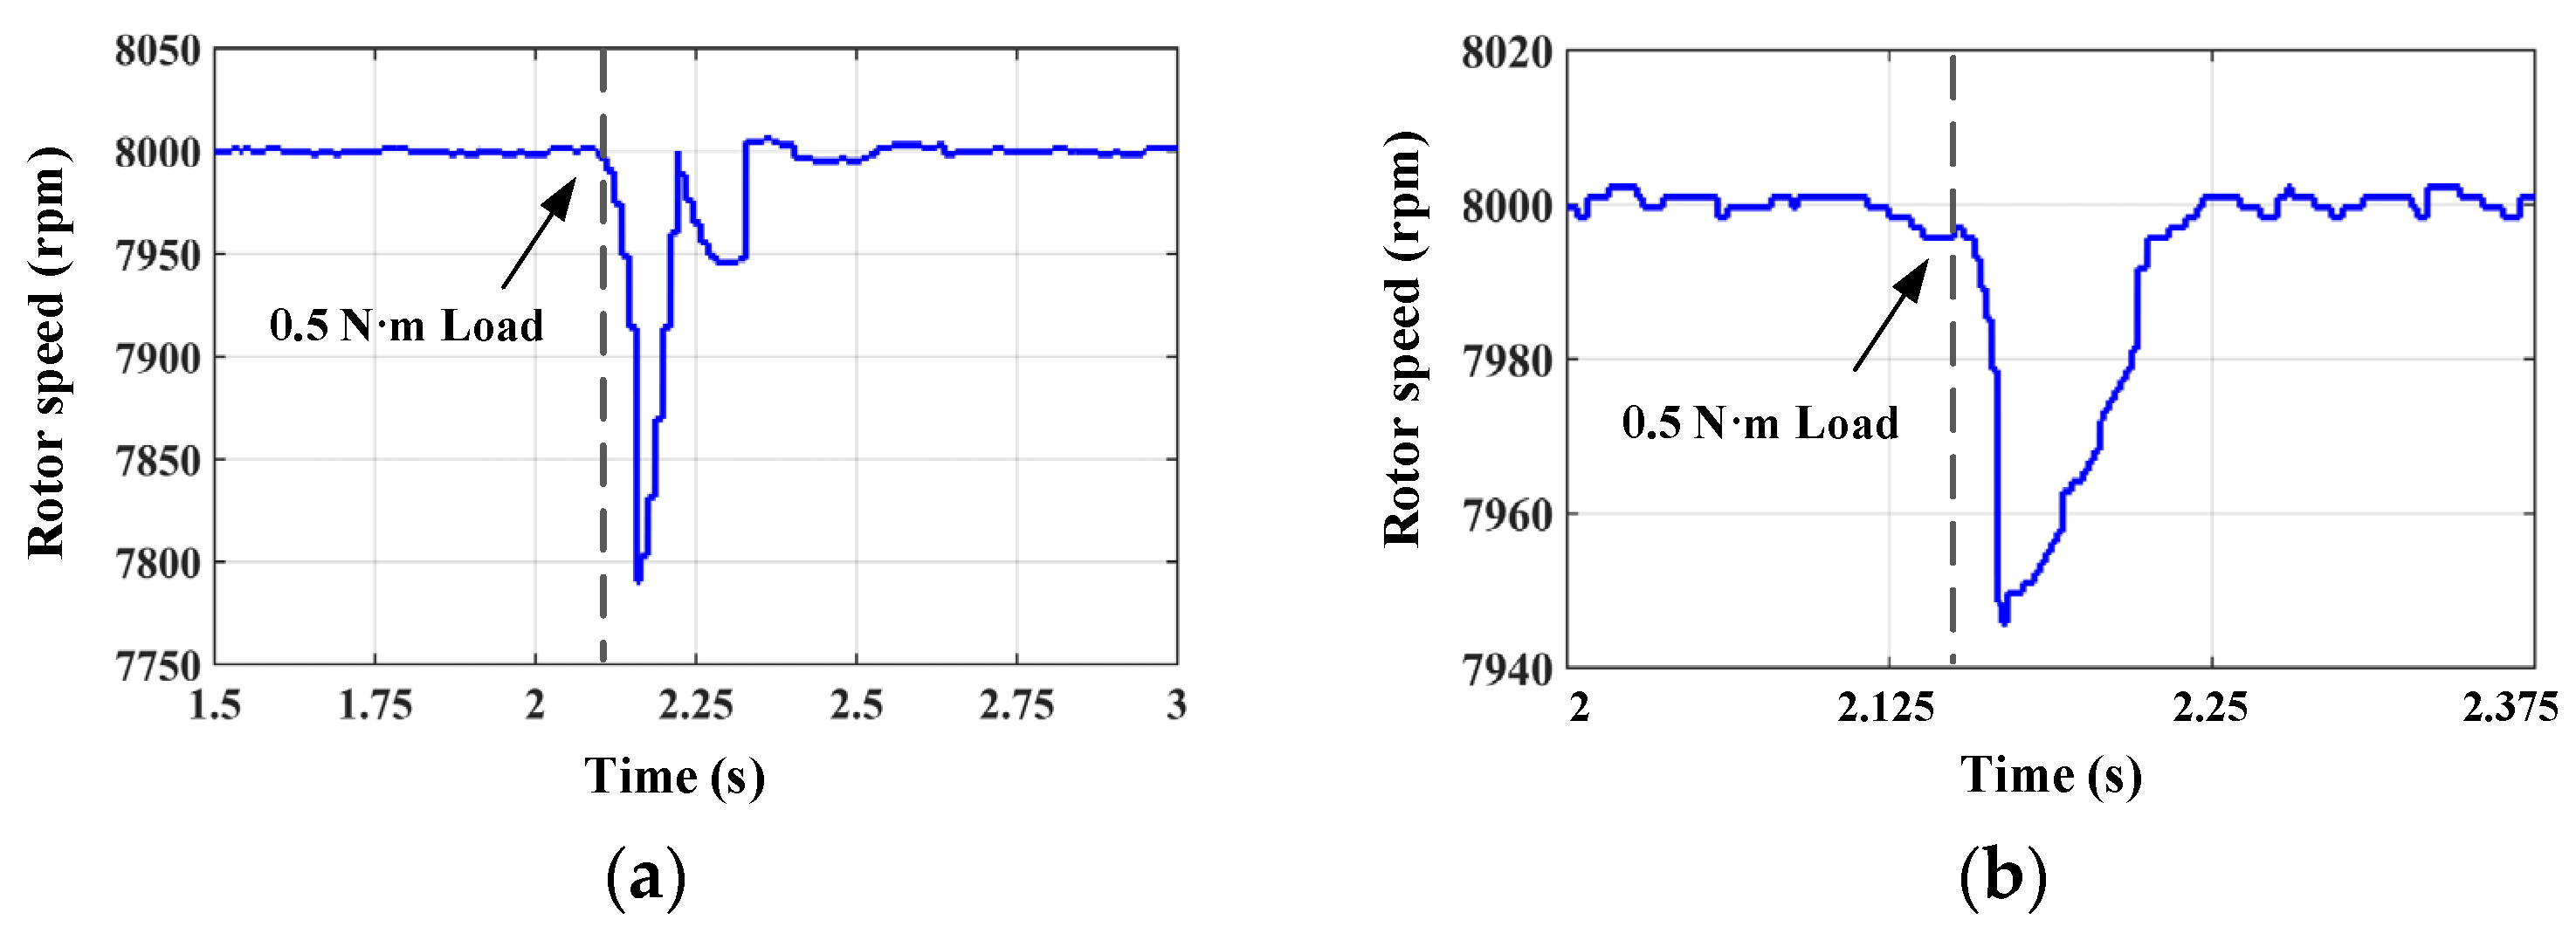
6.4. Load Disturbance Tests

Suppression of high-frequency harmonics can also improve the anti-disturbance performance of HPMSM. To illustrate this point, load disturbance experiments are implemented. HPMSM runs steadily at 8000 rpm under no load, and then suddenly increases the load by 0.5 N·m to observe the change of the rotor speed. The comparison results are shown in Figure 22. In Figure 22a, the speed drops by 200 rpm after loading, and it takes 0.3 s for HPMSM to recover stability, which indicates the anti-interference ability of HPMSM is not strong under the traditional control mode. In contrast, when the proposed scheme is adopted, as shown in Figure 22b, the speed decreased by only 50 rpm after the sudden load change. Besides, the speed recovery time is reduced to 0.1 s. In summary, by filtering out high-frequency harmonics, the anti-disturbance performance of HPMSM is significantly improved.

7. Conclusions

This paper presented a low-inductance HPMSM harmonic suppression scheme using the LC filter and the modified ANF. The LC filter is connected between the inverter and the motor and serves to suppress the harmonics of the stator currents, especially the high-frequency harmonic components caused by the inverter switching. However, the introduction of the LC filter induces system resonance, while the ANF has been designed to eliminate the system resonance peak. The LMS algorithm is used in the notch filter, which can adapt to certain parameter changes. In addition, speed feedback is introduced to track the fundamental frequency in real time; thus, the notch filter can operate effectively under different operating conditions of HPMSM. The proposed method has been experimentally proven to have good harmonic suppression capability, and the dynamic response performance, and anti-interference capability of the controlled HPMSM have improved. The proposed method does not increase system losses, call for additional sensors, or demand a complicated algorithm. Therefore, the proposed method is attractive and promising for HPMSM drives in industry and wide power conversion applications that require high-quality sinusoidal current control.

Author Contributions

Methodology, Y.L.; Formal analysis, Y.L. and X.Z.; Writing—original draft, Y.L. and X.Z.; Writing—review & editing, Y.S. and Y.W.; Supervision, J.D.; Funding acquisition, J.D. All authors have read and agreed to the published version of the manuscript.

Funding

This research was funded by the Natural Science Foundation of China, grant number 52277065, and the National Key R&D Program of China, grant number 2020YFA0710500.

Conflicts of Interest

The authors declare no conflict of interest.

References

  1. Choi, H.H.; Yun, H.M.; Kim, Y. Implementation of evolutionary fuzzy PID speed controller for PM synchronous motor. IEEE Trans. Ind. Informat. 2015, 11, 540–547. [Google Scholar] [CrossRef]
  2. Feng, G.; Lai, C.; Kar, N.C. Expectation-maximization particle-fifilter- and Kalman-fifilter-based permanent magnet temperature estimation for PMSM condition monitoring using high-frequency signal injection. IEEE Trans. Ind. Informat. 2017, 13, 1261–1270. [Google Scholar] [CrossRef]
  3. Liu, K.; Feng, J.; Guo, S.; Xiao, L.; Zhu, Z. Identifification of flflux linkage map of permanent magnet synchronous machines under uncertain circuit resistance and inverter nonlinearity. IEEE Trans. Ind. Informat. 2018, 14, 556–568. [Google Scholar] [CrossRef]
  4. Jing, R.; Ding, D.; Zhang, G.; Wang, Q.; Wang, G.; Xu, D. Active-Damping-Based Field-Weakening Control Strategy with Voltage Angle Regulation for High-Speed SPMSM Drive. IEEE Trans. Ind. Electron. 2024, 71, 1421–1431. [Google Scholar] [CrossRef]
  5. Dai, S.; Wang, J.B.; Sun, Z.; Chong, E. Transient performance improvement of deadbeat predictive current control of high-speed surface-mounted PMSM drives by online inductance identification. IEEE Trans. Ind. Electron. 2022, 69, 12358–12368. [Google Scholar] [CrossRef]
  6. Woo, J.-H.; Bang, T.-K.; Lee, H.-K.; Kim, K.-H.; Shin, S.-H.; Choi, J.-Y. Electromagnetic Characteristic Analysis of High-Speed Motors with Rare-Earth and Ferrite Permanent Magnets Considering Current Harmonics. IEEE Trans. Magn. 2021, 57, 20287784. [Google Scholar] [CrossRef]
  7. Gu, C.; Wang, X.; Deng, Z. Evaluation of Three Improved Space-Vector-Modulation Strategies for the High-Speed Permanent Magnet Motor Fed by a SiC/Si Hybrid Inverter. IEEE Trans. Power Electron. 2021, 36, 4399–4409. [Google Scholar] [CrossRef]
  8. Yaghoobi, J.; Zare, F.; Rathnayake, H. Current Harmonics Generated by Motor-Side Converter: New Standardizations. IEEE J. Emerg. Sel. Topics Power Electron. 2021, 9, 2868–2880. [Google Scholar] [CrossRef]
  9. Liang, W.; Wang, J.; Luk, P.C.-K.; Fang, W.; Fei, W. Analytical Modeling of Current Harmonic Components in PMSM Drive with Voltage-Source Inverter by SVPWM Technique. IEEE Trans. Energy Convers. 2014, 29, 673–680. [Google Scholar] [CrossRef]
  10. Millinger, J.; Wallmark, O.; Soulard, J. High-Frequency Characterization of Losses in Fully Assembled Stators of Slotless PM Motors. IEEE Trans. Ind. Appl. 2018, 54, 2265–2275. [Google Scholar] [CrossRef]
  11. Feng, G.D.; Lai, C.Y.; Kar, N.C. Practical testing solutions to optimal stator harmonic current design for PMSM torque ripple minimization using speed harmonics. IEEE Trans. Power Electron. 2018, 33, 5181–5191. [Google Scholar] [CrossRef]
  12. Zwyssig, C.; Duerr, M.; Hassler, D.; Kolar, J.W. An ultra-high-speed, 500,000 rpm, 1 kW electrical drive system. In Proceedings of the 2007 Power Conversion Conference, Nagoya, Japan, 2–5 April 2007; pp. 1577–1583. [Google Scholar]
  13. Wang, Z.; Chang, L. A DC voltage monitoring and control method for three-phase grid connected wind turbine inverters. IEEE Trans. Power Electron. 2008, 23, 1118–1125. [Google Scholar] [CrossRef]
  14. Liserre, M.; Blaabjerg, F.; Hansen, S. Design and control of an LCL-filter-based three-phase active rectifier. IEEE Trans. Ind. Appl. 2005, 41, 1281–1291. [Google Scholar] [CrossRef]
  15. Beres, R.N.; Wang, X.; Blaabjerg, F.; Liserre, M.; Bak, C.L. Optimal design of high-order passive-damped filters for grid-connected applications. IEEE Trans. Power Electron. 2016, 31, 2083–2098. [Google Scholar] [CrossRef]
  16. Wang, T.C.Y.; Ye, Z.; Sinha, G.; Yuan, X. Output filter design for a grid-interconnected three-phase inverter. In Proceedings of the IEEE 34th Annual Conference on Power Electronics Specialist, Acapulco, Mexico, 15–19 June 2003; Volume 2, pp. 779–784. [Google Scholar]
  17. Rockhill, A.A.; Liserre, M.; Teodorescu, R.; Rodriguez, P. Grid-filter design for a multimegawatt medium-voltage voltage-source inverter. IEEE Trans. Ind. Electron. 2011, 58, 1205–1217. [Google Scholar] [CrossRef]
  18. Tang, W.; Ma, K. Yubo Song Critical Damping Ratio to Ensure Design Efficiency and Stability of LCL Filters. IEEE Trans. Power Electron. 2021, 36, 315–325. [Google Scholar] [CrossRef]
  19. Peña-Alzola, R.; Liserre, M.; Blaabjerg, F.; Sebastián, R.; Dannehl, J.; Fuchs, F.W. Analysis of the passive damping losses in LCL-filter-based grid converters. IEEE Trans. Power Electron. 2013, 28, 2642–2646. [Google Scholar] [CrossRef]
  20. Li, S.; Lin, H. A Capacitor-Current-Feedback Positive Active Damping Control Strategy for LCL-Type Grid-Connected Inverter to Achieve High Robustness. IEEE Trans. Power Electron. 2022, 37, 6462–6474. [Google Scholar] [CrossRef]
  21. Wang, X.; Blaabjerg, F.; Loh, P. Virtual RC Damping of LCL Filtered Voltage Source Converters with Extended Selective Harmonic Compensation. IEEE Trans. Power Electron. 2015, 30, 4726–4737. [Google Scholar] [CrossRef]
  22. Blasko, V.; Kaura, V. A novel control to actively damp resonance in input LC filter of a three-phase voltage source converter. IEEE Trans. Ind. Appl. 1997, 33, 542–550. [Google Scholar] [CrossRef]
  23. Pena-Alzola, R.; Liserre, M.; Blaabjerg, F.; Sebastian, R.; Dannehl, J.; Fuchs, F.W. Systematic Design of the Lead-Lag Network Method for Active Damping in LCL-Filter Based Three Phase Converters. IEEE Trans. Ind. Inform. 2014, 10, 43–52. [Google Scholar] [CrossRef]
  24. Pena-Alzola, R.; Liserre, M.; Blaabjerg, F.; Ordonez, M.; Yang, Y. LCL-Filter Design for Robust Active Damping in Grid Connected Converters. IEEE Trans. Ind. Inform. 2014, 10, 2192–2203. [Google Scholar] [CrossRef]
  25. Dick, C.P.; Richter, S.; Rosekeit, M.; Rolink, J.; De Doncker, R.W. Active damping of LCL resonance with minimum sensor effort by means of a digital infinite impulse response filter. In Proceedings of the 2007 European Conference on Power Electronics and Applications, Aalborg, Denmark, 2–5 September 2007; pp. 1–8. [Google Scholar]
  26. Yang, L.; Yang, J.; Gao, M.; Chen, Y.; Zhang, X. A Systematic Approach via IIR Filters for Enhancing the Robustness of LCL-Type Shunt Active Power Filters to Grid Impedance. IEEE Trans. Ind. Appl. 2020, 56, 5095–5107. [Google Scholar] [CrossRef]
  27. Han, Y.; Li, Z.; Yang, P.; Wang, C.; Xu, L.; Guerrero, J.M. Analysis and Design of Improved Weighted Average Current Control Strategy for LCL-Type Grid-Connected Inverters. IEEE Trans. Energy Convers. 2017, 32, 941–952. [Google Scholar] [CrossRef]
  28. Liserre, M.; Dell’Aquilla, A.; Blaabjerg, F. Genetic algorithm based design of the active damping for a LCL-filter three-phase active rectifier. IEEE Trans. Power Electron. 2003, 19, 234–240. [Google Scholar]
  29. Dannehl, J.; Liserre, M.; Fuchs, F. Filter-based active damping of voltage source converters with LCL-filter. IEEE Trans. Ind. Electron. 2011, 58, 3623–3633. [Google Scholar] [CrossRef]
  30. Lyu, Z.; Wu, L. Resonant Frequency Deviation Analysis and Modified Notch Filter-Based Active Damping for SiC-Based PMSM Drive with Sine Wave Filter. IEEE Trans. Energy Convers. 2023, 38, 417–427. [Google Scholar] [CrossRef]
  31. Pillay, P.; Krishnan, R. Modeling, simulation, and analysis of permanent-magnet motor drives. I. The permanent-magnet synchronous motor drive. IEEE Trans. Ind. Appl. 1989, 25, 265–273. [Google Scholar] [CrossRef]
  32. Harnefors, L.; Pietilainen, K.; Gertmar, L. Torque-maximizing field-weakening control: Design, analysis, and parameter selection. IEEE Trans. Ind. Electron. 2001, 48, 161–168. [Google Scholar] [CrossRef]
  33. Lei, Y.; Jianqing, S.; Fei, X.; Chen, M.-L. Nonsingular terminal sliding-mode observer design for interior permanent magnet synchronous motor drive at very low-speed. Acta Phys. Sin. 2013, 62, 45–53. (In Chinese) [Google Scholar]
Figure 1. Frequency distribution chart of three-phase current harmonics.
Applsci 13 11309 g001
Figure 2. Structure diagram of the single-phase drive system of HPMSM with LC filter.
Applsci 13 11309 g002
Figure 3. Bode diagram of HPMSM control system with LC filter.
Applsci 13 11309 g003
Figure 4. Bode diagram of LC filter when inductance varies.
Applsci 13 11309 g004
Figure 5. Control diagram of LC type HPMSM with parallel connection of the filter capacitor and the resistor.
Applsci 13 11309 g005
Figure 6. Bode diagram of LC filter with parallel connection of the filter capacitor and the resistor when the resistor varies.
Applsci 13 11309 g006
Figure 7. Control diagram of LC type HPMSM with capacitance current proportional feedback.
Applsci 13 11309 g007
Figure 8. Bode diagram of the capacitor current proportional feedback method when Hi varies.
Applsci 13 11309 g008
Figure 9. Structural block diagram of ANF.
Applsci 13 11309 g009
Figure 10. Bode diagram of ANF with different step sizes.
Applsci 13 11309 g010
Figure 11. Comparison of filtering effects at different step sizes: (a) original signal with harmonics at 4500 Hz; (b) μ = 0.01; (c) μ = 0.001.
Applsci 13 11309 g011
Figure 12. Structure of HPMSM harmonic suppression control system based on LC filter and ANF.
Applsci 13 11309 g012
Figure 13. Q-axis ANF structure.
Applsci 13 11309 g013
Figure 14. The simulation model of proposed scheme.
Applsci 13 11309 g014
Figure 15. Simulation results of three-phase current waveforms and FFT analysis at 8000 rpm with 0.5 N·m load: (a) without LC filter; (b) with LC filter; (c) with LC filter and traditional active damping method; (d) with LC filter and ANF.
Applsci 13 11309 g015aApplsci 13 11309 g015b
Figure 16. Experimental setup.
Applsci 13 11309 g016
Figure 17. The schematic diagram of the experimental setup.
Applsci 13 11309 g017
Figure 18. Experiment results of three-phase current waveforms and FFT analysis at 8000 rpm with 0.5 N·m load: (a) without LC filter [2 A/div]; (b) with LC filter [2 A/div]; (c) with LC filter and ANF [2 A/div].
Applsci 13 11309 g018
Figure 19. Experiment results of three-phase current waveforms and FFT analysis at 8000 rpm with 0.1 N·m load [1 A/div].
Applsci 13 11309 g019
Figure 20. Experiment results of three-phase current waveforms and FFT analysis at 6000 rpm with 0.5 N·m load [2 A/div].
Applsci 13 11309 g020
Figure 21. Experimental results of the speed mutation: (a) no-load start experiment without proposed scheme; (b) no-load start experiment with proposed scheme; (c) speed sudden change experiment with proposed scheme.
Applsci 13 11309 g021
Figure 22. Comparison results of load disturbance experiment: (a) without proposed scheme; (b) with proposed scheme.
Applsci 13 11309 g022
Table 1. Parameters of HPMSM Control System.
ParametersSymbolValue
Power ratingPn730 W
Pole pairsPn5
Permanent magnetic linkage ψ f 0.0509 Wb
Rated speed ω n 10,000 rpm
Rotor diameterDr28 mm
Stator resistance Rb1.41 Ω
D-axis stator inductanceLd0.8 mH
Q-axis stator inductanceLq0.8 mH
Rotor inertiaJ0.0005 kg·m2
ANF step size μ 0.02
Filter inductanceL10.3 mH
Filter capacitanceC4.7 μ F
Switching frequencyfs10 kHz
Disclaimer/Publisher’s Note: The statements, opinions and data contained in all publications are solely those of the individual author(s) and contributor(s) and not of MDPI and/or the editor(s). MDPI and/or the editor(s) disclaim responsibility for any injury to people or property resulting from any ideas, methods, instructions or products referred to in the content.

