Abstract
This work focused on prescribing, designing, implementing, and evaluating a pilot project conducted in the Greek power system that addressed balancing and congestion management issues that system operators (SOs) face within the clean energy era. The considered pilot project fully focused on the development of the F-channel platform, including the idea behind this application, the steps that were taken in the process, and the outcomes of the performed activities fitting into the overall picture of the OneNet project. The specified F-channel platform is a web-based, client-server application that uses artificial intelligence (AI) techniques and cloud computation engines to improve the management of the active power for the TSO-DSO coordination. The flexibility of the grid’s resources was identified, and an integrated monitoring system based on the precise forecasting of variable generation and demand was implemented. The focus areas were congestion management, frequency control, and voltage control services, for which corresponding network models were created in close cooperation with system operators. The obtained results are essential for the remaining demonstration results because they offer an incredibly accurate basis for further research into their use in congestion management and other weather-related enhanced transmission and distribution system planning and operation practices.
1. Introduction
Based on the conducted study and development of the OneNet (One Network for Europe) project [1], Europe’s electrical network tends to be seamlessly integrated. The latter creates the ideal environment for a synergistic operation and improves the entire power grid while establishing an open and fair market structure [2]. OneNet contributes to low carbon development and is financed by the Programme Horizon 2020 [3]. Grid operators must modify their current business model to provide for quicker reflexes and adaptive flexibility, as the power system transforms from a completely centralized to a mainly decentralized one. This is an extraordinary issue that calls for an unheard-of solution. More than 70 partners, including well-known IT companies and top research institutions, are involved in the project and the two most important grid operator organizations.
The project’s key elements involve:
- The establishment of common market architecture for Europe that requires standardizing products and basic requirements for grid services [4,5,6,7].
- The establishment of common IT architecture and IT interfaces that offer open architecture of interactions between various platforms and allow competition in any market across Europe [8].
- The proposal and implementation of scalable solutions verified by large-scale demonstrators [9] that test distinctive use cases. Greece is one of the demonstrator countries in the southern region cluster.
In Greece, since 1 November 2020, the target model for the balancing market has been adopted [10]. Currently, the balancing market in Greece consists of the balancing capacity market, the balancing energy market, and the imbalance settlements according to the target model structure [11,12]. The day-ahead required pool system, which started in 2005, was superseded by the new market design. This central dispatching model substituted unit-based involvement for portfolio-based participation in the scheduling process and dispatching bids [13,14].
The system’s safety depends on the balancing market because it has both economic [15,16,17] and physical impacts [18,19,20]. The unit-based/central dispatching structure is the basis of the balancing market in Greece. According to an optimization algorithm, the system operator in Greece determines the lowest-priced bids and sends related orders to each production unit chosen to provide each service [21,22]. Especially in the early stages, the capability of providing balancing services according to the operator’s expectations is ensured. The necessary orders are then given as needed to the entities that offer balancing services. The current balancing uses three separate markets: the market for balancing capacity, the market for balancing energy, and the market for settling imbalances [12,23]. The three primary balancing capacity products that the market design has specified are the manual upward and downward manual Frequency Restoration Reserve (mFRR), upward and downward automatic Frequency Restoration Reserve (aFRR), and upward and downward frequency containment reserve (FCR) [12,13,22,23].
All entities that can deliver balancing services are obliged to submit market bids, whose amount has been determined by the system operator (SO). When manual Frequency Restoration Reserve (mFRR) activation is necessary for upward or downward movement, the operator can make this determination in almost real-time and subsequently sends the corresponding orders that derive from the cost bids with the lowest price [23]. Entities that can deliver aFRR in real-time receive automatic orders to preserve the system’s balance and ensure its secure operation [24].
In order to help facilitate the energy transition, the EU finances projects that aim to provide a solution to the flexibility challenge. These energy projects each contribute in a different way to enabling the energy transition, from system management to risk mitigation and interoperability fostering. A scalable and interoperable energy management system will be implemented as part of the four-year COLLECTiEF project [25], which aims to turn buildings into smart habitats. COLLECTiEF increases flexibility on both the supply and demand sides to perform this. The EUniversal project [26] attempts to create strategies for the effective implementation of an interoperable flexibility ecosystem throughout Europe. It serves as a basis for the development of new services, market solutions, and the implementation of practical procedures to support consumers, prosumers, and energy communities in actively participating in the energy transition. This new strategy will concentrate on how DSOs employ flexibility and interact with markets.
Another European research and innovation project called FEVER [27] is dedicated to demonstrating and implementing solutions that make the most of the potential for flexibility in the production, consumption, and storage of energy. FEVER seeks to encourage the best possible control of renewable energy-based power grids. This project’s solutions focus on market flexibility, monitoring, automated control, and flexibility aggregation and management. The products and services of FEVER were put to the test in three European pilots—in Spain, Cyprus, and Germany—under genuine circumstances. FLEXGRID [28] is a project that aims to offer a comprehensive remedy for future smart grid architecture. FLEXGRID makes use of cutting-edge models, technologies, data analytics, and precise projections to accomplish this purpose. By collaborating with energy service providers (ESPs) and producers of renewable energy sources (RESPs) through unique flexibility market procedures, the initiative helps DSOs and TSOs manage their power grids safely and affordably. Furthermore, both ESPs and RESPs have the chance to develop into competitive, sustainable businesses that, in the case of RESPs, best compose and utilize their production.The OneNet System, which the current work presents as working in the same direction as the above-mentioned EU projects, provides operators with tools of great value to monitor the real-time state of the grid [29] and coordinate automatically the flexible resources situated at both the transmission and the distribution grid [30,31]. The market operator (MO), the DSO, the TSO, and flexible resources can successfully operate simultaneously. This collaboration is supported by the OneNet system, which facilitates regular data and information exchange between the various entities.
In continuation of [32,33], this work can be viewed as an overview of the most notable activities carried out in the OneNet project [1], developing and implementing the F-platform in Greece. This paper includes an in-depth look at the F-channel platform, which was also covered in [32,33]. The characteristics listed in [32,33] are rather general, with most of them focusing on the theoretical aspects and ideas that inspired the platform in the first place, whereas the details listed in this work focus on the activities that have already been completed and implemented in the solution, removing all uncertainties from the discussion.
According to the generally accepted definition, the Key Exploitable Results (KERs) of a project or the solution that resulted from that project represent the main outcomes of interest for the relevant stakeholders. These KERs were chosen and given priority due to their high potential for being exploitable downstream of the project’s value chain or due to their capacity for serving as a crucial input for later policies, research, or education. In keeping with this, it is also important to determine what the OneNet project can contribute to the Greek power system in this regard, identifying the two main aspects that have the greatest potential for future use. These two results are exploitable in the following:
- KER 1: Exploitation of the F-channel Forecasting module as the forecasting and data analysis tool for the procurement of flexibility, enhancement of grid observability and reliability, and network planning.
- KER 2: Exploitation of the F-channel Coordination module as the benchmark platform that connects TSOs and DSOs.
The structure of this work is as follows: In Section 2, deep power system analysis through GIS server application is presented. In Section 3, the F-channel platform with its Forecasting and Coordination modules, along with the auction sub modules, are provided. In Section 4, there is a business use case (BUC) scenario for testing the platform. The discussion and concluding notes are provided in the last two sections.
2. OneNet Scenario: Deep Power System Analysis through GIS Server Application
Τhe scenario, which was related to the project and was envisaged as an aid on the path to achieving the desired targets, was named “Deep power system analysis through GIS server application (Georeferenced power system modeling and analysis utilizing the geo-server)”. Along with the title, the solution that was developed was depicted as the detailed power system analysis algorithm with GIS implementation that has been fully entangled with the foreseen functionalities of the F-channel platform. The main goals of the adopted scenario could be summed up as follows:
- Power system analysis on the selected region (Crete Island and Peloponnese), including both TSO and DSO grid simulation models down to the lowest voltage level entities.
- Geographic visualization of simulation results, with exposing results and linking to other services that are developed under F-channel via GIS technologies.
Out of these desired outcomes, particular attention needs to be paid when selecting areas of the system that must be modeled down to the lowest level entities, such as the individual households or singled out production units in the power plants. Figure 1 gives an insight into the required level of modeling of all participants in the energy market.
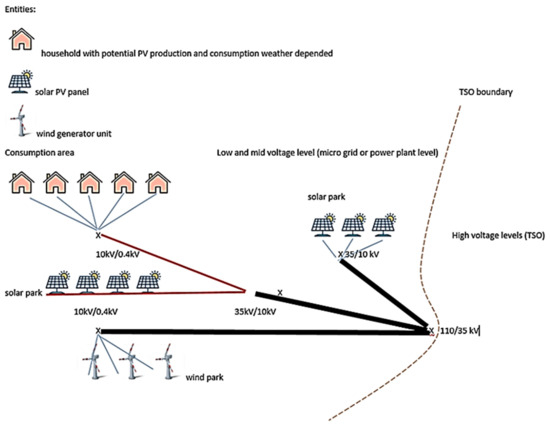
Figure 1.
Representation of the deep network modeling of all voltage levels.
Τhe modeling process was set to focus on providing the users of the F-channel platform (mainly the SOs) with the option of accessing the information related to the current system state that was previously unavailable to them, i.e., the real-time changes of the behavior of the individual households, as depicted in Figure 1. By providing the operators with realistic data on the system entities of interest for them, it is ensured that they have all the potentially relevant information at their disposal to make reliable decisions and to reach effective conclusions. Therefore, the obtained decisions would be in line with the well-being of the entire system and all the participants in it. The solution named Georeferenced power system modeling and analysis utilizing the geo-server (GEOGRID) was selected after all applications were collected, thoroughly studied, and evaluated.
3. The F-Channel Platform
By its definition and the basic idea behind it, the F-channel platform represents an application of a web-based client-server for TSO-DSO coordination, utilizing high-resolution weather forecasting [34], artificial intelligence methods [35,36,37,38], a GUI based on the georeferenced projection of the grid on the map, and cloud calculation engines. The F-channel platform should encompass and implement a set of common functionalities for the SOs regarding the enhancement of forecasting capability and efficiency in various time frames, limiting the volume of flexibility needs [39,40,41] in the process, as well as the identification and prequalification of various flexibility resources willing to purchase grid services [42,43,44] through the “market-to-network” coupling of the alternative solutions. In a simplified way, this type of relationship between the under-investigation process participants is demonstrated in Figure 2, and it involves a Forecasting and a Coordination module. The integration of AI and cloud computing can lead to complex implementation processes. These were taken into consideration, and the allocated computing resources were split into two groups: continuously allocated ones and ones allocated per computation/transaction. This made the implementation processes simpler and the computation time shorter.
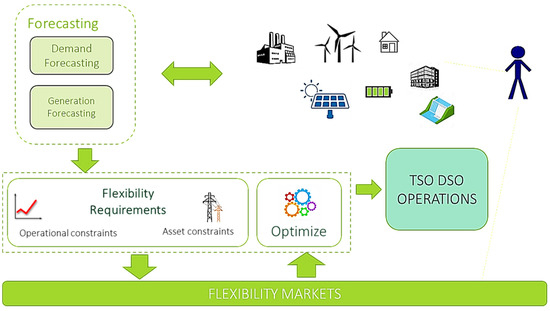
Figure 2.
The F-channel platform’s expected role in the flexibility market.
Τhe F-channel platform is envisaged as the web-based client server application that will contribute to enhancing active power management for TSO–DSO coordination by using artificial intelligence methods and cloud calculation engines. In order to achieve this, however, certain preconditions needed to be met, with the first of them being the availability of the detailed climatic data models. The luxury of having these models at hand opened the possibility of predicting the various parameters relevant from the SO point of view. For instance, predictions of wind speeds and insolation patterns with a rather high resolution gave the chance to adapt the AI algorithms to connect those predictions with the behavior of the generation units in the system in the way that has never been seen before. Along with that, the forecasts of the demand power and the occurrences of conductor icing and storms that could harm the reliability of the system operation are also noteworthy. All of these can be seen as the ideas behind the enhancements and advancements that were introduced in the Flexibility channel. Additionally, implementing a project can be difficult when it comes to navigating the regulations and policies in force for new technologies [45].
This project focused on giving the user the option of manually defining the domain of the DSO/microgrid or TSO voltage level region of interest for which the simulations of the power production, flows, and consumption are conducted to avoid the unnecessary calculations and sub-optimal usage of the available resources. These calculations were set to include contingency analyses, among other functionalities. Once the capability described in this work as a case study (performing the analyses solely for the part of the system determined by the user) comes to life, it will guarantee the shorter duration of the calculations without putting their reliability at any kind of risk. The objectives of this can be seen in the list provided below:
- Frequency stability.
- Load flow, contingency monitoring, and predictions.
- Predictive congestion management for maintaining secure and stable power system operation.
- Cost-effective operation of the system.
- Early warning on the hazardous power system regimes.
- Better FSP planning and managing flexibility resources.
- Better predictions for the energy and power system’s state.
- Improved identification of the available flexibility resources on all power system levels.
- Improved prediction of the system flexibility needs.
Special care was given to the security of the server infrastructure, the question whose relevance has continuously been growing in the previous several years with the increasing number of information leaks and hacker attacks even on some of the largest and best-protected organizations, whose field of work covers power systems and their management. Therefore, the server access codes for the development environment were encrypted with the appropriate SSH (Secure Shell) keys. Furthermore, access to different parts of the platform was restricted in a way to only give permission to enter to the specified IP address ranges. In line with this approach, access to the web application on the user side also was limited to verified accounts created by users, with each of the users, depending on the designated type assigned to them, only seeing the appropriate page of the F-channel platform.
The most prominent example of applying the AI tools is seen in the part of the platform related to the Forecasting Module. Here, the specifically designed and trained ANN was combined with the high-resolution measurements of the climatic conditions to provide potential users with forecasts of the selected system state parameters with a remarkable level of accuracy. These parameters include, for example, the production of the wind and solar units in the area of interest or the ampacities of the chosen lines in the system. In line with this, the platform was developed in such a way to have those functionalities already implemented; thus, there is no need to accommodate the mentioned features in the future. They are already in the F-channel platform, giving the users the opportunity of harvesting the benefits in a friendly and intuitive environment.
3.1. Forecasting Module
The forecasting module of F-channel is capable of forecasting meteorological factors, load flow, voltage profile simulations, and solar and wind energy generation (known for their unpredictable power output). The GEOGRID solution that was created because of the OneNet Open Call is integrated within the Forecasting module of F-channel and includes a georeferenced map presentation that was produced as part of the Forecasting module’s appropriate GUI.
The Forecasting module was created with the concept that users should have the choice to turn off all other parameters and only view the predetermined set of parameters that interests them. Accordingly, layers were constructed on the georeferenced map of the area of interest, each of them corresponding to a different meteorological characteristic or grid part in these areas. Figure 3 displays the selected area’s grid layers, which include grid elements such as nodes, generating units, and lines.
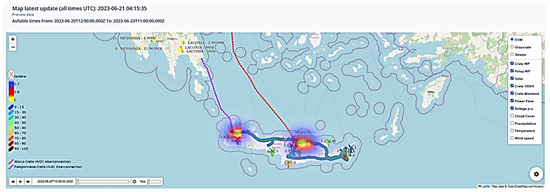
Figure 3.
The grid layers of the F-channel platform.
The results of the load flow and voltage condition calculations are displayed on the map in accordance with the principle of color coding. What should be emphasized, however, is that each calculated parameter (loadings of the lines, voltages of the nodes, etc.) has a separate layer all to itself, allowing the user to toggle their projection on the map according to their preferences. Figure 4 shows a portion of the map that has been zoomed in to reveal more details and the outcomes of the calculations.
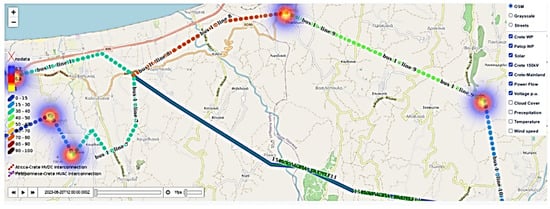
Figure 4.
The grid layers of the F-channel platform zoomed in.
The Forecasting module also includes weather layers, which display forecasts of climatic indicators, important for the operation of various components of the power system. The temperature values are displayed on the map, in Figure 5, which is crucial because temperature variations can have an impact on a variety of system components, including lines (for which a rise in temperature reduces transmission capacity) and solar production units (for which the efficiency of the generation varies with temperature). This parameter is also color coded in Figure 5.
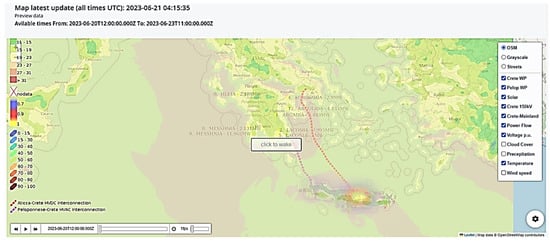
Figure 5.
The weather layers of the F-channel platform regarding temperature.
The visibility of the electricity cables and grid nodes in Figure 5, even if the temperature characteristic was chosen to be shown there, accurately implies that the user can have simultaneous access to the grid and weather layers of the Forecasting module, enabling them to draw some inferences or identify correlations that might otherwise go unnoticed. In Figure 6, the weather layer of the F-channel platform is shown, with cloud coverage chosen as the meteorological characteristic of interest rather than temperature.
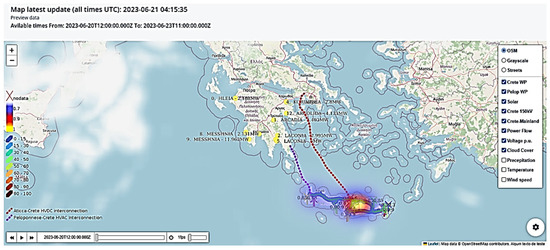
Figure 6.
The weather layers of the F-channel platform regarding cloud coverage.
Cloud coverage is a crucial characteristic for solar power plants, since the sudden appearance of a cloud can quickly bring the output power of a solar panel to zero. As a result, it is beneficial to be able to track whether there are any clouds in the area of interest and whether there will be any in the hours to come. The precipitation characteristic is investigated within Figure 7 as the last example of the weather layers.
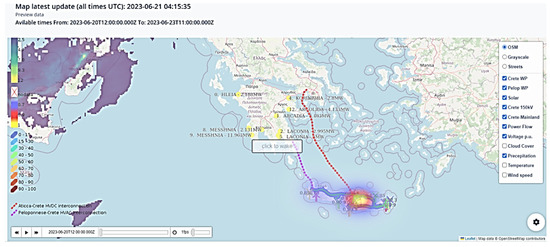
Figure 7.
The weather layers of the F-channel platform regarding precipitation.
3.2. Coordination Module
Within the F-channel Coordination module for providing balancing and congestion management services, following the successful integration of the results of OneNet in the F-channel environment, TSOs and DSOs have interfaces for Flexibility Register and TSO–DSO Coordination. These two subsystems interface all market participants, i.e., the FSPs, market operators, metering data administrators, and consent administrators. Data are exchanged at TSO level for interoperability towards the distribution system. It is not foreseen that any market data are shared directly between SOs. Grid data are, on the other hand, shared directly between the SOs to meet requirements related to the existing practices related to the network security and operational stability of regular checks. TSO and DSO are able to share information related to future flexibility needs, calls for flexibility tenders, flexibility purchase offers, grid data for qualification and bid optimization, flexibility requirements that are checked against operational and asset-based constraints, and activation requests within their systems. Within the Coordination module, the auction submodule with all its components is considered.
3.2.1. Auction Submodule—Supported Products
The auction submodule of the F-channel platform provides the market participants with week-ahead to day-ahead frequency responses and re-dispatching of auction-based procurements of the capacity reserves and available flexibility products. F-channel brings the flexibility products, including the ancillary service market operation, closer to real-time, recognizing the time-dependent and location-dependent values of balancing products and enabling new participants to take part in the electricity market. TSO is expected to enter the amount of secondary and tertiary reserve needed in its control area. Based on the information from the registry, the MO will set up the auctions. Each DSO/TSO enters forecasted contingencies, congestions, and voltage problems to be resolved. The following products that can be auctioned are supported on the F-channel platform:
- aFRR UPWARD.
- aFRR DOWNWARD.
- mFRR UPWARD.
- mFRR DOWNWARD.
- Forecast of the short-term local active product UPWARD.
- Forecast of the short-term local active product DOWNWARD.
- Forecast of the short-term local reactive product UPWARD.
- Forecast of the short-term local reactive product DOWNWARD.
- Forecast of the long-term local active product UPWARD.
- Forecast of the long-term local active product DOWNWARD.
To introduce the products that are proposed by the project to the user, Table 1 gives a short description of them, followed by those proposed and studied within OneNet harmonized products.

Table 1.
Description of the products proposed by the OneNet project.
After the brief introduction, the next part of the description of the products of interest is based on going through the products one-by-one and providing some of the more prominent attributes of those products, given in Table 2. As it is easily seen, the left column of the table is reserved for the attributes corresponding to the product, whereas the right column gives the values for each of the attributes. Sometimes, those values are not numerical but logical (yes/no questions) or even descriptive, but they always help in describing the product better.
Table 2.
Attributes for aFRR, mFRR, and the predictive short-term local active product.
aFRR
aFRR is defined [46] as the active power reserves that are available to restore the system frequency to the nominal frequency. The “a” in its name comes from the fact that the activation of this product always takes place automatically. In Table 2, the attributes related to this product can be found.
mFRR
As studied in [47], the mFRR product can be defined as the available active power reserves for the restoration of system frequency and, for the synchronous area consisting of more than one LFC area, the restoration of the power balance to the scheduled value. The “m” in its name refers to the fact that the activation of this product always takes place manually (in contrast to the previous product). In Table 2, more details on the discussed mFRR product are provided.
Predictive Short-Term Local Active Product
Considering the active power nature of this product, it can be used to respond to a forecasted system need within the timeframe of the operational planning. As a result, the product’s activation can be scheduled, which lessens strain on the entire activation time and boost liquidity. The product can be purchased as a capacity-only item, an energy item, or both a capacity-only item and an energy item. To boost the liquidity of the market, this product would be purchased at least once every month. Since this would enable the activation of resources that would be closer to the location in which the need for the product has been detected, the product would need to include the additional information regarding the location of the flexibility resource that would offer the service later. Additionally, this product’s ability to be activated manually or automatically sets it apart from the first two goods. Table 2 provides all the rest of the information related to this product.
Predictive Long-Term Local Active Product
This product could be used to reduce and/or postpone the requirement for additional active energy grid reinforcements, thus enabling the better management of the available budget of SOs and the redirection of the resources that would otherwise be used for those reinforcements to some of the other urgent projects in the grid. The duration of the product could extend over a long period (more than a month). Activation can either be planned or performed at the request of the SO. This product would include information about the flexibility resource location that could provide the requested service. More information on it, including the mode of activation and the minimum quantity, can be found in Table 2.
Predictive Short-Term Local Reactive Product
This product would be used to react to a forecasted system need within the operational planning timeframe by using the reactive power, heavily intertwined with the voltage values on the nodes in the system. In line with the specified timeframe assigned to this product, activation can be planned. The product can be acquired as capacity only, reactive power product only, or as both a capacity and reactive power product. This product would, similarly to both products dealing with active power and their usage for the satisfaction of system needs, also include information about the location of the flexibility resources that would provide the system with its reactive capabilities. The activation of this product could be performed either manually or automatically; thus, there was no need to define two separate products depending on the manner of the foreseen activation. The attributes of this product are included in Table 2.
3.2.2. Auction Sub Module—Auction Flow
Once the products that are supported by the platform have been defined, the next step would be the design of the flow of the auctions, based on which the potential service providers would submit the bids and be selected, if they satisfy the required conditions. The basic flowchart of the process, as envisaged considering both the present situation in Greece and the expected changes in the upcoming period, is depicted in Figure 8.
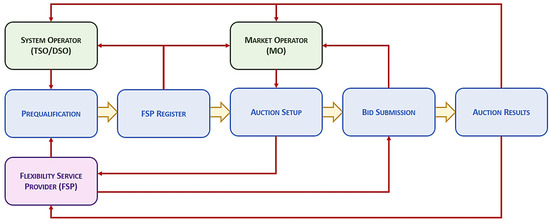
Figure 8.
F-channel platform: Auction flow diagram.
As can be seen, the entire auctioning process can roughly be divided into five sequential steps, out of which the first two take place way before the need for the product. The first step is a precondition for the remainder of the procedure since the provision of the services by the energy entities can only be expected if those entities can provide those services at all. To ensure that, the entities need to go through a prequalification process, after which the entities are added to the unified FSP register. Only the providers verified through the register can take part in the auctions regarding the products for which they went through the prequalification process. Once the register is formed, it can be accessed both by the SOs and by the MO. Based on the information presented in the register, the MO sets up an auction, defining all the necessary parameters, such as, for instance, the date and time of the auction and the products that will be auctioned. After the auction is all set, the bids can be submitted, with the SOs submitting the so-called “buy bids”, defining the service that the system requires, along with all the remaining parameters, such as the necessary amount and the price that they would be willing to pay for that service. On the other hand, the FSPs define the “sell bids”, specifying, in the process, the amount of the service that they would be able to provide in the specified time and the price that they would request for that service. Once all the bids are collected, the auction is launched at the scheduled time, with the outcomes depending on the results of the predefined optimization process. After the completion of the auction, the results are sent to all interested parties and published on the F-channel platform in a publicly available area.
3.2.3. Prequalification Process
As already discussed, the prequalification process, in simplified terms, ensures that the potential flexibility service provider (FSP) can supply the system with the needed resources, based on the appropriate auction. This process is performed for the first time when the provider initially appears in the energy market for the certain product and can be repeated either in regular timeframes or after the specific request of the SOs. The basic flowchart of this process can be found in Figure 9, in which the blue rectangles mark the situations in which the entity (SO or the potential FSP) sends the data to the other entity, and the red rectangles mark the moment in which the data are received by the entity (once again, SO or the potential FSP). Since the dashed line down the middle of this diagram separates the parts of the process that are the responsibility of one entity from the parts that are the responsibility of the other entity, it makes sense that the green arrows crossing this line represent the information exchanges that take place between the two entities within the prequalification procedure.
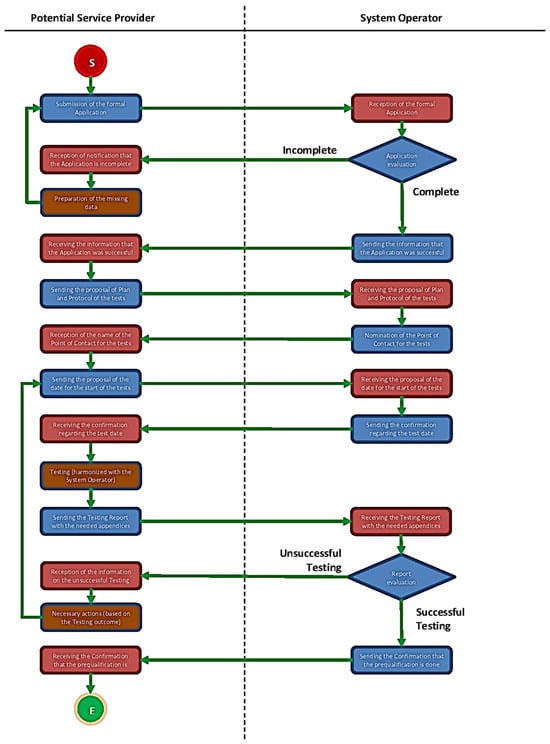
Figure 9.
Prequalification process flowchart.
From this diagram, it is visible that the prequalification process needs to be initiated by the potential FSP, which is expected to submit a formal application for the prequalification process to the relevant SO by providing the necessary data regarding both the provider itself and the resources at their disposal accompanying the application. The completeness of the application is then evaluated by the operator, and the potential provider is informed of the outcome after its evaluation. If the application is missing some data, the potential FSP must provide them before proceeding with the prequalification. The next steps of the procedure include the back-and-forth exchange of information between the SO and the potential FSP, with the FSP, first, suggesting the plan and protocol of the tests that need to be conducted, to which the SO should respond with the nomination of the single point-of-contact in their company. That point-of-contact, from that moment, becomes the primary channel of communication between the potential FSP and the SO, thus ensuring that the prequalification procedure is conducted in a successful manner. Therefore, potential FSPs can propose the date of the start of the testing procedure, with the SO either confirming the proposal or requesting some other date, if the initial proposal is not a viable option. Following the tests needed for the prequalification process, the potential FSP drafts a report on the outcomes of the tests and sends it to the SO, which evaluates it and confirms its truthfulness with the nominated point-of-contact. If the testing was successful, the SO sends the confirmation of the completed prequalification to the FSP and adds it to the unified FSP register. However, if the testing was not successful, then the aspiring FSP needs to implement the appropriate corrections on its side so the tests can be run again. This usually means, if the corrections are not so simple and require some time to be properly performed, that the new date of the tests needs to be harmonized between both sides, after which the testing procedure is restarted. This can be repeated until all the requests of the SO are fulfilled adequately.
What needs to be mentioned here is that, although Figure 9 lays out the basic architecture of the conducted steps within the proposed prequalification process, some of the finer details of these steps may vary depending on the entities that participate in the procedure and the product for which the prequalification process has been initiated in the first place.
3.2.4. Auction Wizard and Bid Submission Wizard
After the FSP successfully completes the prequalification process and the related tests and their addition to the unified FSP register, they are allowed to participate in the auctions organized for responding to the needs spotted in the system. However, those auctions can be quite confusing tasks, especially if there is more than one auction taking place at the same time. Since each of those auctions would probably be either for different timeframes or for different products, it is understandable how this could overwhelm not only the FSPs but the SOs and MOs as well. To make this less tiresome, the F-channel platform’s Coordination module also includes an auction wizard submodule.
In addition, towards simplifying the auction process for the users, the F-channel platform also makes the submission of the bids for those auctions rather easy via the section called “Bid Submission Wizard”. This part of the platform incorporates three consecutive steps, out of which the first is the confirmation of the general information on the user that exists on the platform.
After all participants submit their bids and the window for the submission of bids closes, there is a need to select those bids that will participate in the auction in question. This is commonly performed by conducting the optimization procedure. This procedure must be performed for each of the products that are supported by the platform. The goal of the optimization is to maximize the total welfare of all participants, with the welfare being defined as the difference between the total cost that the SOs would be prepared to pay for the required services and the amount that the FSPs would like to receive for those same services. The optimization needs to take place across all markets and all trade intervals. The objective function for the process could be written as given in Equation (1):
In this expression, the symbols have the following meanings:
- : Price that, by the n-th buy bid, SOs would be willing to pay for the product in interval ;
- : Price that, by the m-th sell bid, FSP would require for the product in interval ;
- : Total accepted amount from the n-th buy bid in interval ;
- : Total accepted amount from the m-th sell bid in interval ;
- M and N: Respectively, total numbers of sell and buy bids in interval ;
- T: Set of all time intervals in the period that the auction envelops;
- : Small constant value (could be, for instance, in the range from 10−6 to 10−5).
Out of these, the total accepted volumes per each bid (buy and sell) would be treated as the decision variables, whereas all other parts of Equation (1) could be seen as the constants that are essential for the optimization to take place. The part of the objective function multiplied by the small constant λ is there to guarantee that the maximum total number of bids is accepted, if the objective function’s value is not harmed by those bids being accepted. The constraints that are considered in this process are given by the set of expressions (2), (3), and (4), as follows:
The first two constraints describe in a mathematical form that the accepted volume of the bid (either buy or sell) cannot exceed the total offered (in case of the sell bids) or requested volume of the specified product (in case of the buy bids). The third and final constraint that is used in the process can be seen as a way of ensuring that the total accepted amount of the product offered by the FSPs is equal to the total accepted amount of that same product required by the SOs. All the constraints shown here must be respected in each of the observed time intervals from the set of intervals of interest. The optimization problem is given in the linear form, making it suitable for solving by using one of the widely accepted optimization techniques based on the linear programming principles.
The only step remaining, once the optimization cycle is completed and the bids that will be accepted are chosen, is forwarding the information regarding the results of the auction to all the interested sides. The results of each of the auctions can be accessed in two ways, with the first of those being the direct message that participants in the auction process will receive via the platform. The second way is by looking into the publicly available areas of the F-channel platform, in which the results of every conducted auction will be published for the sake of the transparency of the energy market.
3.3. Relation between the Modules of the Platform
Before moving on with the ways in which the actions fit into the overall vision of the OneNet project, one additional area of the F-channel platform’s Coordination module needs to be briefly mentioned. It is the one that allows the exchange of the critical information regarding the system, allowing the SOs to predict the potentially harmful states of the grid and react accordingly, without delays caused by the lack of communication between the actors in the power sector. To illustrate the relation between these modules and the way in which they can operate together, the flowchart given in Figure 10 was created.
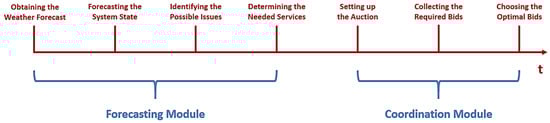
Figure 10.
F-channel platform: Activities of modules.
As can be seen from this diagram, a total of seven main stages were identified for resolving an issue in the grid. Out of these, the first four activities were marked as belonging to the Forecasting module of the F-channel platform. These involve:
- Obtaining the weather forecast.
- Forecasting the system state.
- Identifying the possible issues (by implementing the forecast into the unified grid model).
- Determining the needed services.
If one would now compare these activities with the established scope of operation of this module, they could see that those, indeed, match each other quite well. Three activities were assigned to the Coordination module and include:
- Setting up the auction.
- Collecting the required bids.
- Choosing the optimal bids.
4. Business Use Case Scenario for Testing—Users’ Experience When Using the Platform
To evaluate the effective operation of the proposed platform, a business use case (BUC) scenario for testing was adopted. The BUC associated with the project is the one related to the enhanced active/reactive power management for the coordination between TSOs and DSOs. The weather service provider delivers the high-resolution weather forecast for the area of interest, as can be seen in Figure 11.
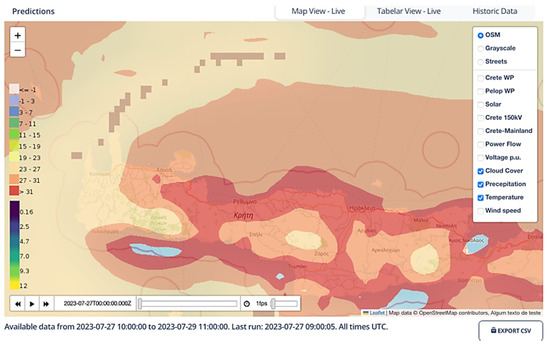
Figure 11.
Georeferenced presentation of load flow results.
Based on the weather forecast, the system operators obtain the forecasts of the selected power system parameters, such as the production of the renewable sources, the demand power, and the transmission capacities of the lines. The unified view for all the RES integrated in the part of the system of interest (for the predefined period of time) is given in Figure 12.
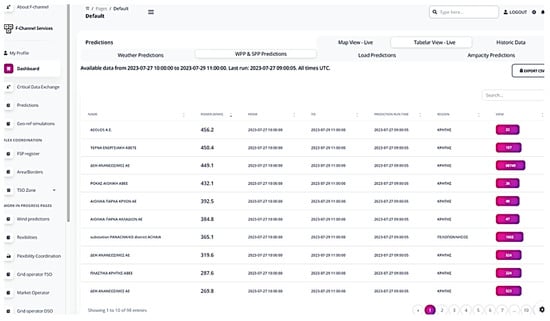
Figure 12.
RES production for the analyzed period.
In addition to this, there is a possibility of extracting the hourly results only for a single RES that is of interest for the user. This can be seen below, in Figure 13.
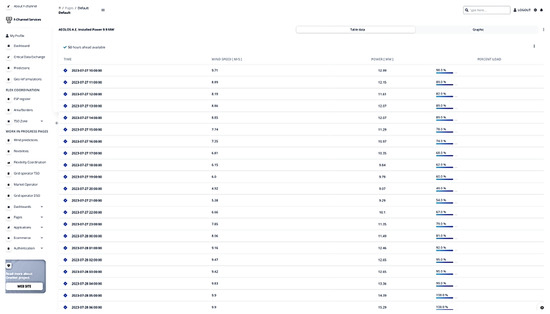
Figure 13.
Single RES production by hour.
The SOs update the unified grid model with these parameters and perform the generation optimization process, with the results of the load flow calculation on the created model indicating that the potential problems in the system could arise if no action is taken. The example of such a model, shown on the georeferenced map of Crete Island, is given in Figure 14. If there is any other region selected by the user for analysis, the map of Crete Island and the grid on that island can be replaced by the chosen region, under the condition that there is enough input data at disposal of the user so that the model can be rearranged properly.
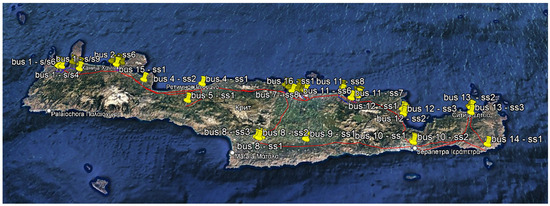
Figure 14.
Georeferenced model of Crete Island.
Depending on the nature of these issues and the services that could help in relieving the situation, there were three scenarios defined within this BUC:
- The one considering the contingencies in the grid, where the high loading or even the overloading of the line is detected; this can easily be spotted since the GUI used for the presentation of the results uses the color coding of the lines to show their loading (Figure 15). Particularly, the red color of line 3 from node 12 indicates that this line’s loading is close to the permitted limit (between 80% and 90% of the maximum allowed transmission capacity); the darker red shade would mean even higher loading.
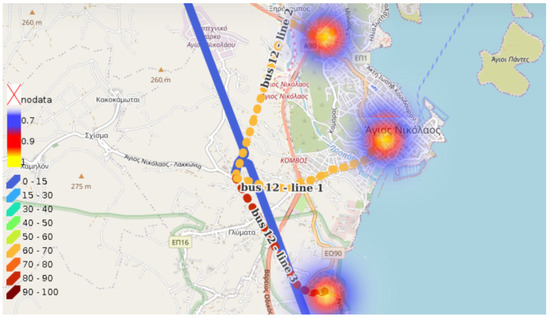 Figure 15. Example of the high loading of the line.
 - The one considering the occurrences of the voltages out of the predetermined boundaries (this could either be warning of too-high voltages or warning of too-low voltages); this can also be seen directly from the georeferenced map, Figure 16, of the system, in which the color of the node in the grid indicates the value of its voltage, in line with the legend shown on the left-hand side of the map.
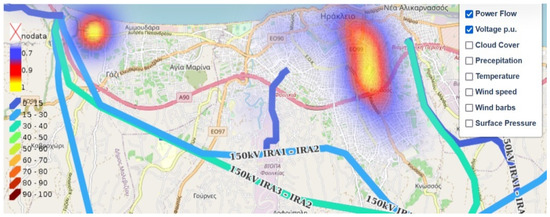 Figure 16. The way of showing the voltages in the map.
Once the problem is identified, the flexibility services that could mitigate it are defined and forwarded to the MO to initiate the process of acquiring the services. The view of the list of defined flexibility resources that can provide the service is given in Figure 17 and Figure 18, in which the FSP register is included. The FSP register is populated only with FSPs that have passed the proposed and implemented prequalification process. This list can easily be extended by adding new flexibility resources, as shown in Figure 19.
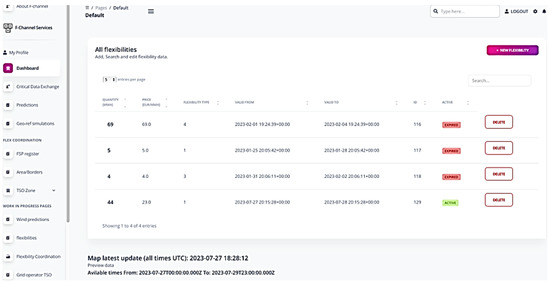
Figure 17.
List of defined flexibility resources.
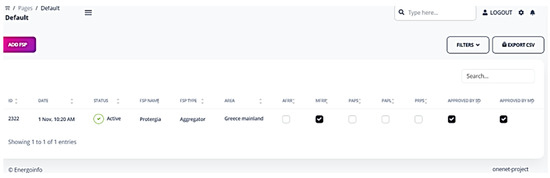
Figure 18.
FSP register.
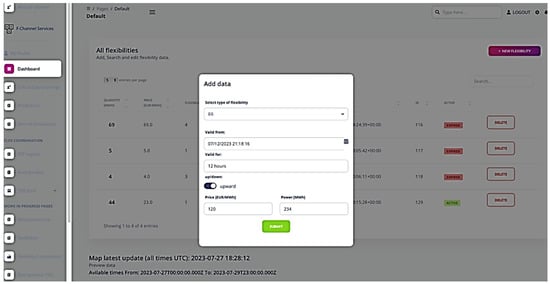
Figure 19.
Addition of a new flexibility resource.
After that, the MO sets up an auction in which the SOs can pick the necessary services, along with the prices that can be paid for those services. This is performed in a quite simple manner, by following the instructions enclosed in the Auction Wizard of the F-channel platform. This wizard, envisaged to be both all-encompassing and user-friendly, is shown in Figure 20.
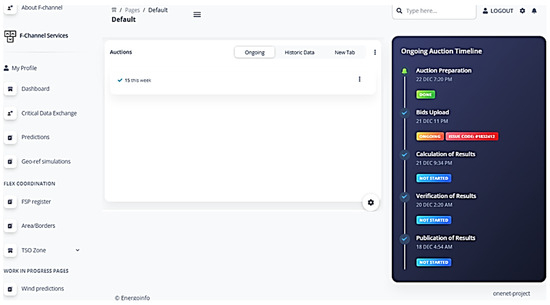
Figure 20.
Auction Wizard sample screenshot.
The FSPs or their aggregators that are prequalified for the selected service obtain the notification of the new auction and submit their bids, if any. The bids are submitted via the Bid Submission Wizard, the screenshot of which is given in Figure 21 and Figure 22.
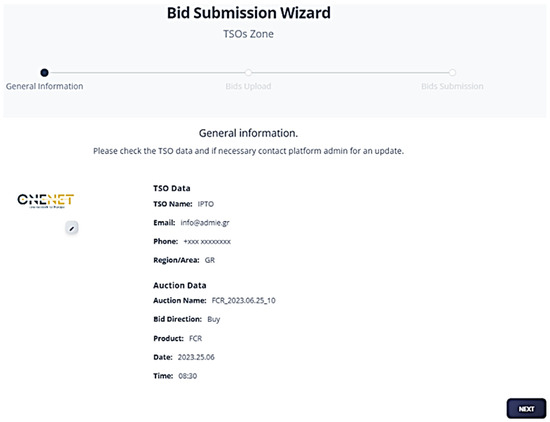
Figure 21.
Bid Submission Wizard sample screenshot, 1st tab.
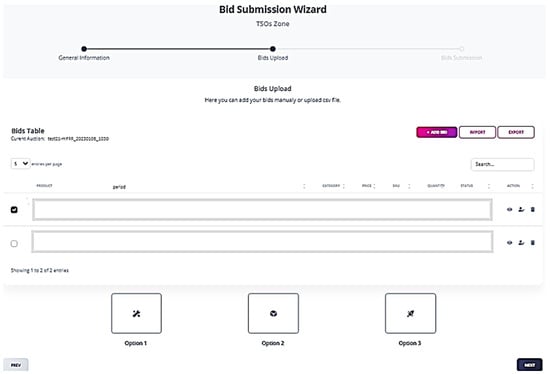
Figure 22.
Bid Submission Wizard sample screenshot, 2nd tab.
Once the bid submission window closes, the optimization algorithm chooses the bids that will be accepted, and the information on the auction’s results gets forwarded to all the participants in the process. These results are also visible to the potential guests (participants in the platform without an assigned role in the market).
As can be concluded, after using the F-channel platform, the experience of the different users can dramatically vary, primarily based on the role that was assigned to them during the creation of their user account. In particular:
- The SOs, alongside their part in the prequalification of the FSPs, participate in the majority of this process, starting from the time in which they receive the weather forecast, all the way to the moment in which they are informed of the results of the auction, during which they take care of numerous other parts of the process, such as, for instance, identification of the potential problems in the grid and the suggestion of needed services.
- The MO participates when it is informed of the need for setting up the new auction for obtaining the appropriate services; thus, it is included halfway into the flow of the process; this operator sets up an auction by using the appropriate tools introduced in the F-channel platform. Its role also ends once the auction ends.
- The responsibilities of the FSPs start even later than the activities of the MO, with their actions following the moment in which the auction is fully set and the window for submitting the corresponding bids is open; once their bids are submitted, the FSPs, same as the other participants, have to wait until the auction results are available to see if their offers are accepted or not.
5. Discussion
The current work focused on the development of the F-channel platform under the OneNet project and the Greek demonstrator, confronting the clean energy era regarding balancing and congestion management. A quite unusual perspective of the weather forecast provider had to be considered, setting limitations regarding parts of the process and expected revenues that could be considered when developing the model. Ιt was rather obvious that the main partnership that the WFPs (weather forecast providers) could establish would be the ones with the TSOs and the DSOs, to which the weather forecasts would be delivered to develop and to test the unified grid simulation models on the appropriate time-horizons. Since the system operators were also identified as the primary customers to which the WFPs could offer their service in the scope of the case, the revenues that were identified in the model are the ones that stem both from contracts that have already been signed between the WFPs and the stated customers and from contracts that would be signed in the future, with the usage of cutting-edge techniques and algorithms guaranteeing the improvement reputation of the weather forecast providers, which would, in turn, give them a head-start over the competition not using these methods yet. Those revenues would be used to compensate the expenses that would need to be made before the application of the innovative solution takes place, such as, for example, the costs of obtaining the necessary hardware and software tools or the expenses made for ensuring sufficient human resources for the procedures of determining and delivering the forecasts running smoothly. These expenses are made on a one-time basis, whereas the streams of income are continual, assuming that the initial investments turning into profit for the WFPs in a relatively short time is not only reasonable but, more than anything else, realistic.
Implementing a project can be difficult when it comes to navigating the regulations and policies in force for new technologies. Therefore, there was an attempt to describe the activities conducted for presenting the current situation on the regulations in Greece, regardless of the time and effort that this task took, since the legal framework has no direct connection to the actions performed during the development of the platform, aside from providing the limitations that had to be considered during the initial steps of this process. Following the implementation of the target model in Greece and the coupling of the Greek IDM with the Bulgarian market, followed by the coupling with the Italian market, the implementation of the MARI [48] and PICASSO [49] platforms and the coupling with non-EU countries will provide even more significant benefits for the Greek market, but as always, several issues occurred for the European power system due to the growing market penetration of RES and the requirement for customer participation [47]. The F-platform will reduce those risks by providing a valuable tool providing flexibility via active system management of the transmission and distribution system. In Greece, the TSO and DSO will use their flexibility resources in an optimum way and coordinate their efforts to meet their regional challenges through grid services derived from prosumers, aggregators, suppliers, and producers, while also optimizing the use of network assets and big data processing tools for the predictability and observability of the network. Prosumers, aggregators, and their many forms of participation in the energy mix and flexibility provision will be included in the F-channel modules.
The results of the investigated BUC scenario in Southern Greece (Peloponnese and Crete) verify to a great extent the effectiveness of the F-channel platform. The significance of the results is further highlighted from the fact that Crete will have a key role in the energy future of Europe, since will be a central node that will interconnect Europe with Cyprus and Israel. Therefore, the presented platform will be extremely useful for confronting a variety of flexibility issues.
6. Conclusions
This article presents the development and implementation of the F-channel platform. The F-channel platform represents a web-based, client server application for TSO–DSO coordination that utilizes high-resolution weather forecasting, as well as artificial intelligence (AI) methods, georeferenced map-based GUI, and cloud calculation engines. The F-channel platform envelopes and implements a set of common functionalities for the SOs regarding improving the forecasting efficiency in various time frames, thus limiting the flexibility needs and identifying and prequalifying the flexibility resources to procure grid services through a ‘market-to-network’ coupling of alternative solutions.
Forecasting engines will use aggregations based on the geographical location of POIs and can be used in terms of including consumers. To be exact, the system of forecasting can be extended to include local consumers’ production capacity. Capacities of local industries/household RES can be modeled, and these data can be used in planning consumer activities. The consumer may engage with the input of their hourly/daily/weekly needs. This approach can be especially useful with local industries with repetitive industry processes that have known constant loads and are not time critical. Future work involves the completion of the Coordination module and its integration within the OneNet eco system and its services.
Author Contributions
Conceptualization, M.Z. (Magda Zafeiropoulou), N.S., M.Z. (Mileta Zarkovic), V.R., A.T., D.M., T.I.M., E.Z. and G.F.; methodology, M.Z. (Magda Zafeiropoulou), N.S., M.Z. (Mileta Zarkovic), V.R., A.T., D.M., T.I.M., E.Z. and G.F.; validation M.Z. (Magda Zafeiropoulou), N.S., M.Z. (Mileta Zarkovic), V.R., A.T., T.I.M., E.Z., V.V. and G.F.; formal analysis, M.Z. (Magda Zafeiropoulou), N.S., M.Z. (Mileta Zarkovic), V.R., A.T., T.I.M., E.Z. and G.F.; writing—original draft preparation, M.Z. (Magda Zafeiropoulou), N.S., M.Z. (Mileta Zarkovic), V.R., A.T., D.M., T.I.M., E.Z. and G.F.; writing—review and editing, M.Z. (Magda Zafeiropoulou), N.S., M.Z. (Mileta Zarkovic), V.R., A.T., D.M., T.I.M., E.Z. and G.F.; and supervision, V.V., T.I.M. and G.F. All authors have read and agreed to the published version of the manuscript.
Funding
This research was funded by the European Union’s Horizon 2020 research and innovation program under grant agreement No. 957739 (ONENET project). The authors acknowledge financial support for the publication of this work from the European Union through the Horizon 2020 research and innovation program under grant agreement No. 957739 (ONENET project).
Institutional Review Board Statement
Not applicable.
Informed Consent Statement
Not applicable.
Data Availability Statement
Not applicable.
Conflicts of Interest
The authors declare no conflict of interest.
Nomenclature
| AI | Artificial intelligence |
| aFRR | Automatic Frequency Restoration Reserve |
| API | Application program interface |
| BUC | Business use case |
| DSO | Distribution system operator |
| EV | Electric vehicle |
| FCR | Frequency containment reserve |
| IDM | Intra-day market |
| FSP | Flexibility service provider |
| GIS | Geographic information system |
| GUI | Graphical user interface |
| IT | Information technology |
| LFC | Load frequency control |
| KER | Key exploitable results |
| MARI | Manually Activated Reserves Initiative |
| mFRR | Manual Frequency Restoration Reserve |
| MO | Market operator |
| OneNet | One Network for Europe |
| PICASSO | Platform for the International Coordination of Automated Frequency Restoration and Stable System Operation |
| PV | Photovoltaic |
| POI | Point of interest |
| RES | Renewable energy sources |
| SO | System operator |
| SPP | Solar power plant |
| SSH | Secure shell |
| TSO | Transmission system operator |
| UI | User interface |
| WFP | Weather forecast provider |
| WPP | Wind power plant |
References
- Launching OneNet: One Network for Europe. Available online: https://onenet-project.eu/launching-onenet-one-network-for-europe/ (accessed on 11 July 2023).
- An Integrated Approach to Active System Management; ENTSO-E, EDSO. 2019. Available online: https://docstore.entsoe.eu/Documents/Publications/Position%20papers%20and%20reports/TSO-DSO_ASM_2019_190416.pdf (accessed on 11 July 2023).
- Framework Programme Horizon 2020. Available online: https://ec.europa.eu/info/research-and-innovation/funding/funding-opportunities/funding-programmes-and-open-calls/horizon-2020_en (accessed on 11 June 2023).
- European Union. Commission Regulation (EU) 2017/1485 Establishing a Guideline on Electricity Transmission System Operation. OJ L 220. 25 August 2017, pp. 1–120. Available online: https://eur-lex.europa.eu/legal-content/EN/TXT/?uri=CELEX%3A32017R1485 (accessed on 21 July 2023).
- European Union. Commission Regulation (EU) 2015/1222 Establishing a Guideline on Capacity Allocation and Congestion Management. OJ L 197. 25 July 2015, pp. 24–72. Available online: https://op.europa.eu/en/publication-detail/-/publication/b91aa370-3293-11e5-9f85-01aa75ed71a1 (accessed on 21 July 2023).
- European Union. Commission Regulation (EU) 2016/1719 of 26 September 2016 Establishing a Guideline on Forward Capacity Allocation. OJ L 259. 27 September 2016, pp. 42–68. Available online: https://eur-lex.europa.eu/legal-content/EN/TXT/PDF/?uri=CELEX:32016R1719&from=SV (accessed on 21 July 2023).
- KU Leuven Energy Institute. EI Fact Sheet: The Current Electricity Market Design in Europe. Available online: https://www.mech.kuleuven.be/en/tme/research/energy_environment/Pdf/ei-factsheet8-eng.pdf (accessed on 21 July 2023).
- European Energy Data Exchange Reference Architecture, BRIDGE, Data Management Working Group April 2021. Available online: https://ec.europa.eu/energy/sites/default/files/documents/bridge_wg_data_management_eu_reference_architcture_report_2020-2021.pdf (accessed on 23 July 2023).
- Fotis, G.; Dikeakos, C.; Zafeiropoulos, E.; Pappas, S.; Vita, V. Scalability and Replicability for Smart Grid Innovation Projects and the Improvement of Renewable Energy Sources Exploitation: The FLEXITRANSTORE Case. Energies 2022, 15, 4519. [Google Scholar] [CrossRef]
- Ioannidis, F.; Kosmidou, K.; Andriosopoulos, K.; Everkiadi, A. Assessment of the Target Model Implementation in the Wholesale Electricity Market of Greece. Energies 2021, 14, 6397. [Google Scholar] [CrossRef]
- Kambouris, Y. The Balancing Market. Proceedings of RAE Conference on Target Model, Athens. 2018. Available online: http://oldsite.rae.gr/site/file/system/docs/various/anartiseis/2207_1;jsessionid=0ac113f330d974196418896d4310bdedd1f4afc92bd9.e34Lah0LbNqMe38Na\xqLch0Lci1ynknvrkLOlQzNp65In0 (accessed on 27 February 2023).
- IPTO. System Balancing. 2020. Available online: https://www.admie.gr/en/market/general/balancing-market (accessed on 11 July 2023).
- Ocker, F.; Ehrhart, K.-M. The German Paradox in the Balancing Power Markets. Renew. Sustain. Energy Rev. 2017, 67, 892–898. [Google Scholar] [CrossRef]
- EU Monitor. Explanatory Memorandum to COM (2016) 861—Internal Market for Electricity. 2016. Available online: https://www.eumonitor.eu/9353000/1/j4nvhdfdk3hydzq_j9vvik7m1c3gyxp/vk9njvls0xzt (accessed on 11 July 2023).
- Blohm, A.; Crawford, J.; Gabriel, S.A. Demand Response as a Real-Time, Physical Hedge for Retail Electricity Providers: The Electric Reliability Council of Texas Market Case Study. Energies 2021, 14, 808. [Google Scholar] [CrossRef]
- Liu, H.; Chen, X.; Xie, J. Optimal Bidding Strategy for Electricity Sales Company Considering Contract for Difference and Risk. In Proceedings of the 2019 IEEE 3rd Conference on Energy Internet and Energy System Integration (EI2), Changsha, China, 8–10 November 2019; pp. 2155–2160. [Google Scholar]
- Londoño, A.A.; Velásquez, J.D. Risk Management in Electricity Markets: Dominant Topics and Research Trends. Risks 2023, 11, 116. [Google Scholar] [CrossRef]
- Fotis, G.; Vita, V.; Maris, T.I. Risks in the European Transmission System and a Novel Restoration Strategy for a Power System after a Major Blackout. Appl. Sci. 2023, 13, 83. [Google Scholar] [CrossRef]
- Vita, V.; Fotis, G.; Pavlatos, C.; Mladenov, V. A New Restoration Strategy in Microgrids after a Blackout with Priority in Critical Loads. Sustainability 2023, 15, 1974. [Google Scholar] [CrossRef]
- Haes Alhelou, H.; Hamedani-Golshan, M.E.; Njenda, T.C.; Siano, P. A Survey on Power System Blackout and Cascading Events: Research Motivations and Challenges. Energies 2019, 12, 682. [Google Scholar] [CrossRef]
- Narajewski, M. Probabilistic Forecasting of German Electricity Imbalance Prices. Energies 2022, 15, 4976. [Google Scholar] [CrossRef]
- IPTO. Balancing Market Rulebook. 2020. Available online: https://www.admie.gr/en/market/regulatory-framework/balancing-market-rule-book (accessed on 11 July 2023).
- The Cyber Physical System for the Energy Transition: Digitalization Challenges, Opportunities and Projects from TSOs and ENTSO-E. Available online: https://eepublicdownloads.entsoe.eu/clean-documents/Publications/Position%20papers%20and%20reports/digital_report_2019.pdf (accessed on 11 July 2023).
- Fotis, G.; Pavlatos, C.; Vita, V. Power system control centers and their role in the restoration process after a major blackout. WSEAS Trans. Power Syst. 2023, 18, 57–70. [Google Scholar] [CrossRef]
- The COLLECTiEF Project. Available online: https://collectief-project.eu/ (accessed on 11 September 2023).
- The EUniversal Project: Linking Active System Management to Flexibility Markets. Available online: https://euniversal.eu/# (accessed on 11 September 2023).
- FEVER: Flexible Energy Production, Demand and Storage-Based Virtual Power Plants for Electricity Markets and Resilient DSO Operation. Available online: https://fever-h2020.eu/ (accessed on 11 September 2023).
- The FLEXGRID Project. Available online: https://flexgrid-project.eu/ (accessed on 11 September 2023).
- Vita, V.; Christodoulou, C.A.; Zafeiropoulos, Ε.; Mladenov, V.; Chobanov, V.; Asprou, M.; Kyriakides, E. Flexibility adequacy assessment in the SEE region with new technology integration. WSEAS Trans. Power Syst. 2022, 17, 76–83. [Google Scholar] [CrossRef]
- Vita, V.; Christodoulou, C.; Zafeiropoulos, I.; Gonos, I.; Asprou, M.; Kyriakides, E. Evaluating the Flexibility Benefits of Smart Grid Innovations in Transmission Networks. Appl. Sci. 2021, 11, 10692. [Google Scholar] [CrossRef]
- Mladenov, V.; Chobanov, V.; Seritan, G.C.; Porumb, R.F.; Enache, B.-A.; Vita, V.; Stănculescu, M.; Vu Van, T.; Bargiotas, D. A Flexibility Market Platform for Electricity System Operators Using Blockchain Technology. Energies 2022, 15, 539. [Google Scholar] [CrossRef]
- Sijakovic, N.; Terzic, A.; Fotis, G.; Mentis, I.; Zafeiropoulou, M.; Maris, T.I.; Zoulias, E.; Elias, C.; Ristic, V.; Vita, V. Active System Management Approach for Flexibility Services to the Greek Transmission and Distribution System. Energies 2022, 15, 6134. [Google Scholar] [CrossRef]
- Zafeiropoulou, M.; Mentis, I.; Sijakovic, N.; Terzic, A.; Fotis, G.; Maris, T.I.; Vita, V.; Zoulias, E.; Ristic, V.; Ekonomou, L. Forecasting Transmission and Distribution System Flexibility Needs for Severe Weather Condition Resilience and Outage Management. Appl. Sci. 2022, 12, 7334. [Google Scholar] [CrossRef]
- Dewitte, S.; Cornelis, J.P.; Müller, R.; Munteanu, A. Artificial Intelligence Revolutionizes Weather Forecast, Climate Monitoring and Decadal Prediction. Remote Sens. 2021, 13, 3209. [Google Scholar] [CrossRef]
- Stamatellos, G.; Stamatelos, T. Short-Term Load Forecasting of the Greek Electricity System. Appl. Sci. 2023, 13, 2719. [Google Scholar] [CrossRef]
- Ahmad, N.; Ghadi, Y.; Adnan, M.; Ali, M. Load Forecasting Techniques for Power System: Research Challenges and Survey. IEEE Access 2022, 10, 71054–71090. [Google Scholar] [CrossRef]
- Pavićević, M.; Popović, T. Forecasting Day-Ahead Electricity Metrics with Artificial Neural Networks. Sensors 2022, 22, 1051. [Google Scholar] [CrossRef]
- Pavlatos, C.; Makris, E.; Fotis, G.; Vita, V.; Mladenov, V. Utilization of Artificial Neural Networks for Precise Electrical Load Prediction. Technologies 2023, 11, 70. [Google Scholar] [CrossRef]
- Salman, U.T.; Shafiq, S.; Al-Ismail, F.S.; Khalid, M. A Review of Improvements in Power System Flexibility: Implementation, Operation and Economics. Electronics 2022, 11, 581. [Google Scholar] [CrossRef]
- Hadi, M.B.; Moeini-Aghtaie, M.; Khoshjahan, M.; Dehghanian, P. A Comprehensive Review on Power System Flexibility: Concept, Services, and Products. IEEE Access 2022, 10, 99257–99267. [Google Scholar] [CrossRef]
- Akrami, A.; Doostizadeh, M.; Aminafar, F. Power system flexibility: An overview of emergence to evolution. J. Mod. Power Syst. Clean Energy 2019, 7, 987–1007. [Google Scholar] [CrossRef]
- Ndlela, N.W.; Davidson, I.E. Network Coordination between High-Voltage DC and High-Voltage AC Transmission Systems Using Flexible AC Transmission System Controllers. Energies 2022, 15, 7402. [Google Scholar] [CrossRef]
- Natale, N.; Pilo, F.; Pisano, G.; Soma, G.G. Quantitative Assessment of Flexibility at the TSO/DSO Interface Subject to the Distribution Grid Limitations. Appl. Sci. 2022, 12, 1858. [Google Scholar] [CrossRef]
- Christodoulou, C.A.; Ekonomou, L.; Fotis, G.; Harkiolakis, N.; Stathopulos, I.A. Optimization of Hellenic overhead high voltage transmission lines lightning protection. Energy J. 2009, 34, 502–509. [Google Scholar] [CrossRef]
- Zhang, T.; Grest, M.; Rabah, S.; Zacharewicz, G.; Benaben, F.; Lauras, M. Simulation-based Assessment of Hyperconnected Humanitarian Supply Chains Response Readiness. In Proceedings of the 56th Hawaii International Conference on System Sciences, HICSS, Hilton Waikoloa Village, HI, USA, 3–6 January 2018. [Google Scholar]
- ENTSO-E Automatic Frequency Restoration Reserve Process Implementation Guide: Implementation Guide Version 1.1. Available online: https://eepublicdownloads.entsoe.eu/clean-documents/EDI/Library/ERRP/Automatic_Frequency_Restoration_Reserve_Process_v1.1.pdf (accessed on 11 July 2023).
- Roumkos, C.; Biskas, P.N.; Marneris, I. Manual Frequency Restoration Reserve Activation Clearing Model. Energies 2021, 14, 5793. [Google Scholar] [CrossRef]
- ENTSO-E. MARI Platform. 2021. Available online: https://www.entsoe.eu/network_codes/eb/mari/ (accessed on 7 July 2023).
- ENTSO-E. PICASSO Platform. 2021. Available online: https://www.entsoe.eu/network_codes/eb/picasso/ (accessed on 7 July 2023).
Disclaimer/Publisher’s Note: The statements, opinions and data contained in all publications are solely those of the individual author(s) and contributor(s) and not of MDPI and/or the editor(s). MDPI and/or the editor(s) disclaim responsibility for any injury to people or property resulting from any ideas, methods, instructions or products referred to in the content. |
© 2023 by the authors. Licensee MDPI, Basel, Switzerland. This article is an open access article distributed under the terms and conditions of the Creative Commons Attribution (CC BY) license (https://creativecommons.org/licenses/by/4.0/).