Article

Multi-Level Site Selection of Mobile Emergency Logistics Considering Safety Stocks

School of Economics and Management, Xi’an University of Technology, Xi’an 710048, China
*
Author to whom correspondence should be addressed.
Appl. Sci. 2023, 13(20), 11245; https://doi.org/10.3390/app132011245
Submission received: 30 August 2023 / Revised: 4 October 2023 / Accepted: 10 October 2023 / Published: 13 October 2023

Abstract

:
With the increasing frequency of emergencies in recent years, the emergency response capacity of the emergency management system needs to be improved. Based on safety stock strategy, this paper proposes a multilevel siting model on the topic of mobile emergency response. We modeled the emergency response needs during emergencies by incorporating the population distribution of each region. The uncertainty of emergencies is modeled by aggregating the frequency of crises in each region over the past 20 years. The site selection model minimizes contingency logistics costs that include transshipment, deployment, inventory, and safety stock costs. In this paper, the IA (Immune Algorithm) is optimized to solve the constructed emergency site selection model. The experiments on the model were carried out with data from the area of Chongqing, Sichuan Province. The number of logistics centers and distribution storage warehouses was tested. The influence of safety stock strategy on the total cost of emergency logistics was analyzed. The research results found that the cost of safety stock is negatively related to the cost of transshipment. In addition, the total cost of emergency logistics has a lower bound. Adding distribution and storage warehouses does not further reduce the total emergency logistics cost.

1. Introduction

With globalization and technological advances, the frequency and impact of emergencies are increasing. For example, the New Crown epidemic in 2020, the Australian Hill fires in 2021, the Texas blackout in 2020, and the Indonesian earthquake in 2019 caused shortages or difficulties in shipping supplies. Emergency logistics systems that can respond quickly depend on large safety stocks. Large safety stocks can significantly raise the total cost of emergency logistics. Safety stock is the number of supplies increased to cope with uncertainty, which directly affects the reliability and speed of emergency response. Therefore, setting safety stock is an important consideration in the optimization problem of mobile emergency logistics.
For the multi-stage site selection problem of emergency logistics, based on the uncertainty and ambiguity of disaster relief information, Zhu [1] proposed a cooperative optimization model with a comprehensive evaluation framework as the supplier of emergency materials. A multi-attribute grouping decision ranking method is used to select the best emergency material suppliers. Multi-objective fuzzy optimization was carried out in three emergency response phases: pre-disaster, disaster, and post-disaster. Increased demand uncertainty sometimes leads to lower levels of safety stock and increases total storage costs. In order to limit the excess risk, Zhang [2] proposed relying more on capital stock to reduce the reliance on safety stock. Based on a continuous nonlinear formulation that integrates location, allocation and inventory decisions, Puga [3] proposed a location-inventory siting model for large supply chains with uncertain demand. That model includes transportation cost, cycle stock, safety stock, ordering and facility activation. According to the problem of preference uncertainty in the decision-making process, Liu [4] presents a Group Decision-Making (GDM) method with Interval Linguistic Fuzzy Preference Relationship (ILFPR). To verify the applicability and credibility of the proposed method, the article is validated with case studies. In response to the problem of high uncertainty in the evolutionary direction of emergencies, Fei [5] offered a hybrid decision-making approach that takes into account intuitionistic fuzzy environments, linguistic environments, and their hybrid environments. The article verifies the effectiveness of the proposed model in the case of flooding in China. Wu [6] solved the rescue path selection problem in the uncertain environment of vehicular traffic accidents by minimizing the vehicle travel time of nodes and road sections. The risk coefficient of the rescue path is calculated based on the elastic time window, and decision support is provided for the path selection of emergency rescue. To solve the emergency demand uncertainty problem, Ge [7] introduced a two-stage model. The model is used to calculate the problem of the siting and material distribution of emergency logistics centers in the region. The NSGA-II algorithmic site selection model is combined to solve the problem. In order to solve the emergency rescue problem for driver-passenger hijacking incidents, Luo [8] proposed a multi-vehicle mutual rescue (MMR) model for cab platforms. The Pareto evolutionary algorithm (SPEA II), Frank-Wolfe algorithm, and two-stage coding method are applied to solve the NP-hard problem of the MMR model. The MMR model is examined using road information and O-D traffic, and the utility of the hybrid algorithm and the MMR model is analyzed. In response to the problem of uncertain production disruptions affecting the supply chain during emergencies, Zhu [9] investigated a new recovery strategy. This strategy utilizes investments to adjust the speed and duration of capacity recovery. A two-stage stochastic programming model (RTSPM) that simulates the recovery behavior in response to different disruptions to avoid risks is proposed. To justify the efficiency of the method, the article proposed a trust-region-based decomposition method to solve the RTSPM. To respond to the emergency relief problem of uncertainty in the last-mile delivery time, Zhang [10] proposed an opportunity constraint model. This model considers emergency fair siting as emergency logistics centers (ELCs). For the contingency decision-making problem with uncertain information, Li [11] proposed a novel consensus model to manage the non-cooperative behavior of experts in large-scale group decision-making problems. This model introduces a group consistency index that considers both the fuzzy preference value and the degree of cooperation to detect the non-cooperative behavior of experts. Among the studies related to safety stock, de Kok [12] proposed a typology of multilevel inventory management.
Extensive research on multilevel inventory management under uncertain demand is categorized and reviewed. Maximizing the total cost of network population coverage and minimizing the risk of network management, Hasani [13] proposed a humanitarian-based approach to the stockpile grouping problem. This model optimizes the number of inventory groups and service levels, the distribution of relief supplies, the location of relief facilities, and the distribution of relief services. Based on blood expiration, shortage and capacity, Ma [14] developed a dynamic emergency blood collection model. It was found that the safety stock, target stock level and emergency blood demand estimation could be moderately increased. This allows for emergency blood stock control parameters. To minimize the expected total cost per unit of time, Bono [15] proposed an inventory strategy. By considering energy costs, the article calculated the optimal size of order quantity, safety stock and inventory cycle length. In order to design dynamic multi-commodity SSC networks to compute contingency safety stocks and shared safety stocks, Zadeh [16] proposed a mixed integer nonlinear programming (MINLP) model and mixed integer linear programming (MILP) model. To demonstrate the stochastic humanitarian inventory control model, Ozguven [17] validated the minimum safety stock level for contingency inventory through a case study. Paterson [18] presented two methods of centralizing inventory. Passive transshipment transfers inventory elsewhere in the network to cope with shortages at one location. Active inventory redistribution is carried out to minimize the possibility of future shortages. Aiming at the uncertainty of the actual demand at the demand point and the vehicle transportation time, Huali Sun [19] investigated a robust optimization model for the location path of emergency facilities. The article minimizes the sum of rescue time for material delivery to the demand point.
To summarize, existing research on emergency logistics siting problems mainly focuses on emergency uncertainty, safety stock strategy, and carrying out siting problems in different contexts. This paper addresses the multilevel siting problem of mobile emergency logistics, considering safety stock under contingency. To solve the problems of frequent demand for emergencies and high emergency demand uncertainty, we calculate the emergency demand through statistical population distribution and propose a multilevel siting model for mobile emergency logistics, considering safety stock. The mobile emergency logistics system consists of logistics centers, distribution storage warehouses, and emergency distribution facilities at three levels. The logistics center can process national-level logistics, demand information and ensure that emergency supplies reach the disaster area as soon as possible based on diversified transportation modes. As the relay station of the mobile emergency logistics system, distribution storage warehouses are responsible for the temporary storage and secondary distribution of emergency supplies. The emergency distribution facility is the final link of the mobile emergency logistics and is responsible for delivering emergency supplies to the affected population. Therefore, a three-level architecture is used to construct the multi-level siting model of mobile emergency logistics. Minimize the cost of emergency logistics storage and transit under emergencies. Finally, the optimized immuno-optimization algorithm is used to solve the problem. We verify the effectiveness of the mobile emergency multilevel siting model by comparing and analyzing the traditional deployment scheme and heuristic deployment. Finally, appropriate management decision suggestions are given for the characteristics of emergencies in different scenarios.

2. Model Construction

2.1. Problem Description

Emergencies involve many people and cover a wide range; emergency needs are urgent, easy to spread, and must be coordinated in response to all regions. In the multilevel location of mobile emergency logistics, the security inventory strategy directly affects emergency logistics’ inventory and transfer costs. Uneven resource allocation, unclear material transshipment strategies, and insufficient material stockpiles exist in the emergency material distribution process. Consider safety stock strategies for emergency site selection to minimize emergency logistics deployment, storage, and transit costs.
Multi-level location selection for mobile emergency logistics is influenced by many variables. Such as demand, fixed costs of location selection, safety stock costs and trans-shipment costs. Mobile emergency logistics includes a logistics center, a distribution warehouse, and mobile emergency facilities.
The logistics center is responsible for transporting emergency materials to the distribution warehouse. The distribution warehouse is responsible for distributing emergency materials to the mobile emergency facilities, and the distribution warehouses can transfer between each other. Mobile emergency facilities can cover emergency needs in a particular region, as shown in Figure 1.
Compared with traditional emergency logistics, mobile emergency can effectively reduce the storage and transportation costs of emergency logistics. The security inventory strategy can ensure the rapid deployment and distribution of emergency materials. In mobile emergency logistics, emergency materials must be deployed and distributed according to actual needs to provide sufficient materials to reach the emergency area on time. To realize rapid deployment and distribution, it is necessary to set up several logistics’ centers, distribution silos, and mobile emergency facilities in mobile emergency logistics and disperse emergency materials to each logistics center and distribution silos. A reasonable mathematical model must describe its structure and characteristics to solve mobile emergency logistics’ multilevel location-allocation problem. According to the features of the multilevel location problem of mobile emergency logistics, its variable description is shown in Table 1, and the following hypothesis is proposed:
Assumption 1.
There is no capacity limit for the logistics center and distribution warehouse.
Assumption 2.
There are average inventory costs and safety inventory costs in the logistics center and distribution warehouse.
Assumption 3.
The emergency demand in the area covered by mobile emergency facilities is usually distributed ( μ i , σ i )

2.2. Mobile Emergency Logistics Multilevel Site Selection Model

Based on the population distribution, road traffic and administrative boundaries of the coverage area, the site selection model selects the number and location of logistics’ centers and warehouses. In order to solve the multilevel siting model for mobile emergency logistics, the improved immuno-optimization algorithm (IIA) has strong global search capability, adaptability and robustness. Compared with other models, the mobile emergency logistics model allows the distribution warehouses to transfer to each other. To minimize the total cost of emergency logistics, a multilevel siting model of mobile emergency logistics is constructed for emergency events:
min F = k K F k a k + j J ( f j x j + j I k K l ^ j k x j k + i I j J d ^ i j μ i ) + S + T
S = α h 1 j J σ j L j + α h 2 k K P k ( L j σ j 2 )
T = ( α j J σ j L j α j J L j σ j 2 ) i , j K d i j / n
l ^ j k = d j k μ i y i j
d ^ i j = d i j μ i
μ j = i μ i , σ j = i σ i 2
j J x j k q , x j = { 0 , 1 } , k K
j J i I d i j ( D i r + d j c ) , j J , i I
The objective Function (1) represents the minimization of the location cost of mobile emergency logistics. The total cost includes the fixed costs of logistics centers and distribution warehouses, transportation costs at all levels, and safety stock costs. Constraint (2) indicates that the safety stock cost consists of the logistics center safety stock cost and the distribution warehouse safety stock cost. Constraint (3) suggests that the retransfer transportation cost equals the average distance between the distribution bins multiplied by the safety stock difference between the distribution bins. Constraint (4) indicates that the transportation cost between the logistics center and the distribution warehouse is related to the transportation volume and price. Constraint (5) indicates the relationship between transportation cost and demand volume. Constraint (6) shows that the emergency demand expectation obeys a normal distribution. Constraint (7) indicates that, at most, one facility is in the set of candidate sites for the distribution warehouse. Constraint (8) is used to constrain the maximum coverage of the distribution area of the distribution warehouse.

3. Solution Algorithms

3.1. Algorithm Flow

To find the optimal or near-optimal solution to the problem, IIA simulates the mechanisms of recognition, selection, mutation, and memory between antibodies and antigens. The three-level mobile emergency logistics site selection model is computationally large, and many influencing factors do not guarantee an optimal solution. Considering the influence of multiple structured factors according to the solution problem is often necessary in practical situations, so a heuristic algorithm is used. To prevent falling into local optimal solutions and improve the algorithm’s convergence speed and search efficiency, the elite strategy is used to enhance the retention of some of the best individuals. Elite selection is to rank the individuals according to their adaptation values, select the best ones as privileged individuals, and store these privileged individuals in the memory. The steps of the immune optimization algorithm are shown in Figure 2:
Step 1: Antigen identification, fitness function construction, and constraints formulation. Step 2: Initialize the antibody population. Generate antibodies randomly based on the number of demand points in the burst. The antibodies are extracted from memory to form the initial antibody population. If the initial memory is empty, the initial antibodies are generated randomly. Step 3: Calculate fitness values. Evaluate the fitness values of viable solutions in the population. Store the best antibody in the population in memory based on the ranking. Step 4: Select to judge and determine if the loop has reached the preset number of iterations. If it reaches its end, otherwise go to the next step. Step 5: Avoid falling into local optimal solutions and obtain global optimal solution. Calculation Step 6: Immunization operation—immunize the antibody population, i.e., selection, crossover, and mutation, according to the results of Step 3. The roulette mechanism performs selection [20,21] using the expected reproduction probability obtained from (10) as the individual selection probability. The crossover was operated by the single-point crossover method. The mutation zone is served by randomly selecting mutation sites. Step 7 is to perform population renewal. Replace antibodies in the population with randomly generated new antibodies that have a lower expected probability of reproduction. A new generation of antibodies is formed and proceeds to step 3.

3.2. Diversity Evaluation

The adaptation value of the antibody to the antigen is denoted as A v , i.e., the degree of recognition of the antigen’s objective function to the antibody, which is the emergency logistics cost used to indicate the excellence of the solution under the coverage constraint. According to the mobile emergency logistics siting model for distribution warehouse siting, the design affinity Function (8) is shown in Figure 2. The first term denotes the distance cost. The second term denotes the inventory cost. The third term denotes the safety stock cost approximation.
A v = 1 F v , F v = d i j μ i + λ h j J μ j + γ α h L σ j
To ensure the diversity of the antibody population, the affinity between the antibodies is expressed. The similarity of each scheme indicates the length of the antibody, i.e., the number of loci. The number of places where the antibody is identical to the antibody, i.e., the overlapping regions in the two site selection schemes, T is a preset threshold. The R-bit sequential method is adopted to determine the similarity between the antibodies, which is a partial matching rule to prevent falling into the local optimal solution. We can avoid the local optimal solution by determining whether the answers are similar and excluding similar solutions.
S v , s = 1 , k v , s L T ; 0 , e l s e
The antibody concentration is the proportion of similar antibodies in the antibody population, i.e., the proportion of similar solutions among all site selection solutions. It is the total number of antibodies, i.e., the number of all site selection solutions. The more significant antibody concentration represents the higher similarity of the two solutions. Combining the elite strategy with minus can preserve the global optimal solution to a certain extent and prevent the optimal solution from being too similar and falling into the local optimum.
C v = 1 N j M i S v , s
The antibody-antigen affinity and antibody concentration determine the expected reproduction probability of an individual in a population C v . It is a constant. Then, the individual antigen affinity is positively correlated with the predicted reproduction probability P ; antibody concentration is negatively correlated with the expected reproduction probability P . This promotes an excellent level of emergency logistics for high antigen affinity antibodies, i.e., site-selection schemes, and suppresses individuals with high antibody concentrations C v , i.e., site-selection schemes with too much similarity, thus ensuring the diversity of individual populations. The remaining individuals were stored and ranked according to the expected reproduction probability P . Those with higher adaptation values were more likely to produce offspring among the ranked individuals.
P = β A v A v ( 1 β ) C v C v

4. Analysis of Examples

4.1. Description of the Example

A total of 148 alternative points were selected for mobile emergency logistics multilevel site selection in the Chongqing-Sichuan region. The center of mass of each administrative county and district is regarded as an alternative point in the region. The population distribution of each county and district is used to determine the demand for each alternative point. The fixed site selection cost is divided by 10 for the average house price in Sichuan and Chongqing. The normalization of alternative site coordinates and population distribution is shown in Figure 3. The population distribution data for Chongqing and Sichuan were obtained from the seventh population census. Population density distribution data is obtained from the World Pop Hub. The coordinates of the demand points are obtained by calling the Gaode map to find the center of mass of the region through the Data Map. The fixed cost of the alternative point location is equal to that shown in the parameter setting in Table 2. The alternative sites in Sichuan and Chongqing are summarized in Table 3.

4.2. Algorithm Analysis

The algorithm was programmed and experimented with using MATLAB2020B. The experimental computer environment was an Intel 11th Gen Core [email protected] quad-core with 16 G of RAM. Sensitivity analysis of IIA was performed, and it was found that the population size affects the search range of the algorithm.
Theoretically, increasing the number of iterations increases the likelihood that the algorithm will find a globally optimal solution. In our experiments, we took 50 times, that is 300 times, as the maximum number of iterations after the solution results were stabilized and there were no more changes. The crossover probability and variance probability are used to balance the local optimal solution and the global optimal solution, so the crossover probability is taken as 0.5 for stabilizing the speed and aggregation of the search process. The variance probability is taken as 0.4 to increase the population’s diversity and not make the search process too scattered and difficult to converge. The diversity evaluation parameter prevents the solutions from being too similar and falling into local optimal solutions, and 0.95 can effectively ensure the diversity of the solution results. The population size of 200 is determined mainly based on the number of candidate points. This not only helps to improve the search space of the algorithm but also ensures its performance while considering computational efficiency. The memory capacity is the maximum capacity to store the optimal solution. It is taken as 40 in order to guide the algorithm in the search process. It prevents the algorithm from falling into a local optimal solution, but it is not too large to affect the computational efficiency.
In order to test the potential solution space, a sensitivity analysis was performed on population size. Solutions were performed for population sizes of 50, 100, 150, 200 and 250 without changing other parameter settings. To address the effect of population size on the value of the objective function, an improved immuno-optimization algorithm was tested. The results show that the population size affects the initial solution level directly, and the larger the population size, the better the initial performance. As the number of iterations increases, population size is negatively correlated with affinity. The larger the population, the more stable the convergence is. However, the number of iterations required to stabilize the relationship increases. After many iterations, the population size does not have much effect on the affinity value. This is because both the maximum and minimum population size curves eventually converge to a closer affinity value. Therefore, it is reasonable to set the population size to 200, as shown in Figure 4, with Xlabel representing the number of iterations.
The unimproved immune optimization algorithm (IA) and the improved immune optimization algorithm (IIA) were selected for performance comparison. The parameter settings of the enhanced algorithm are shown in Table 4. The solution comparison with the Genetic Algorithm (GA) and Particle Swarm Algorithm (PSO) using both algorithms according to the same parameters, respectively, is shown in Figure 5. To verify the effectiveness of the improved immune optimization algorithm, its adaptation values were compared with those of the other three basic intelligent optimization algorithms.
From Figure 6, we can see that the adaptation value of IIA is higher than that of IA, GA, and PSO algorithms in the early iteration. As the number of iterations increases, the local search ability and global search ability of the IIA algorithm are further enhanced. The adaptation value of IIA algorithm is better than that of the PSO and IA algorithms. PSO and IA are more stable throughout the iterations, and the final search result is slightly better than GA’s. Still, PSO tends to fall into the local optimum at the beginning of the iteration. In addition, the GA optimum is more stable at the beginning of the algebraic iteration. Still, with the increase in iterations, the GA falls into the local optimum solution, while the IIA solves this problem. It jumps out of the local optimum, enhances the local search ability, and improves the data quality of IA.
IIA outperforms most classical intelligent algorithms by combining adaptation value and stability. It effectively reduces the cost of emergency logistics, has a robust global search capability, and is not easily trapped in the local optimum. Therefore, the IIA solver obtains the siting result of the siting model. The solution can provide a certain reference for the actual emergency logistics site selection planning.

4.3. Result Analysis

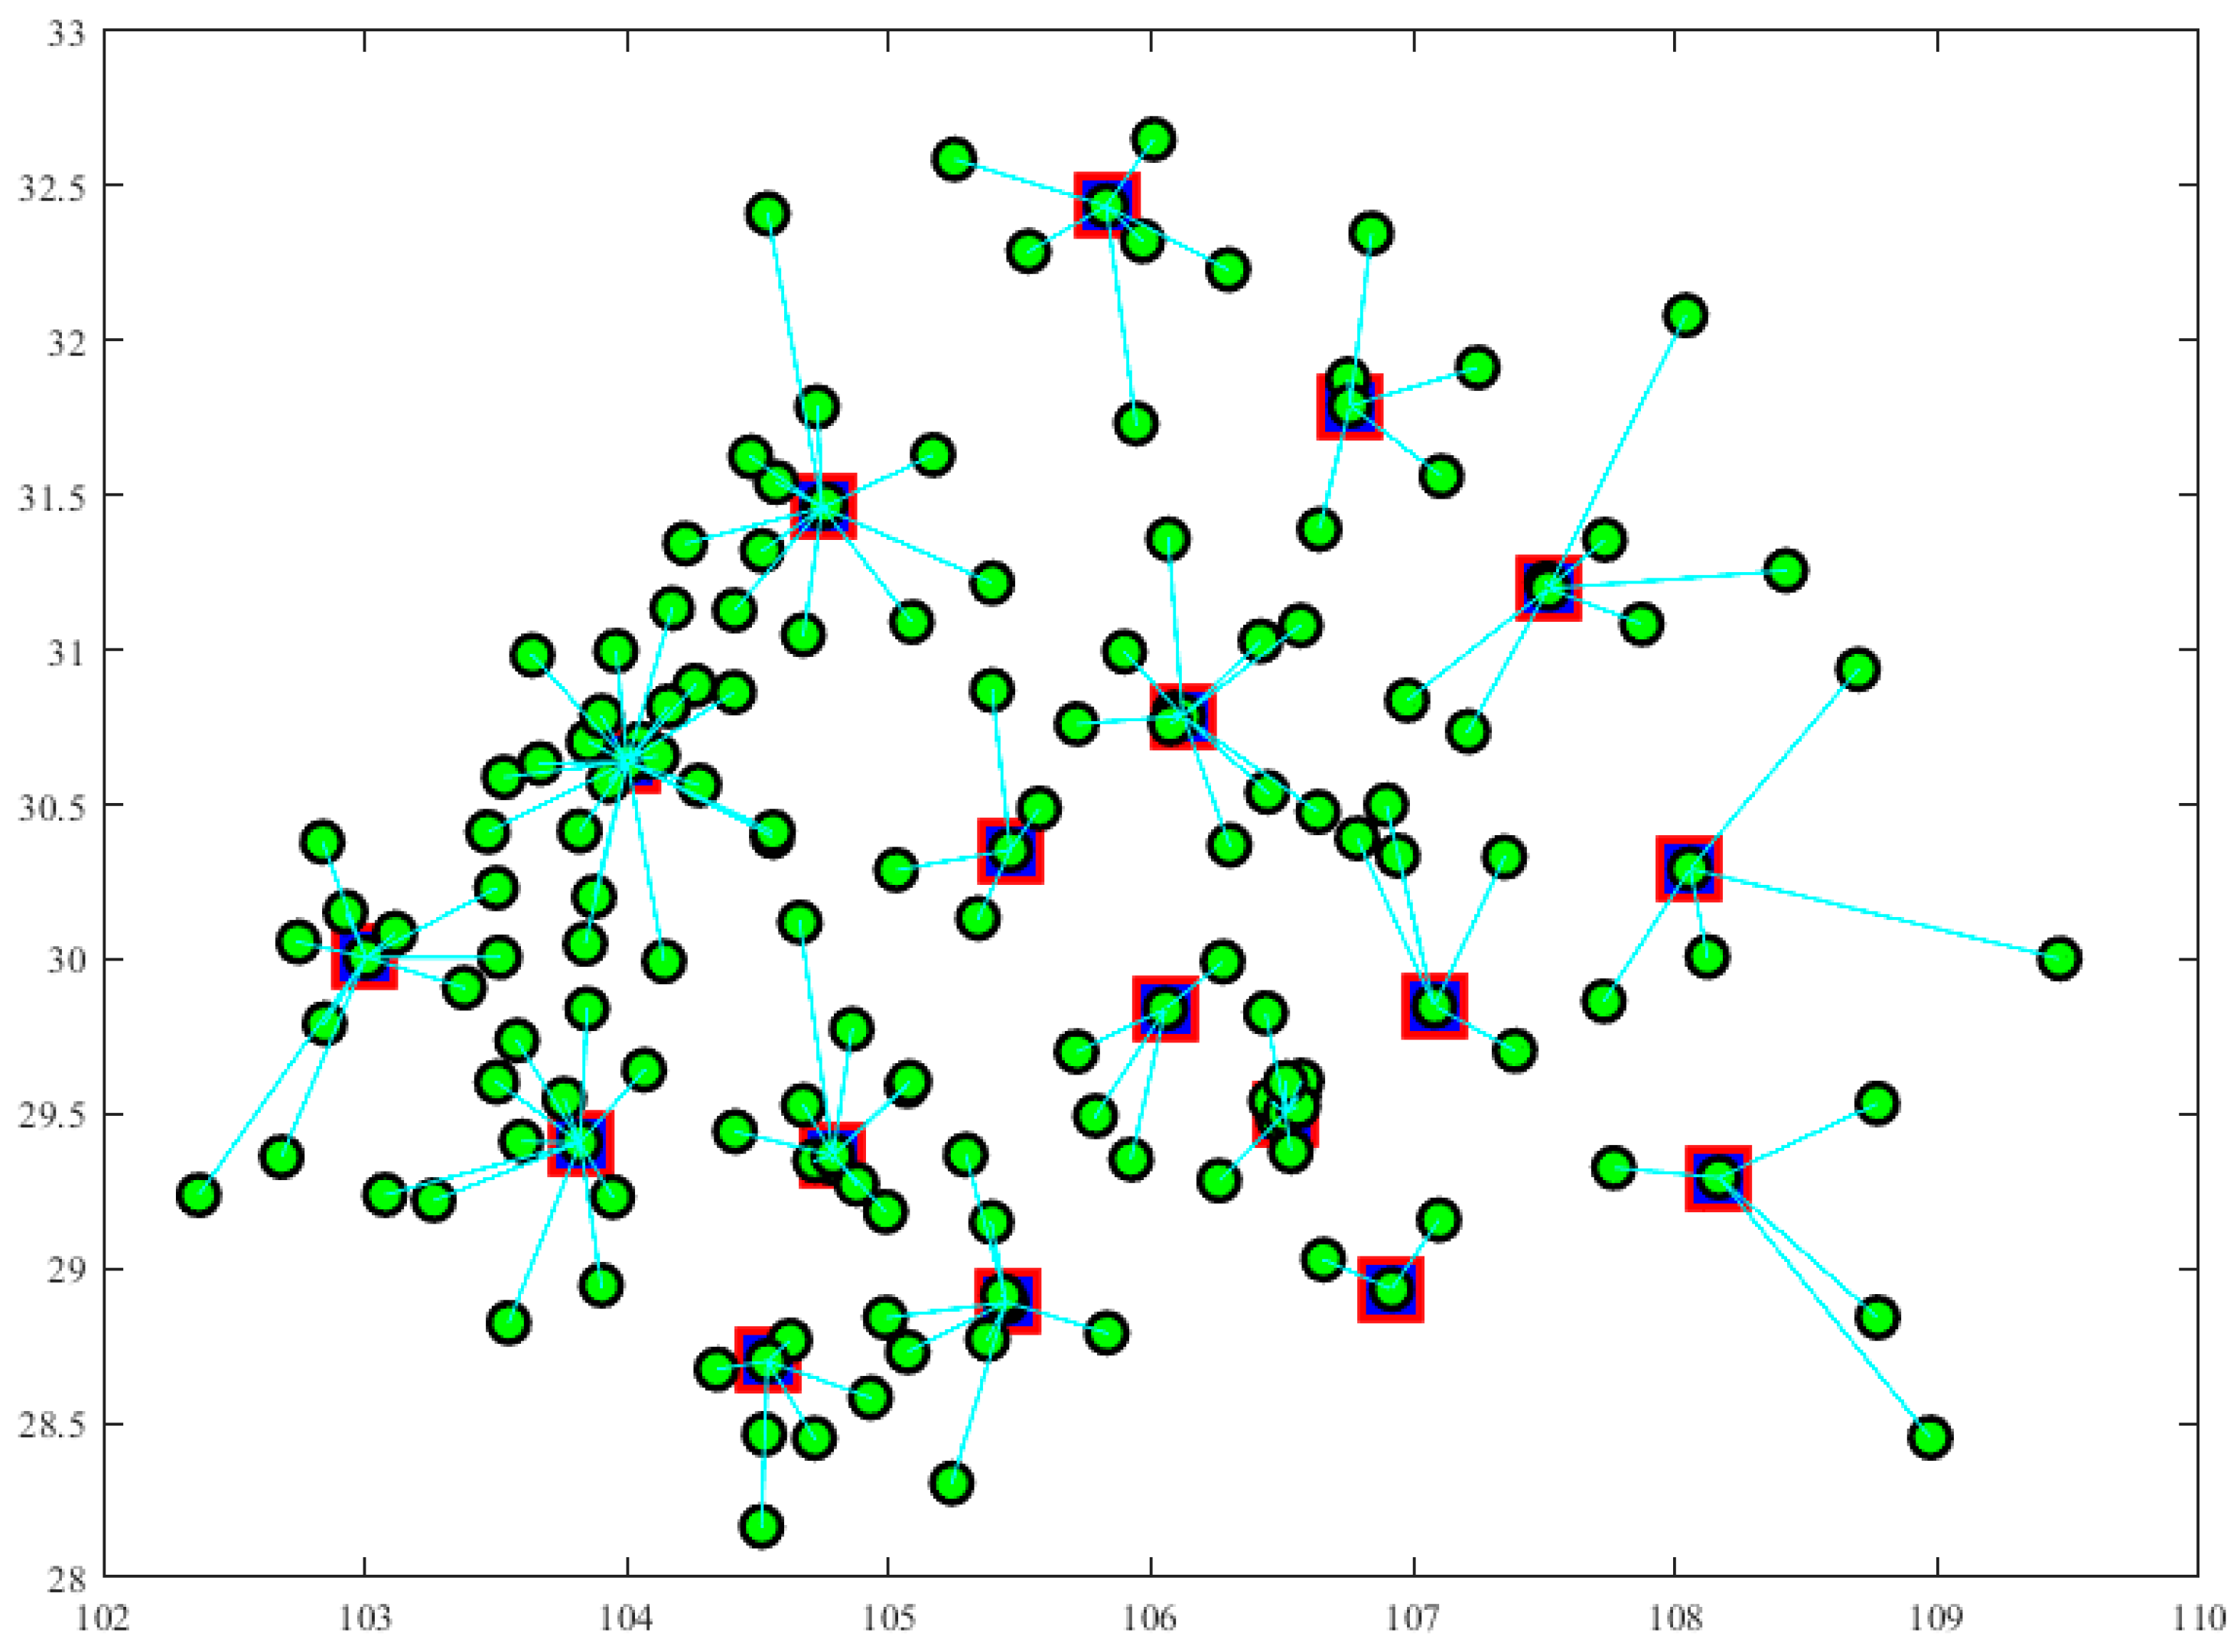
The coordinates of mobile emergency facilities in 148 counties and districts were selected in Sichuan and Chongqing. The emergency logistics centers were chosen using the improved immune optimization algorithm. As shown in Figure 6, two logistics centers were deployed in Jinniu District, Chengdu and Hechuan District, Chongqing. Distribution warehouses were selected among the alternative sites in the remaining districts and communities. Materials were transported to the distribution warehouses through the logistics centers.
The relationship between the affinity value, solution time, and the number of warehouses is shown in Figure 7.
An increase in the number of warehouses will increase the level of mobile emergency logistics. Affinity decreases as the number of warehouses increases. Still, the affinity curve decreases with the increase in the number of warehouses, slows down significantly, and levels off around the number of warehouses equal to 18. Due to the intelligent optimization algorithm, the solution time becomes longer as the number of allocated storage points increases. The solution time also fluctuates occasionally as the number of allocated storage bins increases. Generally speaking, the higher the safety stock coefficient of the distribution warehouse, the larger the safety stock is. The larger the safety stock, the lower the transit cost. The statistics of the number of emergencies at all levels in the last 20 years in all districts and counties of Sichuan and Chongqing are shown in Table 5 and plotted as shown in Figure 8.
Level 1 to 4 emergencies have approximately the same probability of occurring in each region. Each region’s safety stock factor assignment is based on a summary of the number of emergencies. The safety stock coefficients were assigned to four intervals (0.2, 0.3, 0.4, 0.5) for the total number of emergencies in the last 20 years (0–16, 17–30, 31–45, 46–70). The number of warehouses is equal to 18. Warehouses in each region are assigned safety stock coefficients according to Table 4 for site selection. The results of the warehouse siting are shown in Figure 9. In summary, further analysis leads to the following:
Based on the above site selection results, the relationship between inventory, transshipment, and total costs is measured by adjusting the safety factor, as shown in Figure 10.
Inventory costs include contingency and safety inventory costs, and transshipment costs include horizontal and vertical transportation costs. In general, inventory costs become higher as the safety stock factor increases. Transit costs decrease as the safety stock factor increases. The total cost of emergency logistics is mainly affected by transshipment costs. Total emergency logistics costs increase with the rise in the safety stock factor. In addition, the calculations based on the above overview also lead to:
(1) Safety stock and transshipment costs are negatively correlated, i.e., an increase in safety stock will reduce transshipment costs. The ratio of safety stock and trans-shipment fee unit costs affects the setting of the safety stock strategy. The larger the proportion of safety stock costs, the greater the impact on total costs. The smaller the transit fee balance, the greater the impact on total costs. In general, transshipment costs mainly affect the total cost of emergency logistics. Therefore, a higher safety stock factor in emergency-prone areas can reduce the transshipment cost more effectively, and it is reasonable and feasible to assign a value to the safety stock factor according to the statistical level of emergency events.
(2) The deployment of the Emergency Logistics Center has been effective. Contingency logistics centers can only be deployed in smaller quantities because of higher deployment costs and inventory levels. Transit costs mainly affect the total cost of emergency logistics. Emergency logistics centers cover several warehouses. The more the logistics transfer effect plays, the stronger it is, and warehouses can still move the transfer. Therefore, from the perspective of the mobile emergency logistics system, the actual coverage of the emergency logistics center has been significantly improved under the safety stock strategy.
(3) There is a lower limit on the cost of mobile emergency logistics. The total cost of emergency logistics is limited by population distribution, transshipment costs, and inventory costs and cannot be further reduced after it reaches a certain level. The removal of restrictions on the number of emergency logistics centers and warehouses to be deployed has resulted in an overall leveling off of the total cost of emergency logistics. The total cost of contingency logistics will not decrease as a result of an increase in the number of contingency logistics centers and warehouses. Non-core counties and districts with sparse population distribution, remote distance, and low safety stock coefficients covering their emergency needs mainly rely on the neighboring warehouses for transshipment. This suggests that adopting a hierarchical coverage of mobile emergency logistics is a more effective strategy in emergencies.
In summary, we give the following management suggestions: 1. In areas where emergencies occur more frequently, setting up a higher level of safety stock can effectively reduce the total cost of emergency logistics; 2. Emergency logistics centers should be built in areas where the population is more concentrated so that they can more effectively respond to the emergency needs of many people during emergencies; 3. In areas where the population distribution is more sporadic, the number of distribution warehouses should be increased and their coverage expanded to meet emergency needs more effectively.

5. Conclusions

This paper models the problem of mobile emergency logistics siting for emergencies, considering safety stock. The model estimates the demand for emergency supplies and sets the safety stock strategy by quantifying the population distribution and the frequency of past emergencies. In order to adapt to the uncertainty and dynamics of emergencies, the immuno-optimization algorithm is improved. The quality and efficiency of the solution to the emergency logistics positioning optimization problem are improved. The examples show that the model has strong advantages in improving the solution quality of emergency logistics location optimization. However, there are some limitations to the current study. Inter-level transportation and transshipment in the three-level emergency logistics system are not considered. There is no planning for emergency logistics synergy at the national or higher level. Decision makers can plan appropriate emergency logistics sites based on the scale of the emergency, population distribution in the jurisdiction, and safety inventory factors. The focus of future research is to explore the directions of multi-objective mobile emergency logistics site selection, mobile emergency big data service optimization, and enrichment of more emergency scenario requirements.

Author Contributions

Conceptualization, R.Z. and J.L.; methodology, R.Z.; software, R.Z.; validation, R.Z., J.L. and Shang, Y.; formal analysis, R.Z.; investigation, R.Z. and Shang, Y.; resources, J.L.; data curation, Shang, Y.; writing—original draft preparation, R.Z.; writing—review and editing, R.Z. and Y.S.; visualization, R.Z.; supervision, J.L.; project administration, R.Z.; funding acquisition, J.L. All authors have read and agreed to the published version of the manuscript.

Funding

This research was funded by the National Social Science Fund of China, grant number 21BGL200.

Institutional Review Board Statement

Not applicable.

Informed Consent Statement

Not applicable.

Data Availability Statement

The program code and data that support the plots discussed within this paper are available from the corresponding author upon request.

Acknowledgments

Jianxun Li gratefully acknowledges the support of the National Social Science Fund of China (No. 21BGL200).

Conflicts of Interest

The authors declare that the research was conducted without any commercial or financial relationships that could be construed as a potential conflict of interest.

References

  1. Zhu, J.; Shi, Y.; Venkatesh, V.G.; Islam, S.; Hou, Z.; Arisian, S. Dynamic collaborative optimization for disaster relief supply chains under information ambiguity. Ann. Oper. Res. 2022, 1–27. [Google Scholar] [CrossRef] [PubMed]
  2. Zhang, W.; Shi, X.; Huang, A.; Hua, G.; Teunter, R.H. Optimal stock and capital reserve policies for emergency medical supplies against epidemic outbreaks. Eur. J. Oper. Res. 2023, 304, 183–191. [Google Scholar] [CrossRef]
  3. Puga, M.S.; Tancrez, J.S. A heuristic algorithm for solving large location-inventory problems with demand uncertainty. Eur. J. Oper. Res. 2017, 259, 413–423. [Google Scholar] [CrossRef]
  4. Liu, J.; Qiang, Z.; Wu, P.; Du, P. Multiple stage optimization driven group decision making method with interval linguistic fuzzy preference relations based on ordinal consistency and DEA cross-efficiency. Fuzzy Optim. Decis. Mak. 2023, 22, 309–336. [Google Scholar] [CrossRef]
  5. Fei, L.; Ma, Y. A Hybrid Decision-Making Framework for Selecting the Emergency Alternatives. Int. J. Fuzzy Syst. 2023, 25, 2123–2137. [Google Scholar] [CrossRef]
  6. Wu, J.; Lin, Y.; Qi, W. Timing co-evolutionary path optimisation method for emergency vehicles considering the safe passage. Transp. A Transp. Sci. 2023, 1–33. [Google Scholar] [CrossRef]
  7. Ge, J.; Li, X.; Wu, Z.; Sun, Y.; Kanrak, M. The Distribution of Emergency Logistics Centers under the COVID-19 Lockdown: The Case of Yangtze River Delta Area. Sustainability 2022, 14, 10594. [Google Scholar] [CrossRef]
  8. Luo, D.; Wang, J.; Lu, W.; Chen, L.; Gao, Z.; Dong, J. Target encirclement of moving ride-hailing vehicle under uncertain environment: A multi-vehicle mutual rescue model. Comput. Oper. Res. 2022, 146, 105901. [Google Scholar] [CrossRef]
  9. Zhu, X.; Cao, Y. The optimal recovery-fund based strategy for uncertain supply chain disruptions: A risk-averse two-stage stochastic programming approach. Transp. Res. Part E-Logist. Transp. Rev. 2021, 152, 102387. [Google Scholar] [CrossRef]
  10. Zhang, J.; Liu, Y.; Yu, G.; Shen, Z.J. Robustifying humanitarian relief systems against travel time uncertainty. Nav. Res. Logist. 2021, 68, 871–885. [Google Scholar] [CrossRef]
  11. Li, X.; Liao, H.; Wen, Z. A consensus model to manage the non-cooperative behaviors of individuals in uncertain group decision making problems during the COVID-19 outbreak. Appl. Soft Comput. 2021, 99, 106879. [Google Scholar] [CrossRef]
  12. De Kok, T.; Grob, C.; Laumanns, M.; Minner, S.; Rambau, J.; Schade, K. A typology and literature review on stochastic multi-echelon inventory models. Eur. J. Oper. Res. 2018, 269, 955–983. [Google Scholar] [CrossRef]
  13. Hasani, A.; Mokhtari, H. An integrated relief network design model under uncertainty: A case of Iran. Saf. Sci. 2019, 111, 22–36. [Google Scholar] [CrossRef]
  14. Ma, Z.; Zhou, Y. Dynamic model for blood collection in large-scale sudden-onset emergencies. J. Syst. Eng. 2017, 32, 125–135. [Google Scholar]
  15. Bono, K.; Jang, W.; Noble, J. An inventory model with emergency orders under explicit energy cost considerations. Int. J. Prod. Res. 2014, 52, 203–220. [Google Scholar] [CrossRef]
  16. Zadeh, A.S.; Sahraeian, R.; Homayouni, S.M. A dynamic multi-commodity inventory and facility location problem in steel supply chain network design. Int. J. Adv. Manuf. Technol. 2014, 70, 1267–1282. [Google Scholar] [CrossRef]
  17. Ozguven, E.E.; Ozbay, K. Case Study-Based Evaluation of Stochastic Multicommodity Emergency Inventory Management Model. Transp. Res. Rec. 2012, 2283, 12–24. [Google Scholar] [CrossRef]
  18. Paterson, C.; Teunter, R.; Glazebrook, K. Enhanced lateral transshipments in a multi-location inventory system. Eur. J. Oper. Res. 2012, 221, 317–327. [Google Scholar] [CrossRef]
  19. Sun, H.; Xiang, M.; Xue, Y. Emergency facility siting-path robust optimization under uncertain information. J. Syst. Manag. 2019, 28, 1126–1133. [Google Scholar]
  20. Mafarja, M.; Mirjalili, S. Whale optimization approaches for wrapper feature selection. Appl. Soft Comput. 2018, 62, 441–453. [Google Scholar] [CrossRef]
  21. Mafarja, M.; Aljarah, I.; Heidari, A.A.; Hammouri, A.I.; Faris, H.; Ala’M, A.Z.; Mirjalili, S. Evolutionary Population Dynamics and Grasshopper Optimization approaches for feature selection problems. Knowl. -Based Syst. 2018, 145, 25–45. [Google Scholar] [CrossRef]
Figure 1. Mobile emergency logistics multilevel site selection.
Applsci 13 11245 g001
Figure 2. Immunization algorithm flow chart.
Applsci 13 11245 g002
Figure 3. Population distribution in Sichuan and Chongqing regions.
Applsci 13 11245 g003
Figure 4. Sensitivity validation of different population sizes.
Applsci 13 11245 g004
Figure 5. Comparison of algorithm iterations.
Applsci 13 11245 g005
Figure 6. Emergency logistics center site selection map.
Applsci 13 11245 g006
Figure 7. Folding line diagram of growth site selection for distribution storage silos.
Applsci 13 11245 g007
Figure 8. Folding line chart of emergency statistics by county in Sichuan and Chongqing in the past 20 years.
Applsci 13 11245 g008
Figure 9. Site selection map of distribution and storage silos.
Applsci 13 11245 g009
Figure 10. Safety stock factor contingency logistics cost chart.
Applsci 13 11245 g010
Table 1. Variable descriptions.
Variable symbol:
K , J , I logistics center distribution & forwarding storage warehouse j and mobile emergency unit alternative point collection
F k , f j logistics center distribution & forwarding storage warehouse j site selection fixed costs
d j k , d i j logistics center to distribution & forwarding storage warehouse j unit material transportation cost, distribution & forwarding storage warehouse j to mobile emergency unit i unit material transportation cost
μ i , μ j mobile emergency unit and distribution and forwarding storage warehouse j coverage area emergency demand value
h 1 , h 2 logistics center distribution & forwarding storage warehouse j unit storage cost
P k , L j emergency supplies transported to the logistics center k shipping time, transportation time from logistics center distribution & forwarding storage warehouse j
α safety stock factor
q maximum number of distribution storage silos covered by logistics centers
Decision variables
a k logistics center whether the alternative point is selected
y i j whether the mobile emergency unit i is assigned to the distribution & forwarding storage warehouse j
x j k distribution & forwarding storage warehouse j whether to assign to logistics center k
Table 2. Basic parameter settings.
SymbolsChargesValue
F i , j , k alternative site selection fixed costs700
h unit storage cost of logistics center and distribution warehouse0.2
L lead time for distribution of storage silos to mobile emergency facilities1
P lead time from logistics center to distribution and storage warehouse1
α service level factor1.5
Table 3. Coordinates and population size of Sichuan and Chongqing regions.
NumberAdministrative CityPolitical Districts and CountiesCoordinatesPopulation (10,000)
1DeyangJingyang District104.411173, 31.12826166.32
2DeyangLuojiang District104.516205, 31.32018731
3DeyangZhongjiang County104.672767, 31.0483725
4DeyangShifang city104.172259, 31.13393137
5DeyangMianzhu104.22251, 31.34340938
161ChongqingYouyangxian108.77212, 28.841223.85
162ChongqingXiushanxian108.97297, 28.452613.09
163ChongqingQianjiang District108.77067, 29.5333103.05
164ChongqingJiangjin District106.25928, 29.283763.66
165ChongqingHechuan District106.27328, 29.990949.48
166ChongqingNanchuan District107.09896, 29.156646.05
Table 4. Parameter settings of the immune optimization algorithm.
ParametersValue
maximum number of iterations300
crossover probability0.5
mutation probability0.4
diversity evaluation parameters0.95
population size200
memory bank capacity40
Table 5. Frequency of emergencies in Sichuan and Chongqing in the past 20 years.
NumberPolitical Districts and CountiesLevel 1Level 2Level 3Level 4Total
1Jingyang58101538
2Mianzhu3571126
3Luojiang246921
4Zhongjiang4791434
5Guanghan69111642
155Wushan135716
156Wuxi135716
161Fuling135716
162Shijiazhuang135716
163Wanzhou135716
164Tongnan135716
Disclaimer/Publisher’s Note: The statements, opinions and data contained in all publications are solely those of the individual author(s) and contributor(s) and not of MDPI and/or the editor(s). MDPI and/or the editor(s) disclaim responsibility for any injury to people or property resulting from any ideas, methods, instructions or products referred to in the content.

