
Performance Analysis of an Improved Gravity Anchor Bolt Expanded Foundation

 ,
,  ,
,  ,
,
Abstract
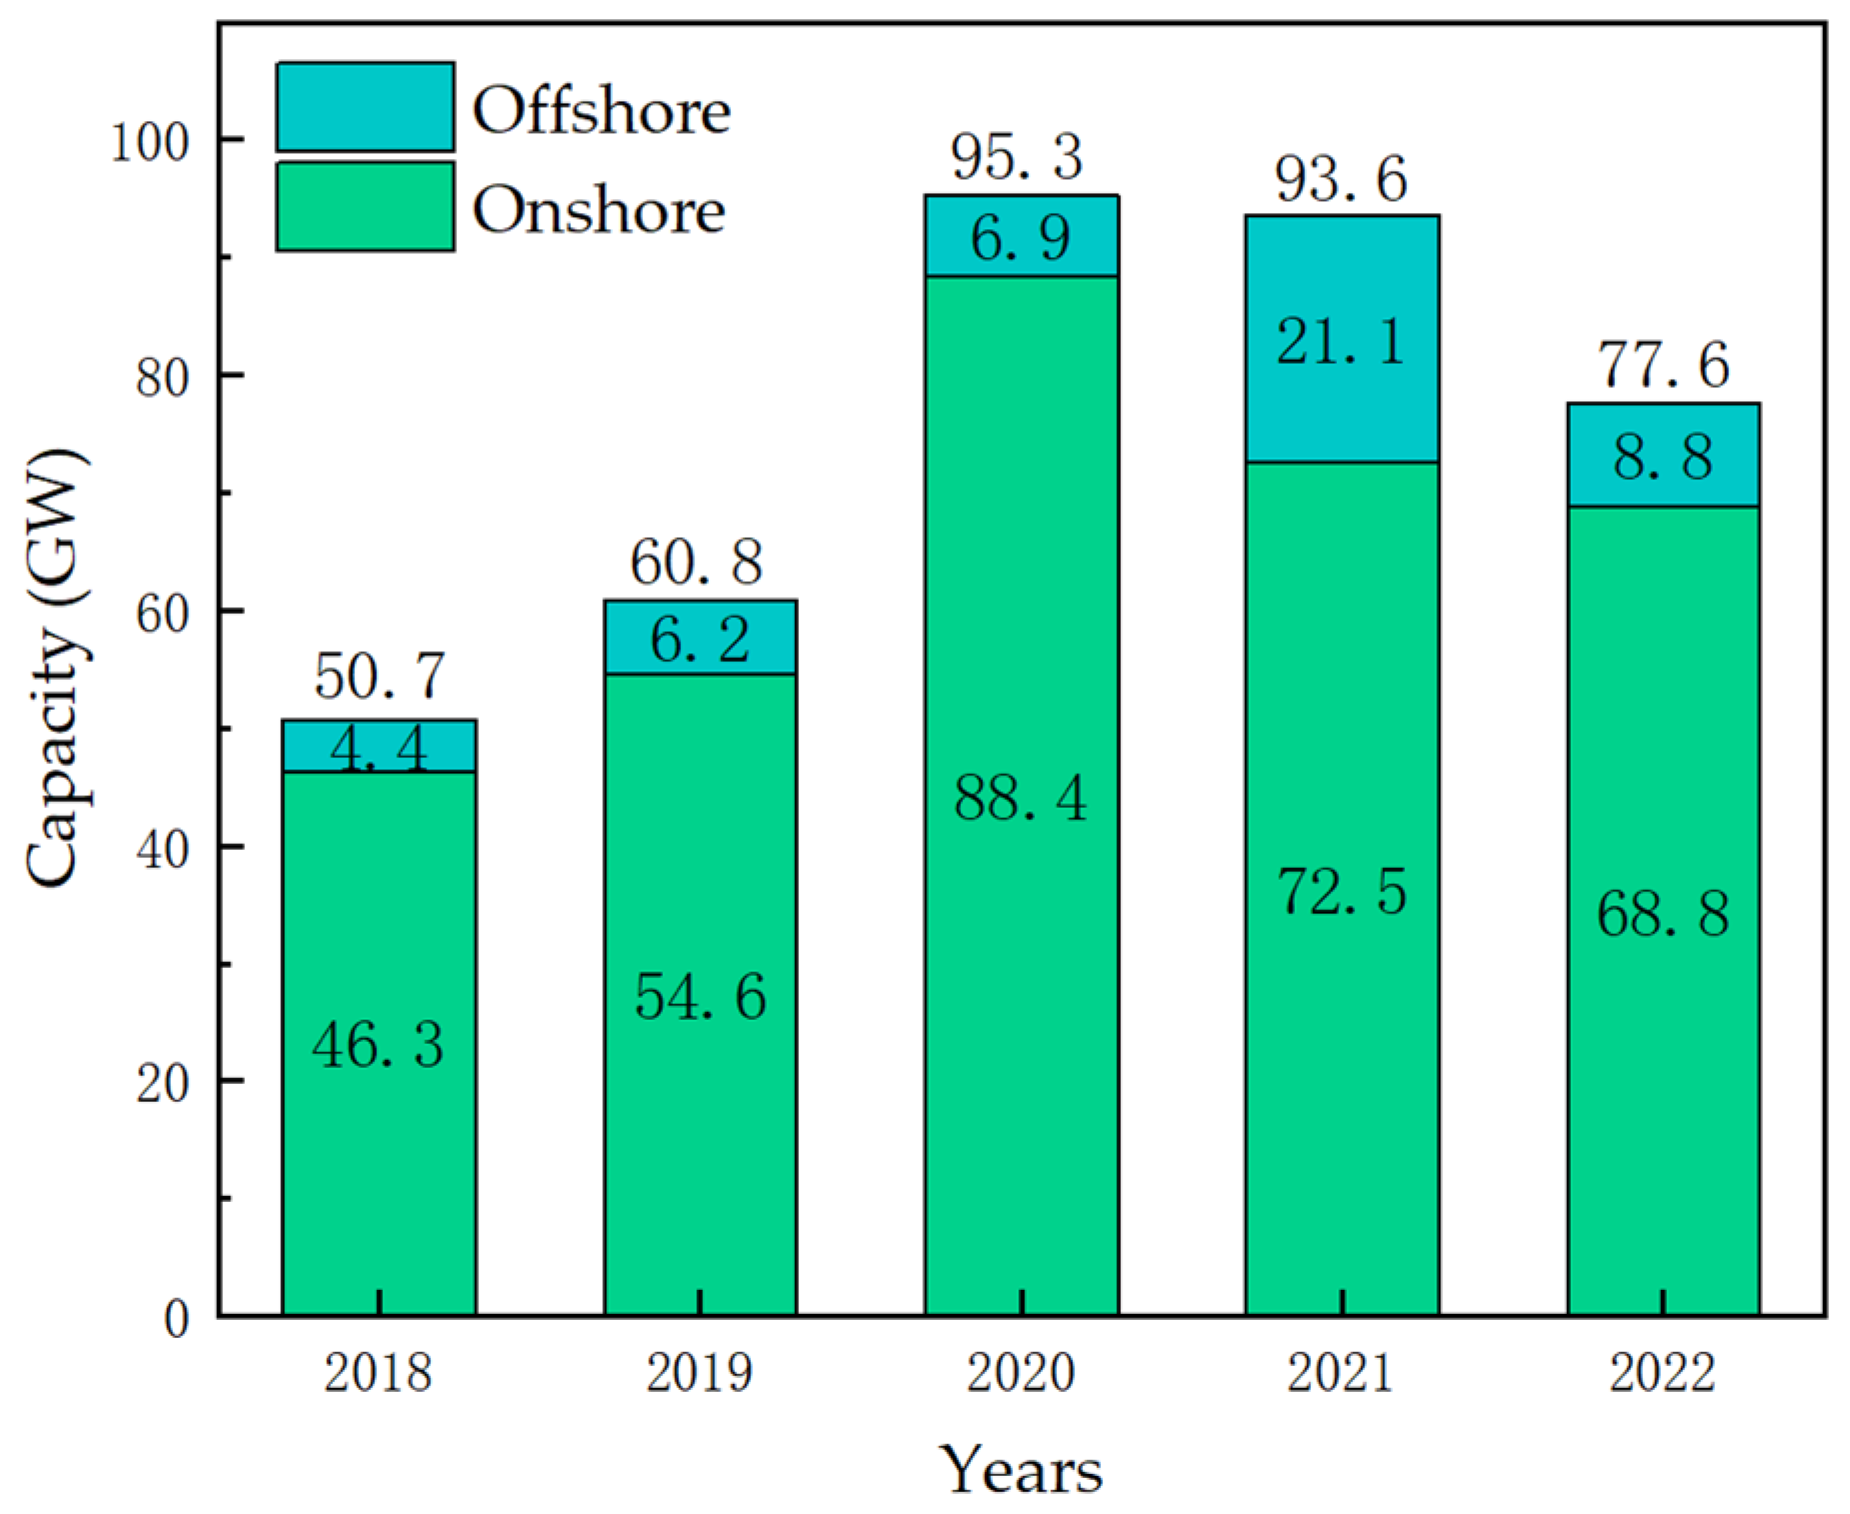
:1. Introduction
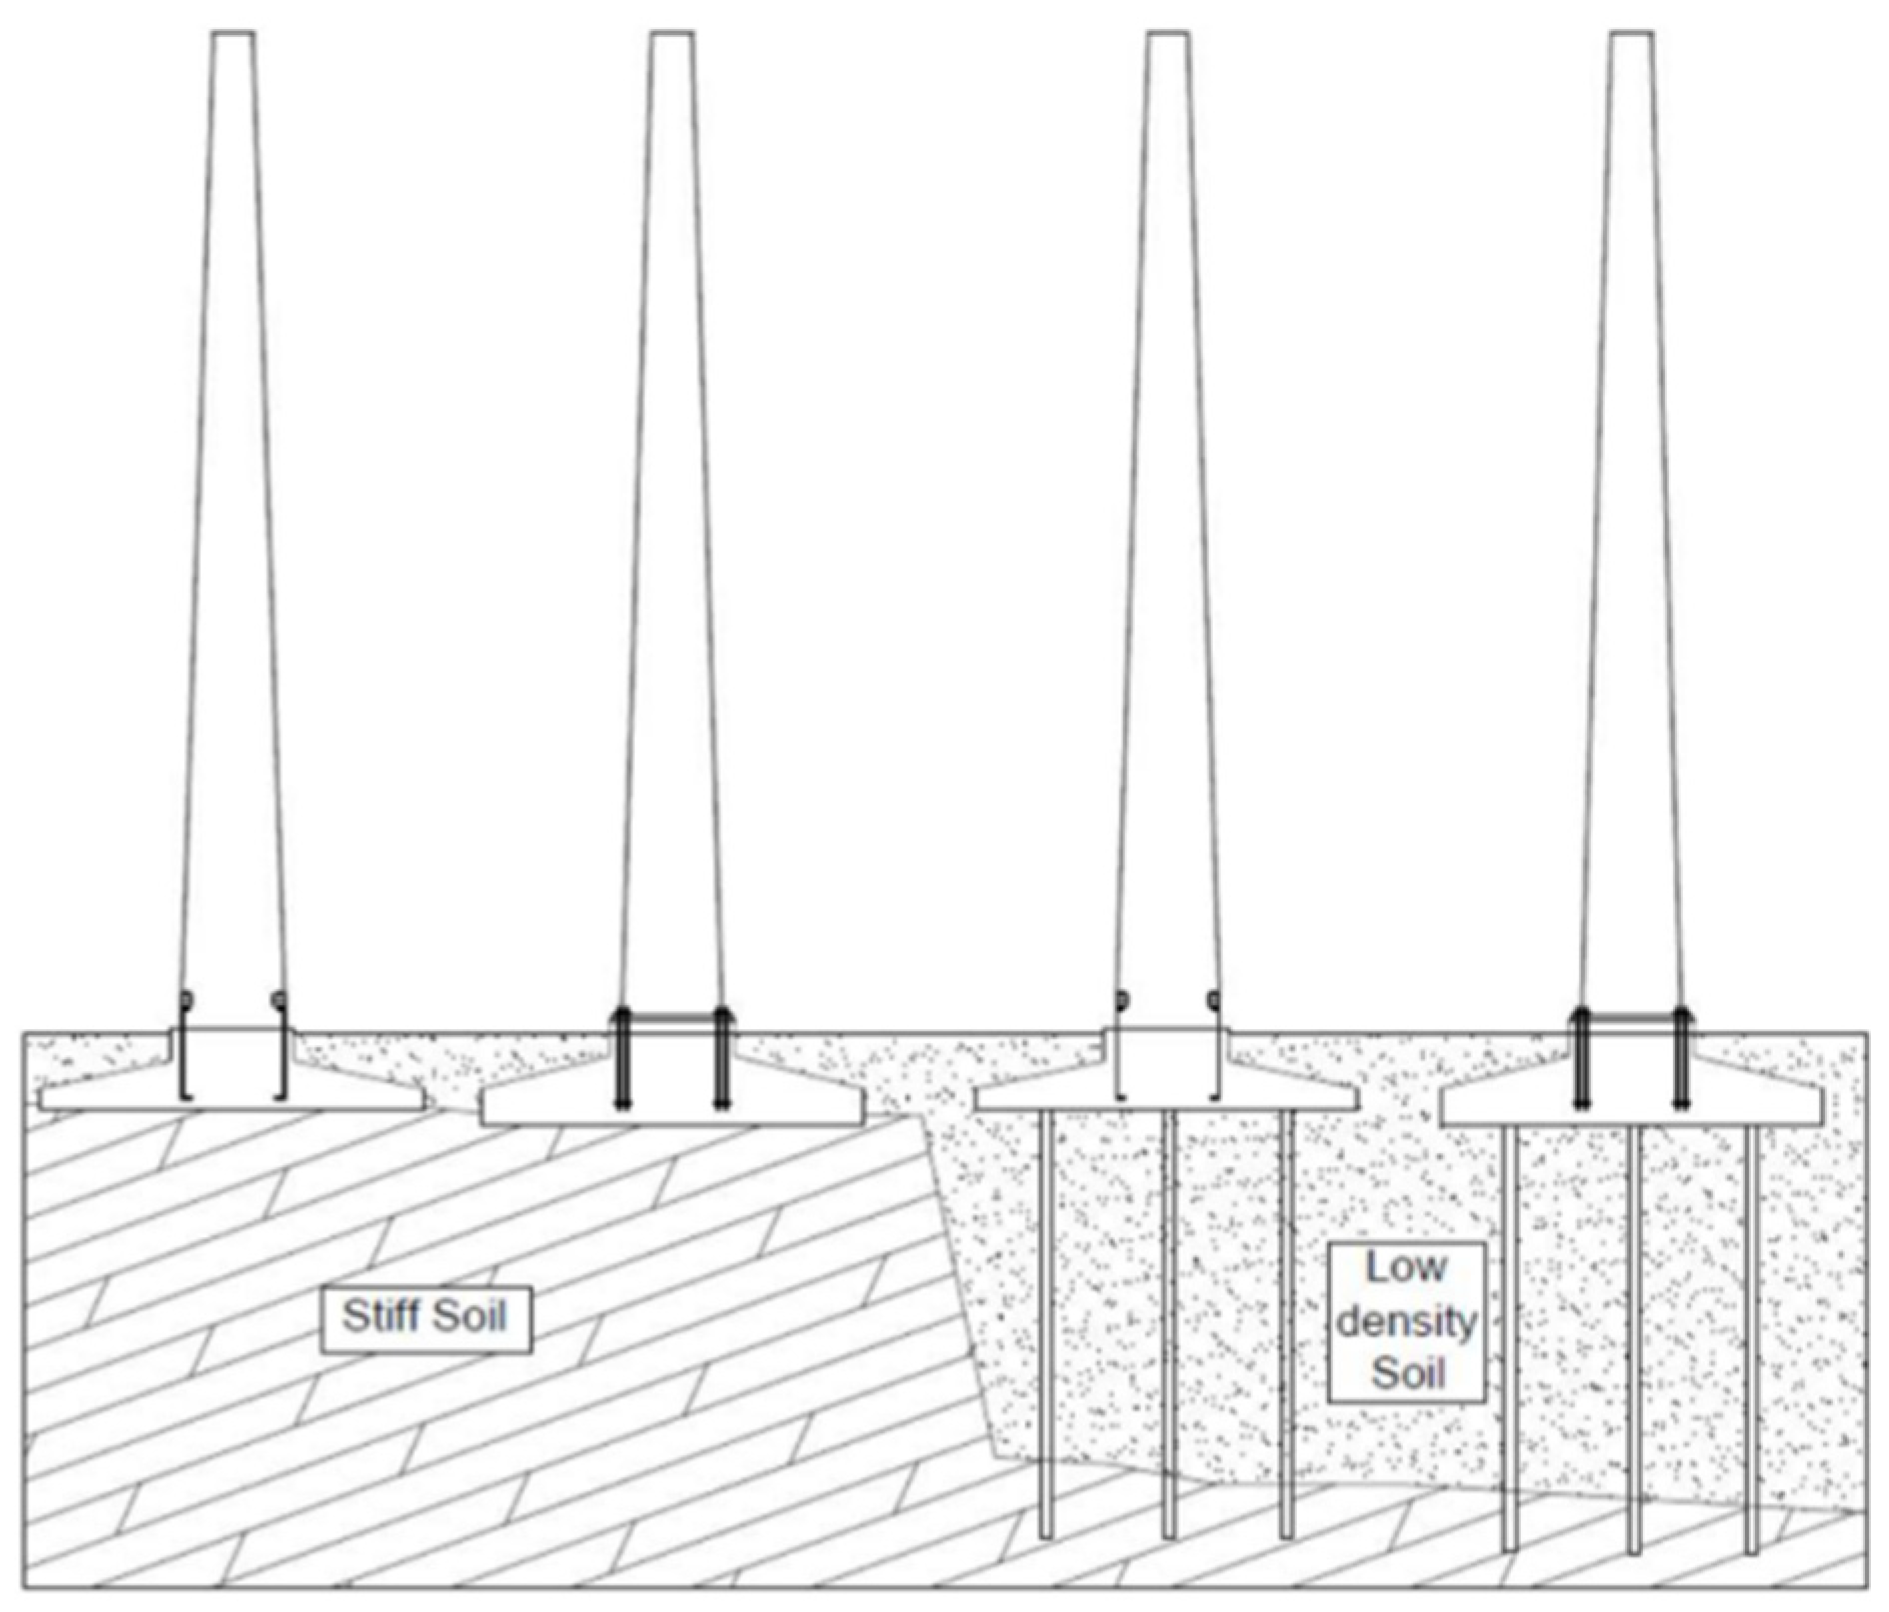
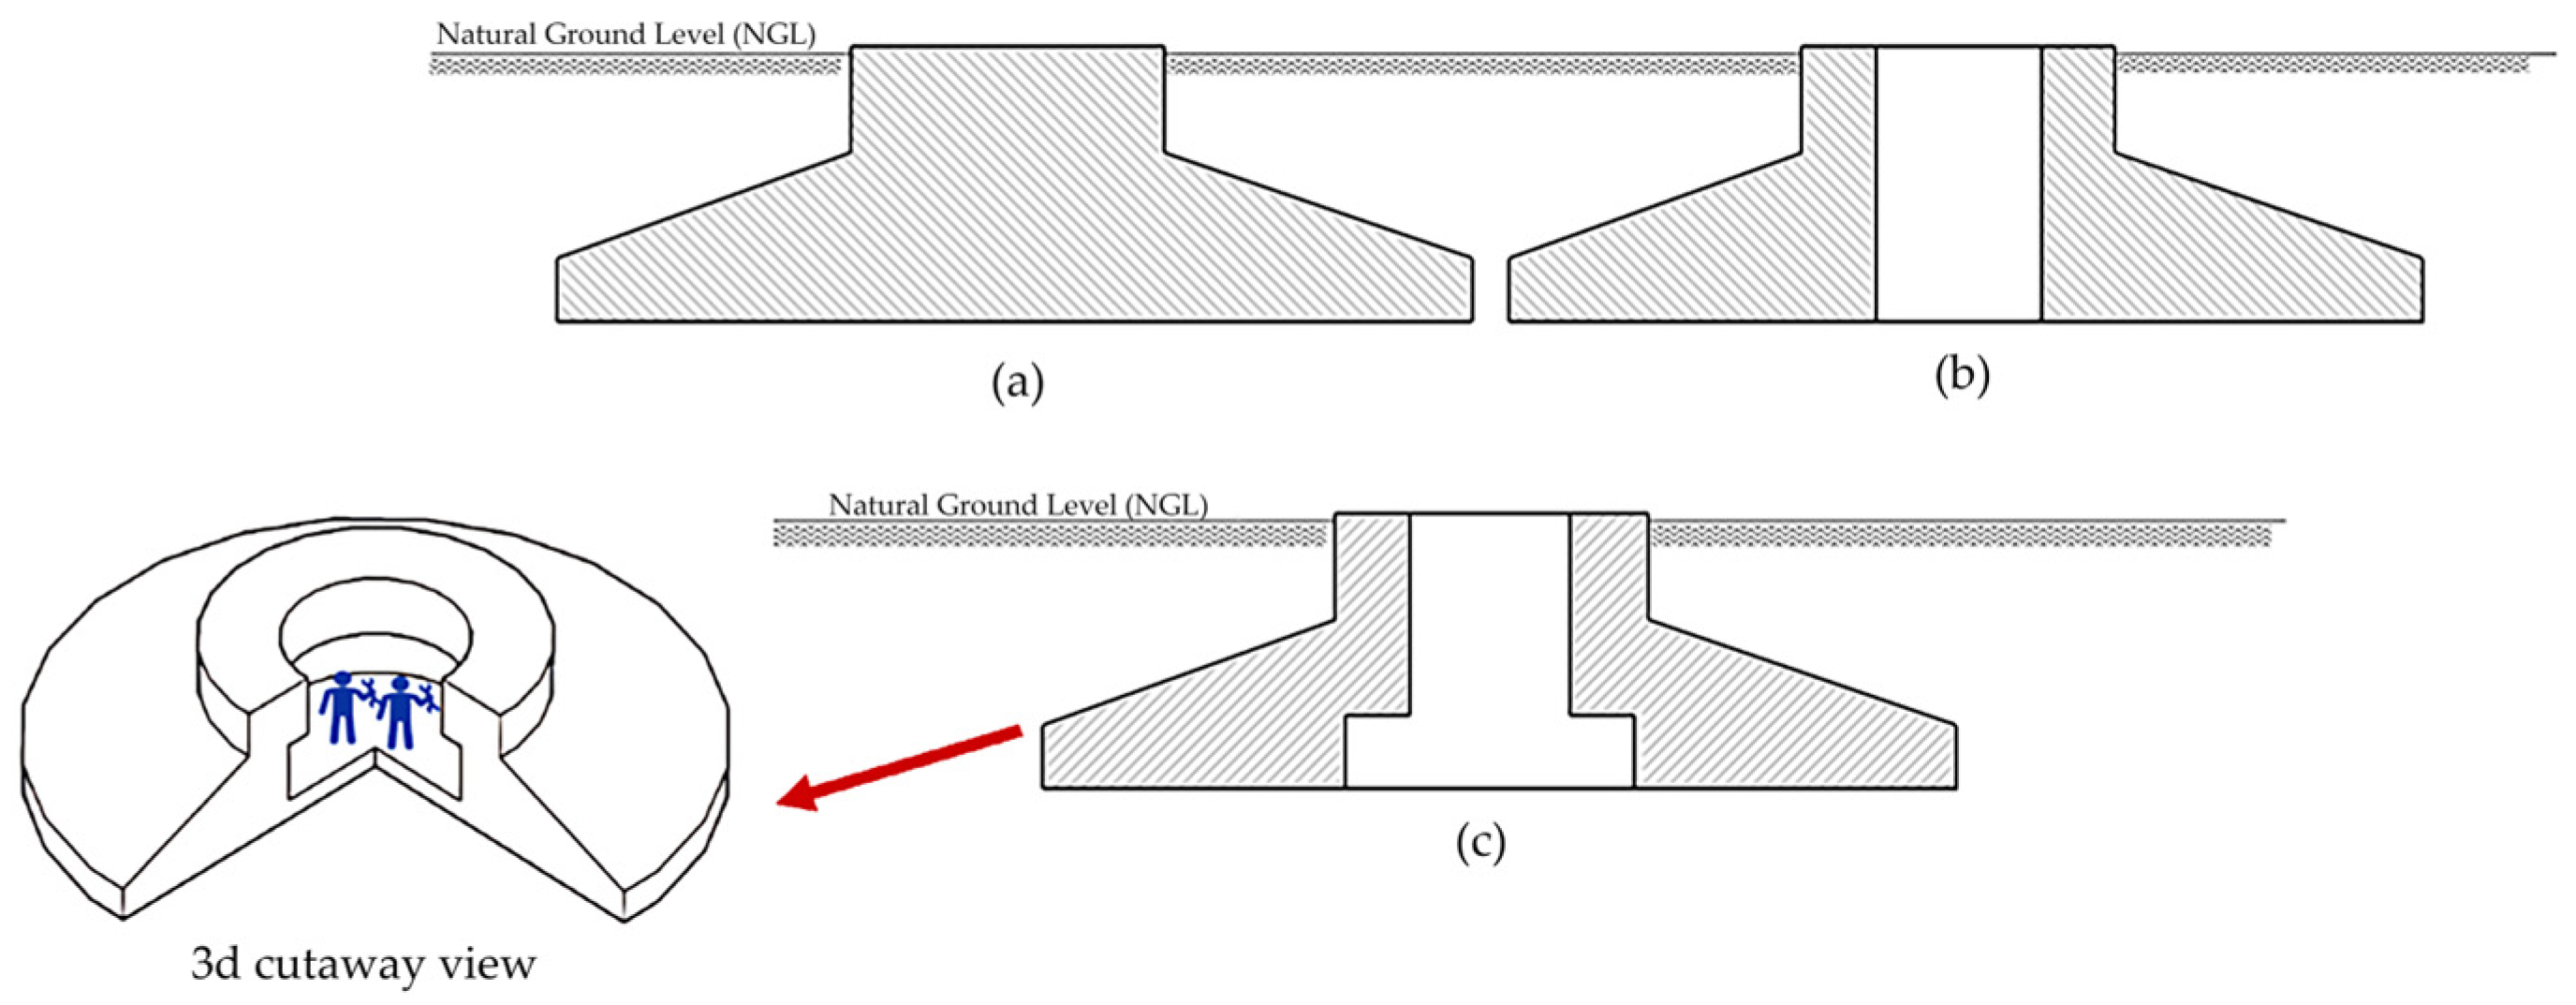
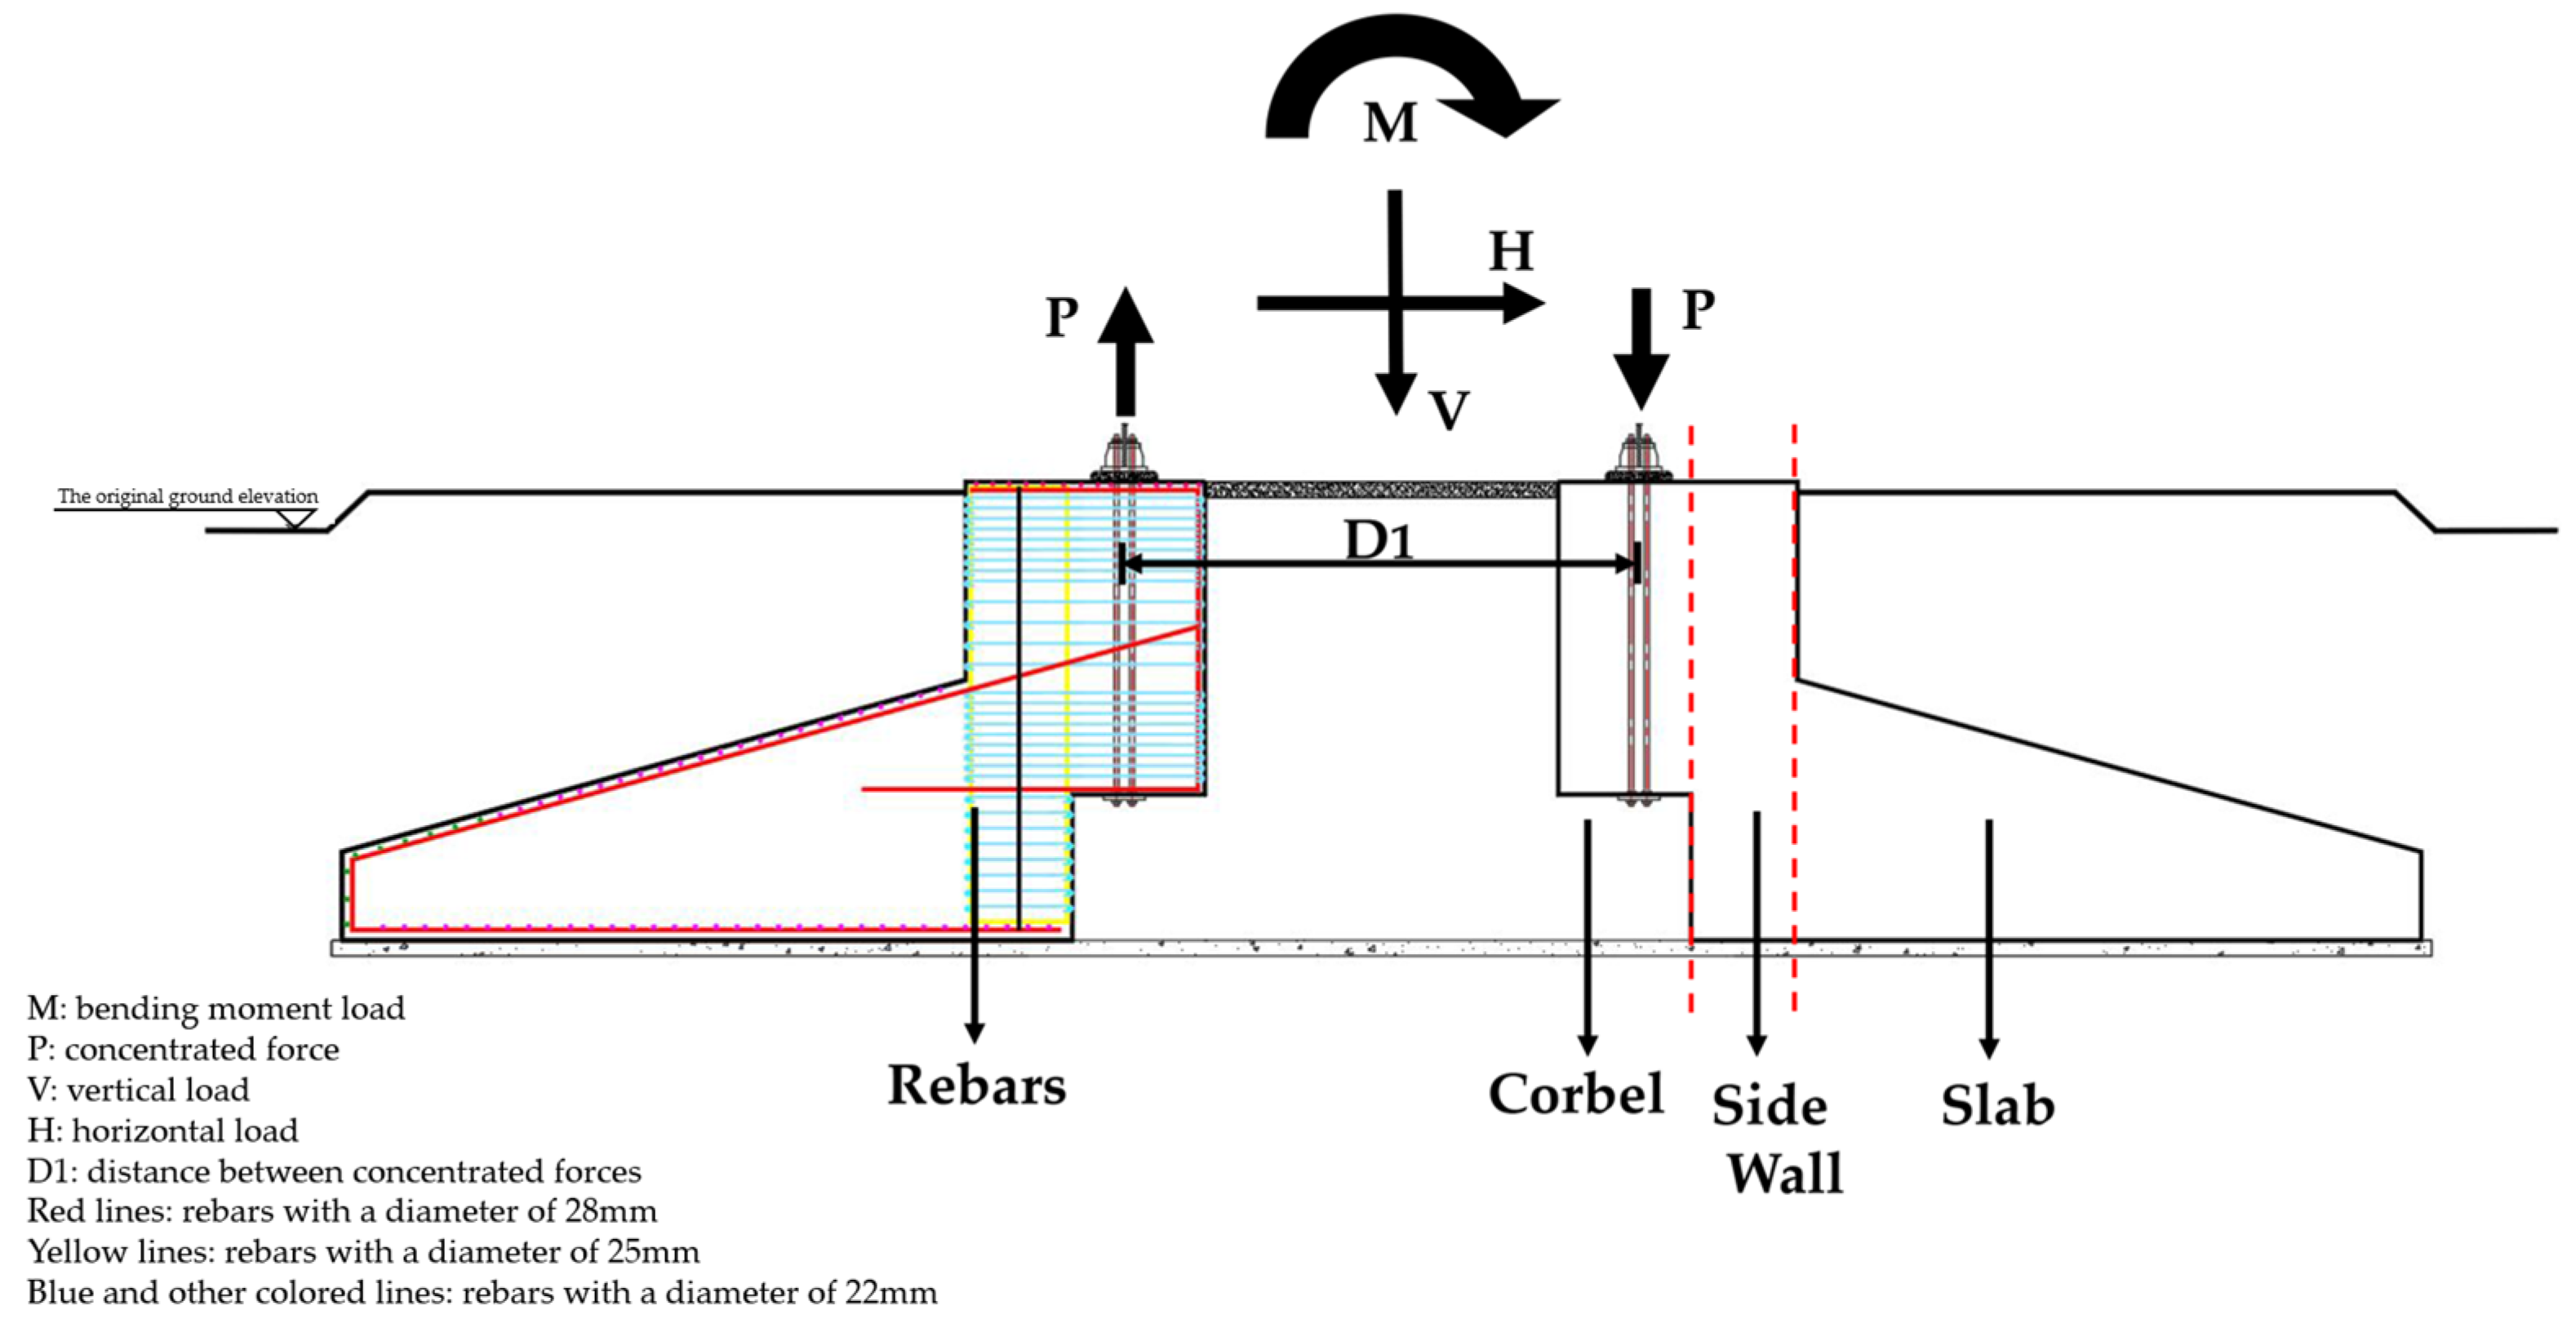
2. Load Transfer Mechanism and Failure Mode
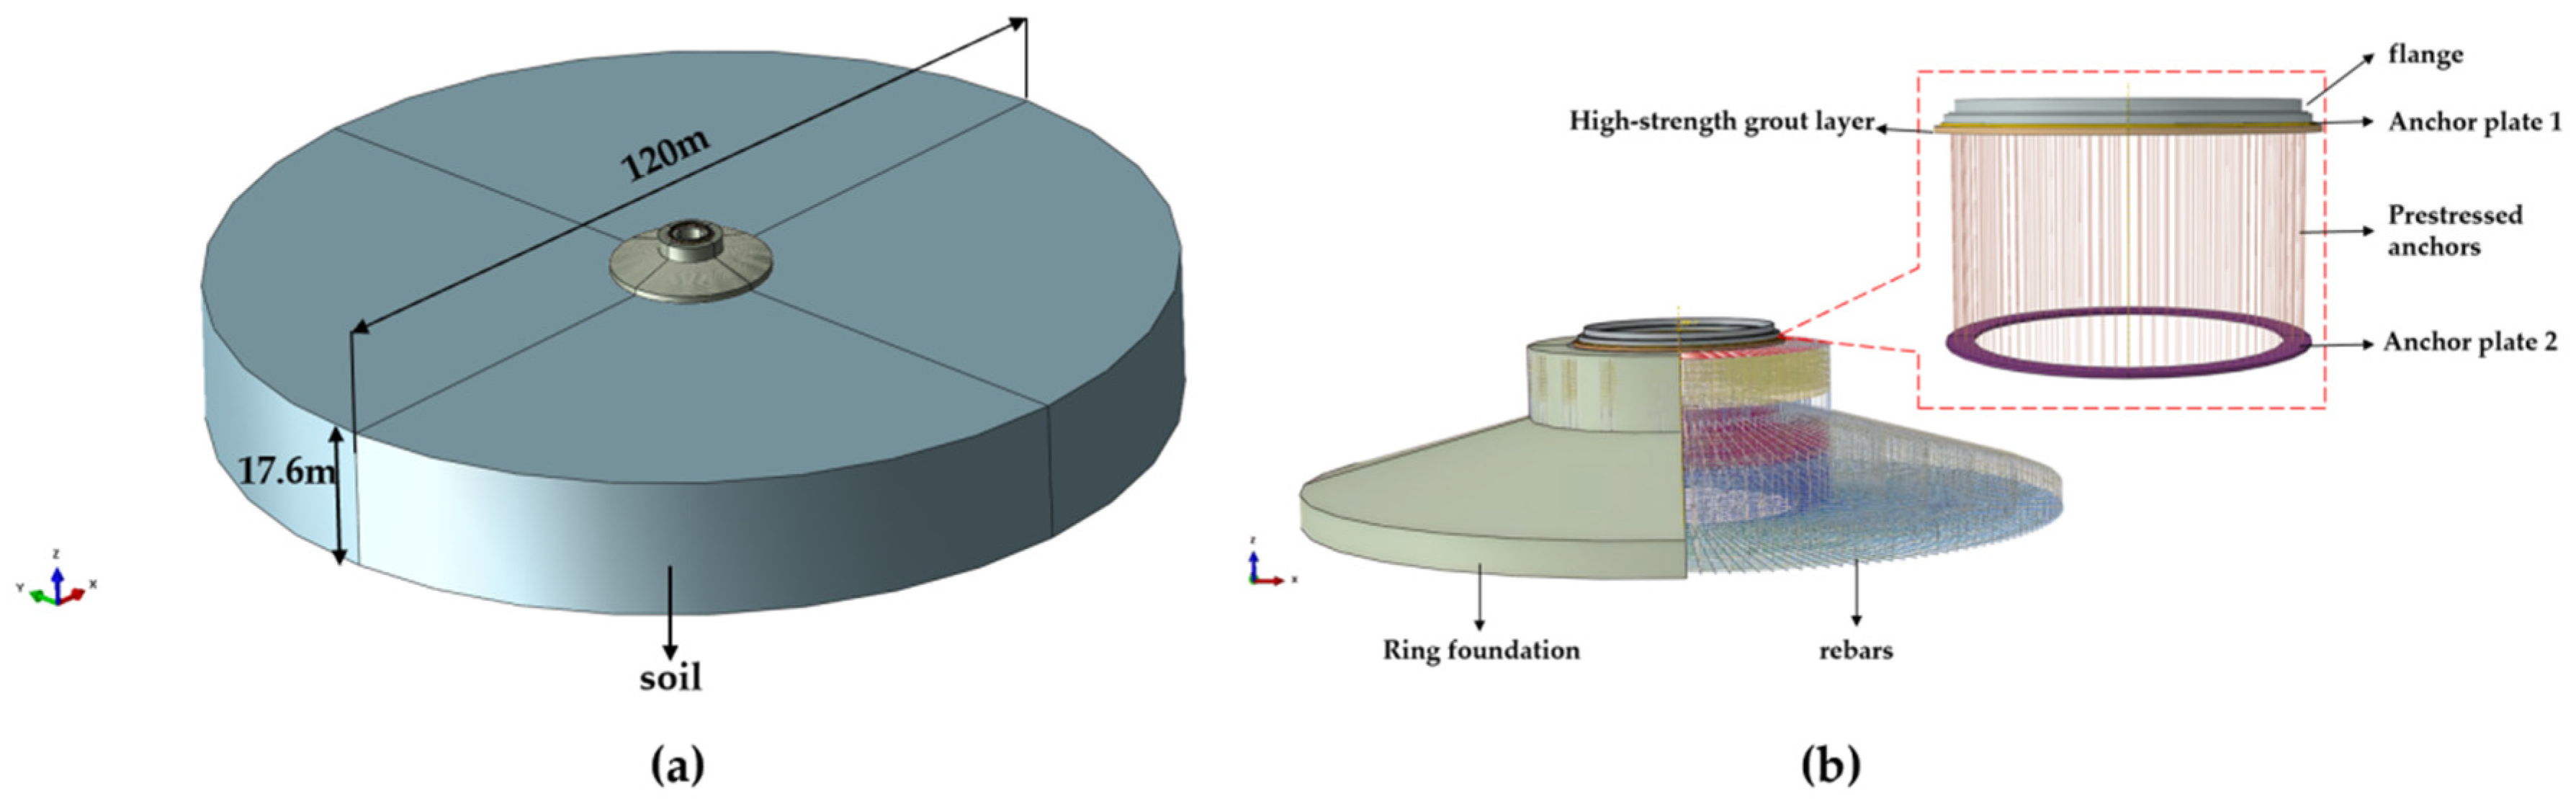
3. Finite Element Model
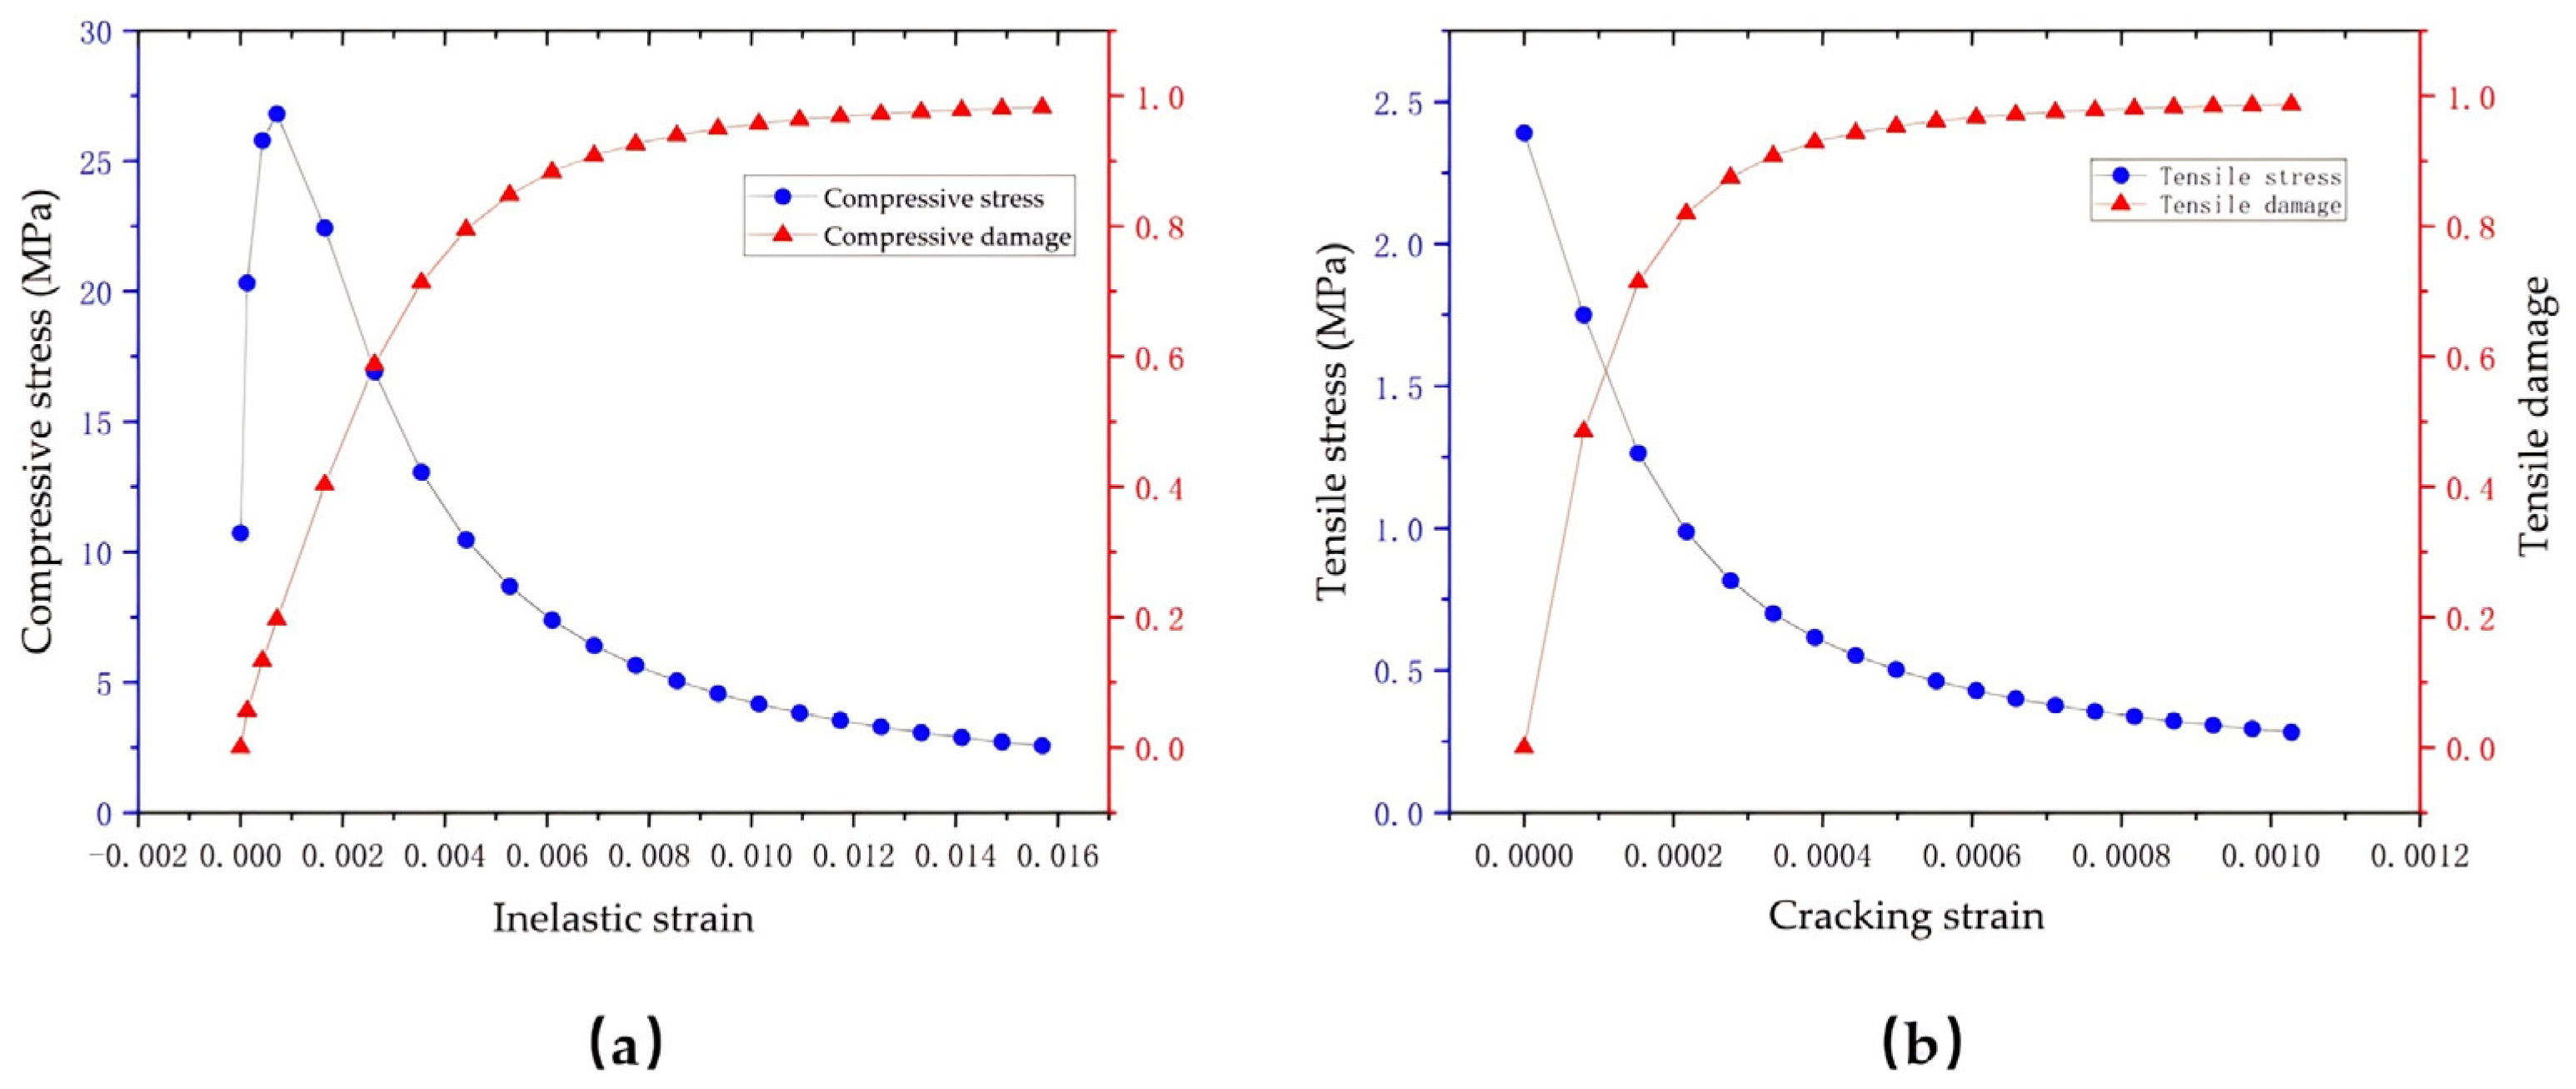
3.1. Modeling Materials
3.2. Concrete CDP Model
3.3. Finite Element Model in ABAQUS
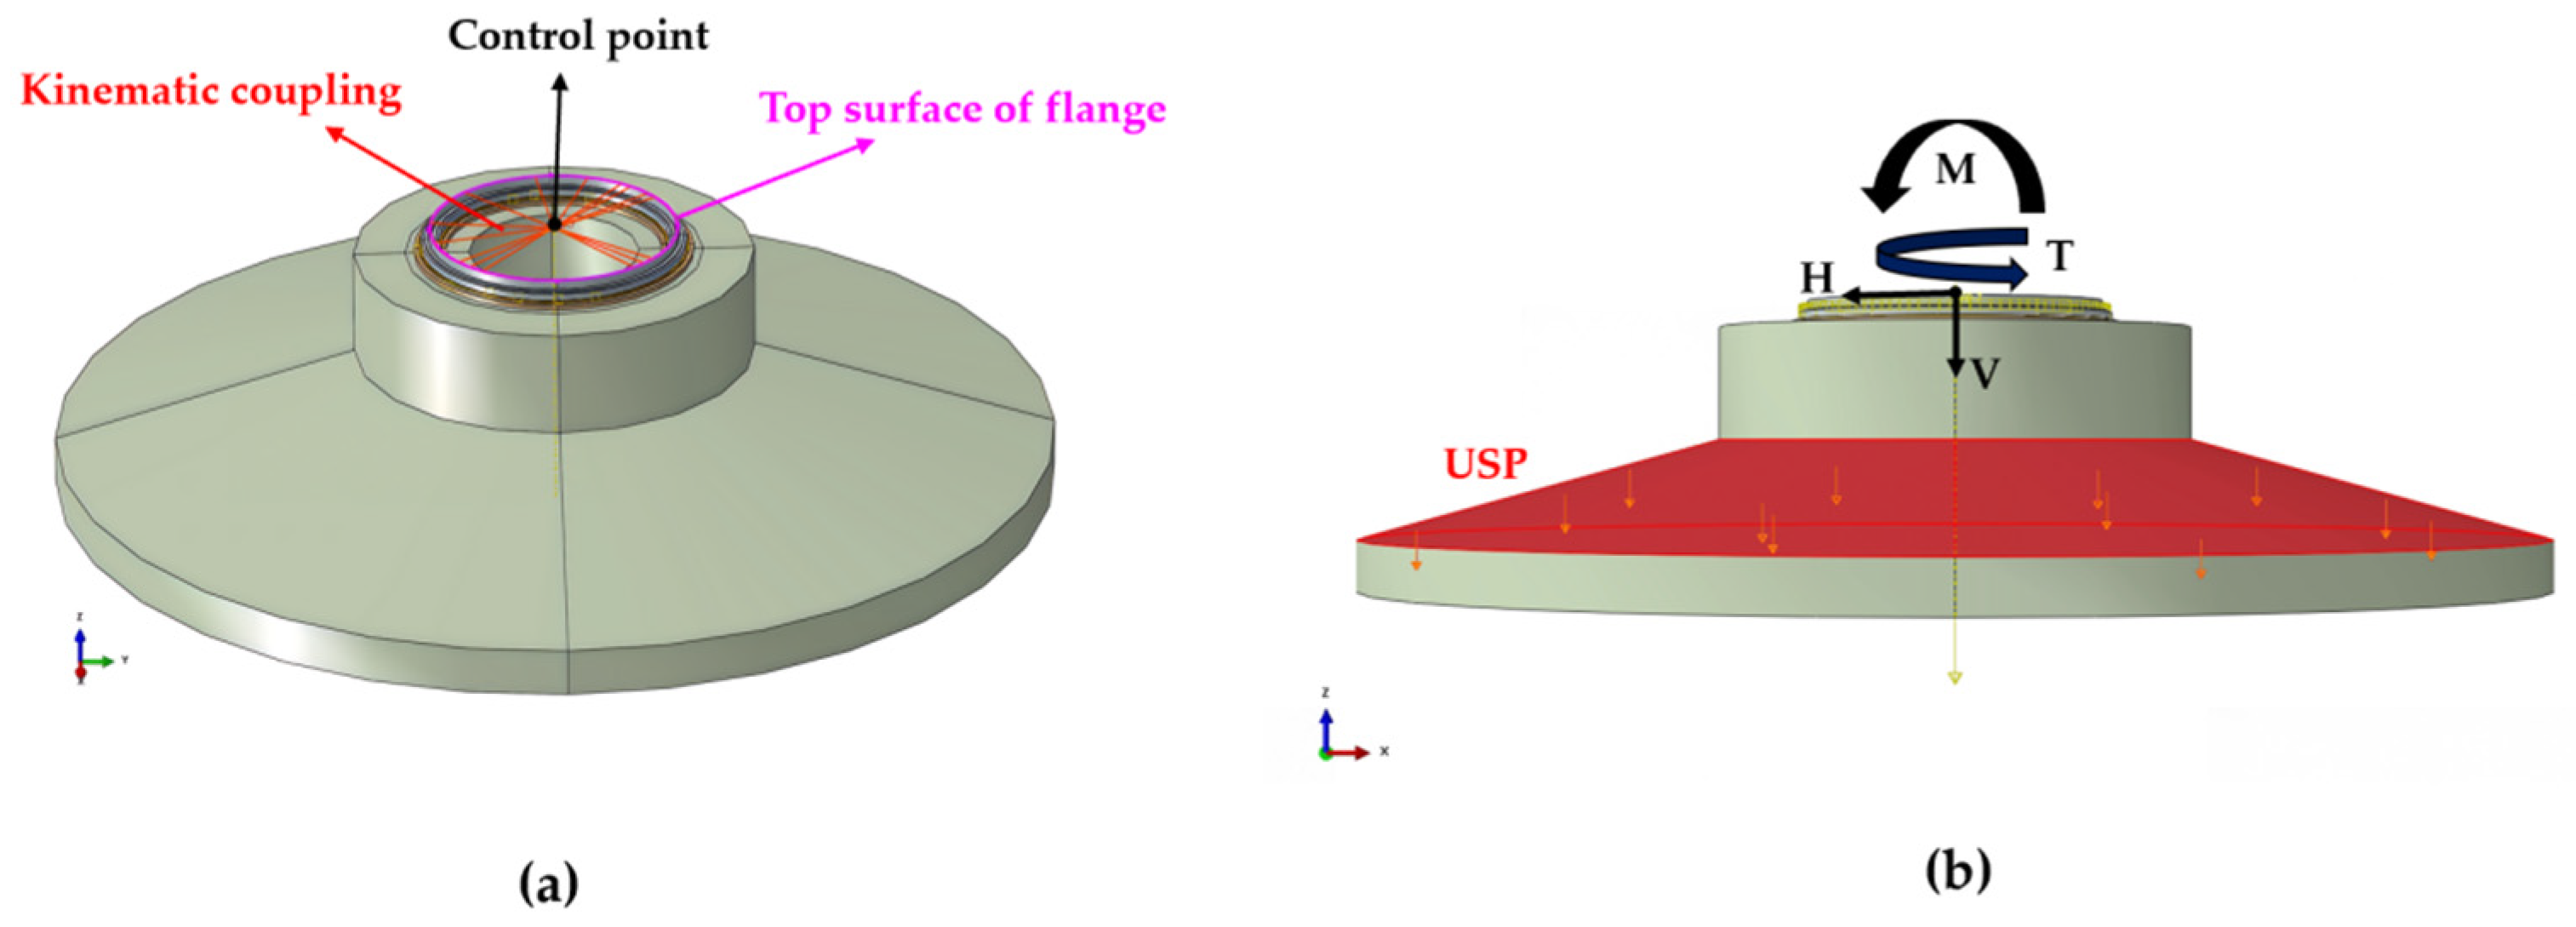
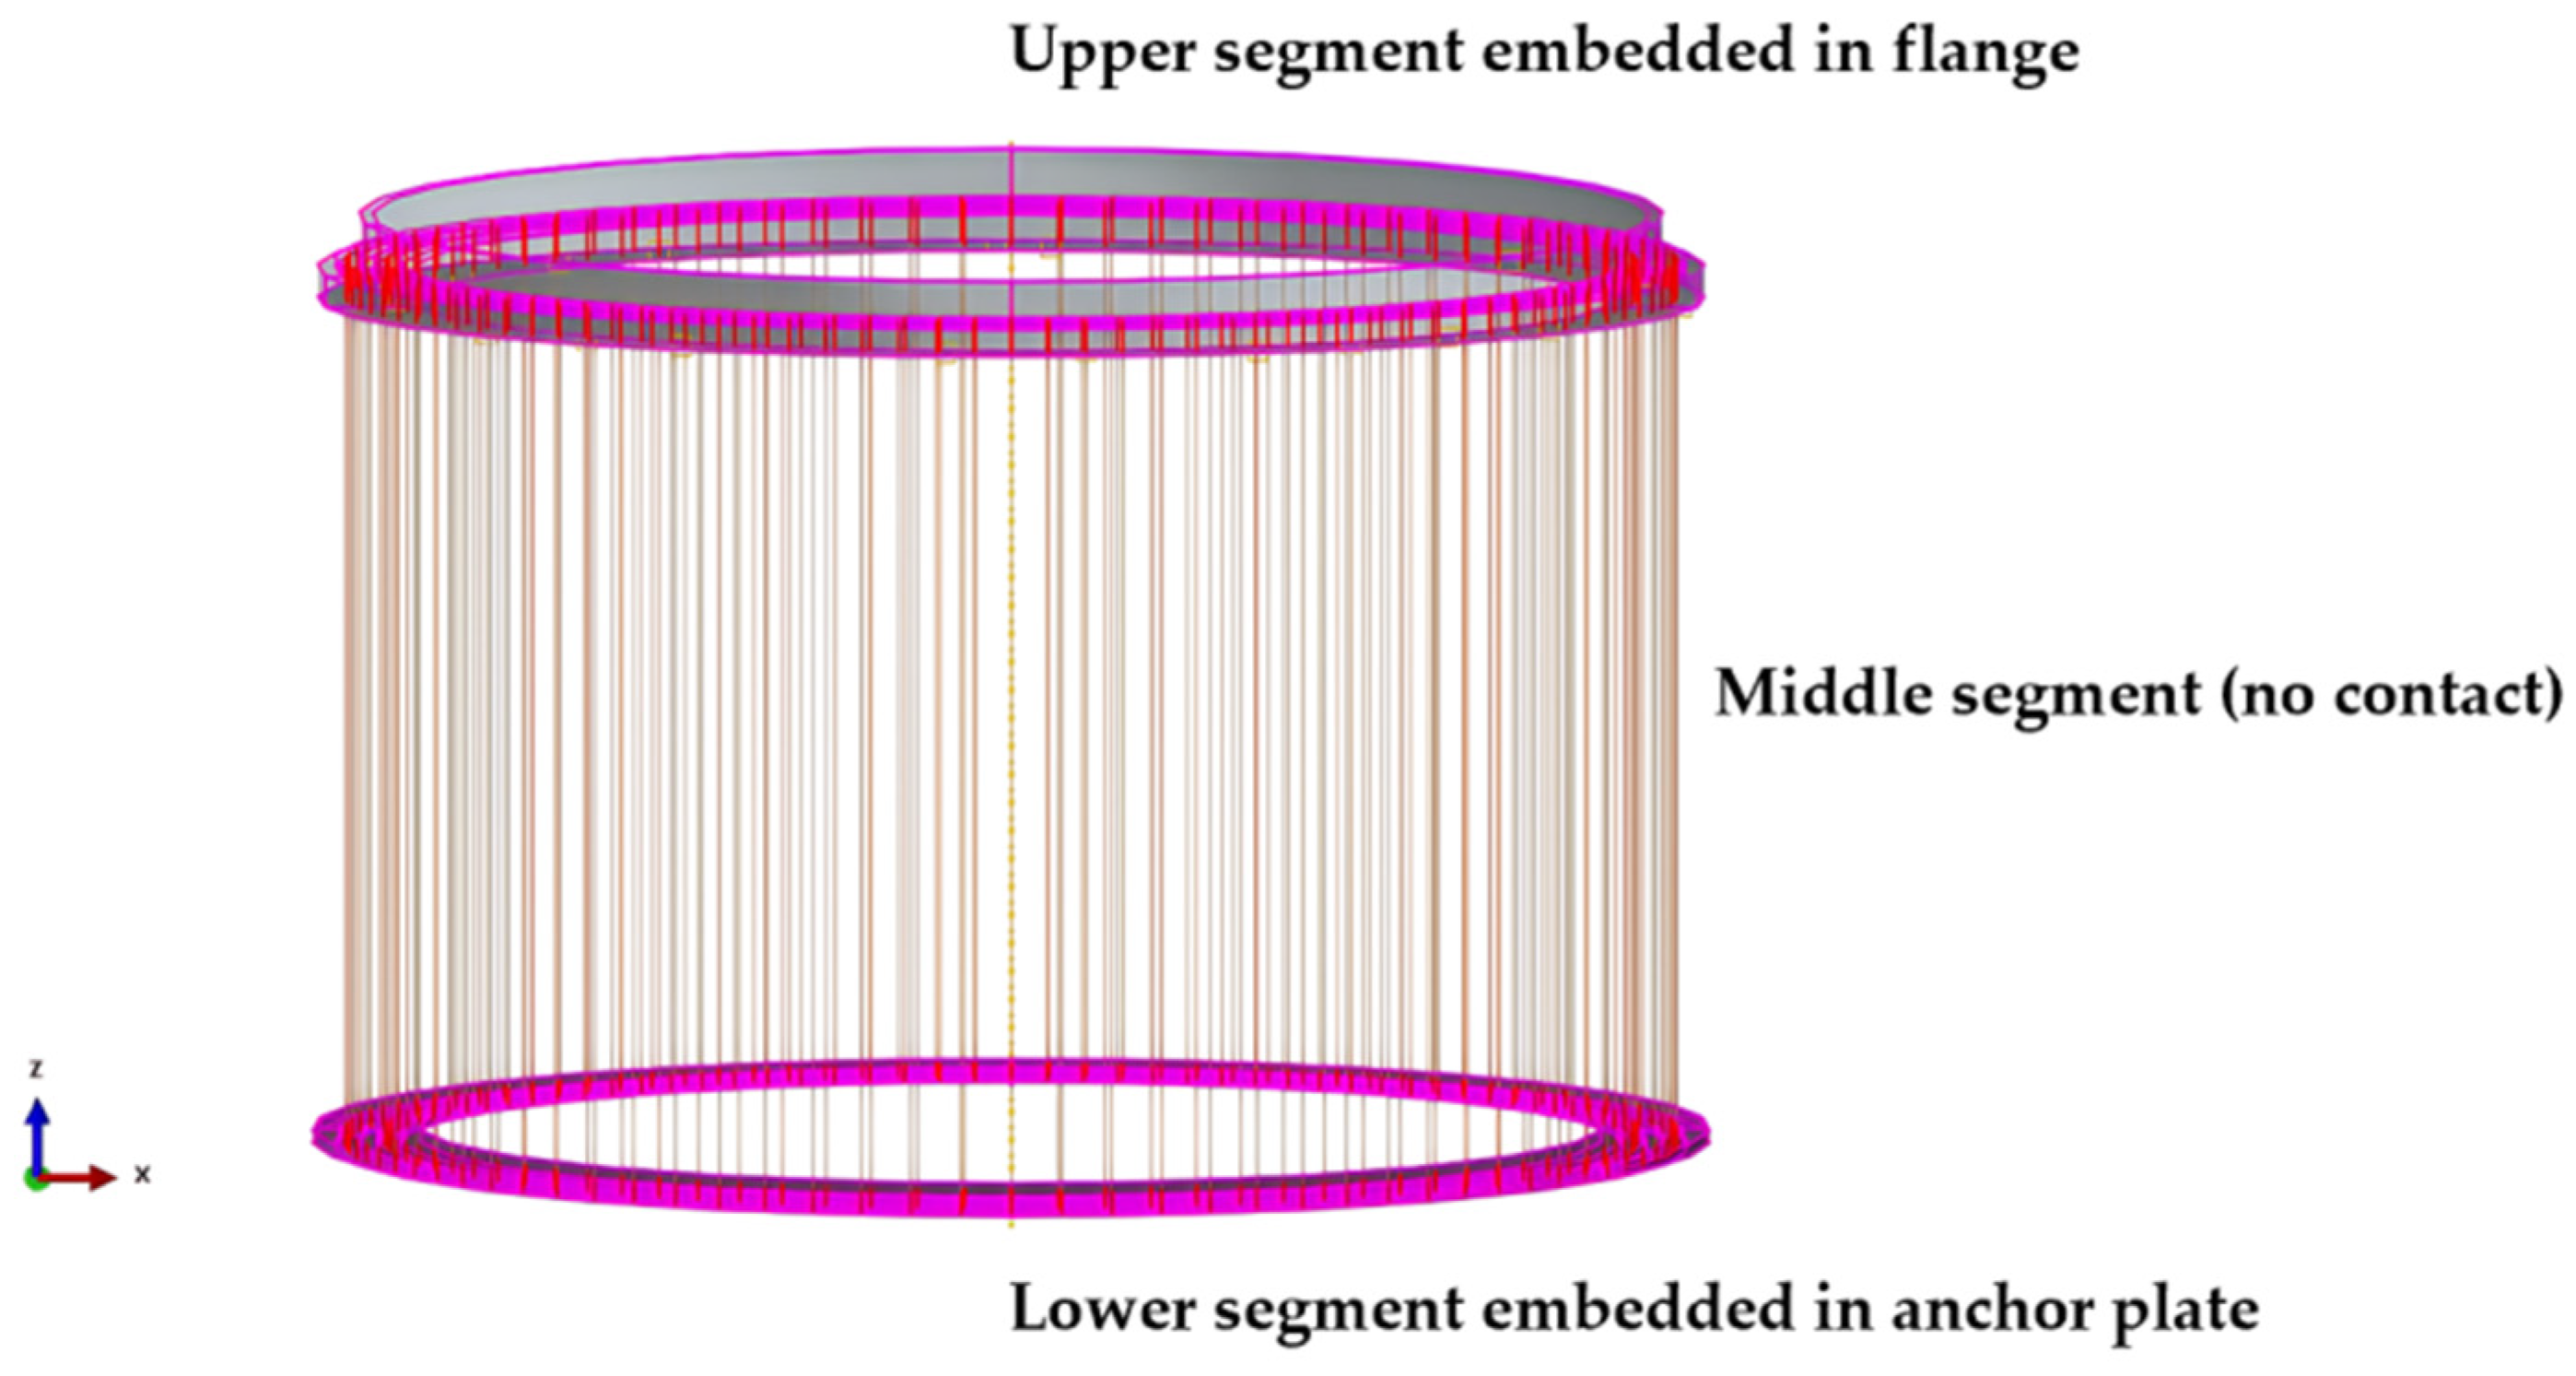
3.3.1. Finite Element Contact and Boundary Conditions
3.3.2. Loading Method and Analysis Steps
4. Response of the Foundation
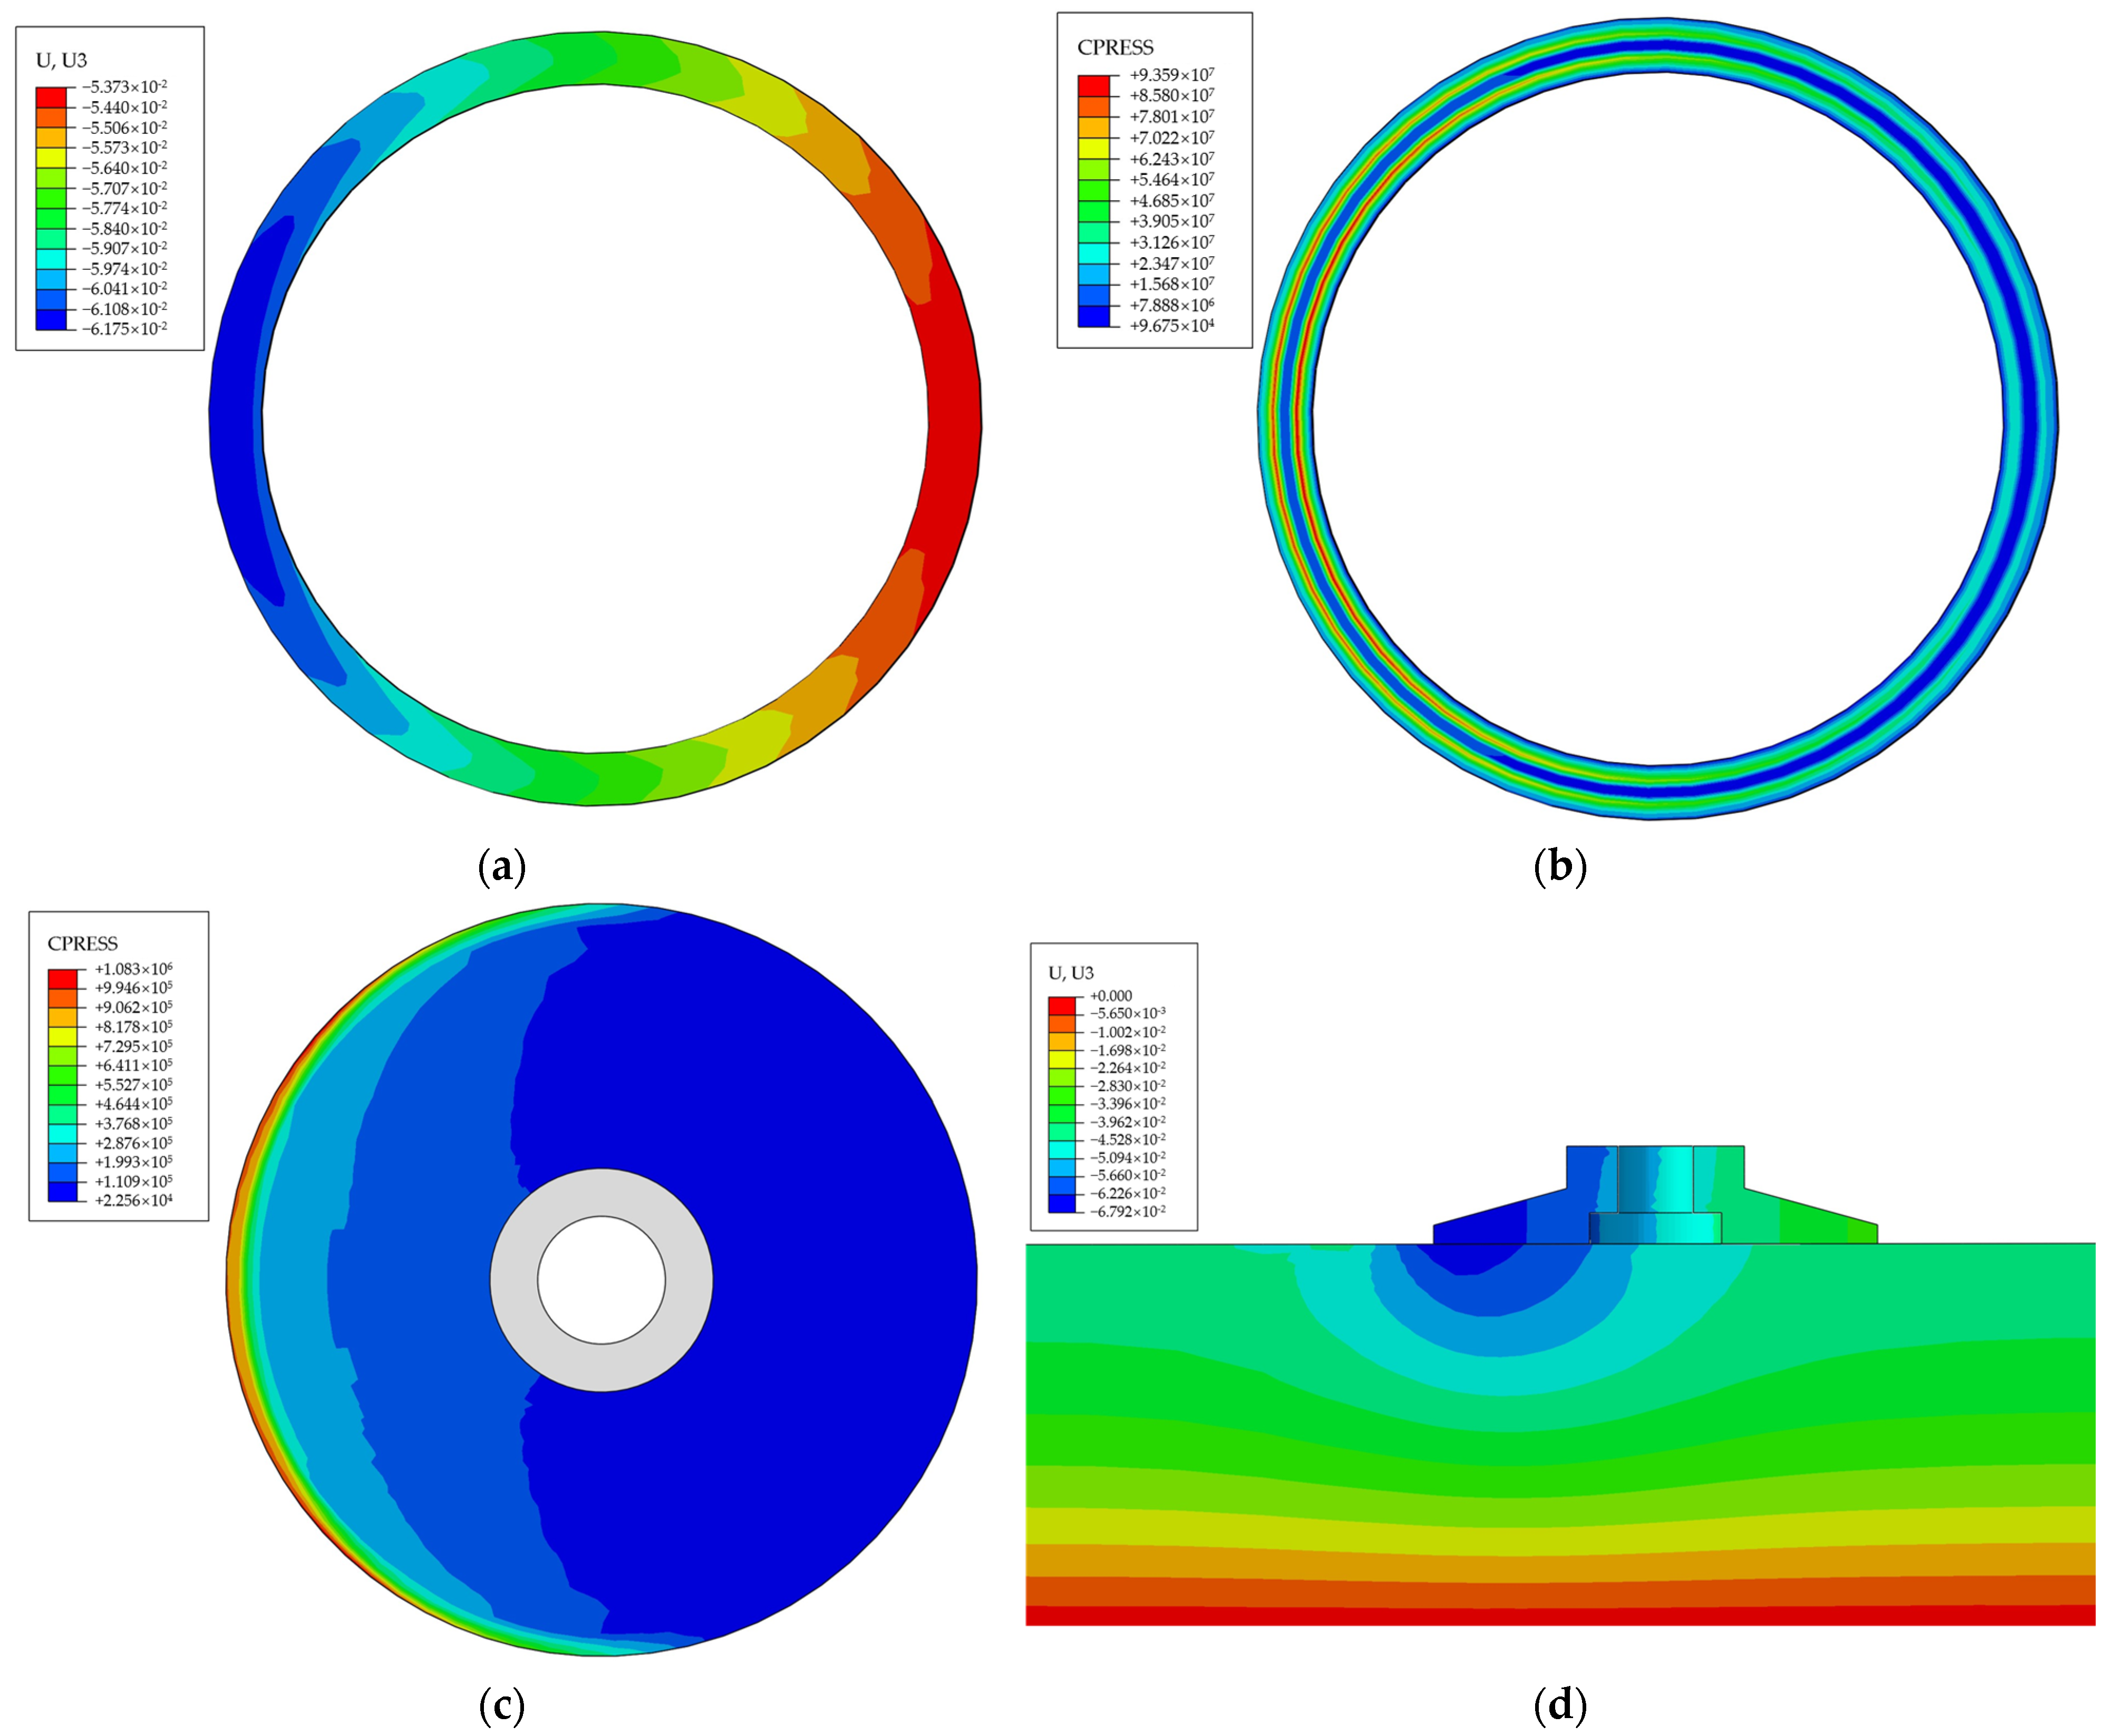
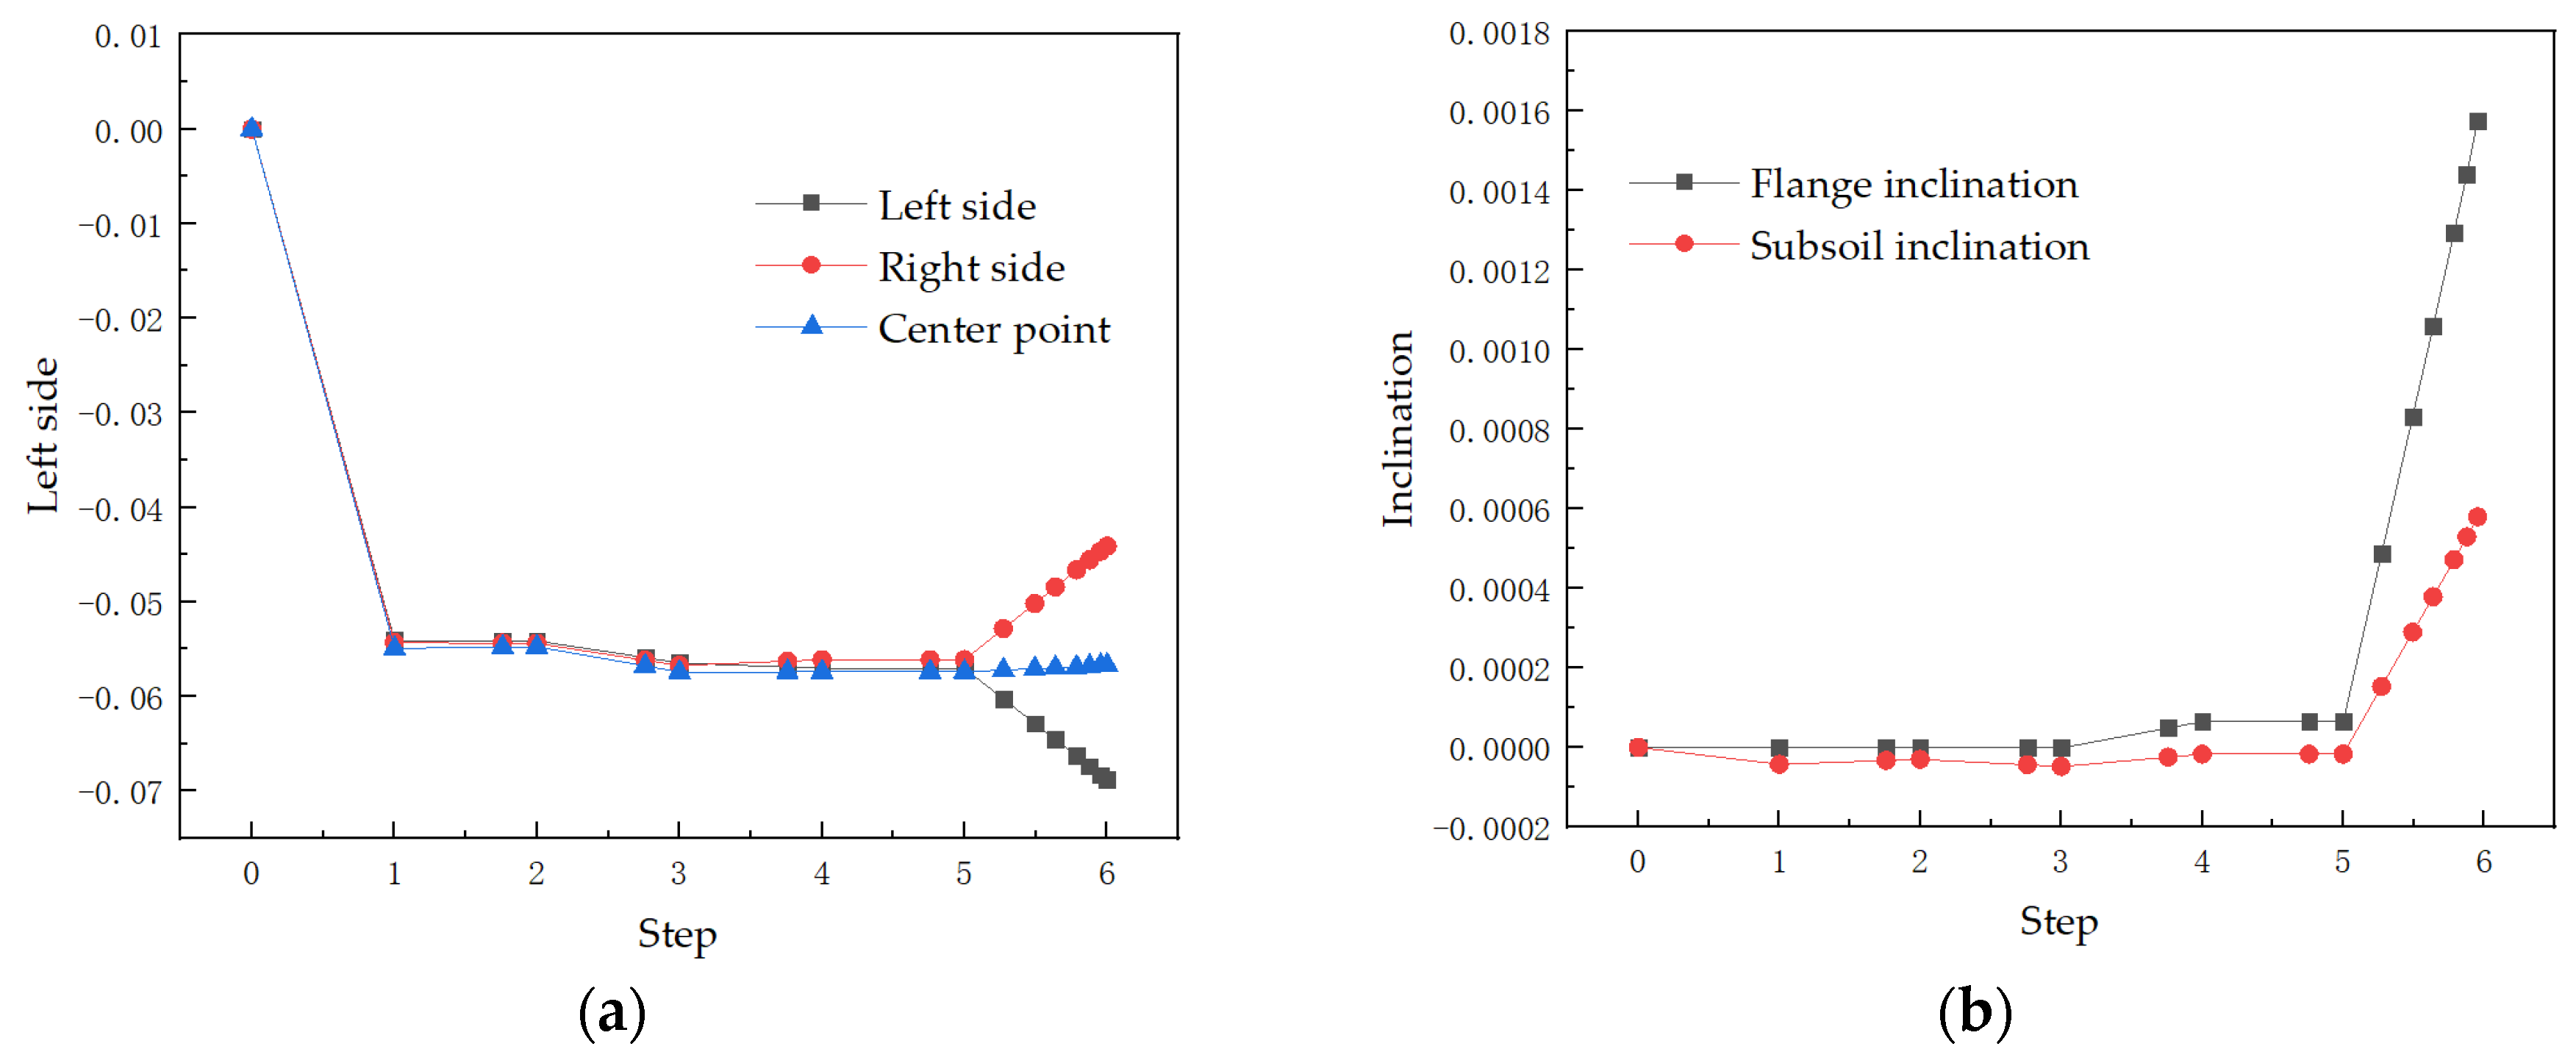
4.1. Stability of the Foundation
4.2. Foundation Stress Analysis
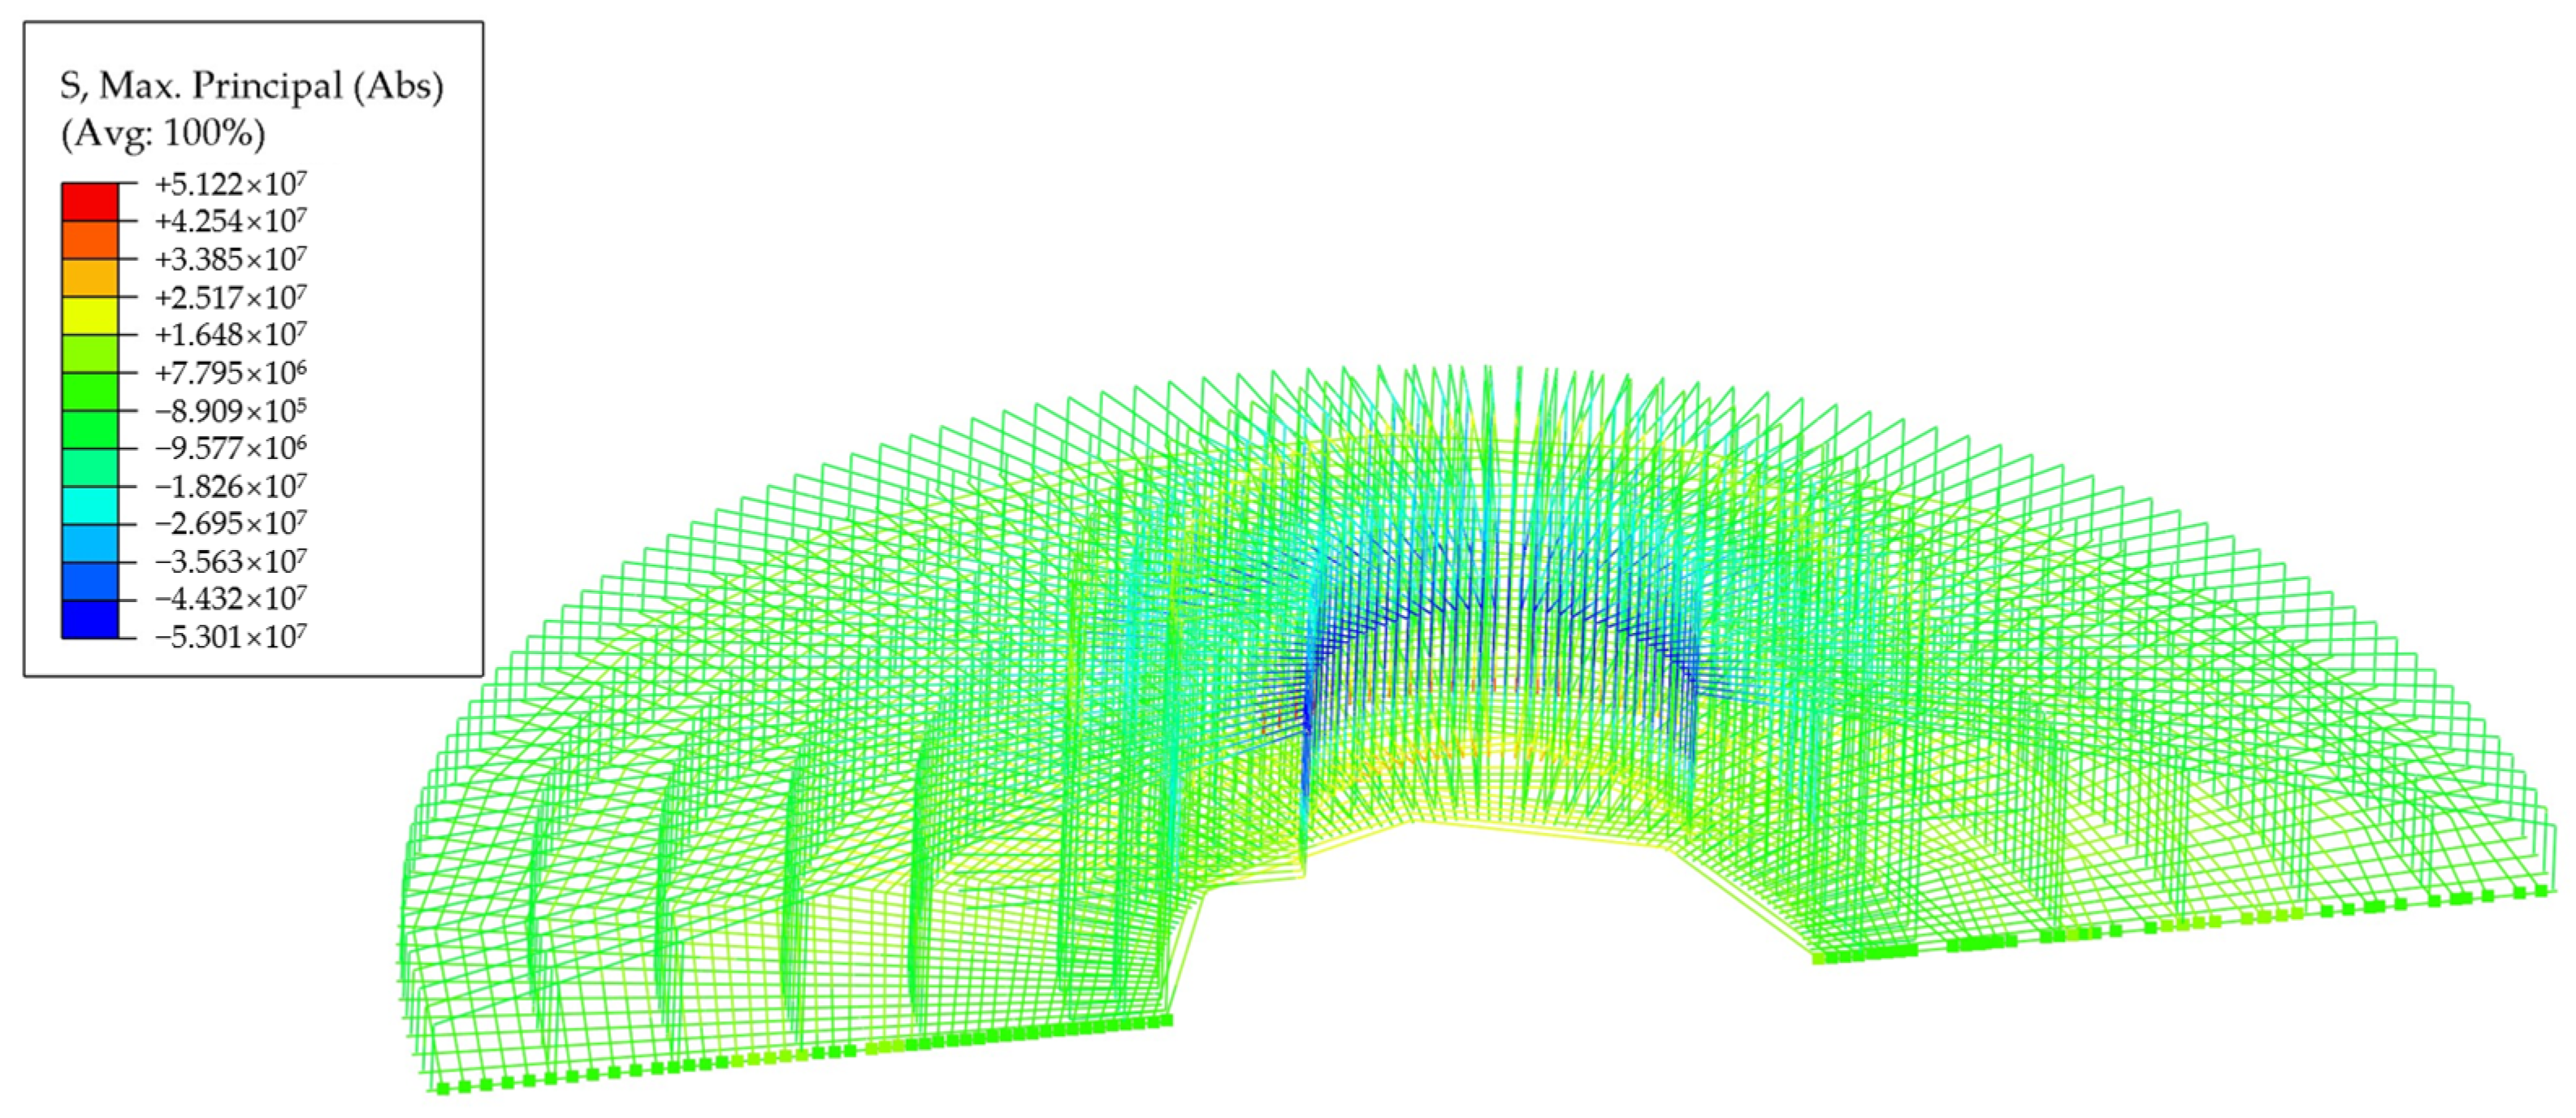
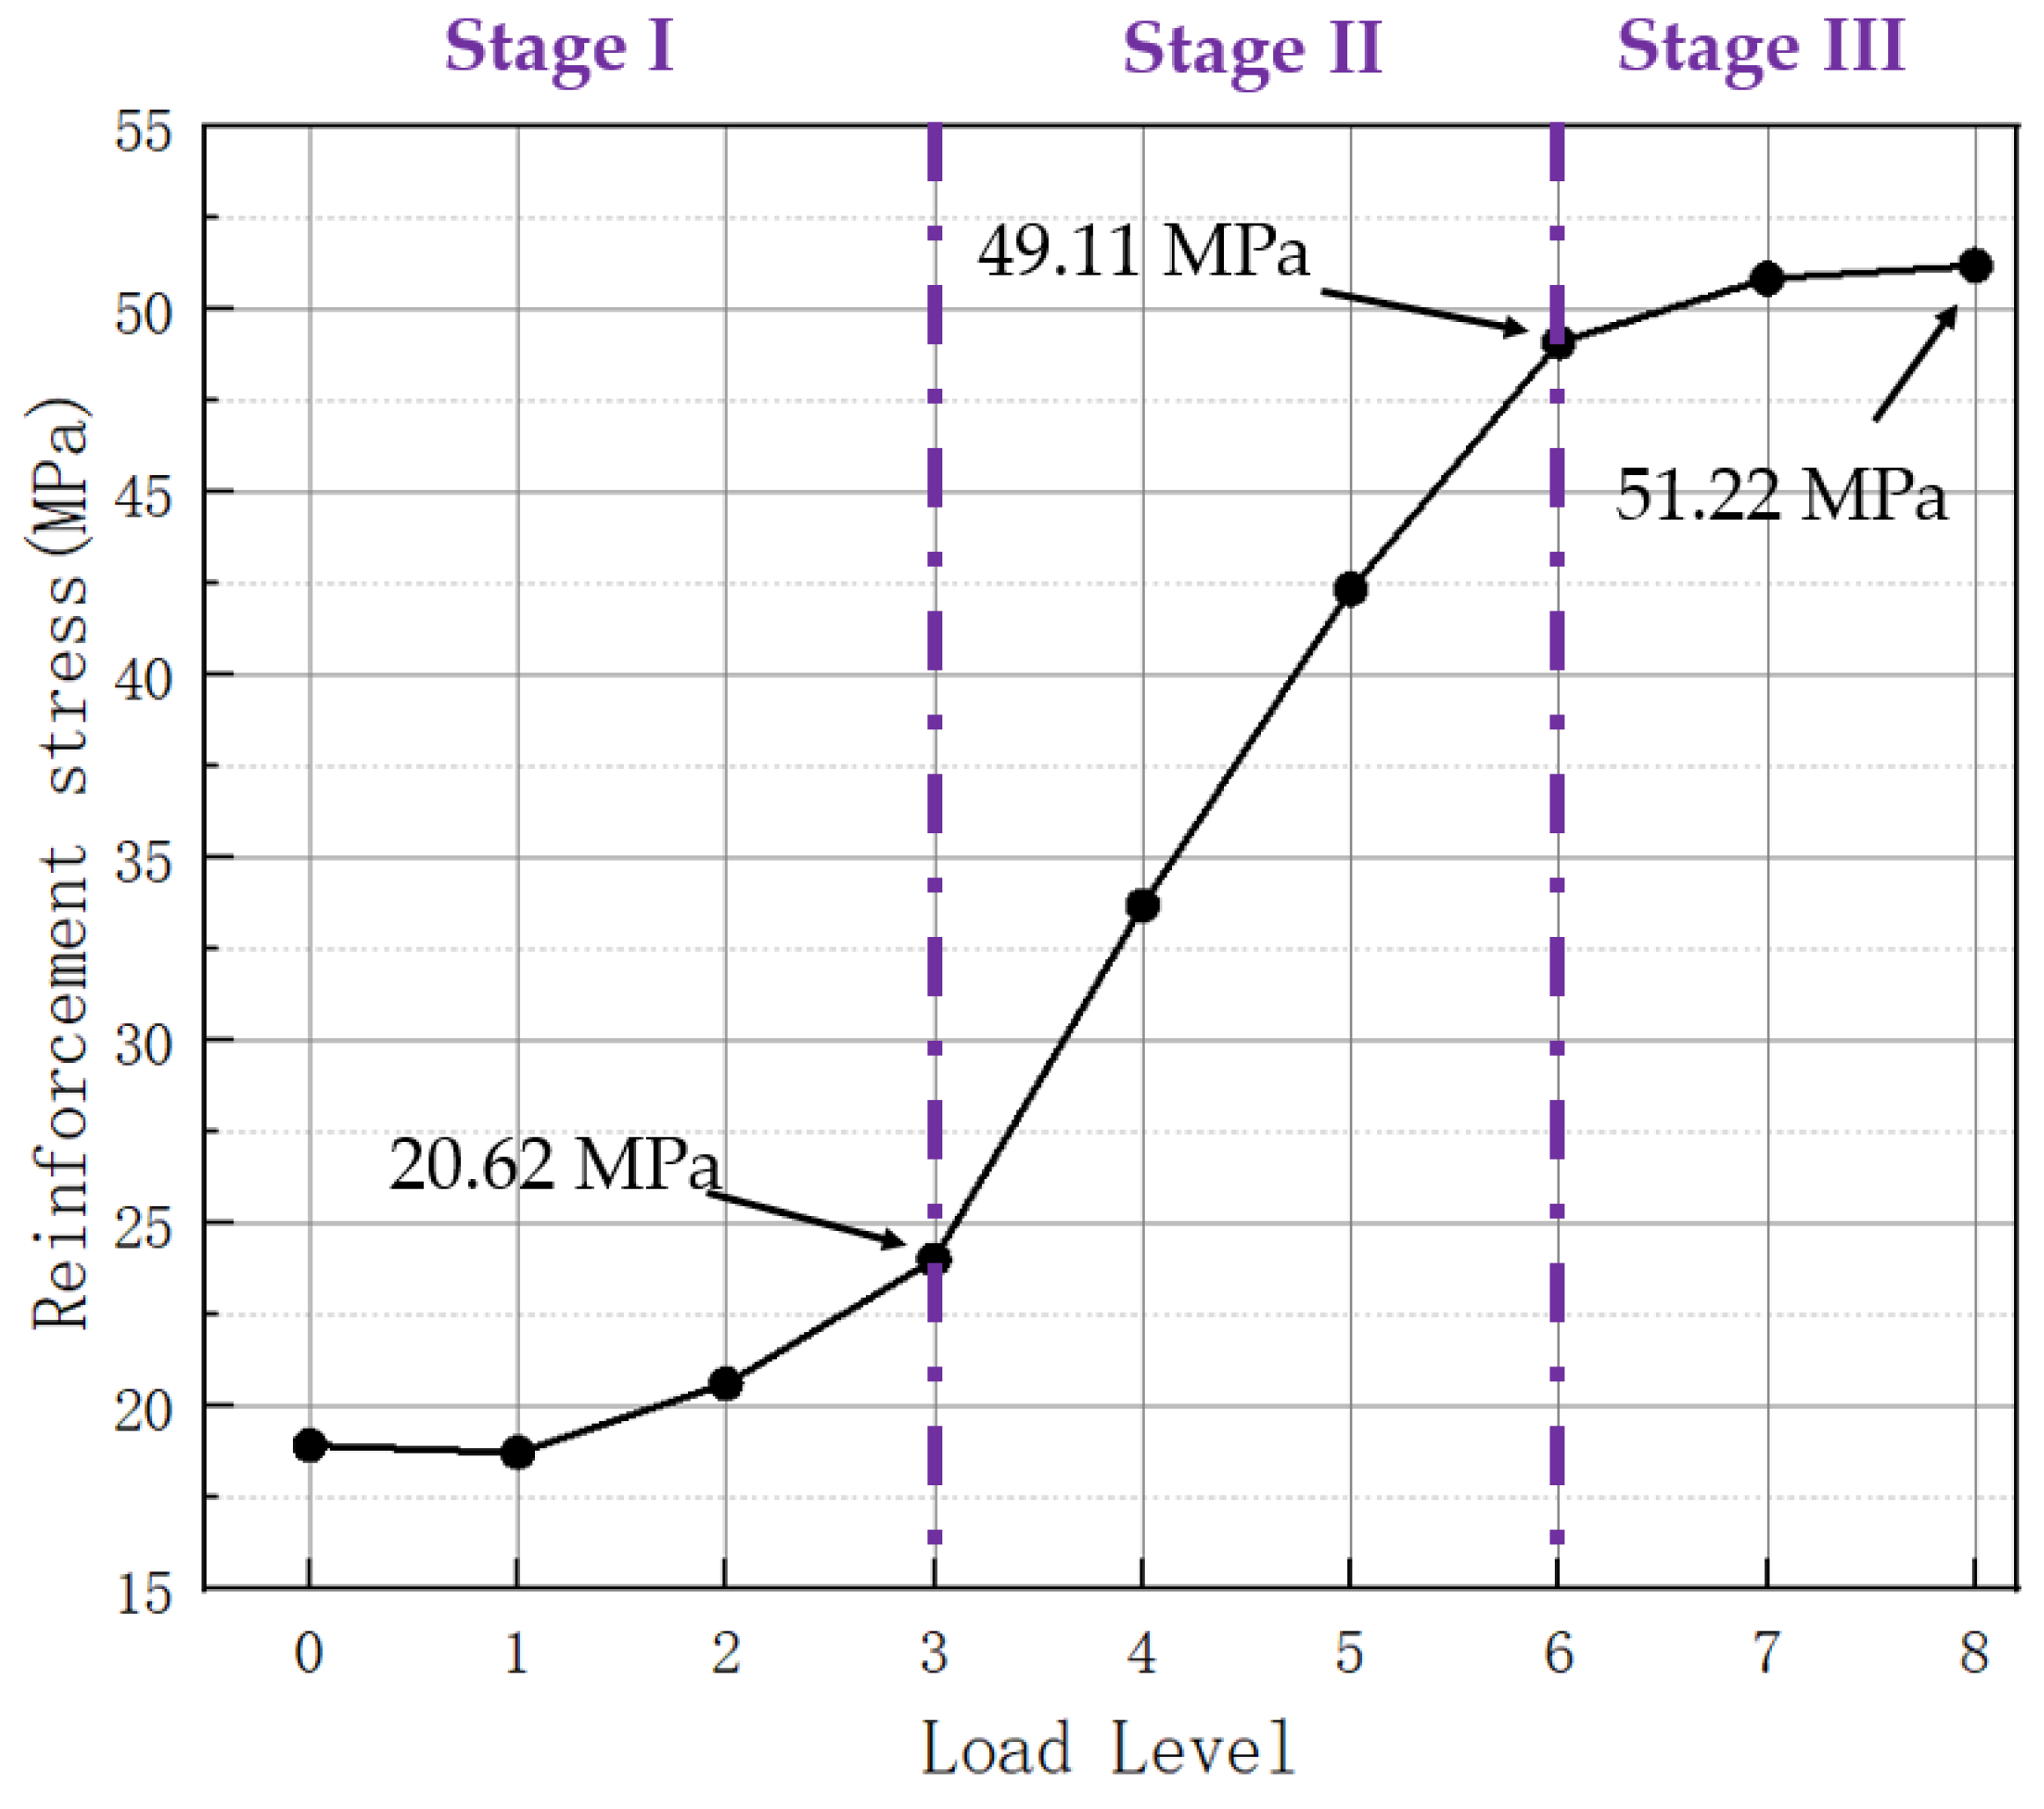
4.2.1. Stress Analysis of the Rebar
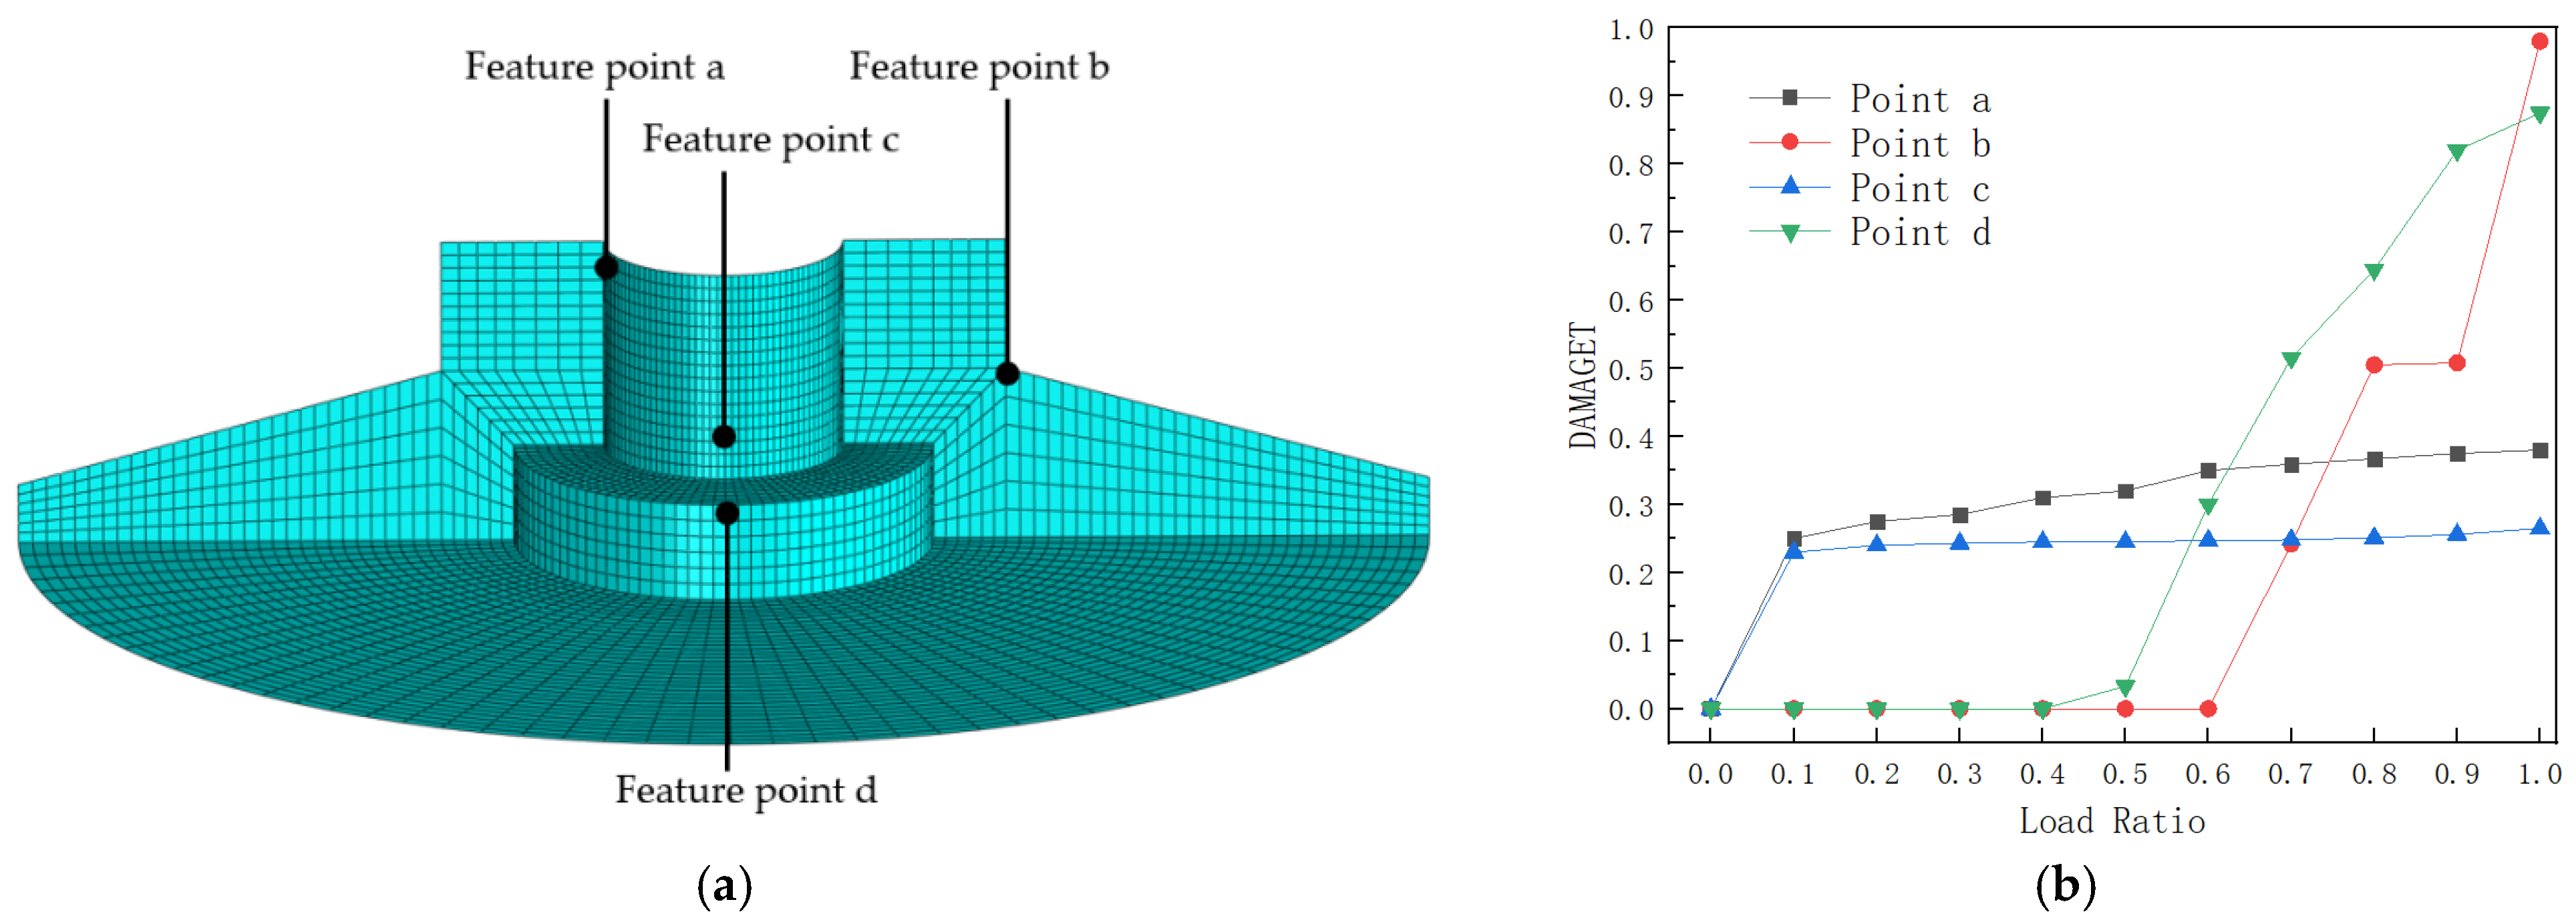
4.2.2. Damage Analysis of Concrete
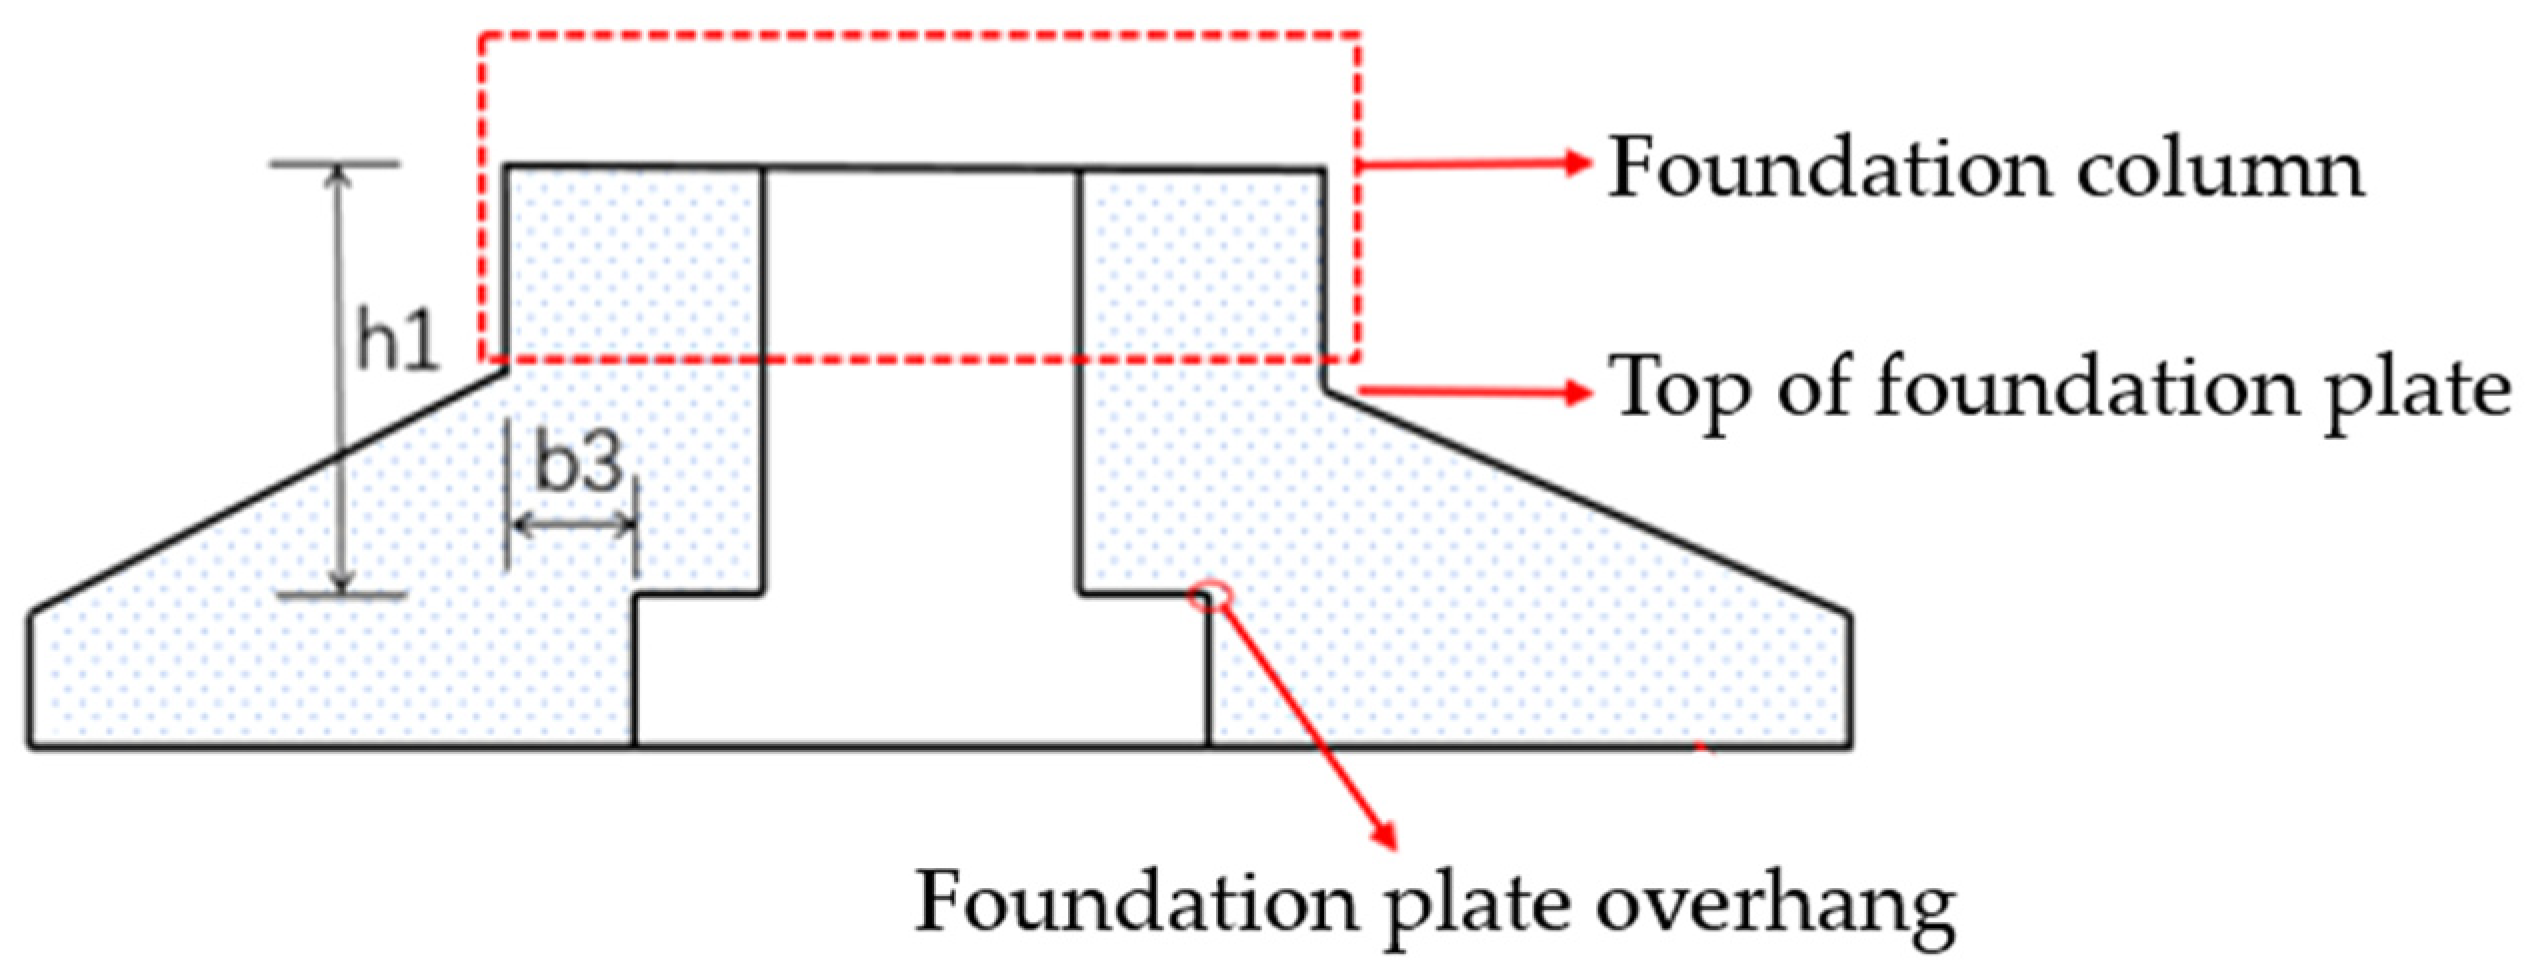
4.3. Size Change Analysis
5. Conclusions
- (1)
- The improved foundation has good stability. The foundation can maintain a small disengagement and tilt under extreme operating loads.
- (2)
- The steel bar stress of the improved foundation under extreme operating load conditions is lower than the yield stress. The feasibility of the reinforcement scheme is verified. At the same time, it is pointed out that the stress of the steel bar increases greatly at the junction of the column and the bottom plate.
- (3)
- The upper bending moment load is the main reason for the damage of foundation materials. The material damage of the foundation is mainly concentrated in the foundation plate and the junction of the foundation plate and the column. The material damage process is a ductile damage process.
- (4)
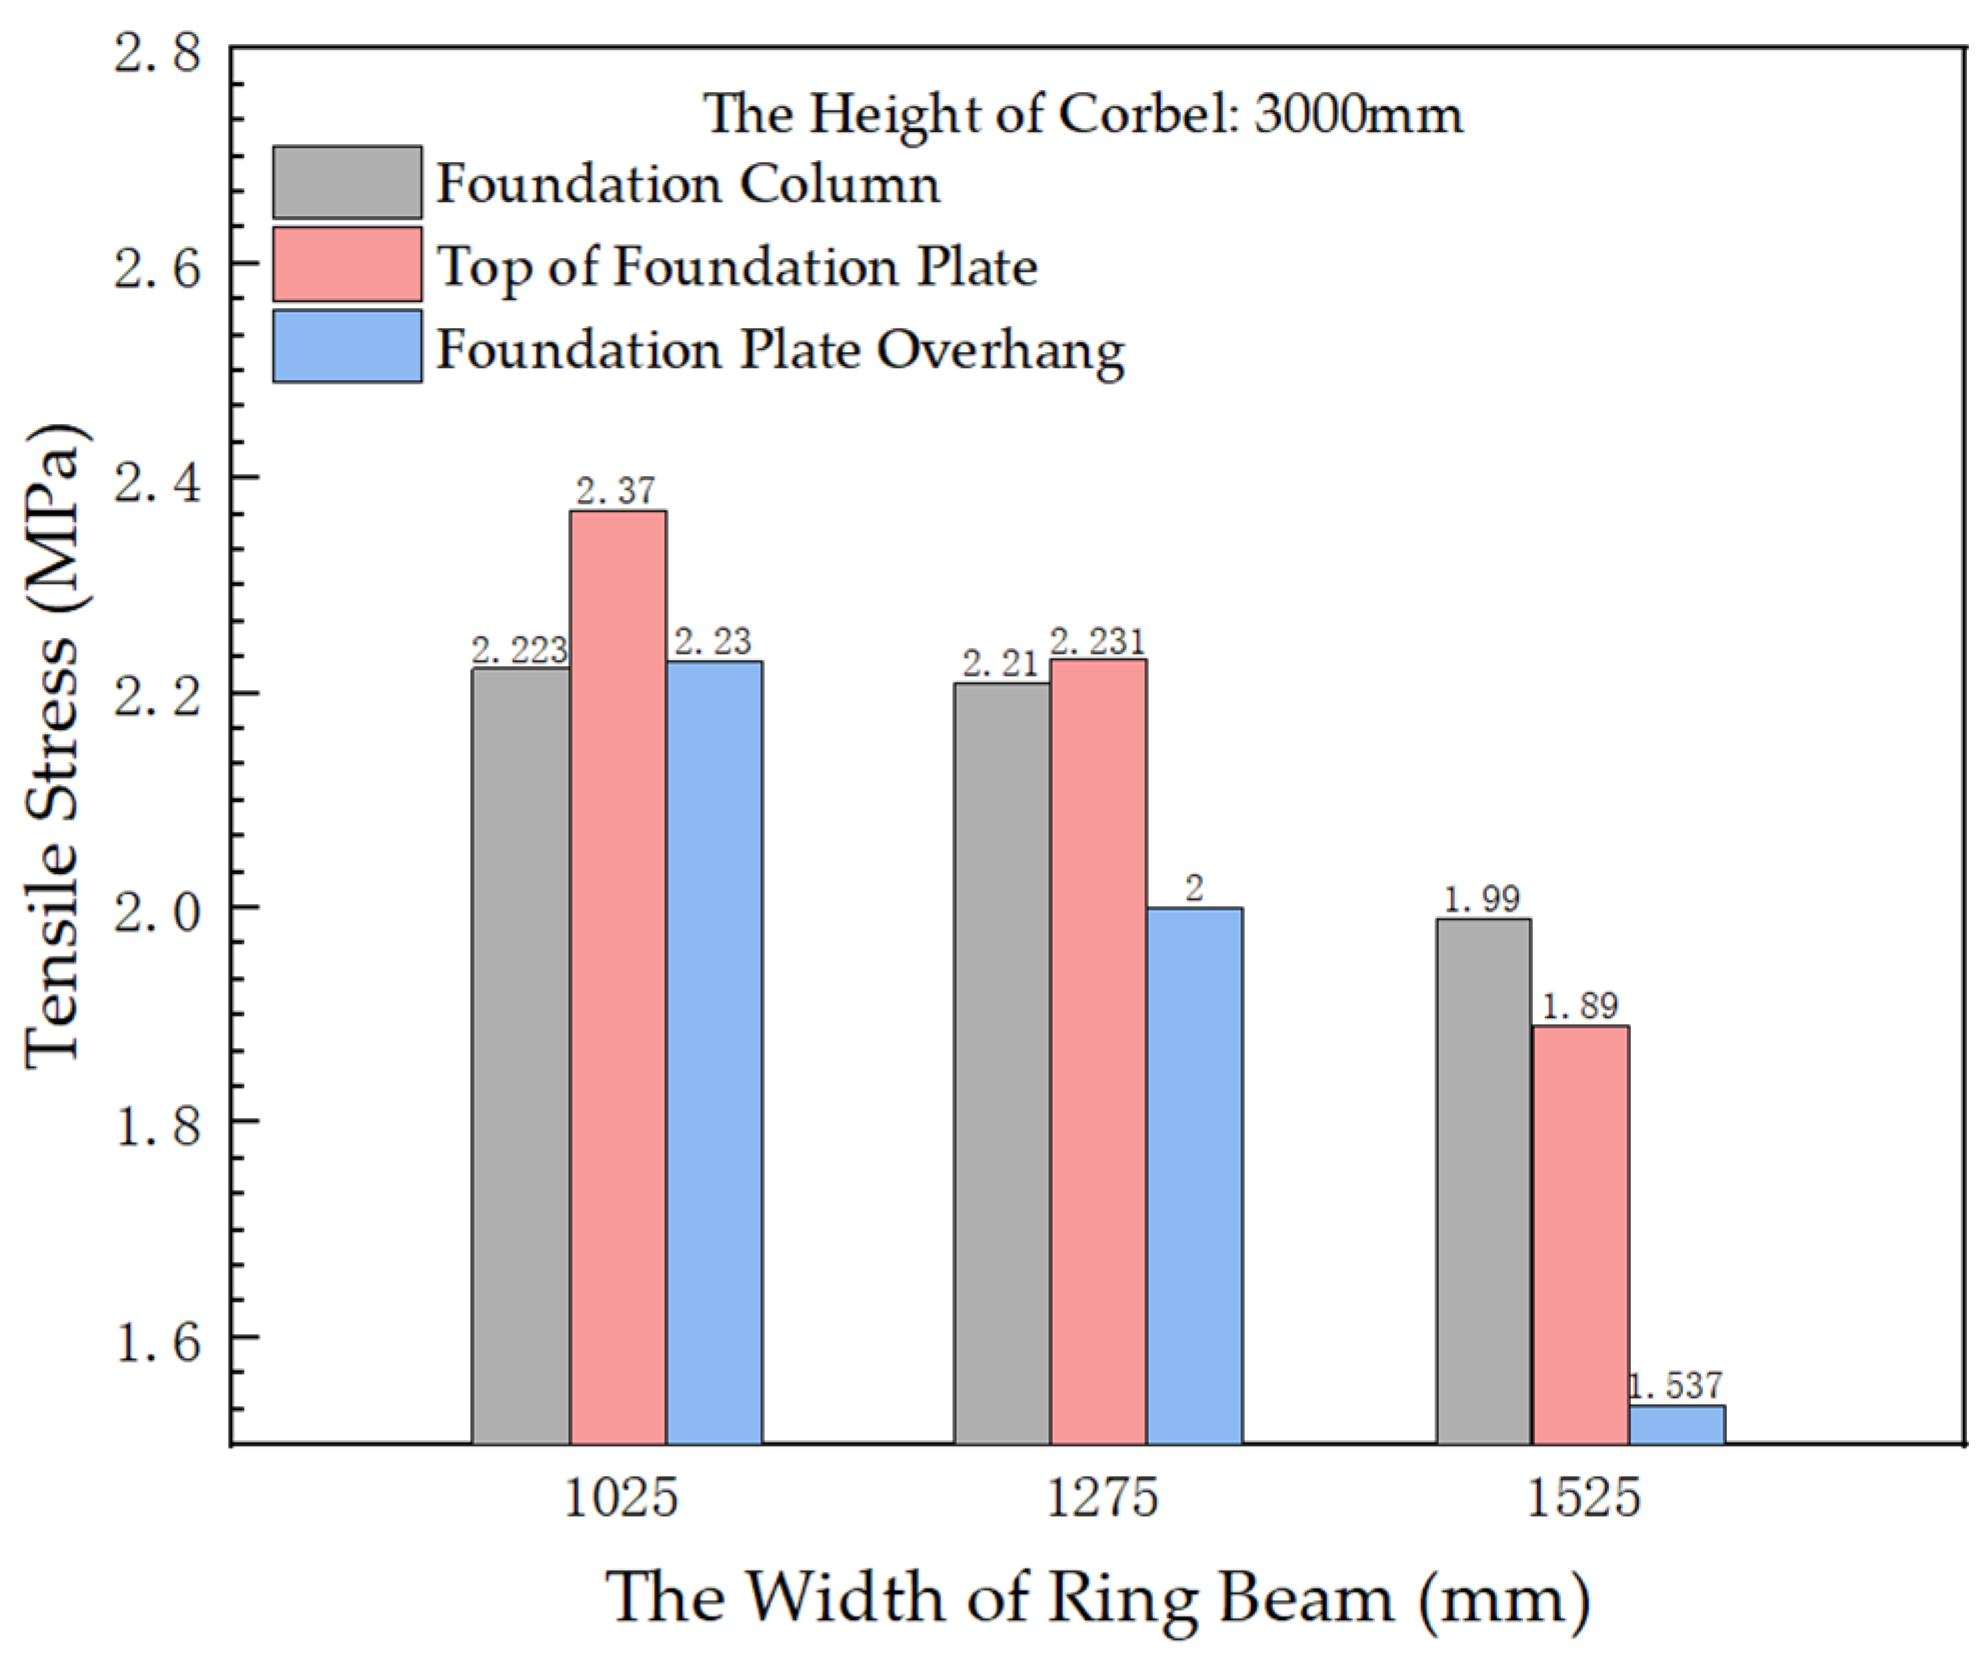
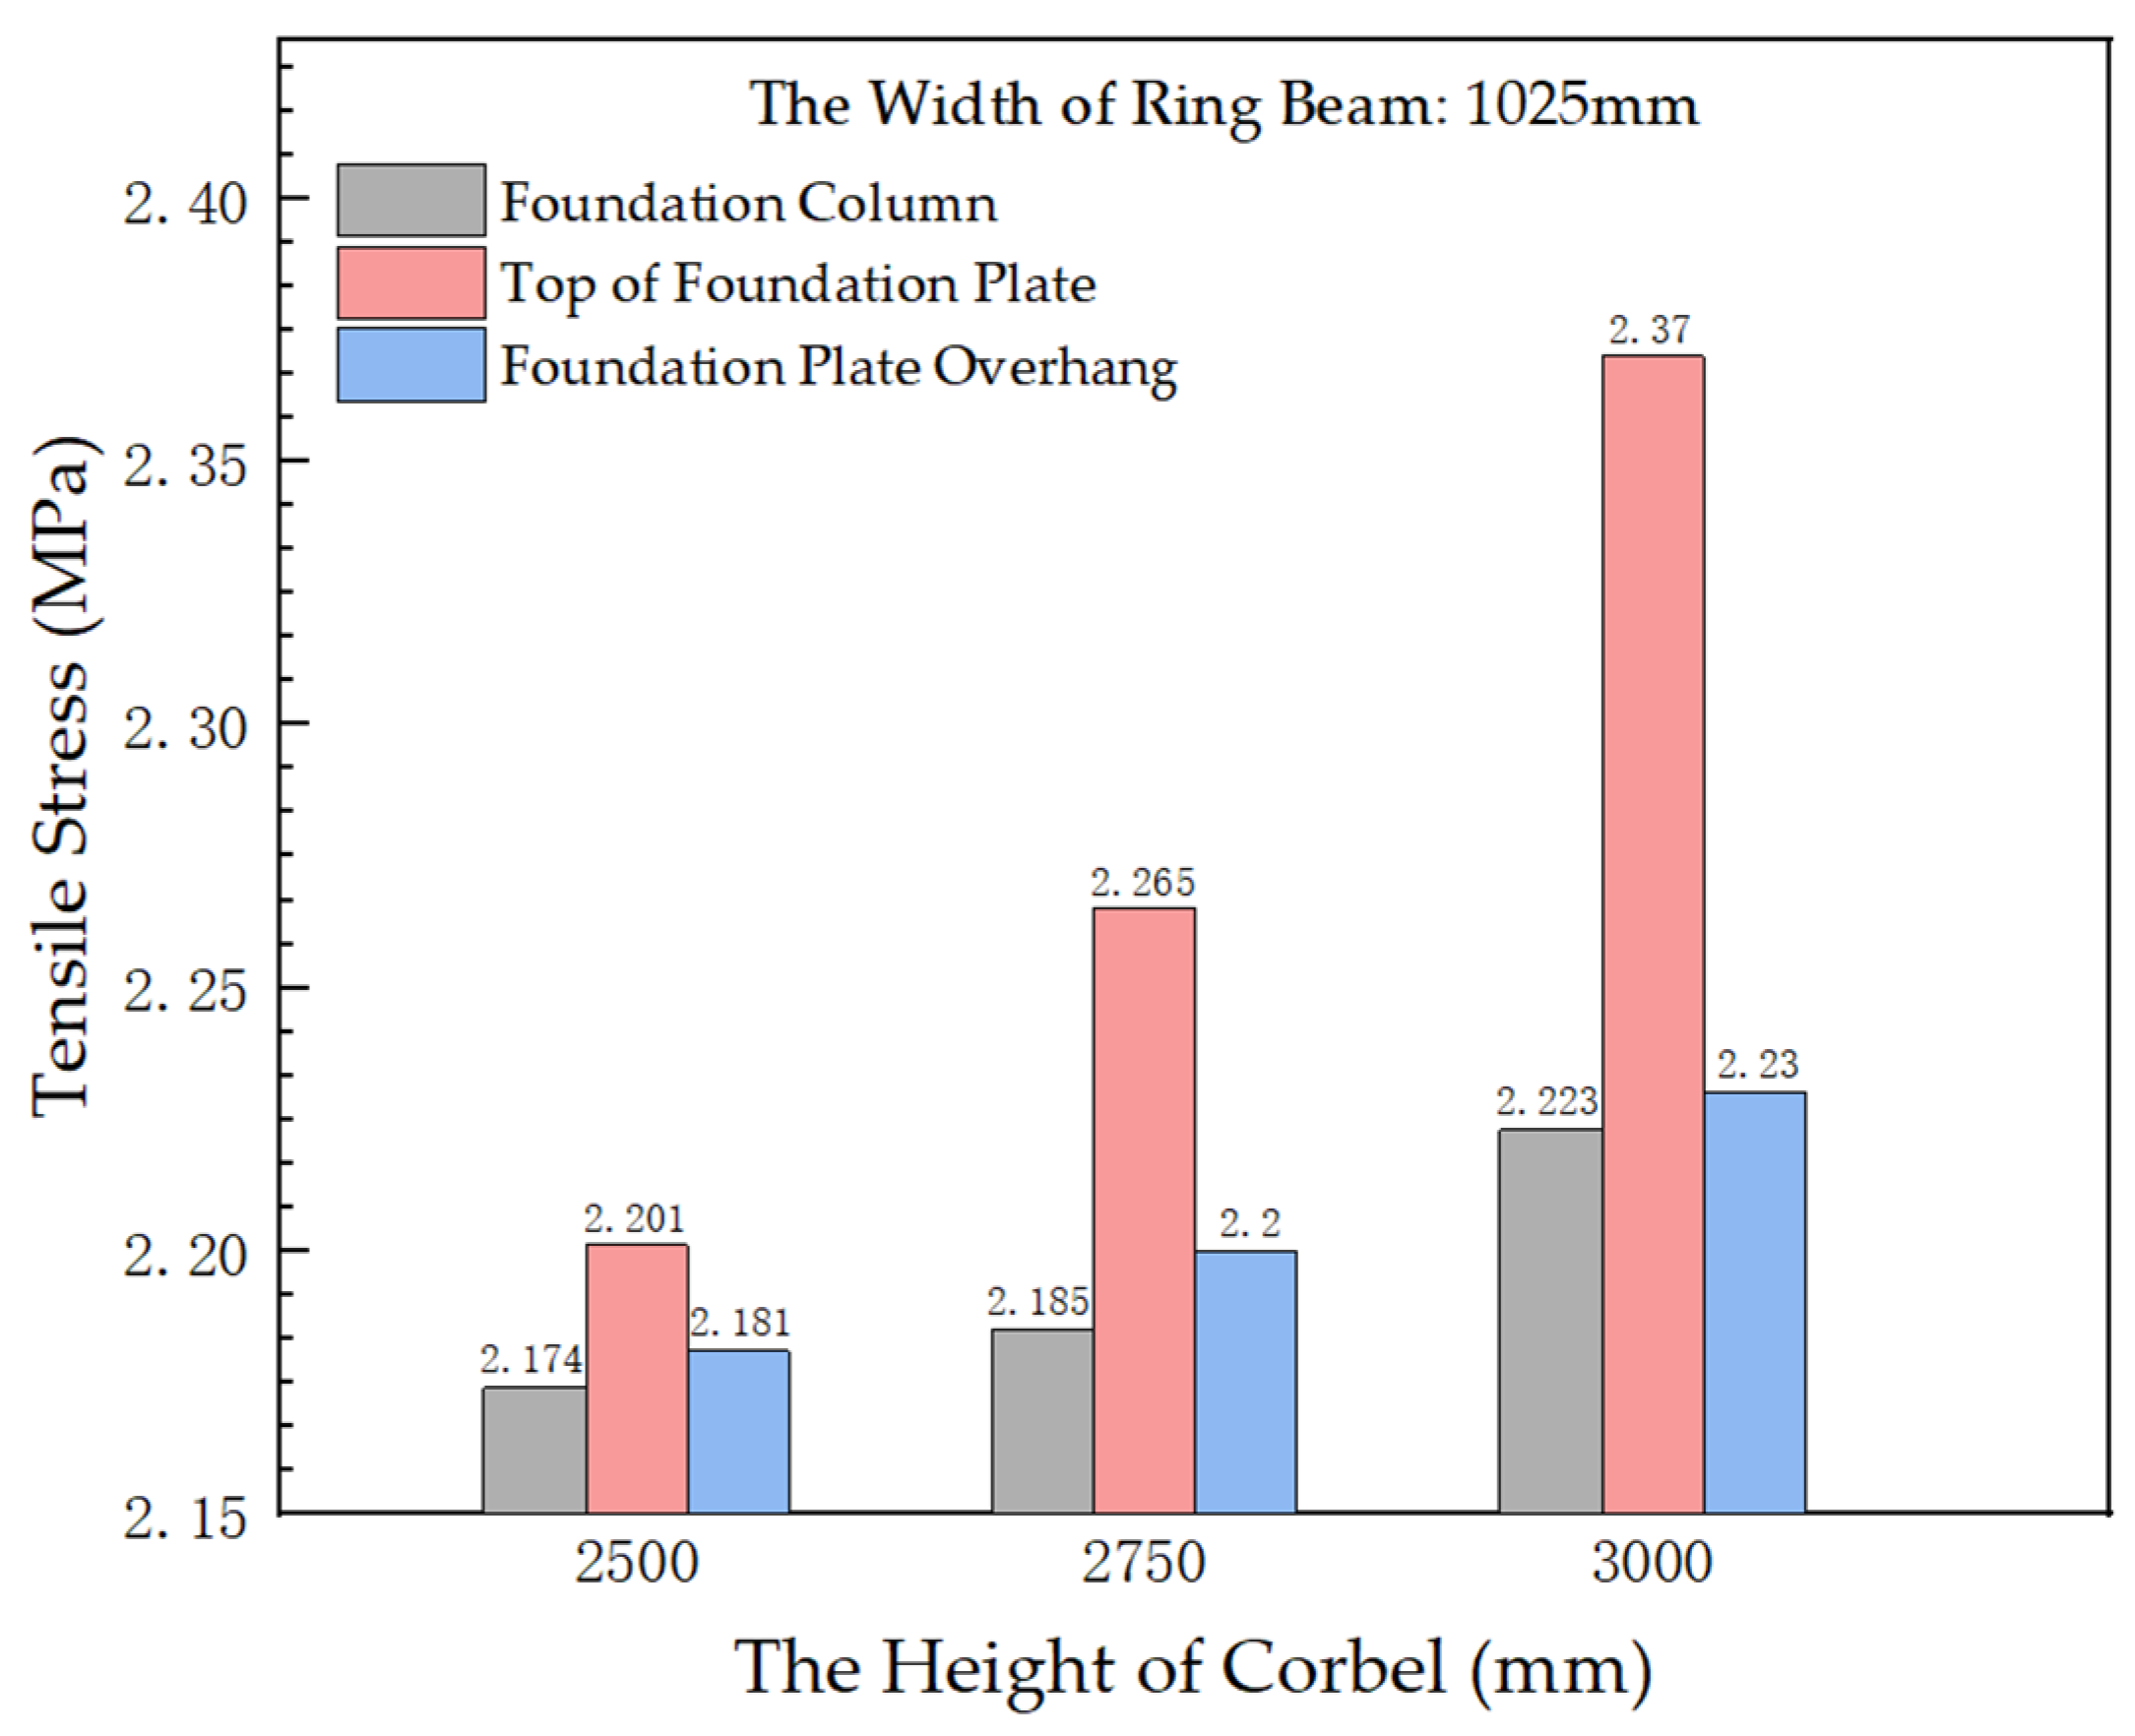
- With the change in foundation size, the stress changes for the concrete in the different upper parts of the foundation are obvious. Under the condition that other dimensions of the foundation remain unchanged, increasing the width of the ring beam (b3) can effectively reduce the maximum tensile stress of the foundation column, the top of the bottom plate, and the cantilever of the bottom plate. The maximum tensile stress at these places also increases with an increase in corbel height (h1).
Author Contributions
Funding
Institutional Review Board Statement
Informed Consent Statement
Data Availability Statement
Conflicts of Interest
References
- Global Wind Report 2023; Global Wind Energy Council: Brussels, Belgium, 2023.
- Renewable Energy Market Update Outlook for 2023 and 2024; International Energy Agency: Paris, France, 2023.
- Guo, Y.; Zhang, P.; Ding, H.; Le, C. Design and verification of the loading system and boundary conditions for wind turbine foundation model experiment. Renew. Energy 2021, 172, 16–33. [Google Scholar] [CrossRef]
- Negro, V.; López-Gutiérrez, J.-S.; Esteban, M.D.; Matutano, C. Uncertainties in the design of support structures and foundations for offshore wind turbines. Renew. Energy 2014, 63, 125–132. [Google Scholar] [CrossRef]
- McAlorum, J.; Perry, M.; Fusiek, G.; Niewczas, P.; McKeeman, I.; Rubert, T. Deterioration of cracks in onshore wind turbine foundations. Eng. Struct. 2018, 167, 121–131. [Google Scholar] [CrossRef]
- Amponsah, E.; Wu, Z.; Feng, Q.; Wang, Z.; Kwame Mantey, S. Analysis of crack propagation in onshore wind turbine foundations using the double-K fracture model. Structures 2022, 41, 925–942. [Google Scholar] [CrossRef]
- Bai, X.; He, M.; Ma, R.; Huang, D.; Chen, J. Modelling fatigue degradation of the compressive zone of concrete in onshore wind turbine foundations. Constr. Build. Mater. 2017, 132, 425–437. [Google Scholar] [CrossRef]
- Puruncajas, B.; Vidal, Y.; Tutivén, C. Vibration-Response-Only Structural Health Monitoring for Offshore Wind Turbine Jacket Foundations via Convolutional Neural Networks. Sensors 2020, 20, 3429. [Google Scholar] [CrossRef]
- He, B.; Feng, Y. Vibration Theoretical Analysis of Elastically Connected Multiple Beam System under the Moving Oscillator. Adv. Civ. Eng. 2019, 2019, 4950841. [Google Scholar] [CrossRef]
- Kiani, K. Nonlocal discrete and continuous modeling of free vibration of stocky ensembles of vertically aligned single-walled carbon nanotubes. Curr. Appl. Phys. 2014, 14, 1116–1139. [Google Scholar] [CrossRef]
- Kiani, K. Nonlocal and shear effects on column buckling of single-layered membranes from stocky single-walled carbon nanotubes. Compos. Part B Eng. 2015, 79, 535–552. [Google Scholar] [CrossRef]
- Kiani, K. Free vibration of in-plane-aligned membranes of single-walled carbon nanotubes in the presence of in-plane-unidirectional magnetic fields. J. Vib. Control 2016, 22, 3736–3766. [Google Scholar] [CrossRef]
- Li, Y.X.; Gong, J. Free and forced vibration analysis of general multiple beam systems. Int. J. Mech. Sci. 2022, 235, 107716. [Google Scholar] [CrossRef]
- Mao, Q. Free vibration analysis of elastically connected multiple-beams by using the Adomian modified decomposition method. J. Sound Vib. 2012, 331, 2532–2542. [Google Scholar] [CrossRef]
- Stojanović, V.; Kozić, P.; Janevski, G. Exact closed-form solutions for the natural frequencies and stability of elastically connected multiple beam system using Timoshenko and high-order shear deformation theory. J. Sound Vib. 2013, 332, 563–576. [Google Scholar] [CrossRef]
- Wang, L.; Zhong, R.; Liu, L. Resonance characteristics of onshore wind turbine tower structure considering the impedance of piled foundations. Arab. J. Geosci. 2020, 13, 163. [Google Scholar] [CrossRef]
- Deng, Z.-W.; Fan, Z.-J.; Zhou, Y.-M.; Deng, P.-Y. Study on Dynamic Response Characteristics of Circular Extended Foundation of Large Wind Turbine Generator. Sustainability 2022, 14, 14213. [Google Scholar] [CrossRef]
- Harte, M.; Basu, B.; Nielsen, S.R.K. Dynamic analysis of wind turbines including soil-structure interaction. Eng. Struct. 2012, 45, 509–518. [Google Scholar] [CrossRef]
- Du, H.; Du, S.; Li, W. Probabilistic time series forecasting with deep non-linear state space models. CAAI Trans. Intell. Technol. 2023, 8, 3–13. [Google Scholar] [CrossRef]
- Fan, B.; Zhang, Y.; Chen, Y.; Meng, L. Intelligent vehicle lateral control based on radial basis function neural network sliding mode controller. CAAI Trans. Intell. Technol. 2022, 7, 455–468. [Google Scholar] [CrossRef]
- Shahin, M. State-of-the-art review of some artificial intelligence applications in pile foundations. Geosci. Front. 2014, 7, 33–44. [Google Scholar] [CrossRef]
- Valença, J.; Mukhandi, H.; Araújo, A.G.; Couceiro, M.S.; Júlio, E. Benchmarking for Strain Evaluation in CFRP Laminates Using Computer Vision: Machine Learning versus Deep Learning. Materials 2022, 15, 6310. [Google Scholar] [CrossRef]
- Zhang, W.; Li, H.; Li, Y.; Liu, H.; Chen, Y.; Ding, X. Application of deep learning algorithms in geotechnical engineering: A short critical review. Artif. Intell. Rev. 2021, 54, 5633–5673. [Google Scholar] [CrossRef]
- De Anda, J.; Ruiz, S.E.; Bojórquez, E.; Inzunza-Aragon, I. Towards optimal reliability-based design of wind turbines towers using artificial intelligence. Eng. Struct. 2023, 294, 116778. [Google Scholar] [CrossRef]
- Zafar, U. Literature Review of Wind Turbines; Bauhaus Universität: Weimar, Gemany, 2018; 41p. [Google Scholar]
- Stavridou, N.; Efthymiou, E.; Baniotopoulos, C.C. Verification of Anchoring in Foundations of Wind Turbine Towers. Am. J. Eng. Appl. Sci. 2015, 8, 717–729. [Google Scholar] [CrossRef]
- de Groot, J. Multiaxial Compressive Stress States within a Concrete Onshore Wind Turbine Foundation: A three Dimensional Non-Linear Finite Element Analysis of the Concrete Surrounding the Anchor Cage. Master’s Thesis, Delft University of Technology, Delft, The Netherlands, 2022. [Google Scholar]
- Currie, M.; Saafi, M.; Tachtatzis, C.; Quail, F. Structural health monitoring for wind turbine foundations. Proc. Inst. Civ. Eng. Energy 2013, 166, 162–169. [Google Scholar] [CrossRef]
- Currie, M.; Saafi, M.; Tachtatzis, C.; Quail, F. Structural integrity monitoring of onshore wind turbine concrete foundations. Renew. Energy 2015, 83, 1131–1138. [Google Scholar] [CrossRef]
- Frederick, D. On Some Problems in Bending of Thick Circular Plates on an Elastic Foundation. J. Appl. Mech. 2021, 23, 195–200. [Google Scholar] [CrossRef]
- Mindlin, R.D. Influence of Rotatory Inertia and Shear on Flexural Motions of Isotropic, Elastic Plates. J. Appl. Mech. 2021, 18, 31–38. [Google Scholar] [CrossRef]
- Reissner, E.; Reissner, J.E. A problem of unsymmetrical bending of shear-deformable circular ring plates. Ing. Arch. 1985, 55, 57–65. [Google Scholar] [CrossRef]
- Amponsah, E.; Wang, Z.; Kwame Mantey, S. Bending-bearing behaviour of embedded steel ring-foundation connection of onshore wind turbines. Structures 2021, 34, 180–197. [Google Scholar] [CrossRef]
- Lian, J.; Ding, H.; Zhang, P.; Yu, R. Design of large-scale prestressing bucket foundation for offshore wind turbines. Trans. Tianjin Univ. 2012, 18, 79–84. [Google Scholar] [CrossRef]
- Deshpande, V.M. Numerical Modelling of Wind Turbine Foundations Subjected to Combined Loading. Master’s Thesis, The University of Western Ontario (Canada), Ontario, CA, Canada, 2016. [Google Scholar]
- Gaihre, N. Analytical and Numerical Modeling of Foundations for Tall Wind Turbine in Various Soils. Master’s Thesis, Southern Illinois University at Carbondale, Carbondale, IL, USA, 2020. [Google Scholar]
- Madandoust, R.; Kazemi, M. Numerical analysis of break-off test method on concrete. Constr. Build. Mater. 2017, 151, 487–493. [Google Scholar] [CrossRef]
- Martinelli, P.; Flessati, L.; Dal Lago, B.; Fraraccio, G.; di Prisco, C.; di Prisco, M. Role of numerical modelling choices on the structural response of onshore wind turbine shallow foundations. Structures 2022, 37, 442–458. [Google Scholar] [CrossRef]
- Ministry of Housing and Urban Rural Delevelopment of The People’s Republic of China. Code for Design of Concrete Structures. In Basic Provisions for Structural Components; China Architecture & Building Press: Beijing, China, 2010; Volume GB50010-2010. [Google Scholar]
- Imanzadeh, S.; Pantet, A.; Taibi, S.; Ouahbi, T. Soil Behavior Under Onshore Wind Turbine Foundation-Case Study in Brazil Using New French EOLIFT Technology. Adv. Civ. Eng. Technol. 2021, 4, 594. [Google Scholar] [CrossRef]
- Ma, H.; Chen, L. Static And Dynamic Analysis Modeling For Offshore Wind Turbine Foundation Structures. In Proceedings of the Ninth ISOPE Pacific/Asia Offshore Mechanics Symposium, Busan, Republic of Korea, 14–17 November 2010. [Google Scholar]
- Lubliner, J.; Oliver, J.; Oller, S.; Oñate, E. A plastic-damage model for concrete. Int. J. Solids Struct. 1989, 25, 299–326. [Google Scholar] [CrossRef]
- Lee, J.; Fenves, G.L. A plastic-damage concrete model for earthquake analysis of dams. Earthq. Eng. Struct. Dyn. 1998, 27, 937–956. [Google Scholar] [CrossRef]
- Krajcinovic, D.; Fonseka, G.U. The Continuous Damage Theory of Brittle Materials, Part 1: General Theory. J. Appl. Mech. 1981, 48, 809–815. [Google Scholar] [CrossRef]
- Xiao, Y.; Chen, Z.; Zhou, J.; Leng, Y.; Xia, R. Concrete plastic-damage factor for finite element analysis: Concept, simulation, and experiment. Adv. Mech. Eng. 2017, 9, 1687814017719642. [Google Scholar] [CrossRef]
- Ullah, S.N.; Hu, Y.; Stanier, S.; White, D. Lateral boundary effects in centrifuge foundation tests. Int. J. Phys. Model. Geotech. 2017, 17, 144–160. [Google Scholar] [CrossRef]
- Rabbat, B.G.; Russell, H.G. Friction Coefficient of Steel on Concrete or Grout. J. Struct. Eng. 1985, 111, 505–515. [Google Scholar] [CrossRef]
- Alsharhan, A.S. Handbook of Physical Quantities; Routledge: London, UK, 1997. [Google Scholar]
- Khazaei, J.; Amiri, A.; Khalilpour, M. Seismic evaluation of soil-foundation-structure interaction: Direct and Cone model. Earthq. Struct. 2017, 12, 251–262. [Google Scholar] [CrossRef]
- Yan, J.; Lin, Y.; Wang, Z.; Fang, T.; Ma, J. Failure mechanism of a prestressed concrete containment vessel in nuclear power plant subjected to accident internal pressure. Ann. Nucl. Energy 2019, 133, 610–622. [Google Scholar] [CrossRef]


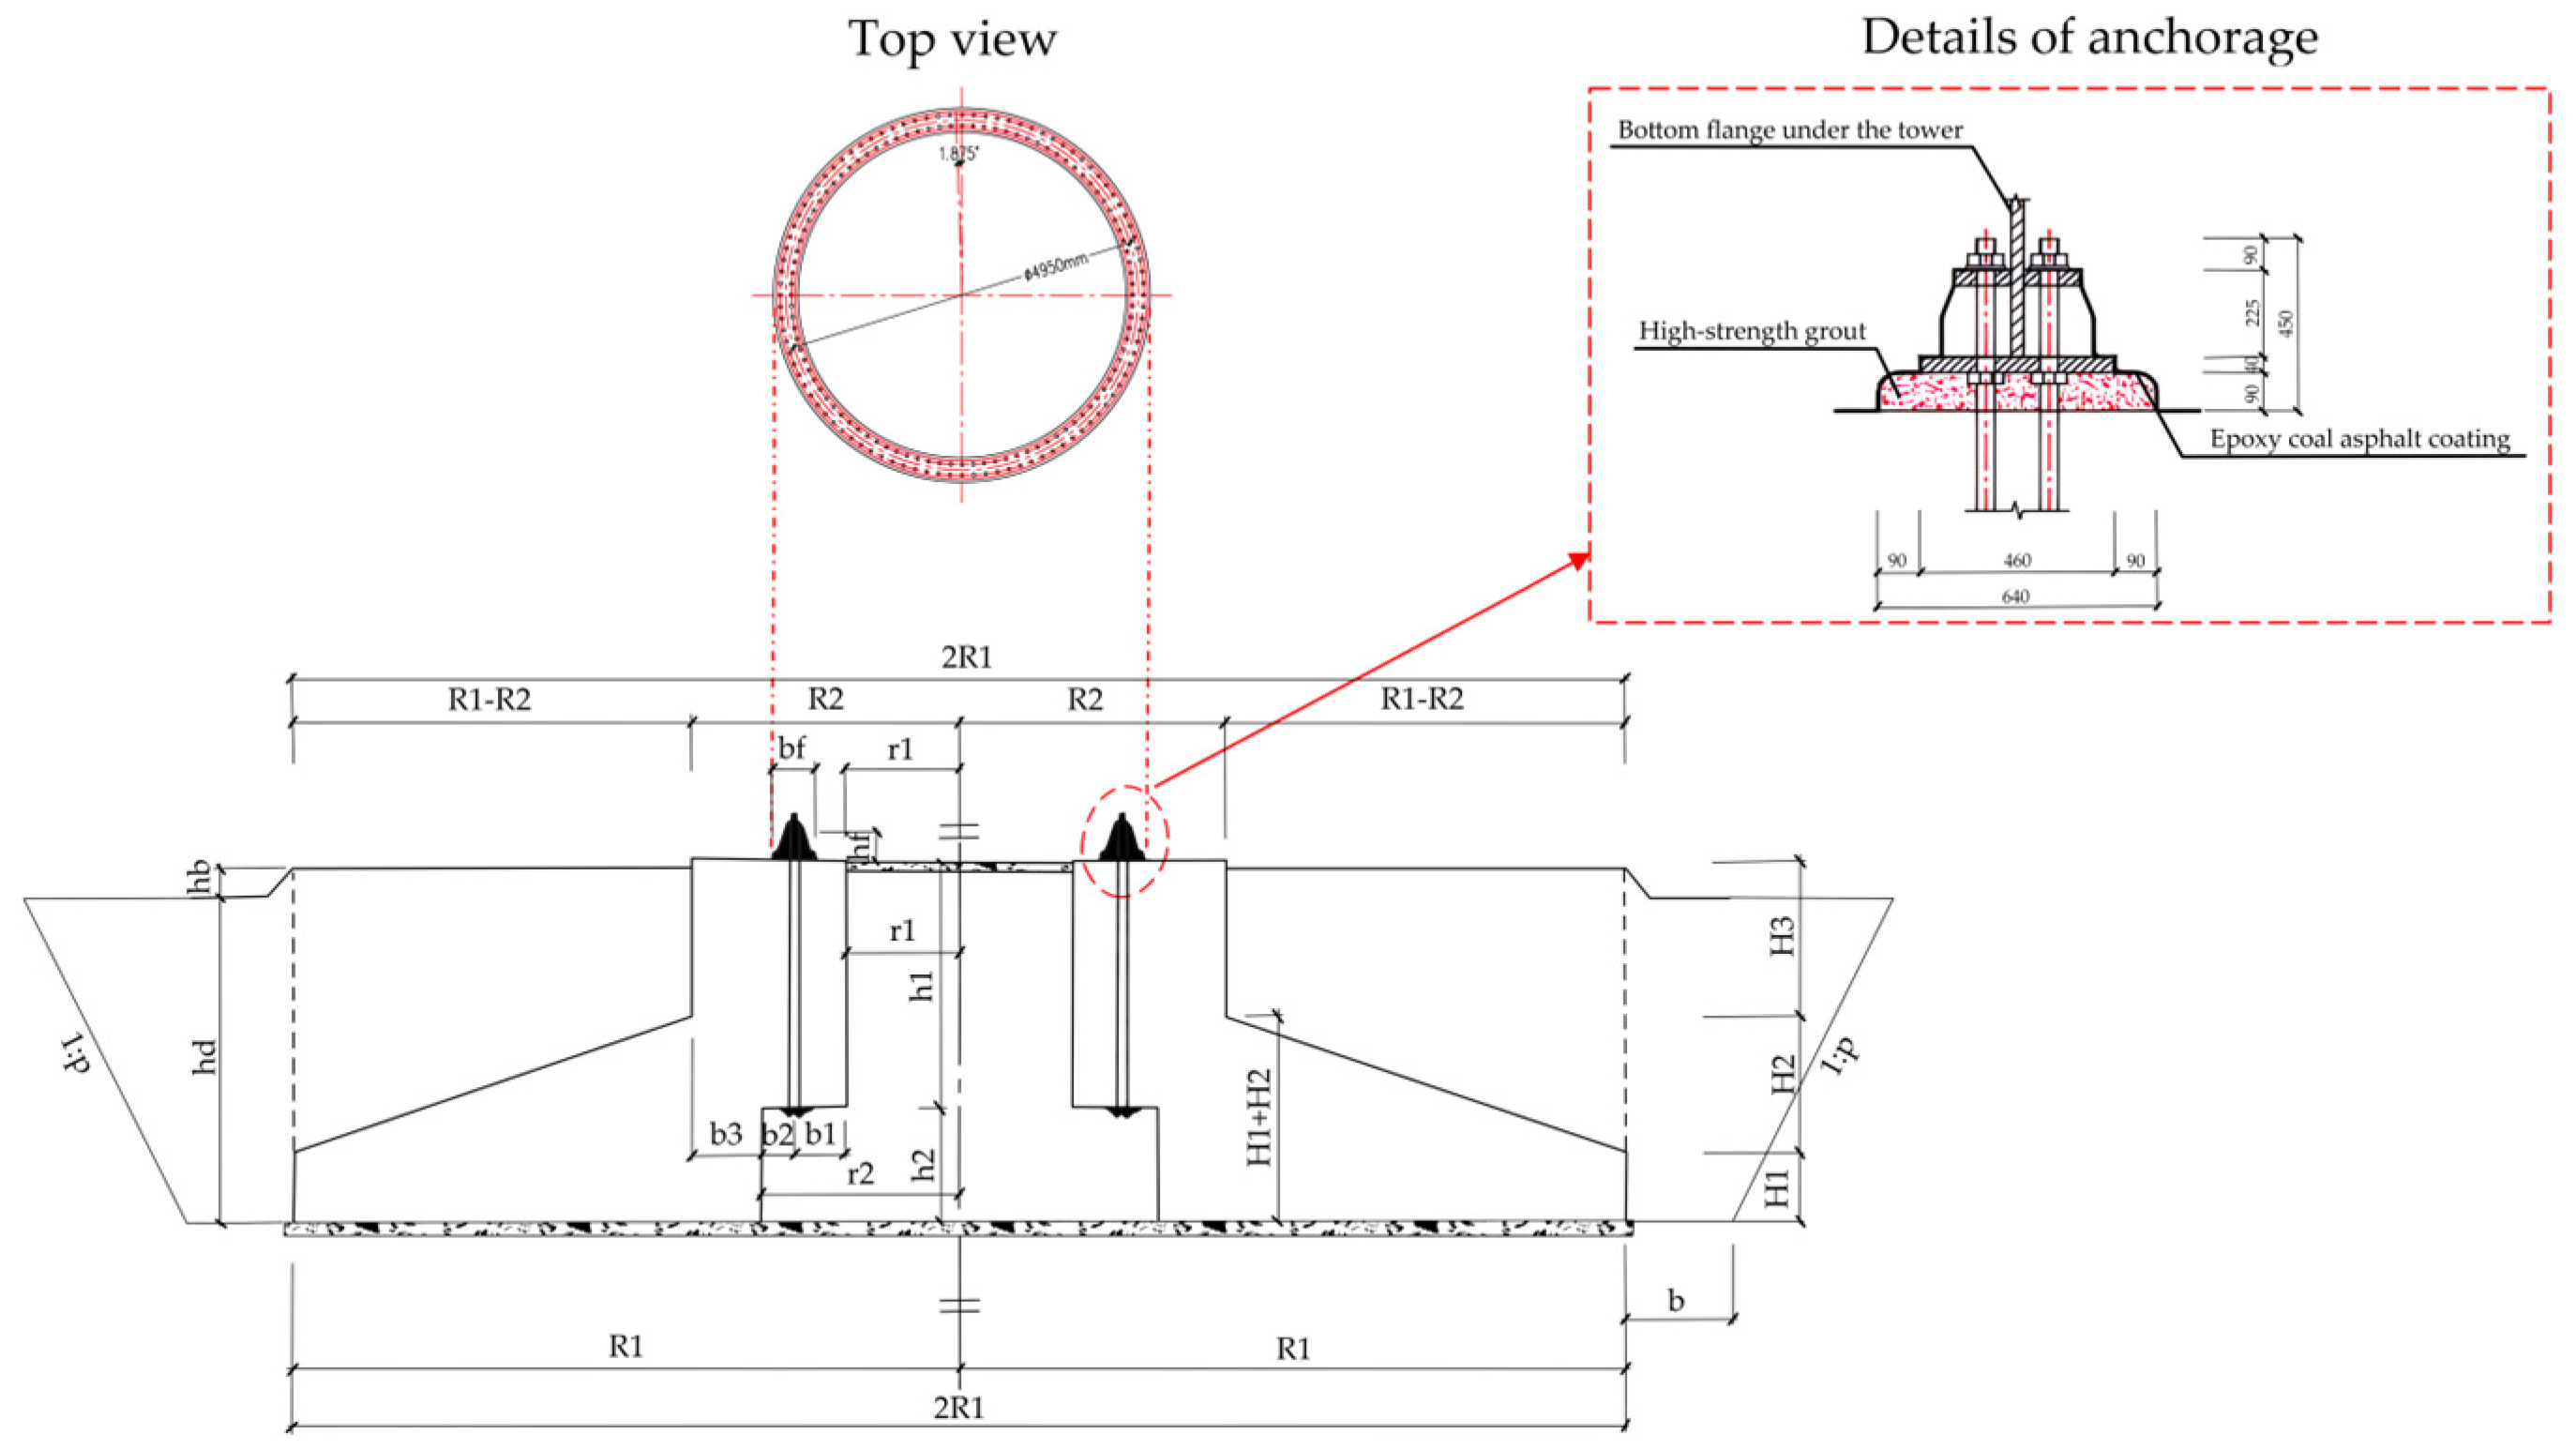
| Name | Sign | Value | Unit |
|---|---|---|---|
| Radius of the foundation plate | 10.00 | m | |
| Radius of the foundation column | 4.0 | m | |
| Foundation edge height | 0.85 | m | |
| Variable cross-section height of the foundation | 1.65 | m | |
| Column height | 1.90 | m | |
| Upper cavity radius | 1.7 | m | |
| Radius of the lower cavity | 2.975 | m | |
| Upper cavity height | 3.0 | m | |
| Lower cavity height | 1.4 | m | |
| Distance between the ground bolt and the inner cavity | 0.775 | m | |
| Distance from the ground bolt to the side wall | 0.5 | m | |
| The thickness of the side wall of the column | 1.025 | m | |
| Tower bucket force width | 0.64 | m | |
| Load acting force elevation | 0.465 | m | |
| Original buried depth of the foundation | 3.9 | m | |
| Foundation backfill thickness | 0.4 | m | |
| Excavation slope | P | 1:0.5 | / |
| Width of the foundation working face | b | 1 | m |
| Material | () | E (MPa) | Unit Type | Material Model | ||
|---|---|---|---|---|---|---|
| Concrete | 2450 | 32,500 | 0.2 | / | C3D8R | CDP |
| HSGL | 2450 | 38,000 | 0.2 | / | C3D8R | elasticity |
| Reinforcement | 7850 | 200,000 | 0.3 | / | T3D2 | elasticity |
| Anchor plate | 7850 | 206,000 | 0.3 | / | C3D8R | elasticity |
| Anchor bar | 7850 | 206,000 | 0.3 | T3D2 | elasticity | |
| Flange | 7850 | 206,000 | 0.3 | / | C3D8R | elasticity |
| Material | () | E (MPa) | Angle of Dilation (°) | Angle of Friction (°) | Cohesive Yielding Stress (kPa) | Absolute Plastic Strain | |
|---|---|---|---|---|---|---|---|
| Soil | 1800 | 50 | 0.3 | 0.1 | 30 | 50 | 0 |
| Dilation Angle | Eccentricity | (Biaxial/Uniaxial Ratio) | K | Viscosity Parameter |
|---|---|---|---|---|
| 30° | 0.1 | 1.16 | 0.667 | 0.004 |
| Contact Pair | Type | Tangential Behavior (Coefficient of Friction) | Normal Behavior |
|---|---|---|---|
| Flange–Anchor plate 1 | Surface-to-surface contact | 0.80 | Hard contact |
| Anchor plate 1–HSGL | 0.70 | ||
| Foundation–Anchor plate 2 | 0.70 | ||
| Foundation–Soil | 0.40 |
| Gravity () | Uniform Distributed Soil Pressure (USP) (Pa) | V (kN) | H (kN) | T (kN·m) | M (kN·m) |
| −9.8 | −49,371.4 | −4779.86 | −917.19 | −7254.68 | 100,560.8 |
| h1 /mm | b3 /mm | Maximum Tensile Stress of the Foundation Column/MPa | Maximum Tensile Stress at the Bottom of the Foundation Slab/MPa | Maximum Tensile Stress at the Top of the Foundation Slab/MPa | Maximum Tensile Stress of the Foundation Slab Overhang/MPa | |
|---|---|---|---|---|---|---|
| Option 1 | 3000 | 1025 | 2.223 | 2.23 | 2.37 | 2.23 |
| Option 2 | 3000 | 1275 | 2.21 | 2.333 | 2.231 | 2 |
| Option 3 | 3000 | 1525 | 1.99 | 2.395 | 1.89 | 1.537 |
| h1 /mm | b3 /mm | Maximum Tensile Stress of the Foundation Column/MPa | Maximum Tensile Stress at the Bottom of the Foundation Slab/MPa | Maximum Tensile Stress at the Top of the Foundation Slab/MPa | Maximum Tensile Stress of the Foundation Slab Overhang/MPa | |
|---|---|---|---|---|---|---|
| Option 1 | 3000 | 1025 | 2.223 | 2.23 | 2.37 | 2.23 |
| Option 4 | 2750 | 1025 | 2.185 | 2.272 | 2.265 | 2.2 |
| Option 5 | 2500 | 1025 | 2.174 | 2.335 | 2.201 | 2.181 |
Disclaimer/Publisher’s Note: The statements, opinions and data contained in all publications are solely those of the individual author(s) and contributor(s) and not of MDPI and/or the editor(s). MDPI and/or the editor(s) disclaim responsibility for any injury to people or property resulting from any ideas, methods, instructions or products referred to in the content. |
© 2023 by the authors. Licensee MDPI, Basel, Switzerland. This article is an open access article distributed under the terms and conditions of the Creative Commons Attribution (CC BY) license (https://creativecommons.org/licenses/by/4.0/).
Share and Cite
Zhang, Z.; Liu, Q.; Chu, H.; Lacidogna, G.; Xu, J.; Cheng, H.; Liu, Z.; Jiang, W. Performance Analysis of an Improved Gravity Anchor Bolt Expanded Foundation. Appl. Sci. 2023, 13, 11181. https://doi.org/10.3390/app132011181
Zhang Z, Liu Q, Chu H, Lacidogna G, Xu J, Cheng H, Liu Z, Jiang W. Performance Analysis of an Improved Gravity Anchor Bolt Expanded Foundation. Applied Sciences. 2023; 13(20):11181. https://doi.org/10.3390/app132011181
Chicago/Turabian StyleZhang, Zhenli, Qingyang Liu, Hongmin Chu, Giuseppe Lacidogna, Jie Xu, Haiyang Cheng, Zhitao Liu, and Weitao Jiang. 2023. "Performance Analysis of an Improved Gravity Anchor Bolt Expanded Foundation" Applied Sciences 13, no. 20: 11181. https://doi.org/10.3390/app132011181
APA StyleZhang, Z., Liu, Q., Chu, H., Lacidogna, G., Xu, J., Cheng, H., Liu, Z., & Jiang, W. (2023). Performance Analysis of an Improved Gravity Anchor Bolt Expanded Foundation. Applied Sciences, 13(20), 11181. https://doi.org/10.3390/app132011181