Abstract
Object detection for a pick-and-place system has been widely acknowledged as a significant research area in the field of computer vision. The integration of AI and machine vision with pick-and-place operations should be made affordable for Small and Medium Enterprises (SMEs) so they can leverage this technology. Therefore, the aim of this study is to develop a smart and lean pick-and-place solution for custom workpieces, which requires minimal computational resources. In this study, we evaluate the effectiveness of illumination and batch size to improve the Average Precision (AP) and detection score of an EfficientDet-Lite model. The addition of 8% optimized bright Alpha3 images results in an increase of 7.5% in AP and a 6.3% increase in F1-score as compared to the control dataset. Using a training batch size of 4, the AP is significantly improved to 66.8% as compared to a batch size of 16 at 57.4%. The detection scores are improved to 80% with a low variance of 1.65 using a uniform 135-angle lamp and 0 illumination level. The pick-and-place solution is validated using Single-Shot Detector (SSD) MobileNet V2 Feature Pyramid Network (FPN) Lite. Our experimental results clearly show that the proposed method has an increase of 5.19% in AP compared to SSD MobileNet V2 FPNLite.
1. Introduction
One of the current trends in advanced manufacturing is to employ Artificial Intelligence (AI) methods to improve the pick-and-place process. The integration of AI and machine vision with pick-and-place operations can significantly improve the manufacturing process. It should be made affordable for Small and Medium Enterprises (SMEs) so that they can leverage the benefits come with this technology without being concerned with allocating a significant financial budget. The fast and smooth integration of machine vision technology with the current pick-and-place operations of SMEs is another crucial aspect that should be taken into consideration.
In this context, any machine vision solution should be developed in a way that the commissioning and installing can be carried out simply and quickly by the field operators of SMEs without special skills. Therefore, one of the current trends in advanced manufacturing is to employ object detection using Deep Learning methods to improve the pick-and-place process. Furthermore, we study the usage of this smart and lean system in low-light environments, such as waferfab manufacturing during the night shift. Die-sorting machines, for example, can be used in low-light environments because they are totally automated and require no user intervention. As such, sufficient ambient lighting is not needed [1], and hence, our aim is to develop a smart and lean pick-and-place solution, which requires minimal computational resources, for custom workpieces.
AI model efficiency has become increasingly important in computer vision, and object detection using machine learning is becoming crucial for pick-and-place operation and warehousing logistics [2,3]. Other than allowing the smart detection of objects without camera recalibration, AI enhances the application’s robustness to light changes, shadow, background noise and low-illumination [4].
Continuing from our previous work [5], we aim to improve the pick-and-place operation using an Artificial Intelligence model deployed on an embedded controller. Our target is to develop a smart and lean pick-and-place system that meets the requirements of low power consumption, small memory usage, and fast run time.
Model efficiency has become increasingly important in computer vision to be used on mobile devices and embedded controllers such as Raspberry Pi due to the model’s compact size and quick inference. Convolutional Neural Network (CNN) models are crucial for feature extraction and classification, but conventional high-performance algorithms are expensive due to their high-power consumption and memory usage.
TensorFlow has developed several deep learning object identification models that were designed for embedded and mobile devices, hence the name TensorFlow Lite (TFLite). The model’s compact size and quick inference for TFLite versions make them appropriate for a variety of applications, including wearable technology and the Internet of Things. A pre-trained TensorFlow model is used to act as a learnt generic model because it has previously been trained on a sizable general dataset. This helps to reduce the quantity of data required to train a model from scratch.
Our project uses the state-of-the-art model EfficientDet-Lite [6], which was developed by Google in 2020. Compared to other state-of-the-art models, EfficientDet-Lite detectors are more precise and need fewer computational resources (working memory, power consumption, and floating-point operations per second or FLOPS) than their predecessors.
TFLite is a model optimization toolkit provided by Google, whose purpose is also to reduce the complexity of deep learning models and speed up the inference time. TfLite’s key feature is size reduction, which results in a smaller model and less need for storage space and RAM. TFLite decreases latency by quantization, which helps to simplify calculations during inference with only a little amount of accuracy loss.
TFLite optimizes the model via quantization, clustering, and pruning. The model’s accuracy is reduced, as it is quantized from FP64 to lower resolutions (FP32, FP16, INT8). In order to reduce a model’s complexity by reducing the number of its unique weights, clustering involves dividing the weights of the trained model’s layers into clusters and sharing the centroid of each cluster’s weight. Pruning is the process of removing less important model parameters that barely affect the outcomes of predictions. This aids in simplifying the model at the expense of some accuracy loss and offers far higher performance.
EfficientDet uses the same backbone as EfficientNet and adds a bi-directional feature pyramid network (BiFPN) to help in multi-scale feature fusion. It utilizes several optimization and backbone tweaks and a compound scaling method that uniformly scales the resolution, depth and width for all backbones, feature networks and box/class prediction networks at the same time.
Considerable research has already been completed for object detection using AI, laying the foundation for this work. The contribution of every work published previously in all the relevant domains has played a significant role in developing this work. Our pick-and-place approach is similar to a robot collecting a rock from a hopper using a vision-based image processing algorithm [7] and a robot performing pick and place operations on deformable items [8].
Similar to us, some researchers developed novel methods to improve the mean Average Precision. Using Faster-RCNN, Leung [1] developed a vehicle detection approach for insufficient and night-time illumination conditions and improved the mAP values by 0.2; however, it was not meant for a resource-constrained embedded system. Luo [9] achieved an average detection accuracy of 57.51% on EfficientDet-D2 for the road damage detection, which was lower than our 74.1% AP for the Alpha1 dataset. Jain [10] developed “DeepSeaNet” to detect underwater objects with EfficientDet with a high accuracy of 98.63%, but the method was not suitable for lightweight devices due to the complexity of the model.
Similar to our lightweight methodology, Cirjak [11] used EfficientDet-4 on Raspberry Pi to monitor the codling moth population and achieve a high accuracy of 99% with a small dataset of 430 images. Wu [12] adopted EfficientDet to detect textureless objects in an industrial environment, but this method was not suitable for Raspberry Pi due to the heavy computation. Saurabh [13] used a web camera and ABB robot to detect color and perform a color-sorting algorithm; this work has 100% detection but no machine learning implementation. Konaite [14] used another lightweight model, SSD MobileNet V2, on Raspberry Pi to detect barriers for blind people to navigate safely.
EfficientDet is used in non-industrial scenarios such as dental application. Bayaran [15] assessed the diagnostic quality of bitewing radiographs at contact areas between teeth, which can help the oral radiologists provide better radiographic qualities.
Other than EfficientDet, advanced CNN is used in other applications. For example, it is used in implementing traffic signs recognition in a mobile-based application [16], a speech recognition system using TensorFlow [17], a smart surveillance system for night low-illumination objects [18] and a visual feedback algorithm on AlexNet [19].
The effectiveness of illumination to improve the detection scores has not been extensively studied for pick-and-place solutions, especially robots used in warehouses and logistics areas with low illumination, and thus, our research aims to fill this gap.
We implement a smart and lightweight object detector requiring minimal computational resources which controls a pick-and-place system. The illumination effect on the EfficientDet-Lite model deployed in Raspberry Pi are investigated and compared. Our contributions include the following:
- The addition of 8% optimized bright Alpha3 images resulted in a 7.5% increase in Average Precision and a 6.3% increase in F1-score.
- Obtain high detection scores over 80% and low variance of 1.65 by using 135-degree angle and level 0 illumination in accordance with Japanese Industrial Standard (JIS).
- In-depth analysis of EfficientDet-Lite models with training batch sizes 4, 8, and 16. Batch size 4 had the best performance with an overall mean of 66.8% and low standard deviation of 6.23%
The remainder of this paper is organized as follows: In Section 2, we introduce the project setup for a smart and lean pick-and-place solution as well as the data collection and training process. In Section 3, we test our proposed method on the custom dataset and compare it with some other state-of-the-art methods to show the effectiveness and advantages of our method. Conclusions are drawn in Section 4.
2. Materials and Methods
2.1. Materials and Measurements Setup
Figure 1 shows the project setup for our smart and lean pick-and-place solution. The framework of the pick-and-place solution is mainly divided into two parts; object detection and location using an embedded system, and workpiece placement using a robot arm. A Universal Robot 3 (UR3) collaborative robot is used to perform the pick-and-place solution. A Logitech 2D camera of 5 Megapixels (MP)is mounted on the arm of UR3 and connected to the USB port of a Raspberry Pi. Once the object is detected, the General-Purpose Input–Output (GPIO) sends a signal to control the hardwired signal of the UR, as proposed by our previous work [5]. Using 2D cameras is beneficial to the pick-and-place system, as they are more affordable and have good accuracy [20]. Compared to other vision solutions, a 2D camera detection engine is easy to use, thus increasing their adaptability and flexibility to different custom-made objects.
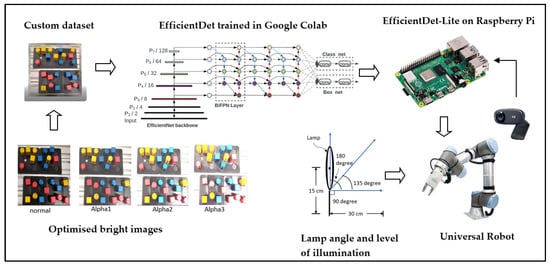
Figure 1.
Project setup of our smart and lean pick-and-place solution.
Figure 2 shows the flowchart for our pick-and-place solution using the Raspberry Pi. Using OpenCV on Raspberry Pi, the data images are captured, and the images are annotated using the online Roboflow tool. The dataset is then preprocessed, augmented, and run on Google Colab for model building and training. Using TensorFlow’s Model Maker [21], the model is built, trained, and evaluated before being converted to TensorFlow Lite. The lite version consumes less memory compared to the original version.
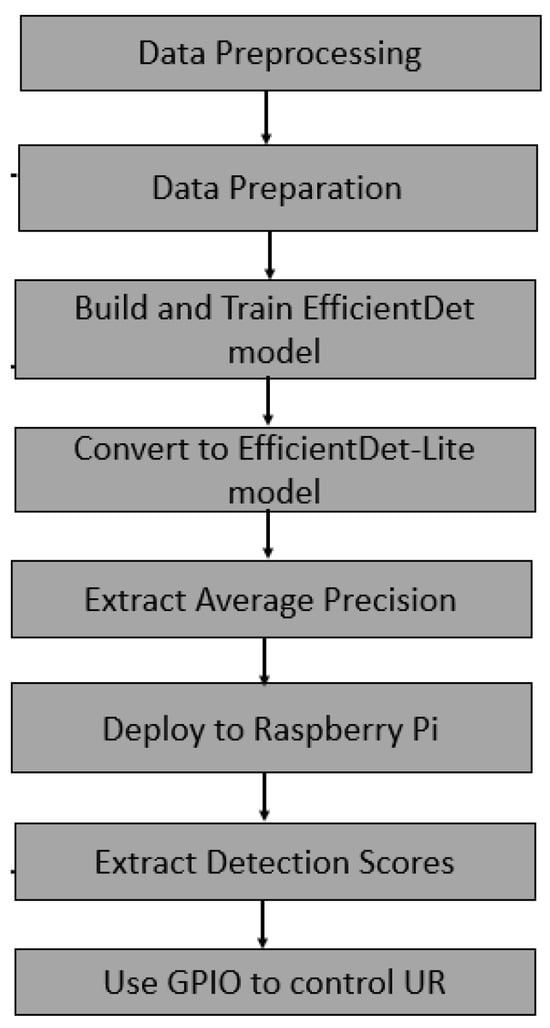
Figure 2.
Flowchart with dataset, batch size and lamp control.
This project used 2 datasets for training: Dataset 1 for optimized bright and illumination level and Dataset 2 for batch test. The mean and variance AP are then extracted and compared. For the batch test, we compare the AP for batch sizes 4, 8 and 16. For the illumination test, we use 3 lamp angles and compare the best detection scores.
The project uses custom datasets for the initial training process. Three different colors (yellow, blue, red) are used, and each color has 2 different shapes (cylinder, cube), as shown in Figure 3. The project uses Roboflow [22] as an online annotation and data splitting tool. Using the Label Assist tool, the highest mAP is used to annotate images, and the confidence is lowered to 20%. The confidence level is lowered to make the annotation visible for all objects. The overlap is reduced to 50% to enable detection of workpiece with poor confidence. These values are chosen after trial and error in order for the AI tool to add most of the annotations automatically. For faster annotation, the zoom and lock view functions are used to ensure more accurate annotation as the workpiece looks bigger. A Roboflow’s Healthcheck is performed to ensure the distribution of workpieces in the dataset.
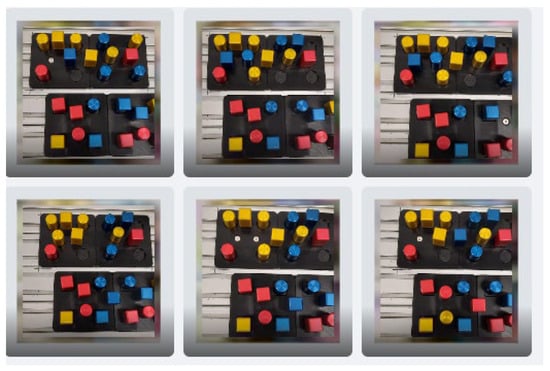
Figure 3.
Custom dataset.
According to our previously published research [5], EfficientDet-Lite4 has a large file size and may not be suitable for Raspberry Pi due to its memory limitations. Hence, in this project, we specifically use EfficientDet-Lite 0 to 3 as our models, and these four architectures are trained using the TensorFlow Lite Model Maker [23] library.
All Tensorflow models are developed and evaluated using Google Colab [23] with a Graphic Processing Unit (GPU) Hardware Accelerator. The proposed framework aims to be a complete object detector that only needs minimal data processing before and after model detection and classification. After training, the EfficientDet Lite models are quantized (weights of 8-bit integer) using Post-Training Quantization.
For our object detection, the evaluation criteria are the mean Average Precision (mAP) and F1-score. According to the validation dataset COCO2017, its mAP is the same as Average Precision in Tensorflow Model Maker [23]. For our pick-and-place application, ARmax10 is chosen as the Recall value as we expect to have a maximum of 10 detections per pick-and-place application.
The formula of the mean Average Precision is given as below:
where APk is the Average Precision of class k, and n is the number of classes.
The F1-score is used to evaluate the models’ accuracy, since it allows for the simultaneous maximization of two metrics that are well known in this field: Precision, which measures the detections of objects, and Recall, which measures the objects that are detected. The F1-score is calculated based in the mAP and Recall value in the formula below:
To speed up the training, the number of epochs is fixed at 50 for the 4 models. The threshold for detection is set at 30%. The standard deviation of the AP is calculated as follows:
where is the population standard deviation, N is the size of the population, xi is the value of an AP and μ is the population mean of all APs.
The variance of the AP is calculated as follows:
where S2 is the population variance, N is the size of the population, xi is the value of an AP and μ is the population mean of all APs.
Data preprocessing decreases the training time and increases the performance of the AI model by applying image transformations to all images in this dataset, as shown in Table 1. To prevent overfitting of the model, the data augmentation process is shown in Table 2. Both data preprocessing and augmentation are completed using the online Roboflow tool.

Table 1.
Preprocessing operations applied to the original images.
Table 2.
Augmentation operations applied to the original images.
This project uses an augmentation technique to increase the number of images from a small number of images. Two datasets were built: Dataset 1 with 124 images to study the illumination effect and Dataset 2 with 82 images to study effect of batch size. Dataset 2 is a small dataset consisting of 82 images, and it is used for batch testing. Our objective is to determine whether there is a visible increase in mAP due to batch size despite the small datasets. Table 3 presents the two datasets utilized for the three test trials.
Table 3.
Augmented dataset for illumination, optimized brightness and batch size test.
For test experiments 1 and 2, the model chosen is EfficientDet-Lite2 with a batch size of 8, as it is lightweight and has a good trade-off between training speed and accuracy. For test experiment 3, we vary the batch size to 4, 8 and 16, and we also vary the 3 Tensorflow models from EfficientDet-Lite 0 to 3.
2.2. Image Optimization Process to Improve Mean Average Process
Table 4 shows the distribution of the workpiece in Dataset 1, where there are a total of 963 objects. The blue cylinder has highest distribution at 35.61%, which is followed by the blue cube at 20.87%. The red cylinder has the lowest distribution at 13.33%.
Table 4.
Distribution of workpiece in Dataset 1.
The proposed pick-and-place method aims to be a complete object detector that only needs minimal data processing before and after model detection and classification. Therefore, we choose a small number of images to evaluate the effectiveness of this approach. This study emphasizes the necessity of rapid and accurate label annotations, as well as fast data processing with small datasets, using a smart and “lean” approach.
Figure 4 shows the augmentation process, where 124 original images are augmented to 327 images using the Flip-90 degree, Flip-180 degree and Rotate-15 degrees manipulation. Similarly, the 10 bright images (8% of the total images) are augmented to 24 images. Using the Roboflow online tool, the images are merged to produce 1006 augmented image after undergoing image shearing manipulation.
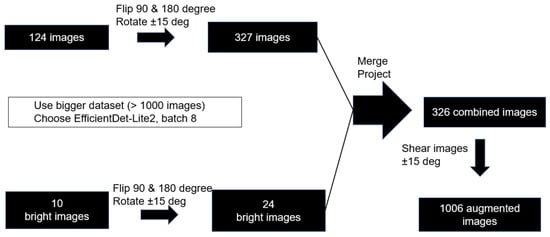
Figure 4.
Process of augmentation for Dataset 1.
For the bright images, 10 images of different alpha values are added to the dataset, as shown in Table 5. Using the addWeighted function from OpenCV, a brightness of alpha(α) parameter is overlayed onto the 10 images. The addWeighted function is a function that helps by adding two images (f0 and f1) by passing varying α values of 1, 2 and 3 into the formula below.
g(x) = (1 − α)f0(x) + αf1(x)
Table 5.
Optimization process with Alpha datasets.
The datasets are named as follows. Alpha1 has 124 base images with 10 bright images. Alpha2 has 124 base images with 10 bright images, and Alpha3 has 10 bright images. The optimization is shown in Figure 5, where the results of brightening are clearly visible.
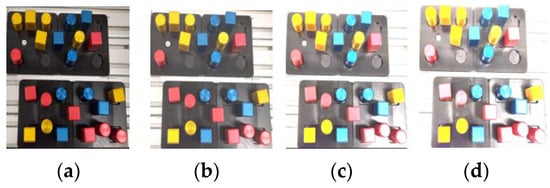
Figure 5.
Optimized bright image using OpenCV: (a) normal; (b) Alpha1; (c) Alpha2; (d) Alpha3.
2.3. Illumination Level Setup to Improve Detection Scores
According to the Japanese Industrial Standard (JIS) Z 9110-1979 [24], the recommended level of illumination shall be as shown in Table 6 below. Using an illuminance (lux) meter and a commercially available lamp, the appropriate level of illumination is determined for a specific work location in a typical factory environment, such as the packing, assembly and inspection area.
Table 6.
JIS recommend level of illumination.
It is important to note that the detection scores are affected by the surface reflection since the workpieces are made of metallic materials. Rather than mounting the lamp directly above the workpieces, the lamp is positioned on the side so that the light does not reflect directly from the metallic surface. As shown in Figure 6, the base of the lamp is positioned 30 cm horizontally and 25 cm vertically from the workpieces, with 3 angles of 180 degrees, 90 degrees and 135 degrees from the lowest vertical point lamp. This project focuses on pick-and-place applications within darkrooms, corridors, and poorly illuminated areas with less than 300 Lux levels, as it is less extensively studied.
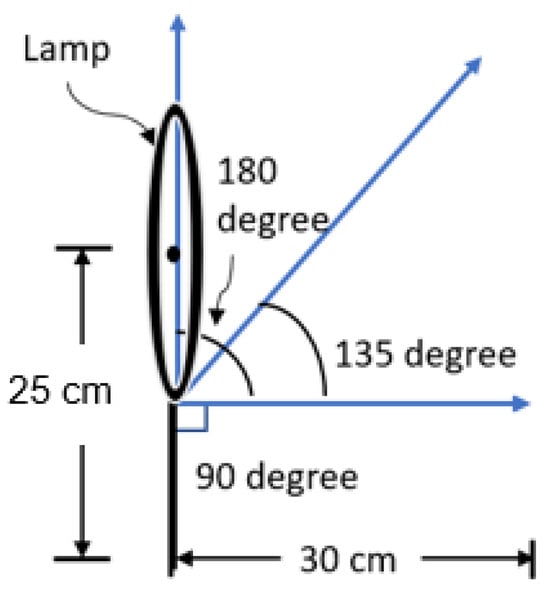
Figure 6.
Setup of angled lamp.
Table 7 shows the on-site lux measurement as well as classification of areas for the proposed robot implementation in an assembly line.
Table 7.
Classification of work areas.
To ensure reliability and determine the average detection score, a minimum of three readings are taken. Figure 7 illustrates the setup of three different lamp angles (180, 135 and 90). A lamp angle has two adjustable levels of illumination—lower than 150 lux and between 150 and 300 lux.

Figure 7.
Illumination setup for varying levels: (a) 180 degree; (b) 135 degree; (c) 90 degree.
To prevent the direct reflection of the light by the metallic surface, the lamp is mounted at the side instead of directly above the workpieces. The reason for this setup is to reduce the direct glare from the lamp while providing enough illumination, as shown in Figure 8. The number of frames per second (FPSs) can be seen on the top-left corner of the image. The speed is typically in the range of 0.8 frames per second as the Python code used to display the results using OpenCV uses a portion of the processing time.
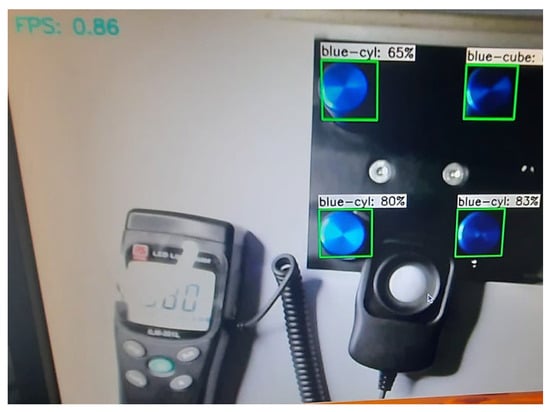
Figure 8.
Best detection scores at different illumination levels.
2.4. Training Batch Size Configuration to Improve Mean Average Precision
Table 8 below defines their training settings. The batch size is set based on the GPU Random Access Memory (RAM) with the default learning rate and input resolution. The Tensorflow model is trained with training data with batch sizes of 4, 8 and 16, respectively. In this project, a batch size of 4 is abbreviated to “Batch4”, a batch size of 8 is abbreviated to “Batch8”, and a batch size of 16 is abbreviated to “Batch16”.
Table 8.
Training setting of EfficientDet Lite0 to Lite3.
The model training and validation are completed in Google Colab (Python 3.8) using Tensorflow Model Maker on free GPU. The Tensorflow model is trained with training data with batch sizes of 4, 8 and 16, respectively. To speed up the training, the number of epochs is fixed at 50 for the 4 models.
Dataset 2 is used for the batch size training; it is deliberately chosen to be a small dataset consisting of 82 images and 1022 objects. As shown in Table 9, it has a healthy distribution percentage of the workpieces. The small dataset allows fast training times and practical data preparation. Its purpose is to determine an optimal number of batch sizes with a good trade-off between the accuracy of the detected objects and training speed.
Table 9.
Equal distribution of workpiece in Dataset 2.
3. Results
3.1. Results of Optimized Bright Images on Average Precision
Table 10 shows the results of the evaluation metrics using EfficientDet-Lite2, and training was completed for 50 epochs. The results demonstrate that Dataset 3 has the highest F1-score, which is to be expected given that it has the highest AP and AR Max10. The best performance comes from Alpha3, as it results in a 10.2% increase in Average Precision and a 6.3% increase in F1-score as compared to the Control Dataset.
Table 10.
The Average Precision and calculation of F1-score.
The color of the workpiece has a direct effect on the accuracy, as shown in Table 11. The blue cube performs the best under Alpha3 with an Average Precision increase of 24.6% while the red cube performs the worst with the AP dropping by 28.6% in the Alpha2 dataset and further to less than the threshold value of 30% in the Alpha3 dataset. One explanation could be that red colors reflect more light, whilst blue colors absorb more. The blue cube has the highest AP (90.4%) in the Alpha3 dataset, while the red cube has the lowest AP in the Alpha2 (45%) and in Alpha3 datasets (29%). As our goal here is to have consistent high detection scores with low variance, we choose Alpha1 instead of Alpha3 for our subsequent projects. The average AP for Alpha1 is 0.8% higher than the control dataset. Hence, Alpha1 is chosen to increase the AP while maintaining low variance.
Table 11.
Average Precision with Alpha datasets.
Figure 9 shows that in general, all the APs for Alpha1 and Alpha2 are higher than that of the COCO2017 dataset, which is 33.97%. For Alpha3, only the red cube has a lower AP than the validation mAP. The overall mean of Alpha1 is 6.2% higher than that of Alpha2. Therefore, for a high and consistent object detection approach, we use the Alpha1 dataset in our pick-and-place solution.
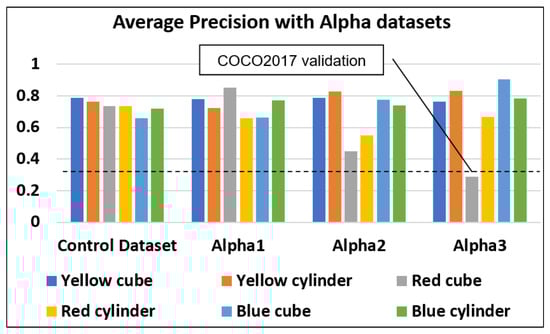
Figure 9.
Average Precision with Alpha datasets.
3.2. Results of Illumination Level on Detection Scores
Table 12 shows the results of various illumination angles and levels. The average is taken from the three best detection scores for all the three different lamp angles (180, 135 and 90). Each angle has two levels of illumination—a lux level less than 150 and a lux level in between 150 and 300. The lux measurements are taken to ensure that the detection occurs during the specified illumination level, as per the JIS specification. The threshold for detection is set at 30% and, hence, if there is any detection less than 30%, it will be shown as ‘Nil’ below.
Table 12.
Detection scores and lux level for the different angles and intensities of the lamps.
Table 13 shows the average detection score of workpieces and the variance. The 135-degree level 1 has the highest average detection score (81.17%), which is followed by the 135-degree level 0 at 80.50%. The 180-degree level 1 has the lowest detection scores of 77.94%. The lowest variance is 1.65% at the 135-degree level, and the highest variance is 25.08% for the 90-degree level 1.
Table 13.
Detection scores and Lux level for 180-degree level 1 lamp.
Hence, to increase the average detection score to over 80%, as shown in Figure 10 below, we propose to use a 135-degree lamp. We can observe that the illumination distribution is more even and that there is less surface reflection with a 135-degree lamp of level 0 illumination because of its low variance.
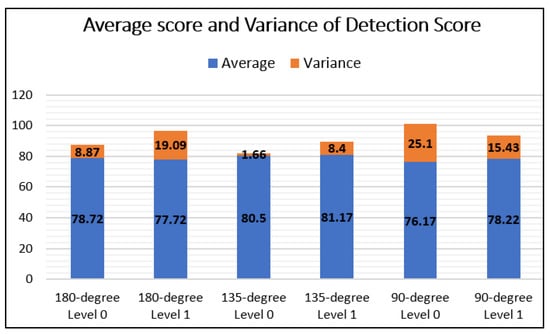
Figure 10.
Bar graph of detection scores with average and variance.
3.3. Results of Variation of Batch Size on Average Precision
A comparison of Average Precision across Efficient-Det Lite models is built in order to investigate which model performs the best with a small dataset. As shown in Table 14 below, Batch4 has the highest overall AP at 66.8%, and it has the lowest standard deviation at 6.23%. In contrast, Batch16 has the lowest overall AP at 57.4% and highest standard deviation at 7.87%. According to Keskar [25], this is because the large-batch methods tend to converge to sharp minimizers of the training and testing function and as is well known, sharp minima lead to poorer generalization. In contrast, small-batch methods consistently converge to flat minimizers due to the inherent noise in the gradient estimation. As compared to Batch16, both Batch4 and Batch8 have higher average APs of 66.1 ± 0.7% and standard deviations of 6.245 ± 0.015%.
Table 14.
Variation of batch size.
From Table 15 and Figure 11 below, the overall results show that the red cube has the highest AP at 69.9% and the second lowest standard deviation at 4.48%. The red cylinder has the second highest AP at 62.4% with a standard deviation at 5.09%. In comparison to other classes, the yellow cylinder has the lowest AP at 53.8% and the highest standard deviation at 8.69%. This is consistent with our prior findings [26], which show that neutral-colored things such as yellow cubes have lower APs than strong-colored objects such as red cubes. As the objects for this pick-and-place action have a metallic surface, yellow objects suffer from surface reflection from external lighting.
Table 15.
Average Precision according to workpieces.
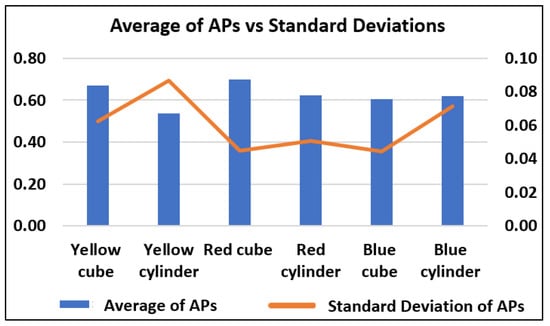
Figure 11.
Comparison of Average Precision across Efficientdet-Lite models.
3.4. Statistical Analysis on Variation of Batch Size
As we observed in Table 14 above, the Average APs of Batch4 and Batch8 are quite similar. Therefore, a statistical analysis is conducted to see whether there is a significant difference between the two groups of values. We utilize the Mann–Whitney U method as it is one of the most commonly used non-parametric statistical tests [27]. Developed by Mann and Whitney in 1947, this non-parametric test is frequently used for small samples of data that are not normally distributed [28].
In Mann–Whitney U test, the null hypothesis states that the medians of the two respective groups are not different. As for the alternative hypothesis, it states that one median is larger than the other or that the two medians differ. If the null hypothesis is not rejected, it means that the median of each group of observations is similar. If the null hypothesis is rejected, it means the two medians differ.
We apply the Mann–Whitney U test to our Batch4 and Batch8 as the number of samples are small [29], less than 30, and the AP results are not normally distributed. Our null hypothesis (H0) and alternative hypothesis (H1) follow:
H0.
The median of APs is equal between Batch4 and Batch8 APs.
H1.
The median of APs is not equal between Batch4 and Batch8 APs.
Using SciPy which is a Python library used for scientific computing and technical computing, we obtain a p-value of 0.448. Since the p-value (0.448) is above the 0.05 significance level, we fail to reject the null hypothesis.
We conclude there is not enough evidence to suggest a significant difference in medians between the two datasets. As the standard deviation only differs by 0.008, we recommend using Batch8 instead of Batch4 for faster training and evaluation.
3.5. Performance Validation
We use the pre-trained model SSD MobileNet V2 FPNLite and compared the performance regarding the Average Precision and detection score. Table 16 shows the performance results of our selected EfficientDet-Lite2 model and SSD MobileNet V2 FPNLite, using the same training data for each of them. We compare the performance of the SSD MobileNet to that of our EfficientDet-Lite2 model with the Alpha1 dataset and found that our results were significantly better. Compared to SSD MobileNet V2 FPNLite, our model shows a significant improvement of accuracy for the yellow cube at 40.4% and red cube at 40.1%.
Table 16.
Comparison of APs for custom object detection model.
Table 17 shows the comparison of detection scores for the custom dataset running on our EfficientDet-Lite2 model and SSD MobileNet V2 FPNLite. The detection scores are taken with the project setup of the 135-degree lamp and level 0 illumination. When compared to SSD MobileNet V2, our model significantly improves the overall detection scores by 5.19%. Comparing EfficientDet-Lite2 to SSD MobileNet V2, significant improvements are observed for the red cube (+19.33%) and red cylinder (+20.66%).
Table 17.
Comparison of detection scores with SSD MobileNet V2.
3.6. Comparison mAP with COCO2017 Validation Dataset
Tensorflow Lite Model Maker provides the performance of each EfficientDet-Lite model with the mean Average Precision evaluated on the COCO2017 validation dataset. Hence, for additional validation, we compare our AP with the COCO2017 dataset, as shown in Table 18. As indicated in Section 3.1, we choose the Alpha1 dataset since it performs the best in AP rather than Alpha2 or Alpha3 datasets. The results show that all the Alpha1 datasets of the EfficientDet-Lite models outperform the COCO2017 dataset, with EfficientDet-Lite2 outperforming it by 51.13%. As a result, we chose EfficientDet-Lite2 for our future projects.
Table 18.
Comparison of Average Precision with COCO2017 dataset.
4. Discussions
The aim of the our project is to develop a smart and lean pick-and-place system for a lightweight embedded controller such as Raspberry Pi. The advantage of our system is that the robot could perform well in low-illumination area such as the wafer-cutting system. In this study, we evaluate the effectiveness of illumination and batch size to improve the Average Precision and detection scores of the EfficientDet model. This study is important because our control algorithm utilizes high and consistent detection scores to establish the location of the workpiece and regulate the arm movement. The improvement of the Average Precision and detection scores depends on many factors and features; this study focused on the illumination angle and level as an important feature of the control of lighting. The results of the detection score are subject to ambience lighting and noise, which may vary significantly if the workplace is located in an open area. Therefore, the application of Deep Learning for custom object detection will aid in reducing this variation significantly.
This study has several limitations; for instance, the quality of the dataset plays a part in determining the Average Precision. We observed that certain workpieces have surface reflection from external illumination, which has an impact on the Average Precision. In this study, we used the Japanese industrial standards for the system’s lux levels for illumination. We acknowledge that different regions and industries may have varying standards and requirements for illumination levels, such as the Illuminating Engineering Society of North America (IESNA) and the European Standard EN12464-1 [25].
Currently, our method works well for application for illumination levels 0 and 1. For future projects, we would like to expand the application to other use cases of higher levels of illuminations. In order to attain the necessary high Average Precision and detection scores, we will take into account additional dataset preparation, optimization, and reinforcement learning.
5. Conclusions
In this work, we have successfully developed a novel method to develop a smart and lean pick-and-place system for custom workpieces. We evaluated the effectiveness of illumination and batch size to improve the Average Precision and detection score of the EfficientDet-Lite model, and we used it in our novel approach to develop a smart algorithm for the Raspberry Pi to control the Universal Robot.
Using a lightweight embedded system, we developed advanced pick-and-place robotic systems, enhancing automation in manufacturing processes by accurately detecting custom objects and controlling robot arm movement. This project has improved the detection of objects with deep learning and implemented the state-of-the-art (SOTA) EfficientDet-Lite model on Raspberry Pi. The validation on another SOTA model, SSD MobileNet V2 FPNLite, has shown that our object detection significantly improves the Average Precision and overall detection scores. Our experimental results clearly show that the proposed method has an increase of 5.19% in AP compared to the SSD model. In fact, all the APs obtained during the evaluation test exceed the AP from the COCO2017 validation test.
In the EfficientDet-Lite2 model, the addition of 8% optimized bright Alpha3 images resulted in an increase of 7.5% in Average Precision and an increase of 6.3% in F1-score. We observed that the blue cube has the highest AP in the Alpha3 dataset, while the red cube has the lowest AP in the Alpha2 and Alpha3 datasets. As our goal here is to have a consistent high detection score with low variance, we choose Alpha1 instead of Alpha3 for our subsequent projects.
As a result of using Batch4, the overall AP across all EfficientDet-Lite models increased significantly to 66.8% as compared to Batch8 at 65.4% and Batch16 at 57.4%. In order to speed up the training for our subsequent projects, we use Batch8 for training rather than Batch4. This decision is validated by the Mann–Whitney U statistical analysis, which shows that Batch4 and Batch8 do not have any significant differences in AP.
In order to increase the overall detection score to over 80%, we utilized a 135-degree lamp and level 0 illumination. As such, this study presents a very good starting point for the development of a better object detection for pick-and-place robots by using the effect of illumination. This is important because the control algorithm [4] that Raspberry Pi uses to move the arm of the universal robot depends on high and consistent detection scores to establish the location of the workpiece. In the future, we will extend the system to identify angular rotations and improve real-time detection as well as address the issue of surface reflection from external lights.
Author Contributions
Conceptualization, E.K. and J.J.C.; methodology, E.K., Z.J.C. and M.L.; software, E.K.; validation, E.K., Z.J.C. and M.L.; formal analysis, E.K., Z.J.C. and M.L.; investigation, E.K.; writing—original draft preparation, E.K.; writing—review and editing, E.K. and J.J.C.; supervision, Z.J.C.; funding acquisition, J.J.C. All authors have read and agreed to the published version of the manuscript.
Funding
This research received no external funding.
Institutional Review Board Statement
Not applicable.
Informed Consent Statement
Not applicable.
Data Availability Statement
All data that support the findings of this study are included within the article.
Conflicts of Interest
The authors declare no conflict of interest.
References
- Leung, H.K.; Chen, X.-Z.; Yu, C.-W.; Liang, H.-Y.; Wu, J.-Y.; Chen, Y.-L. A deep-learning-based vehicle detection approach for insufficient and nighttime illumination conditions. Appl. Sci. 2019, 9, 4769. [Google Scholar] [CrossRef]
- Bencak, P.; Vincetič, U.; Lerher, T. Product Assembly Assistance System Based on Pick-to-Light and Computer Vision Technology. Sensors 2022, 22, 9769. [Google Scholar] [CrossRef]
- Yin, X.; Fan, X.; Zhu, W.; Liu, R. Synchronous AR Assembly Assistance and Monitoring System Based on Ego-Centric Vision. Assem. Autom. 2019, 39, 1–16. [Google Scholar] [CrossRef]
- Zhao, W.; Jiang, C.; An, Y.; Yan, X.; Dai, C. Study on a Low-Illumination Enhancement Method for Online Monitoring Images Considering Multiple-Exposure Image Sequence Fusion. Electronics 2023, 12, 2654. [Google Scholar] [CrossRef]
- Kee, E.; Jie, C.J.; Jie, C.Z.; Lau, M. Low-cost and sustainable Pick and Place solution by machine vision assistance. In Proceedings of the 25th International Conference on Mechatronics Technology (ICMT), Kaohsiung, Taiwan, 18–21 November 2022. [Google Scholar]
- Tan, M.; Pang, R.; Le, Q.V. Efficientdet: Scalable and efficient object detection. In Proceedings of the IEEE/CVF Conference on Computer Vision and Pattern Recognition, Seattle, WA, USA, 13–19 June 2020; pp. 10781–10790. [Google Scholar]
- Kim, H.; Choi, Y. Lab Scale Model Experiment of Smart Hopper System to Remove Blockages Using Machine Vision and Collaborative Robot. Appl. Sci. 2022, 12, 579. [Google Scholar] [CrossRef]
- Jørgensen, T.B.; Jensen, S.H.N.; Aanæs, H.; Hansen, N.W.; Krüger, N. An adaptive robotic system for doing pick and place operations with deformable objects. J. Intell. Robot. Syst. 2019, 94, 81–100. [Google Scholar] [CrossRef]
- Luo, H.; Li, C.; Wu, M.; Cai, L. An Enhanced Lightweight Network for Road Damage Detection Based on Deep Learning. Electronics 2023, 12, 2583. [Google Scholar] [CrossRef]
- Jain, S. DeepSeaNet: Improving Underwater Object Detection using EfficientDet. arXiv 2023, arXiv:2306.06075. [Google Scholar]
- Čirjak, D.; Aleksi, I.; Lemic, D.; Pajač Živković, I. EfficientDet-4 Deep Neural Network-Based Remote Monitoring of Codling Moth Population for Early Damage Detection in Apple Orchard. Agriculture 2023, 13, 961. [Google Scholar] [CrossRef]
- Wu, C.; Chen, L.; Wu, S. A Novel Metric-Learning-Based Method for Multi-Instance Textureless Objects’ 6D Pose Estimation. Appl. Sci. 2021, 11, 10531. [Google Scholar] [CrossRef]
- Chakole, S.; Ukani, N. Low-Cost Vision System for Pick and Place application using camera and ABB Industrial Robot. In Proceedings of the 2020 11th International Conference on Computing, Communication and Networking Technologies (ICCCNT), Kharagpur, India, 1–3 July 2020. [Google Scholar]
- Konaite, M.; Owolawi, P.A.; Mapayi, T.; Malele, V.; Odeyemi, K.; Aiyetoro, G.; Ojo, J.S. Smart Hat for the blind with Real-Time Object Detection using Raspberry Pi and TensorFlow Lite. In Proceedings of the International Conference on Artificial Intelligence and Its Applications, Virtual, 9–10 December 2021. [Google Scholar]
- Barayan, M.A.; Qawas, A.A.; Alghamdi, A.S.; Alkhallagi, T.S.; Al-Dabbagh, R.A.; Aldabbagh, G.A.; Linjawi, A.I. Effectiveness of Machine Learning in Assessing the Diagnostic Quality of Bitewing Radiographs. Appl. Sci. 2022, 12, 9588. [Google Scholar] [CrossRef]
- Benhamida, A.; Várkonyi-Kóczy, A.R.; Kozlovszky, M. Traffic Signs Recognition in a mobile-based application using TensorFlow and Transfer Learning technics. In Proceedings of the IEEE 15th Conference of Systems of Systems of Engineering, Budapest, Hungary, 2–4 June 2020. [Google Scholar]
- Dua, S.; Kumar, S.S.; Albagory, Y.; Ramalingam, R.; Dumka, A.; Singh, R.; Rashid, M.; Gehlot, A.; Alshamrani, S.S.; AlGhamdi, A.S. Developing a Speech Recognition System for Recognizing Tonal Speech Signals Using a Convolutional Neural Network. Appl. Sci. 2022, 12, 6223. [Google Scholar] [CrossRef]
- Kim, I.S.; Jeong, Y.; Kim, S.H.; Jang, J.S.; Jung, S.K. Deep Learning based Effective Surveillance System for Low-Illumination Environments. In Proceedings of the 2019 Eleventh International Conference on Ubiquitous and Future Networks (ICUFN), Zagreb, Croatia, 2–5 July 2019. [Google Scholar]
- Nagata, F.; Miki, K.; Watanabe, K.; Habib, M.K. Visual Feedback Control and Transfer Learning-Based CNN for a Pick and Place Robot on a Sliding Rail. In Proceedings of the 2021 IEEE International Conference on Mechatronics and Automation (ICMA), Takamatsu, Japan, 8–11 August 2021; pp. 697–702. [Google Scholar]
- Malik, A.A.; Andersen, M.V.; Bilberg, A. Advances in machine vision for flexible feeding of assembly parts. Procedia Manuf. 2019, 38, 1228–1235. [Google Scholar] [CrossRef]
- TensorFlow Lite Model Maker. Available online: https://www.tensorflow.org/lite/models/modify/model_maker (accessed on 5 September 2023).
- Roboflow. Available online: https://roboflow.com (accessed on 6 September 2023).
- Google Colab Notebook. Available online: https://colab.research.google.com (accessed on 5 September 2023).
- JIS Z 9110:1979; Recommended Levels of Illumination. Japanese Standards Association: Tokyo, Japan, 2008.
- Keskar, N.S.; Mudigere, D.; Nocedal, J.; Smelyanskiy, M.; Tang, P.T. On large-batch training for deep learning: Generalization gap and sharp minima. arXiv 2016, arXiv:1609.04836. [Google Scholar]
- Kee, E.; Chong, J.J.; Choong, Z.J.; Lau, M. A Comparative Analysis of Cross-Validation Techniques for a Smart and Lean Pick-and-Place Solution with Deep Learning. Electronics 2023, 12, 2371. [Google Scholar] [CrossRef]
- Kasuya, E. Mann-Whitney U test when variances are unequal. Anim. Behav. 2001, 61, 1247–1249. [Google Scholar] [CrossRef]
- Nachar, N. The Mann-Whitney U: A test for assessing whether two independent samples come from the same distribution. Tutor. Quant. Methods Psychol. 2008, 4, 13–20. [Google Scholar] [CrossRef]
- Geweke, J.F.; Singleton, K.J. Interpreting the likelihood ratio statistic in factor models when sample size is small. J. Am. Stat. Assoc. 1980, 75, 133–137. [Google Scholar] [CrossRef]
Disclaimer/Publisher’s Note: The statements, opinions and data contained in all publications are solely those of the individual author(s) and contributor(s) and not of MDPI and/or the editor(s). MDPI and/or the editor(s) disclaim responsibility for any injury to people or property resulting from any ideas, methods, instructions or products referred to in the content. |
© 2023 by the authors. Licensee MDPI, Basel, Switzerland. This article is an open access article distributed under the terms and conditions of the Creative Commons Attribution (CC BY) license (https://creativecommons.org/licenses/by/4.0/).