Article

Prediction of the Moisture Content in Corn Straw Compost Based on Their Dielectric Properties

1
College of Engineering, Shenyang Agricultural University, Shenyang 110866, China
2
College of Water Conservancy, Shenyang Agricultural University, Shenyang 110866, China
*
Author to whom correspondence should be addressed.
Appl. Sci. 2023, 13(2), 917; https://doi.org/10.3390/app13020917
Submission received: 13 December 2022 / Revised: 30 December 2022 / Accepted: 6 January 2023 / Published: 9 January 2023

Abstract

:
This study proposes a novel method for the rapid detection of compost moisture content. The effects of the test frequency (1 to 100 kHz), compost moisture content (5% to 35%), temperature (25 to 65 °C), and bulk density (665.6 to 874.3 kg/m3) on the dielectric properties (the dielectric constant ε and the loss factor ε ) in the compost consisting of fresh sheep and manure corn were investigated. The mechanism for the change in dielectric properties was analyzed. The feature variables of dielectric parameters ( ε , ε , and the combination of ε and ε ) were selected using principal component analysis (PCA), and the selected characteristic variables and the full-frequency variables were used to perform support vector machine regression (SVR) modeling. The results revealed that the increase in both temperature and bulk density in the frequency band from 1 to 100 kHz increased ε and ε . The PCA–SVR model with both ε and ε combined variables achieved the best results, with a prediction set coefficient of determination of 0.9877 and a root mean square error of 0.0026. In conclusion, the method of predicting the moisture content based on the dielectric properties of compost is feasible.

1. Introduction

China’s annual corn production is approximately 200 million tons. Corn straw that is produced as a byproduct is typically wasted [1]. However, corn straw contains nutrients, such as nitrogen, phosphorus, potassium, magnesium, calcium, and sulfur, which can aid crop growth; corn straw can be used as a fertilizer in agricultural production [2]. Straw composting technology, as a straw resource utilization technology [3], is a mixture of the crop straw, weeds, and other plant materials with livestock and poultry manure in a pile. Under suitable conditions, the synergistic action of various microorganisms degrades material, which can then be applied to the field for increasing soil fertility and improving soil physical and chemical properties [4].
Moisture is a critical process control parameter in composting and the basis for microbial activities [5,6]. The moisture content of the initial stage of corn straw compost was about 65%, and after the fermentation was completed, it dropped to 28–35%, while the moisture content of its products must be less than 30% [7]. A high moisture content results in local anaerobic piles, and a low moisture content leads to a decrease in microbial activity [8]. Furthermore, the moisture content plays a crucial role in all stages of composting. For example, the moisture content in the initial stage affects the compost product’s decomposition and the emission of polluting gases [9]. Furthermore, NY-525-2012 (agricultural industry standards of China) reveals that the moisture content values of the compost are directly or indirectly involved in calculating various indicators. Therefore, real-time and accurate access to material moisture content data helps operators understand the composting process, control the composting reaction rate, and optimize the process parameters for improving composting efficiency and reducing investment and operating costs [10].
The dielectric technique establishes an intrinsic link between the electromagnetic and physicochemical properties of the object to be measured by directly measuring the information inside the sample. This technique is more reliable than the spectroscopic technique [11,12]. Dielectric properties are the response characteristic of a substance under the action of an electric field and are typically expressed by the complex permittivity ε*, which describes the interaction of the sample with the applied electric field [13]. Here, ε is the dielectric constant and ε is the loss factor. As presented in Equation (1), the dielectric constant ( ε ) and the loss factor ( ε ) correspond to the real and imaginary parts of complex permittivity (ε*), respectively.
ε * = ε j ε
Since the first publication of data on grain dielectric parameters in 1953 [14], numerous studies have been conducted on the dielectric properties of agricultural products. Scholars have applied this technology for measuring the moisture content in many fields, such as building materials and pelleted biomass, and verified its effectiveness. Jun Sun et al. [15] fused the information of ε and ε and used a nonlinear modeling method combining the continuous projection algorithm (SPA) and SVR to demonstrate the feasibility of nondestructive testing of the corn leaf moisture content based on dielectric properties. Wenchuan Guo et al. [16] developed a ternary mathematical model describing the straw capacitance with the moisture content, temperature, and bulk density and verified the reliability of the technique. Xiong et al. [17] used a modified ISO (MISO) model combined with the dielectric constant of the asphalt mixture to estimate its moisture content. The results revealed that the MISO model predicted the moisture content with a high R2 value of more than 0.74. McKeown MS et al. [18] investigated the dielectric properties of peanut shells and pine wood chip pellets at three flow rates. They created a mathematical model to forecast the moisture content of peanut shells and pine wood chip particles under dynamic conditions with a standard error of calibration between 0.48% and 0.56%. Furthermore, the dielectric technique has been widely used for soil moisture content measurement because of its stable performance and simple operation for nondestructive testing [19]. Numerous equations have been proposed on the relationship between soil dielectric constant and moisture content [20,21,22]. Lu Cai et al. [23] determined the moisture content of sew-age sludge composting materials by TDR using coated probes. TDR probes were calibrated as a function of dielectric properties that included temperature effects. The relative error was 0.92 ± 0.72% when comparing the measured values of TDR of the samples with those of the weight method, indicating that the measured values of TDR have high accuracy.
Meanwhile, compost has a similar structure to the soil, and Calamita et al. [24] investigated the capability of the resistivity measurement technique in soil moisture estimation. The result showed that the resistivity method achieved better results in monitoring soil moisture over large areas with a root mean square error of 4.4% vol/vol on average. In summary, dielectric techniques have potential applications in detecting the moisture content of corn composting materials.
Moisture detectors developed based on dielectric properties have been applied to cereal crops and soils. Limited studies have been conducted on the dielectric properties of compost materials. As a rapid method to detect the moisture content of materials, dielectric technology has many influencing factors, including the temperature, moisture content, and bulk density. If the data processing technique is imperfect, measurement accuracy decreases [25]. Furthermore, the measurement method of dielectric parameters is technologically complex. Therefore, in this study, the effects of frequency (1 to 100 kHz), moisture content (5% to 35%), temperature (25 to 65 °C), and bulk density (683.8 to 829.1 kg/m3) on the dielectric constant ε and the loss factor ε were investigated. The variation in dielectric properties and its causes were also analyzed. A mathematical model of the dielectric parameters and their primary influencing factors was established for evaluating the feasibility of the dielectric properties in predicting the moisture content of compost. Thus, a feasible method with sound scientific basis was proposed for developing a low-cost and high-efficiency compost moisture content detector.

2. Materials and Methods

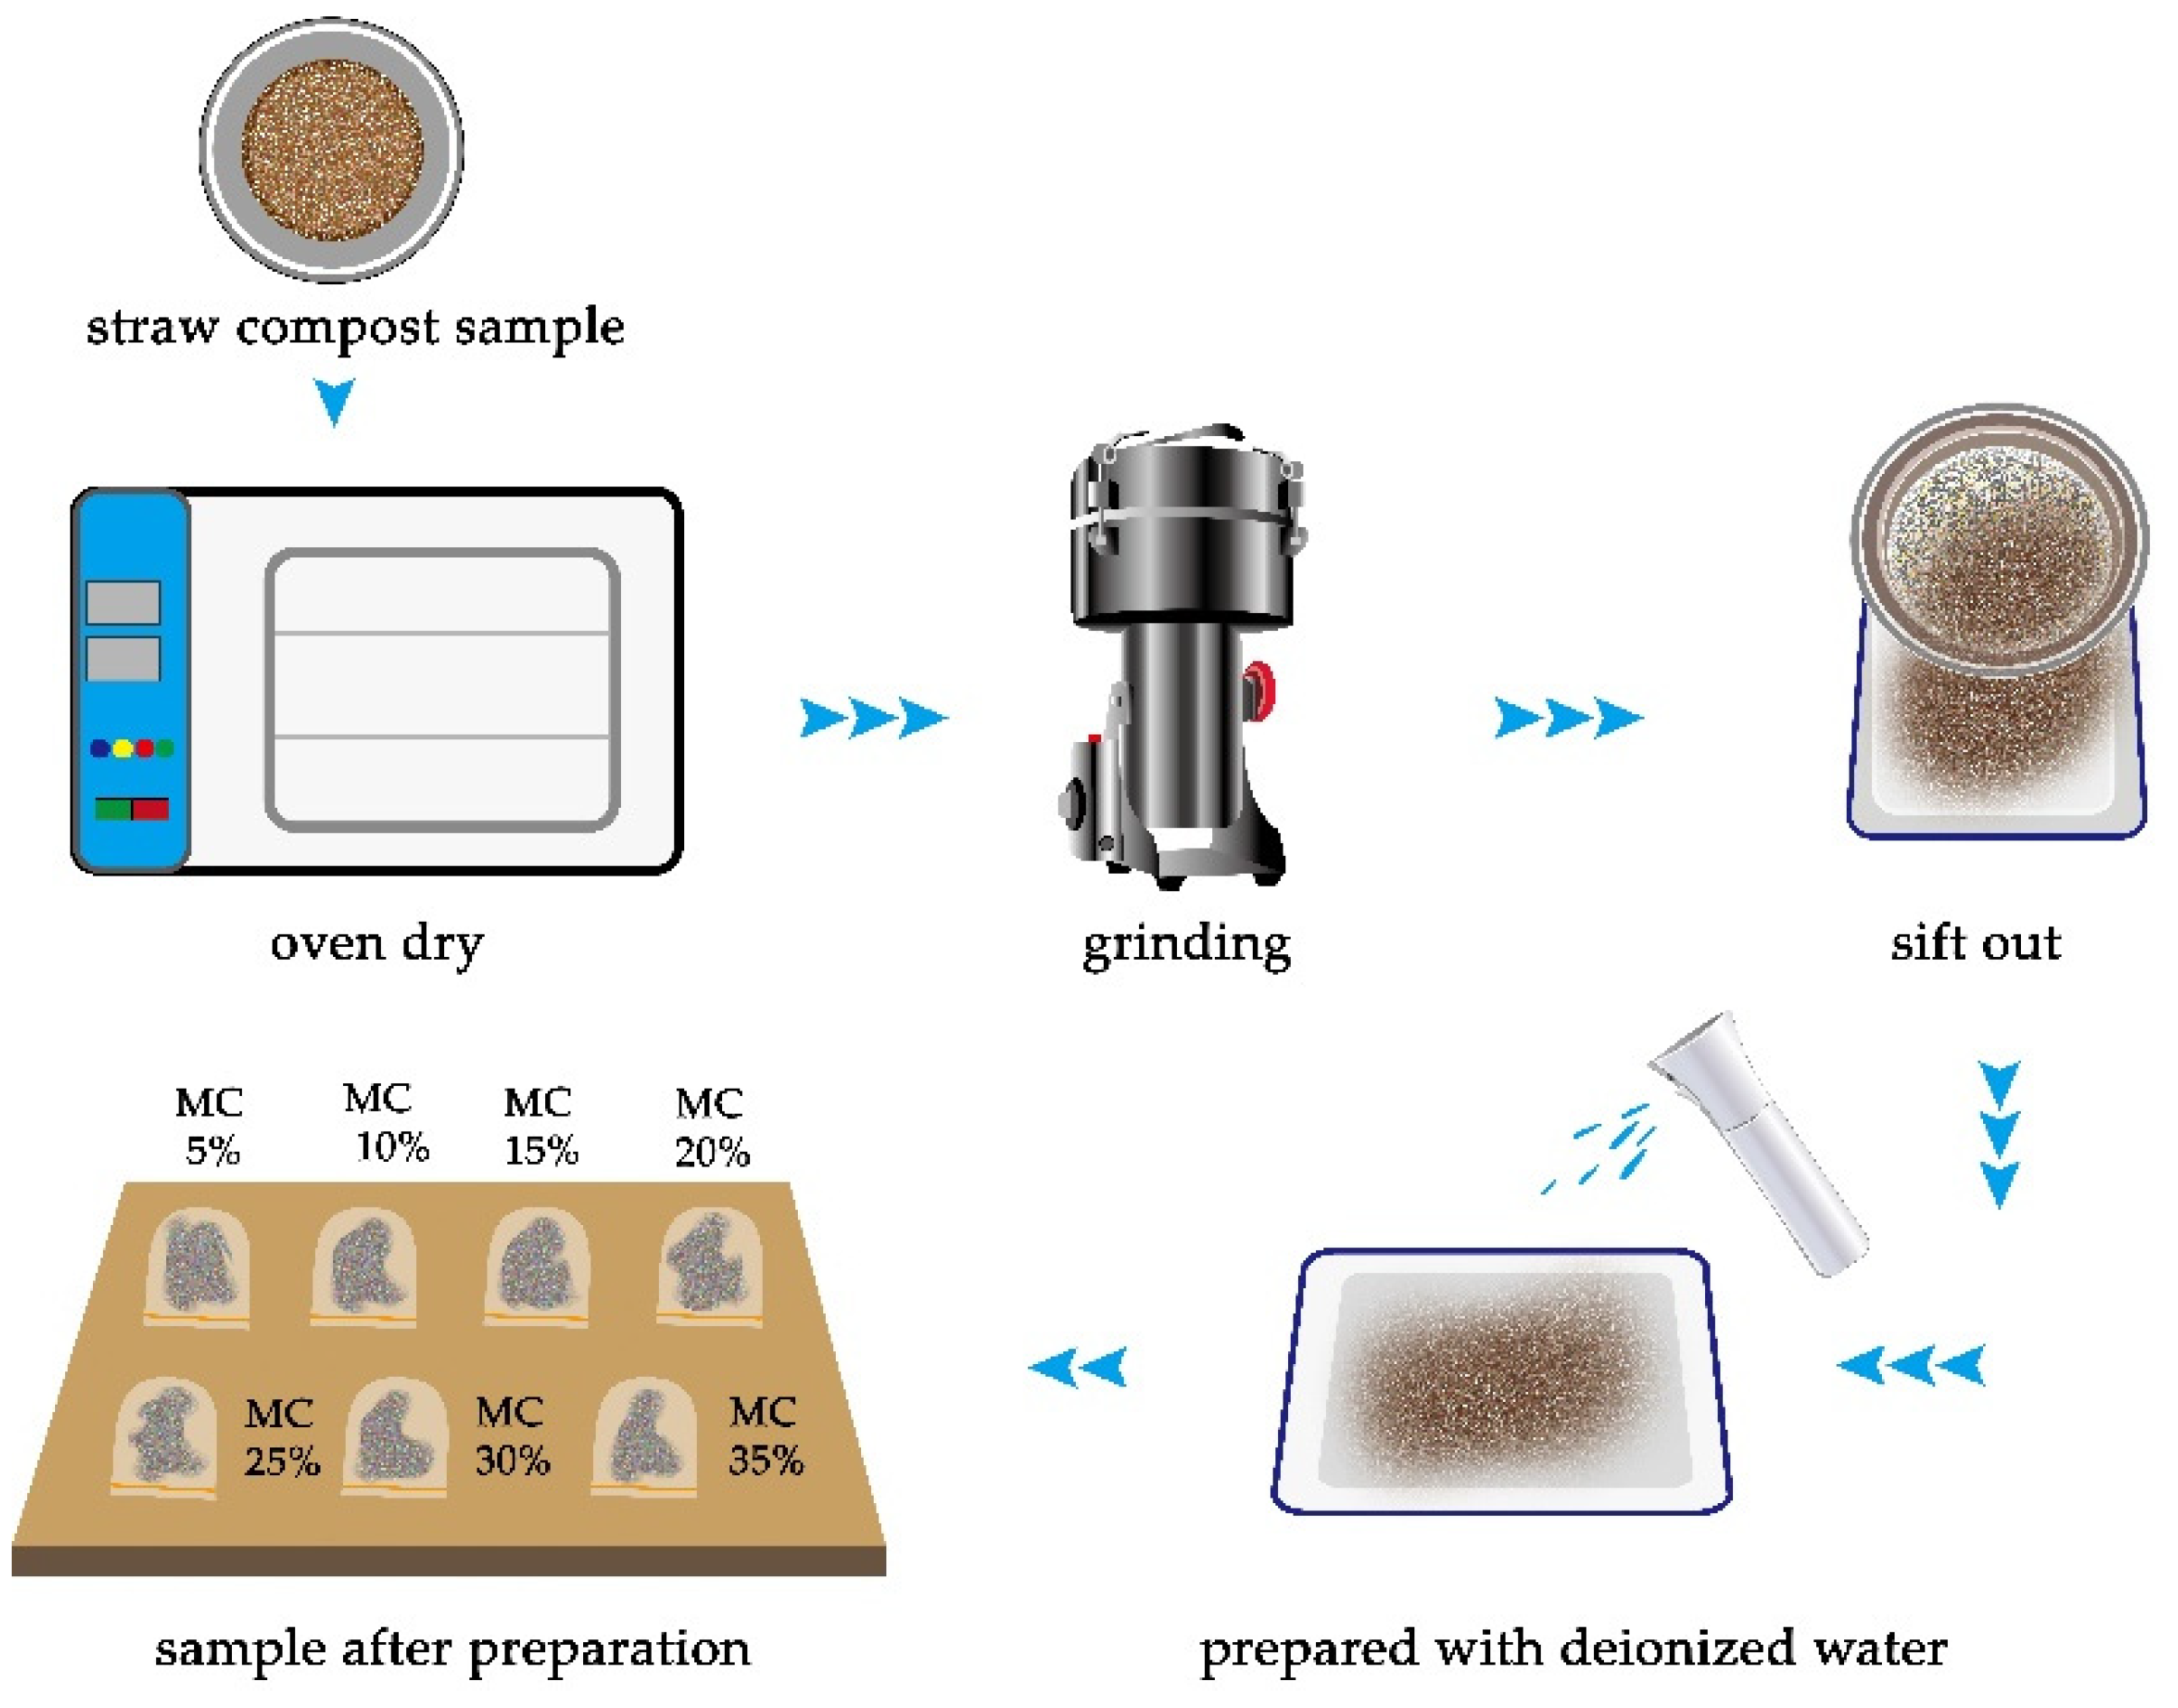
2.1. Sample Preparations

In this experiment, fresh sheep manure and corn straw compost produced in June 2021 in Xinkou Industrial Park, Baodi District, Tianjin, were used as the test material. The test raw materials were dried in a far-infrared drying oven (Model: HY-1B, manufacturer: China Tianjin Tongli Xinda Instrument Factory, Tianjin, China), crushed using a high-speed grinder (Model: LD-Y400A, manufacturer: Shanghai Topsun Electrical Co., Ltd., Shanghai, China), and then sieved with a standard inspection sieve with an aperture (Shaoxing Shangyu Huafeng Hardware Instrument Co., Ltd., Shaoxing City, Zhejiang Province, China) size of 1.2 mm to remove the fine straw and other debris. The sieved samples were placed into sealed bags for storage. Seven samples of 160 g were removed from the sealed bags and placed in a 5 × 5 × 5 cm self-made acrylic capacitor on an electronic analytical balance (Model: LQ-CZ10002, Manufacturer: Kunshan Ucovite Electronic Technology Co., Ltd., Suzhou, Jiangsu Province, China). The amount of deionized water to be added was calculated to prepare the samples with various moisture contents, provided that the initial sample mass was known. Deionized water was sprayed on the samples with a high-pressure ultrafine mist spray bottle under constant stirring. The prepared compost samples were placed in a sealed bag and placed in a cool and dry place for 2 d; during this period, the samples were shaken 3–5 times a day to ensure uniform diffusion of moisture. Subsequently, 10 g of each sample was dried in a far-infrared drying oven at 75 °C for 24 h until the mass was constant, and the actual moisture content of the wet base of each sample was calculated based on the difference between the mass of the samples before and after drying. Finally, samples with moisture contents of 5%, 10%, 15%, 20%, 25%, 30%, and 35% (all wet basis) were obtained for the determination of dielectric parameters. The preparation process is illustrated in Figure 1.

2.2. Temperature Measurement

To detect the change in sample temperature accurately, the sensing probe of the digital thermometer was inserted into the interior of the test samples for ensuring that the probe was in the center of the square capacitor and the depth of the probe was at half the height of the capacitor. A digital thermostat water bath (Model: HH-4, Manufacturer: Tianjin Sedlis Experimental Analytical Instrument Manufacturing Factory, Tianjin, China) was used to adjust the sample temperature, and the dielectric parameters of the sample were measured when the sample temperature reached the predicted temperature.

2.3. Bulk Density Measurement

The mass of the sample filled into the self-made acrylic capacitor was divided by the volume of the capacitor as the bulk density value of the sample. The bulk density of the sample was divided into three levels. After filling the capacitor with the sample in free fall, the bulk density at various levels was obtained by no intervention (level I), ten vertical downward vibrations (level II), and vertical application of 10 N pressure (level III), respectively.

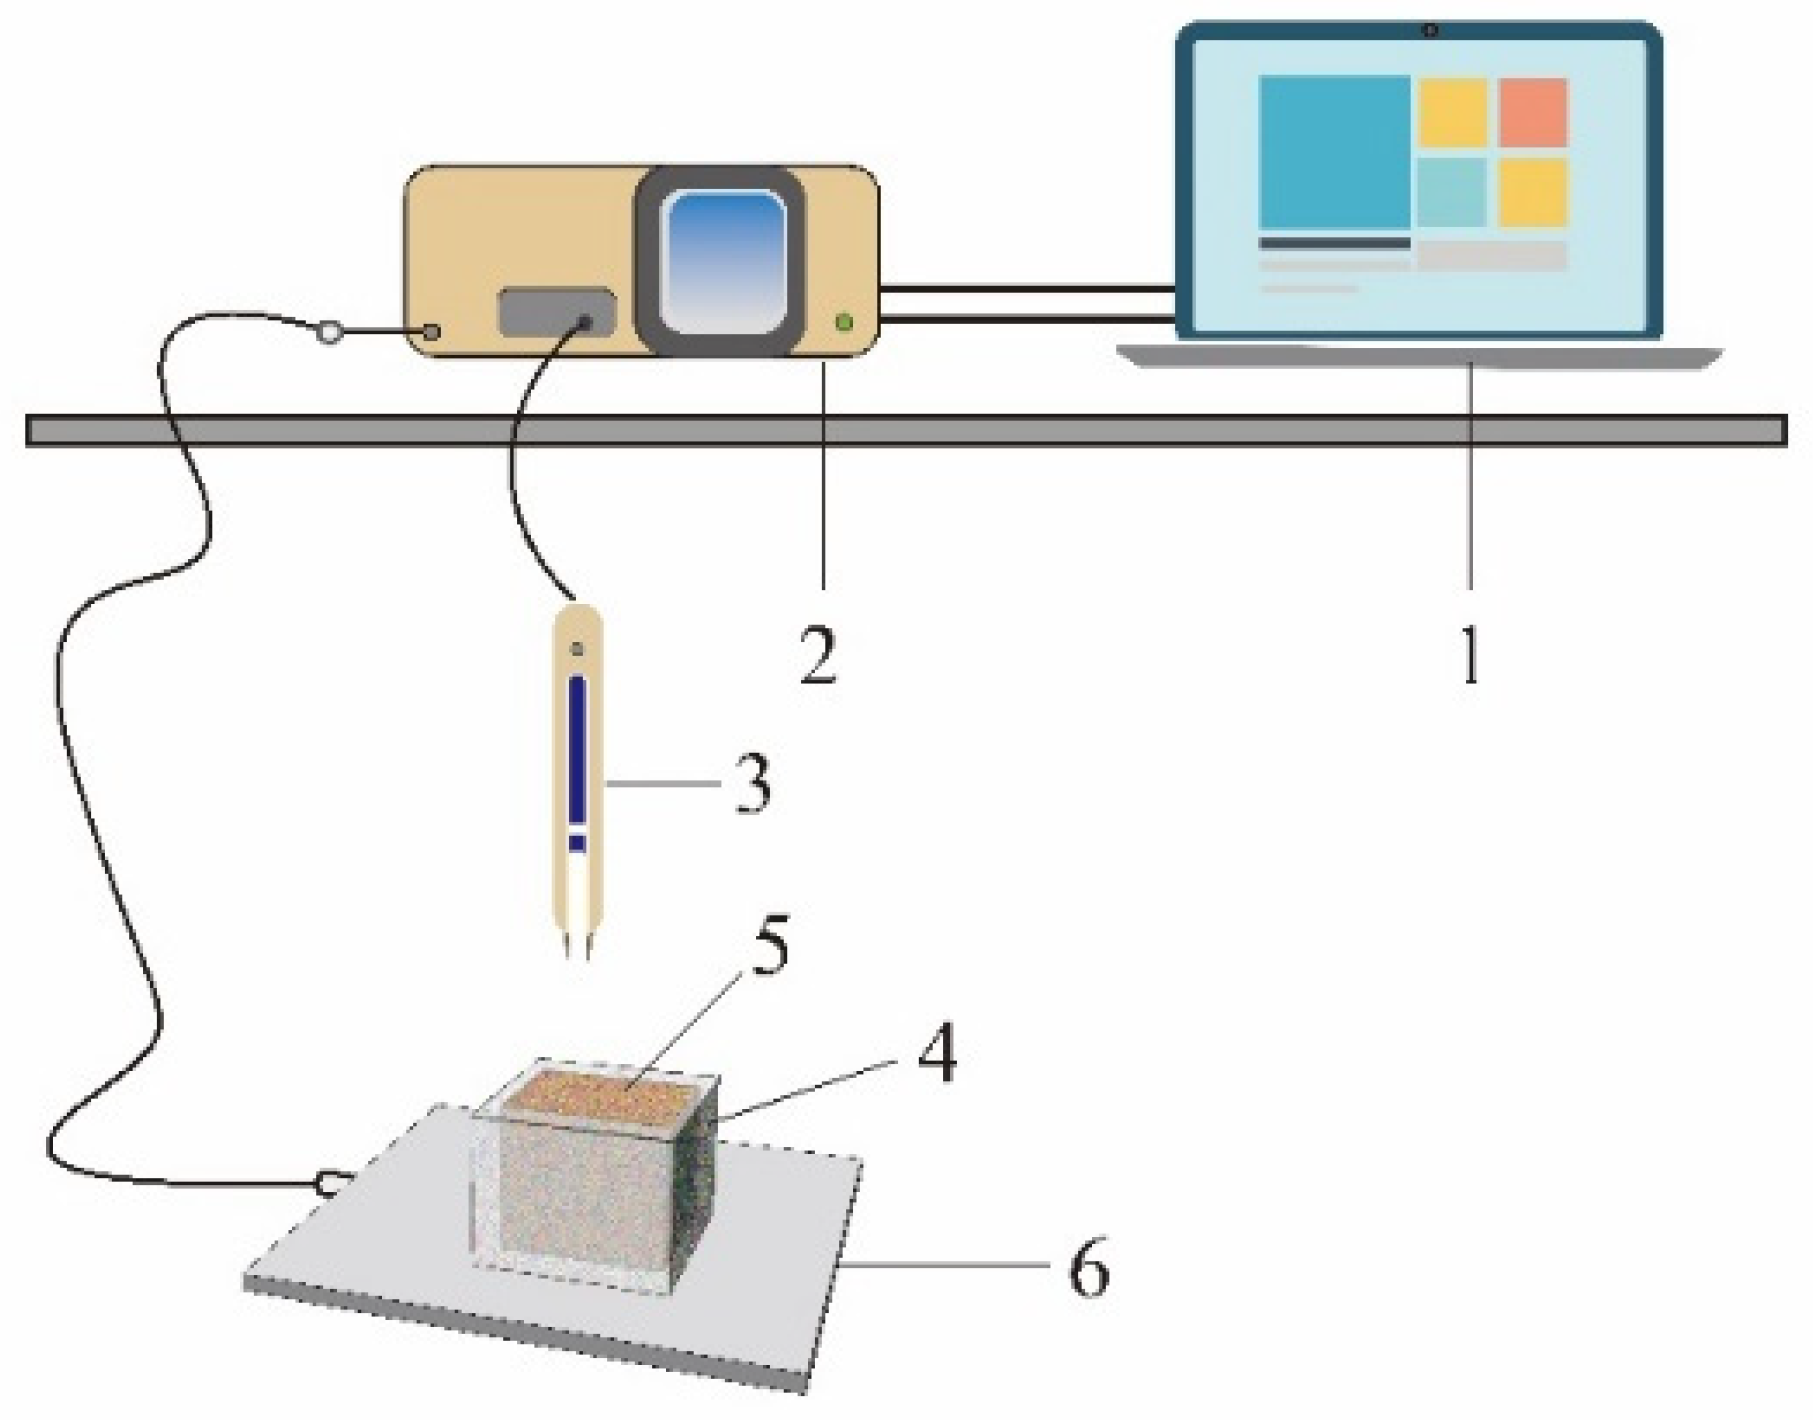
2.4. Measurement of Dielectric Properties

The system for the measurement of dielectric properties comprised an impedance analyzer (model: IM3570, manufacturer: HIOKI (Shanghai) Measurement Co., Ltd., Shanghai, China), a self-made acrylic capacitor, an LCR digital bridge test line (model: THZ26029B, manufacturer: Changzhou Tonghui Electronic Technology Co., Ltd., Changzhou, Jiangsu Province, China), and a computer (Figure 2).
The impedance analyzer was preheated for 30 min, and the LCR digital bridge test line was calibrated for short-circuit and breakage as well as for 50 Ω load. For the measurement, the excitation voltage was first set to 1 V. The impedance analyzer was used to measure the empty cylinder capacitance C0 at 113 logarithmic frequencies ranging from 1 to 100 kHz, and then, the prepared samples were placed into a homemade capacitor. The empty capacitance value of the capacitor (C0), the parallel equivalent capacitance of the sample (Cx), and the dielectric loss angle tangent (tanδ) were measured. Each sample was measured five times, and the average value was used as the measurement result. Dielectric constant ε and loss factor ε were calculated as follows:
ε = C x C 0
ε = ε tan δ

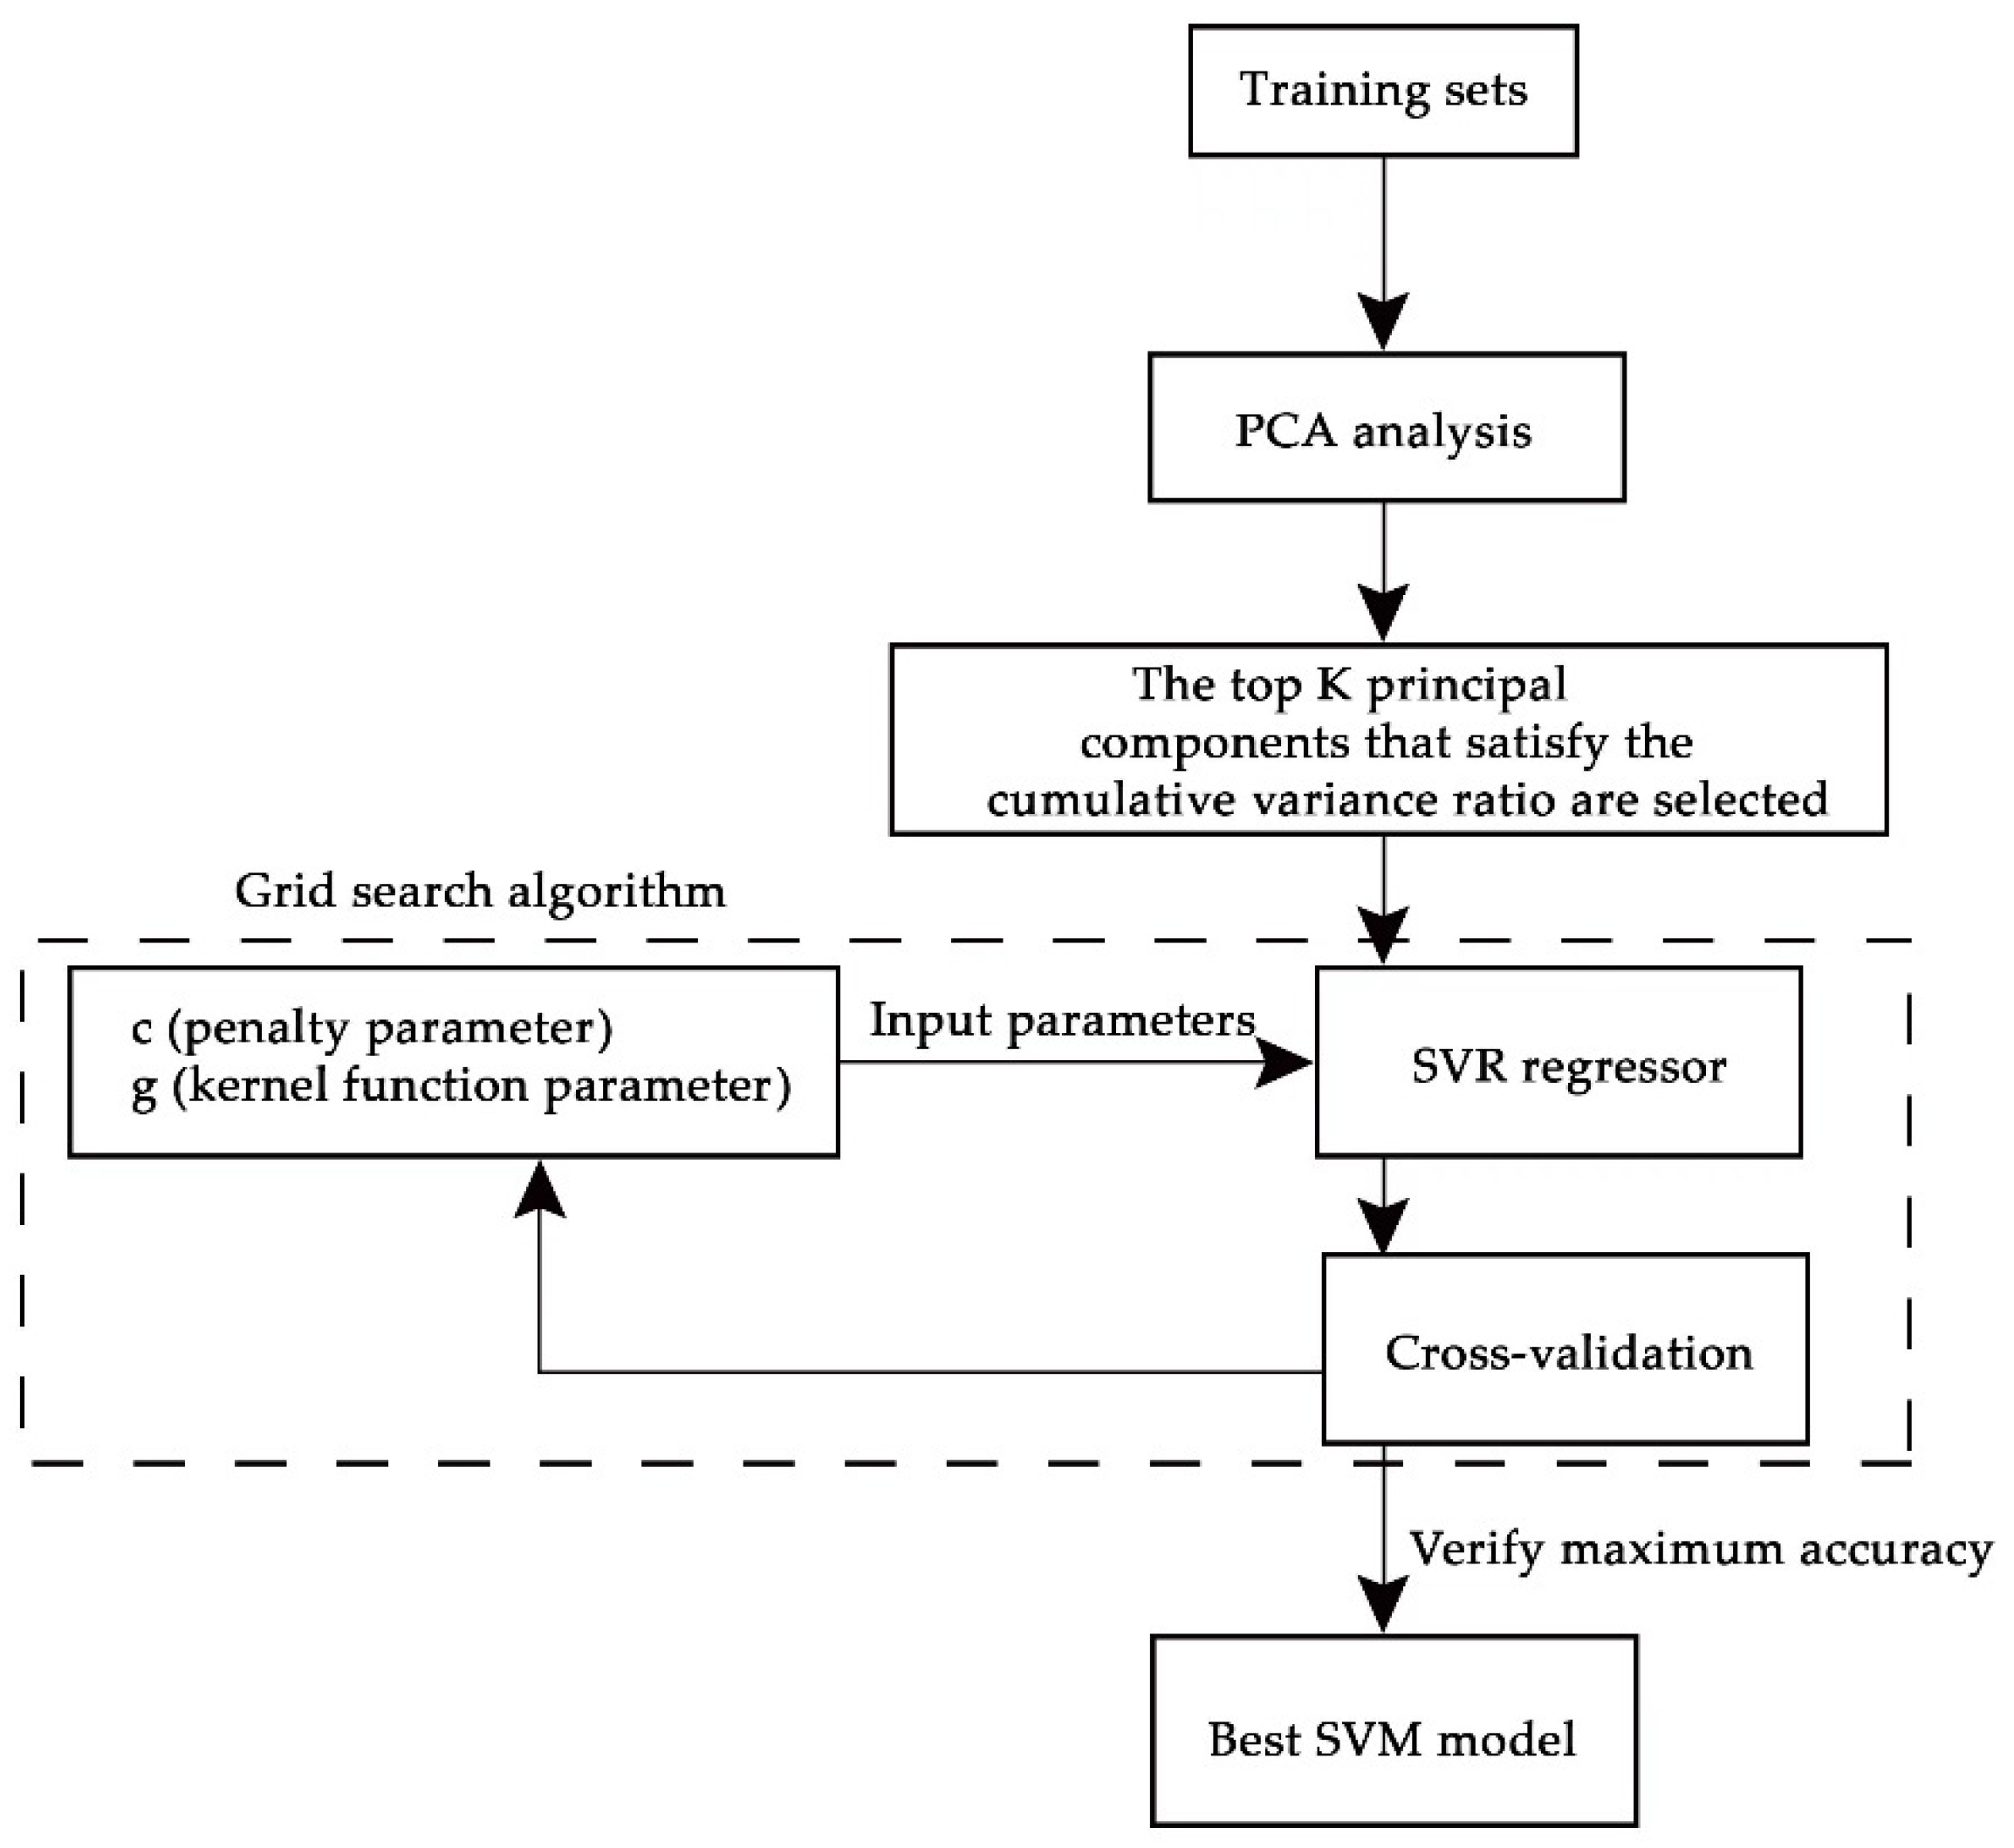
2.5. Methods of the Prediction Model

2.5.1. Principal Component Analysis

Since a specific correlation exists between the full-frequency variables of the parameters, the variables at a certain frequency point can be jointly explained by the variables at other frequency points Therefore, these variables are redundant information. This redundant information increases the complexity of the model and reduces its accuracy. Therefore, feature selection is critical [26]. Principal component analysis (PCA) is an effective mathematical method for reducing the dimensionality of multivariate data [27]. In PCA, the original indicators are combined into a set of independent, new, and integrated indicators that contain most of the original information [28]. Therefore, PCA has been used for the selection of characteristic variables for sample dielectric parameters.

2.5.2. Support Vector Machine

Support vector machine (SVM) is a machine learning method that was developed in the mid-2000s as a tool to solve problems in machine learning using optimization methods [29]. SVM improves the generalization ability of the learning machine by seeking the minimum structured risk to minimize the empirical risk and confidence range to obtain superior statistics when the statistical sample size is small [30].
Support vector regression machine (SVR) is a generalized form of SVM applied to regression fitting and is widely used in regression analysis. In SVR, a low-dimensional nondifferentiable problem is transformed into a high-dimensional problem by nonlinear mapping to render the model linearly differentiable. Compared with conventional fitting methods, SVR has the kernel function, which not only can adapt to the nonlinearity of the training sample set but also reduces the risk of overfitting through adjustable parameters. Replacing the linear term in the linear equation with a kernel function can render the original linear algorithm nonlinear [31,32]. In this study, SVR was used to predict and analyze the moisture content of straw compost, and the radial basis function (RBF) with superior stability and higher accuracy was used as the kernel function of SVR.

2.5.3. PCA–SVR Coupling Algorithm

When SVR is used for regression prediction, the selection of penalty parameter c and kernel function parameter g critically affect the prediction accuracy of the model. First, the dataset was imported into PCA for analysis to obtain the principal component dataset in descending order of information, and the top K principal components were selected according to the cumulative information ratio. Next, the SVR regression model with radial basis kernel function was imported, and various combinations of c and g parameters were sequentially configured and generated for the SVR model by the grid search algorithm [33] while using cross-validation [34] to obtain each value. At the end of the experiment, the coefficient of determination (Rc2) and root mean square error of calibration (RMSEC) of the calibration set and the coefficient of determination (Rp2) and root mean square error of prediction (RMSEP) of the prediction set were used as the evaluation models. The closer the Rc2 and Rp2 are to 1, the smaller are the RMSEC and RMSEP, and the higher is the model accuracy. Figure 3 shows the execution process of the coupled PCA–SVR algorithm used in this experiment.

3. Results

3.1. Frequency Dependence of the Dielectric Properties of Samples

To understand the relationship between frequency and permittivity, the dielectric constant ε and the loss factor ε of the samples in the frequencies ranging from 1 to 100 kHz were measured at the room temperature of 22.3 °C and the sample density of level II. The results are shown in Figure 4.
Figure 4 shows that ε and ε of the samples decreased with the increase in the test frequency in the frequency range 1–100 kHz. At room temperature, the ε and ε appeared to decrease sharply when the frequency increases from 1 to 10 kHz. The primary cause of the change in the dielectric properties of the samples could be attributed to the dipole, Maxwell–Wagner effect. With the increase in the frequency, the vibration speed of the dipole lags behind the change of the electric field, which reveals a decreasing trend of ε with the increase in the frequency. The lower the frequency, the more pronounced the decreasing trend is.

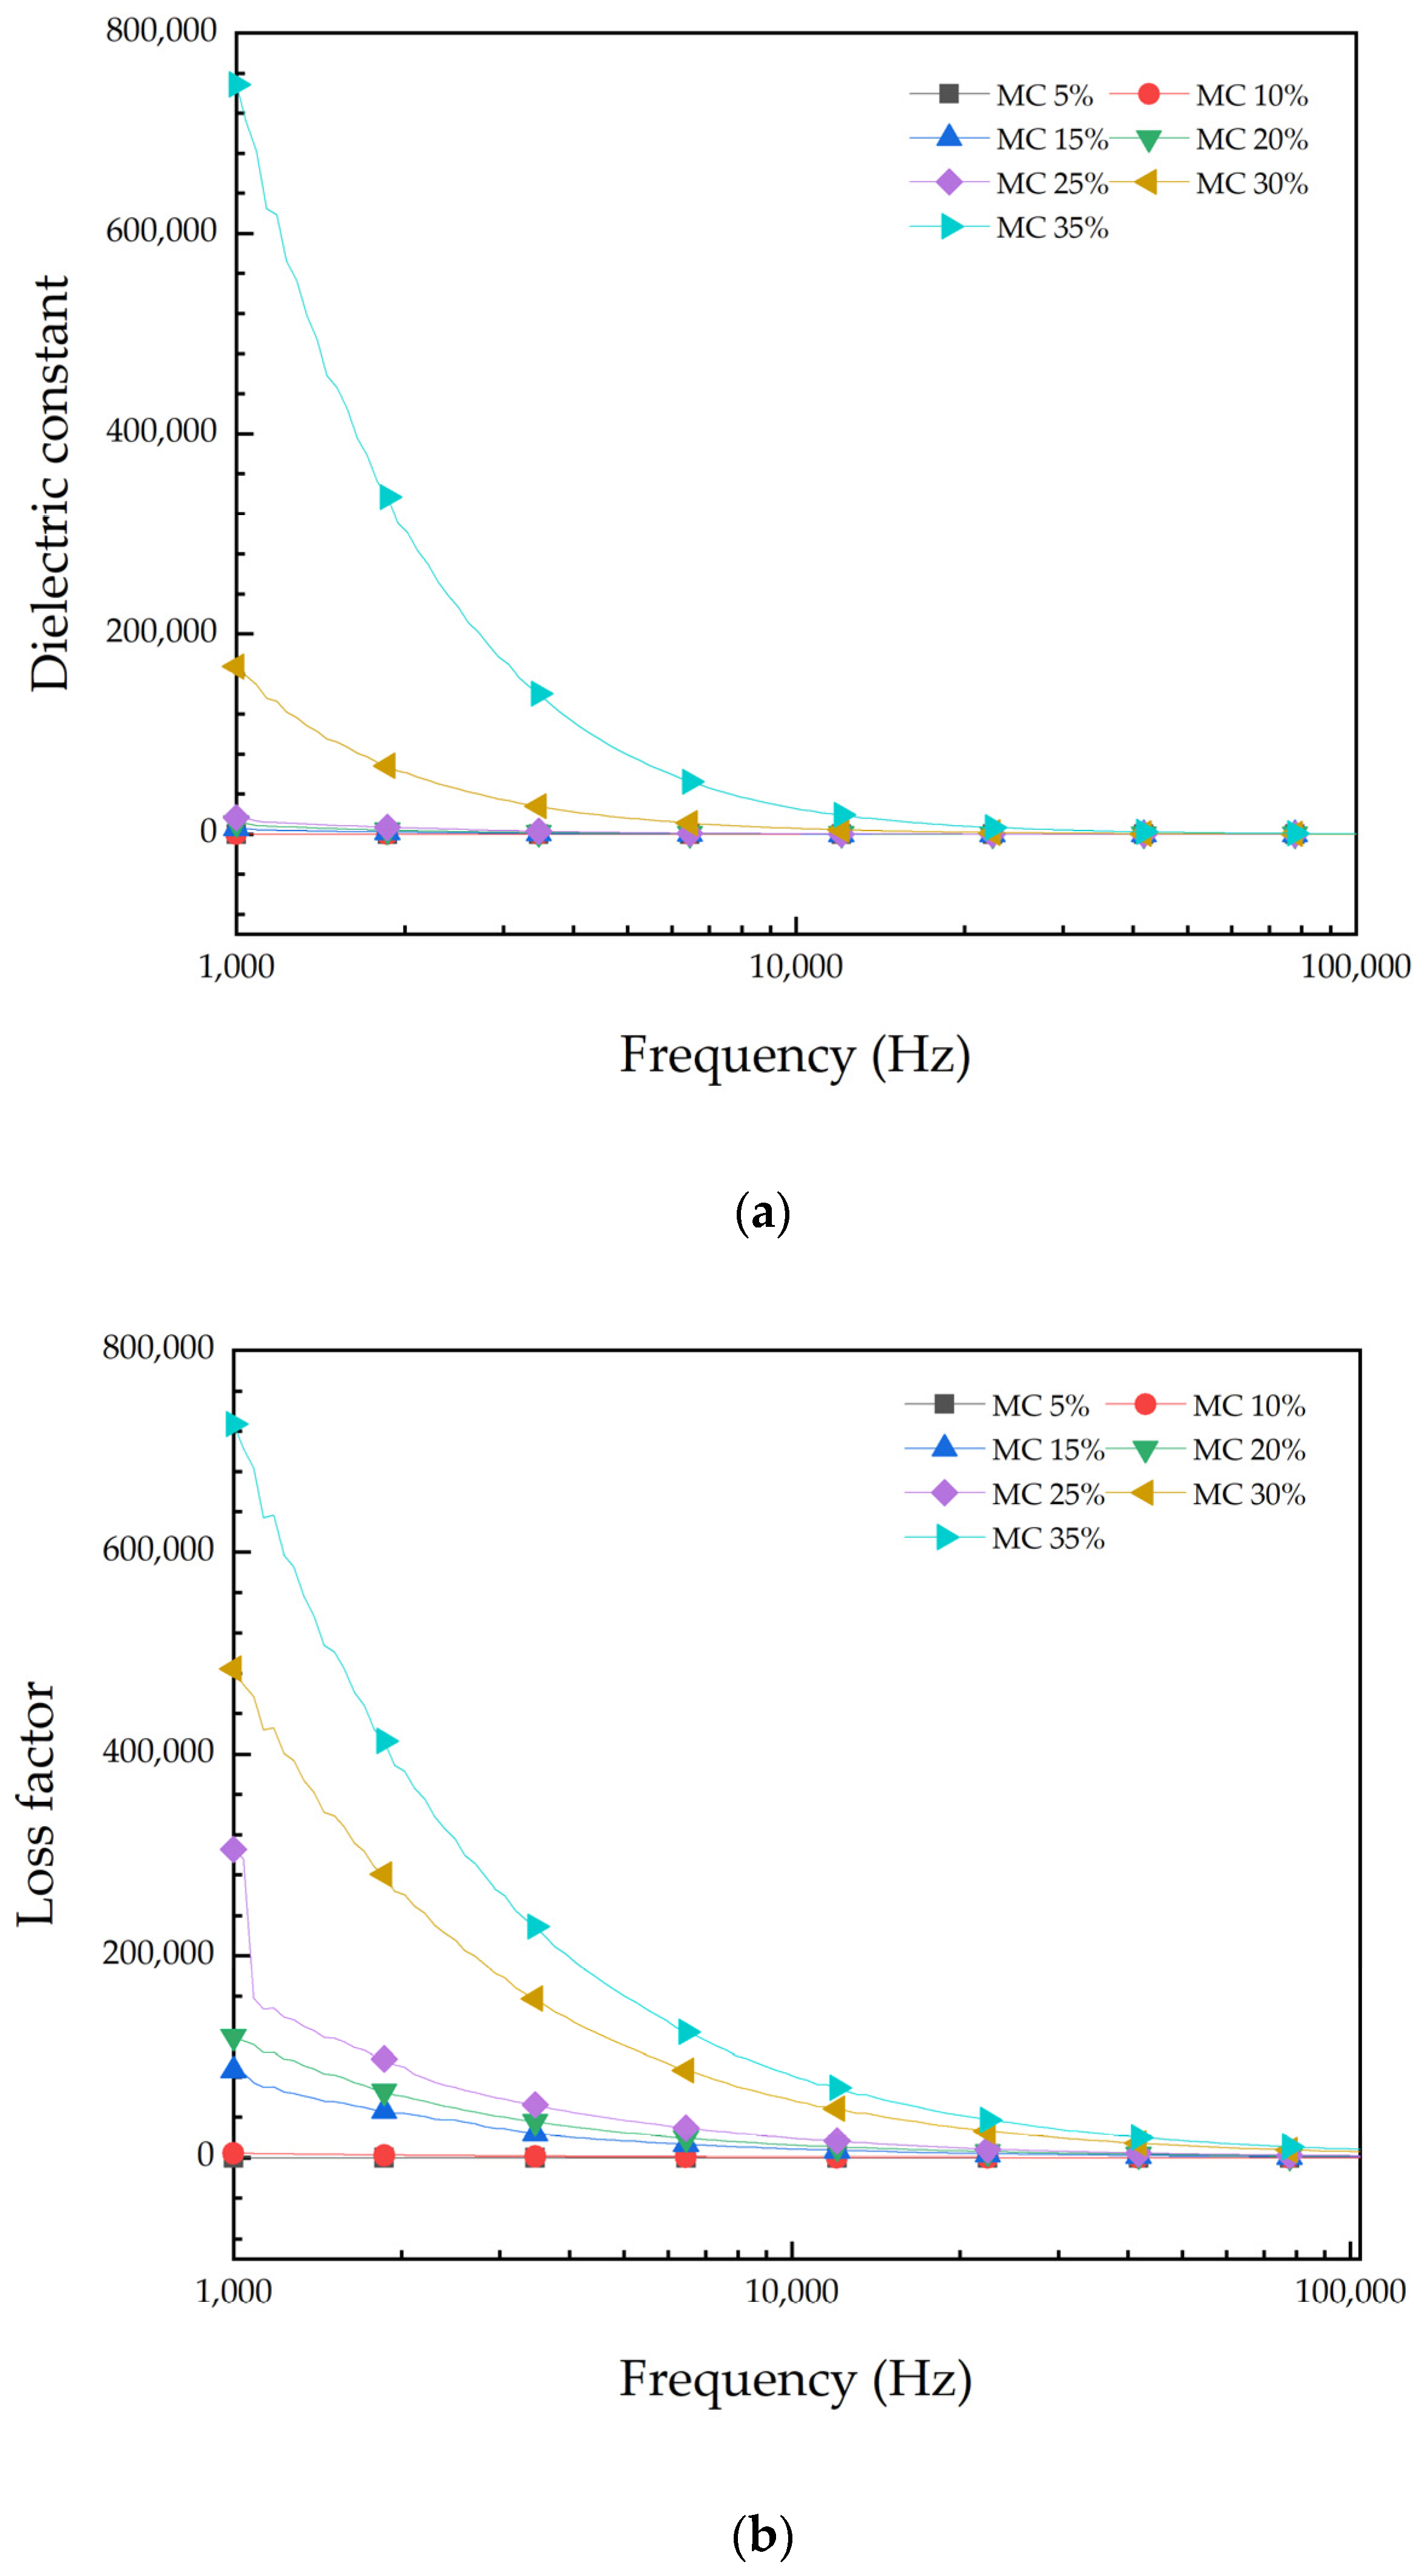
3.2. Moisture Dependence of the Dielectric Properties of Samples

To investigate the influence pattern of the moisture content on the dielectric properties of samples, the dielectric constant ε and the loss factor ε of the straw compost samples with moisture content (5–35%) at various temperatures (25–65 °C) were measured at the selected measurement frequency (10 kHz) under the condition that the sample density was level II. The results are displayed in Figure 5.
At five temperatures, ε and ε of the samples exhibited a monotonic increasing trend with the increase in the moisture content. At a constant temperature, both ε and ε of the compost samples increased with the increase in the moisture content. When the moisture content was 25–35%, ε and ε curves increased sharply. Since water is a polar molecule with a complex permittivity of 81 and a strong electric dipole moment, it is the primary factor influencing the dielectric properties of the samples [35].

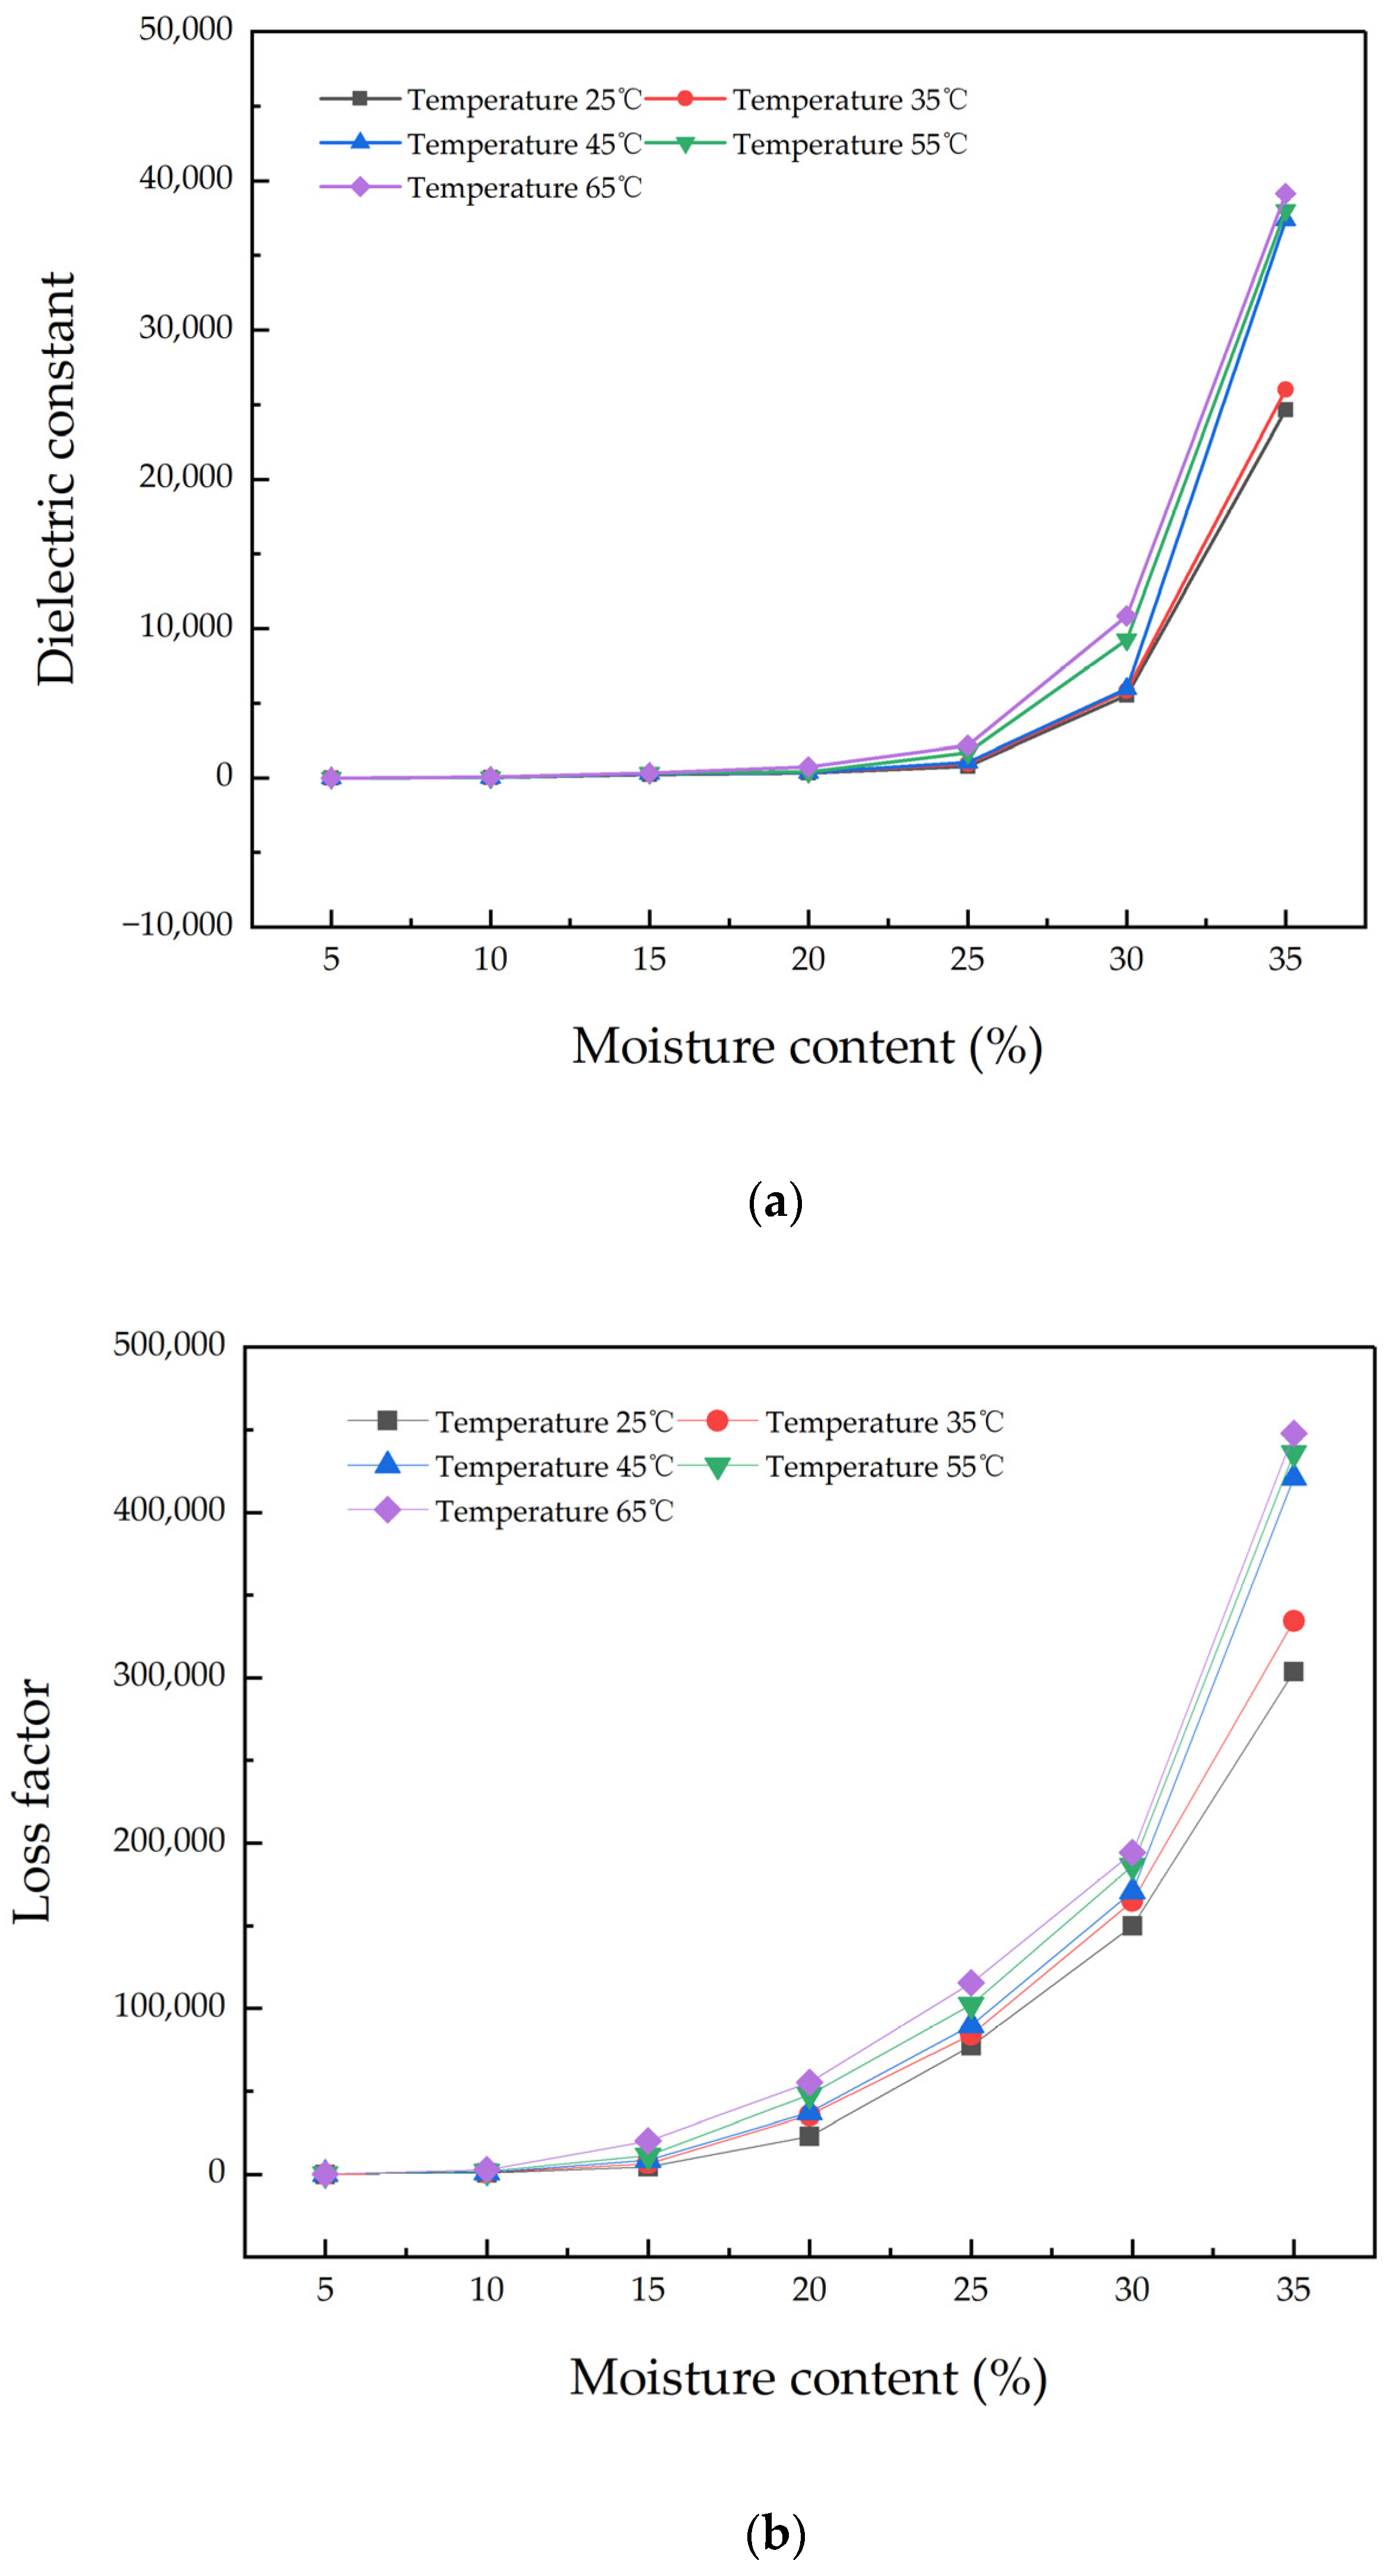
3.3. Temperature Dependence of Dielectric Properties of Samples

Under the condition that the sample density was level II, the dielectric constant ε and the loss factor ε of the samples were examined at a measurement frequency of 10 kHz under various moisture contents (5–35%). The results are displayed in Figure 6.
The figure reveals that the ε and ε of the samples increased with the increase in the temperature at the same moisture content. The higher the moisture content of the samples at the same temperature, the larger is the value of the dielectric properties and the more significant is the changing trend. The increase in the temperature accelerates the polarization of molecules and the Brownian motion of free water in the material, which results in an increasing trend of dielectric properties [36].

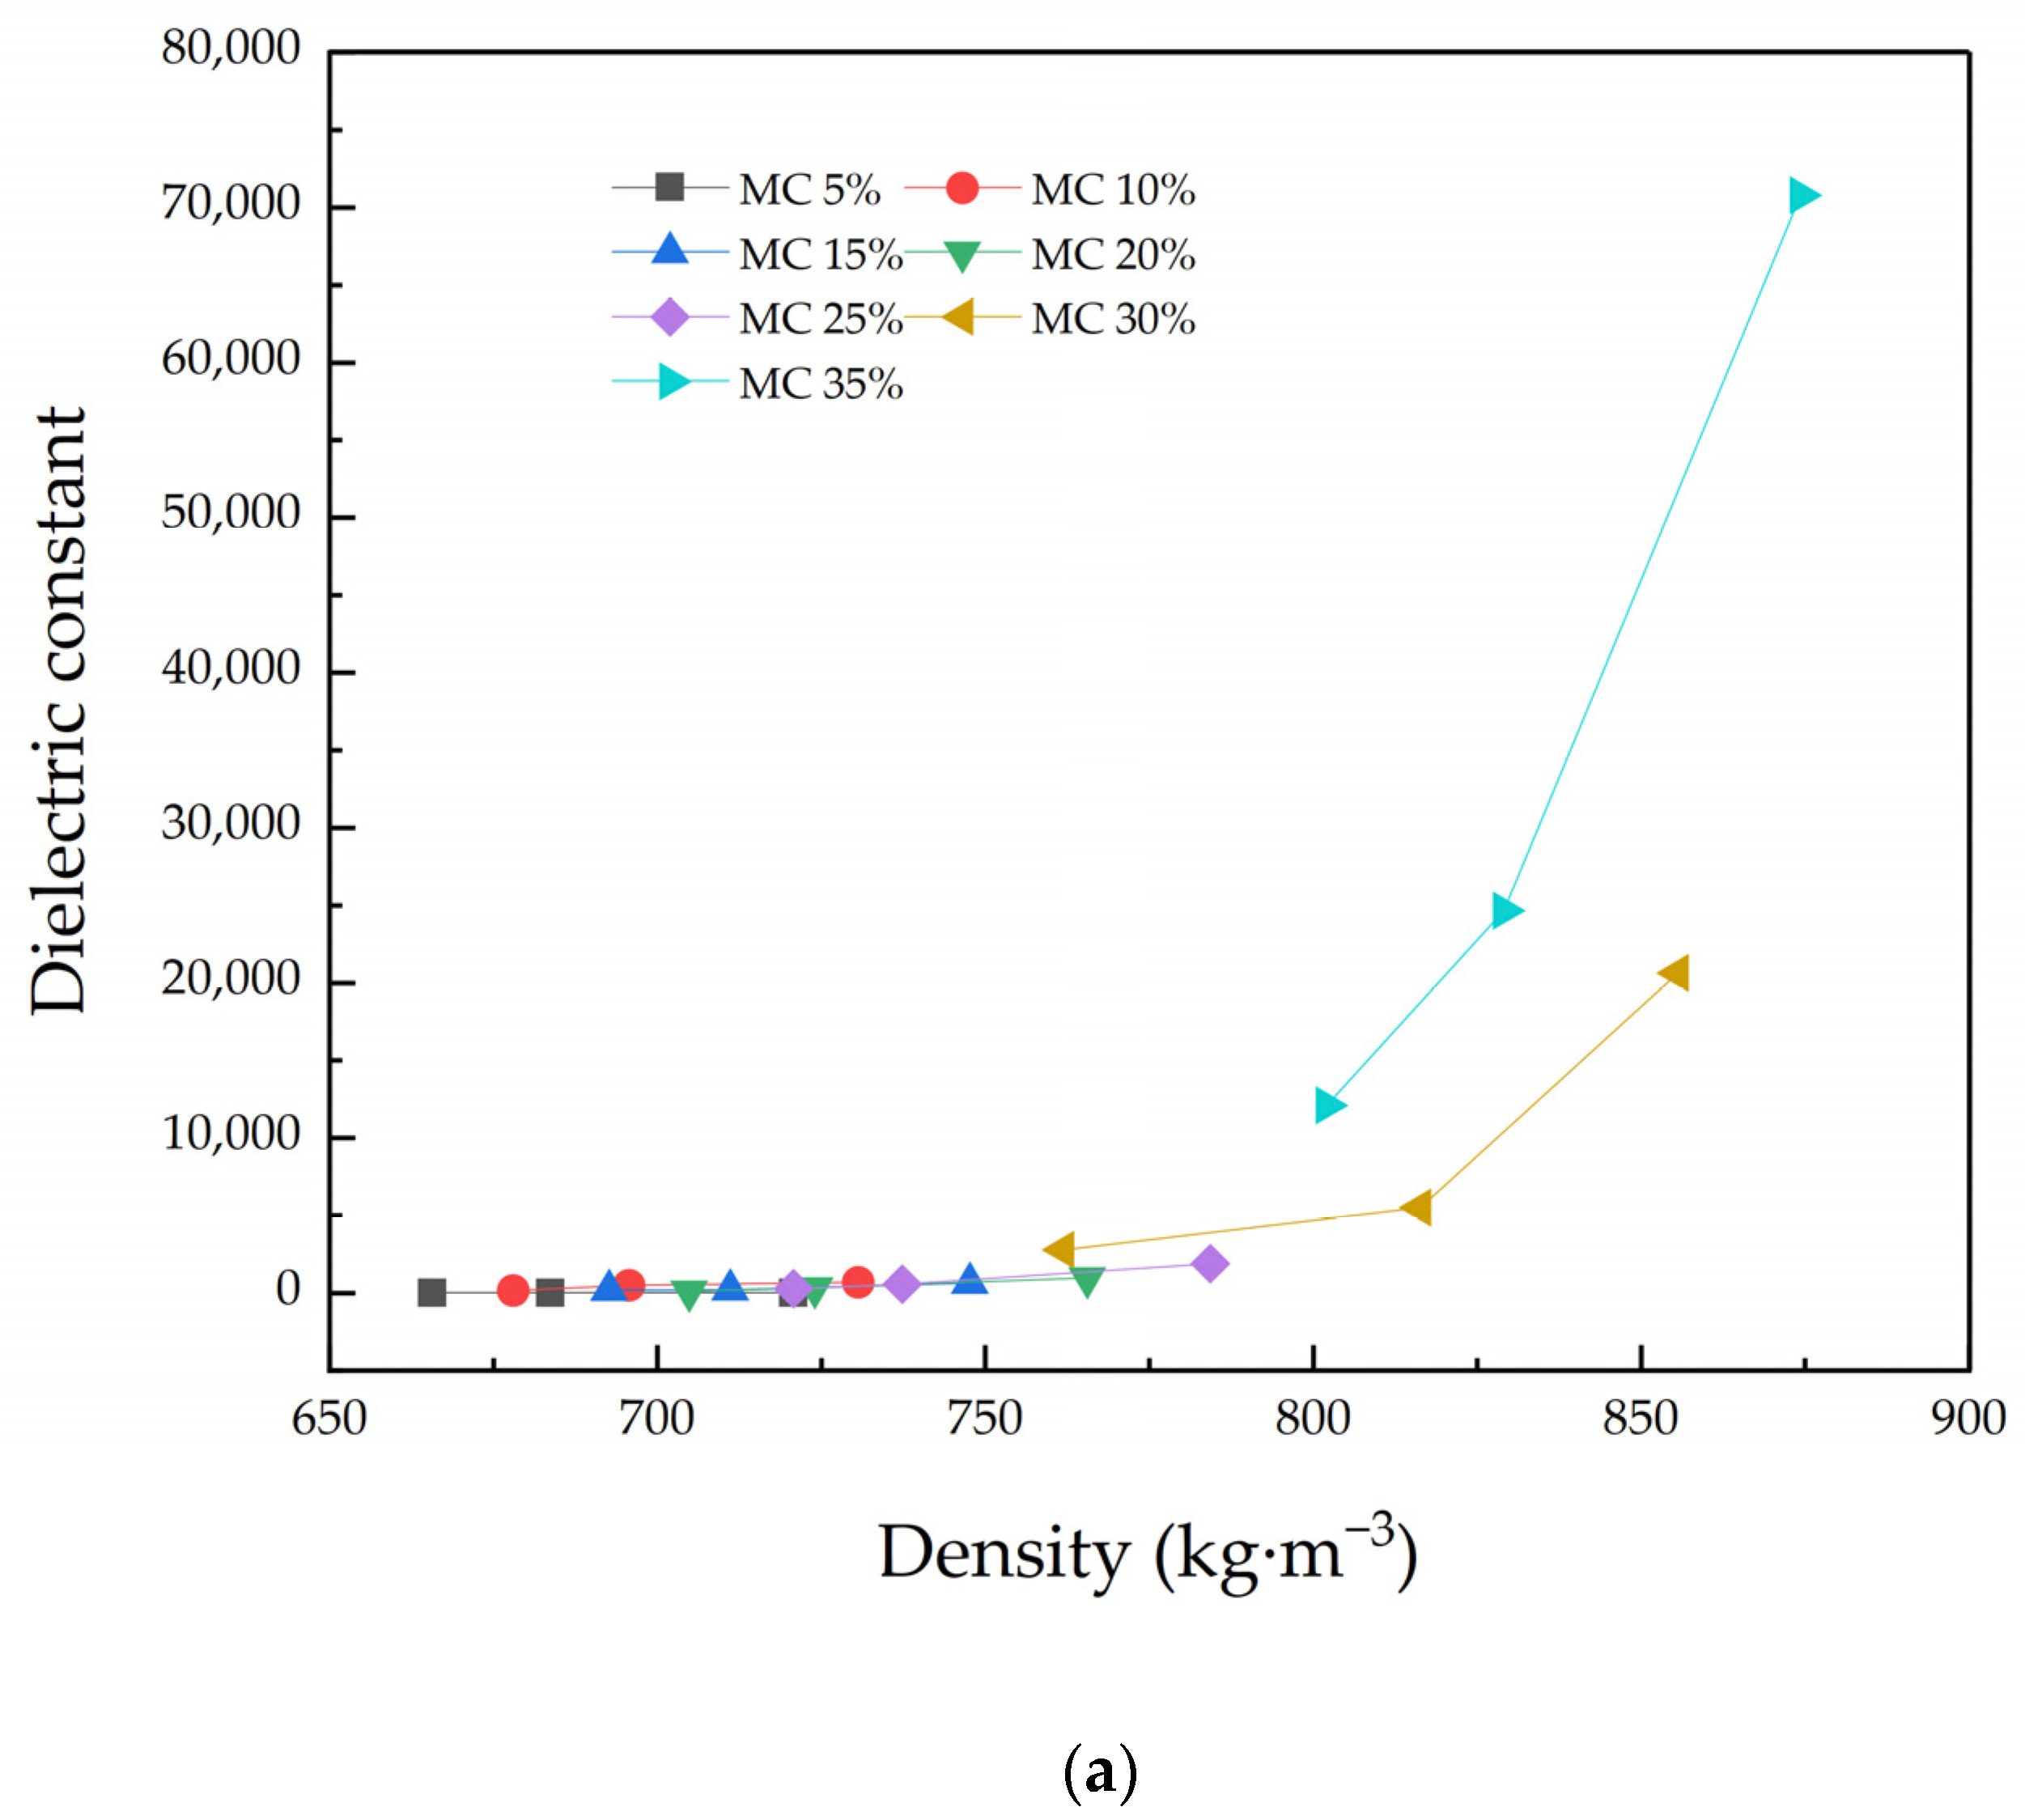
3.4. Bulk Density Dependence of the Dielectric Properties of Samples

To investigate how the bulk density affects the dielectric properties of the samples, the dielectric constant ε and the loss factor ε of the samples with various bulk densities at different moisture contents (5–35%) were examined at a room temperature of 22.3 °C and at the chosen measurement frequency (10 kHz). The results are displayed in Figure 7. The bulk densities of the samples with various moisture contents are presented in Table 1.
Figure 7 reveals that when the moisture content of the samples was less than 25%, the relationship between ε and ε of samples and the bulk density was not apparent. However, when the moisture content of samples was greater than 25%, the ε and ε of samples exhibited an obvious increasing trend with the increase in the bulk density.

3.5. Results of Feature Frequency Extraction by PCA

In this study, the dielectric constant ε and the loss factor ε of the straw compost samples at 113 frequency points in the frequency band of 1–100 kHz were analyzed through PCA using MATLAB software for the correlation coefficient matrix of three sets of data for ε , ε , and ε and ε combined variables. The results are presented in Table 2.

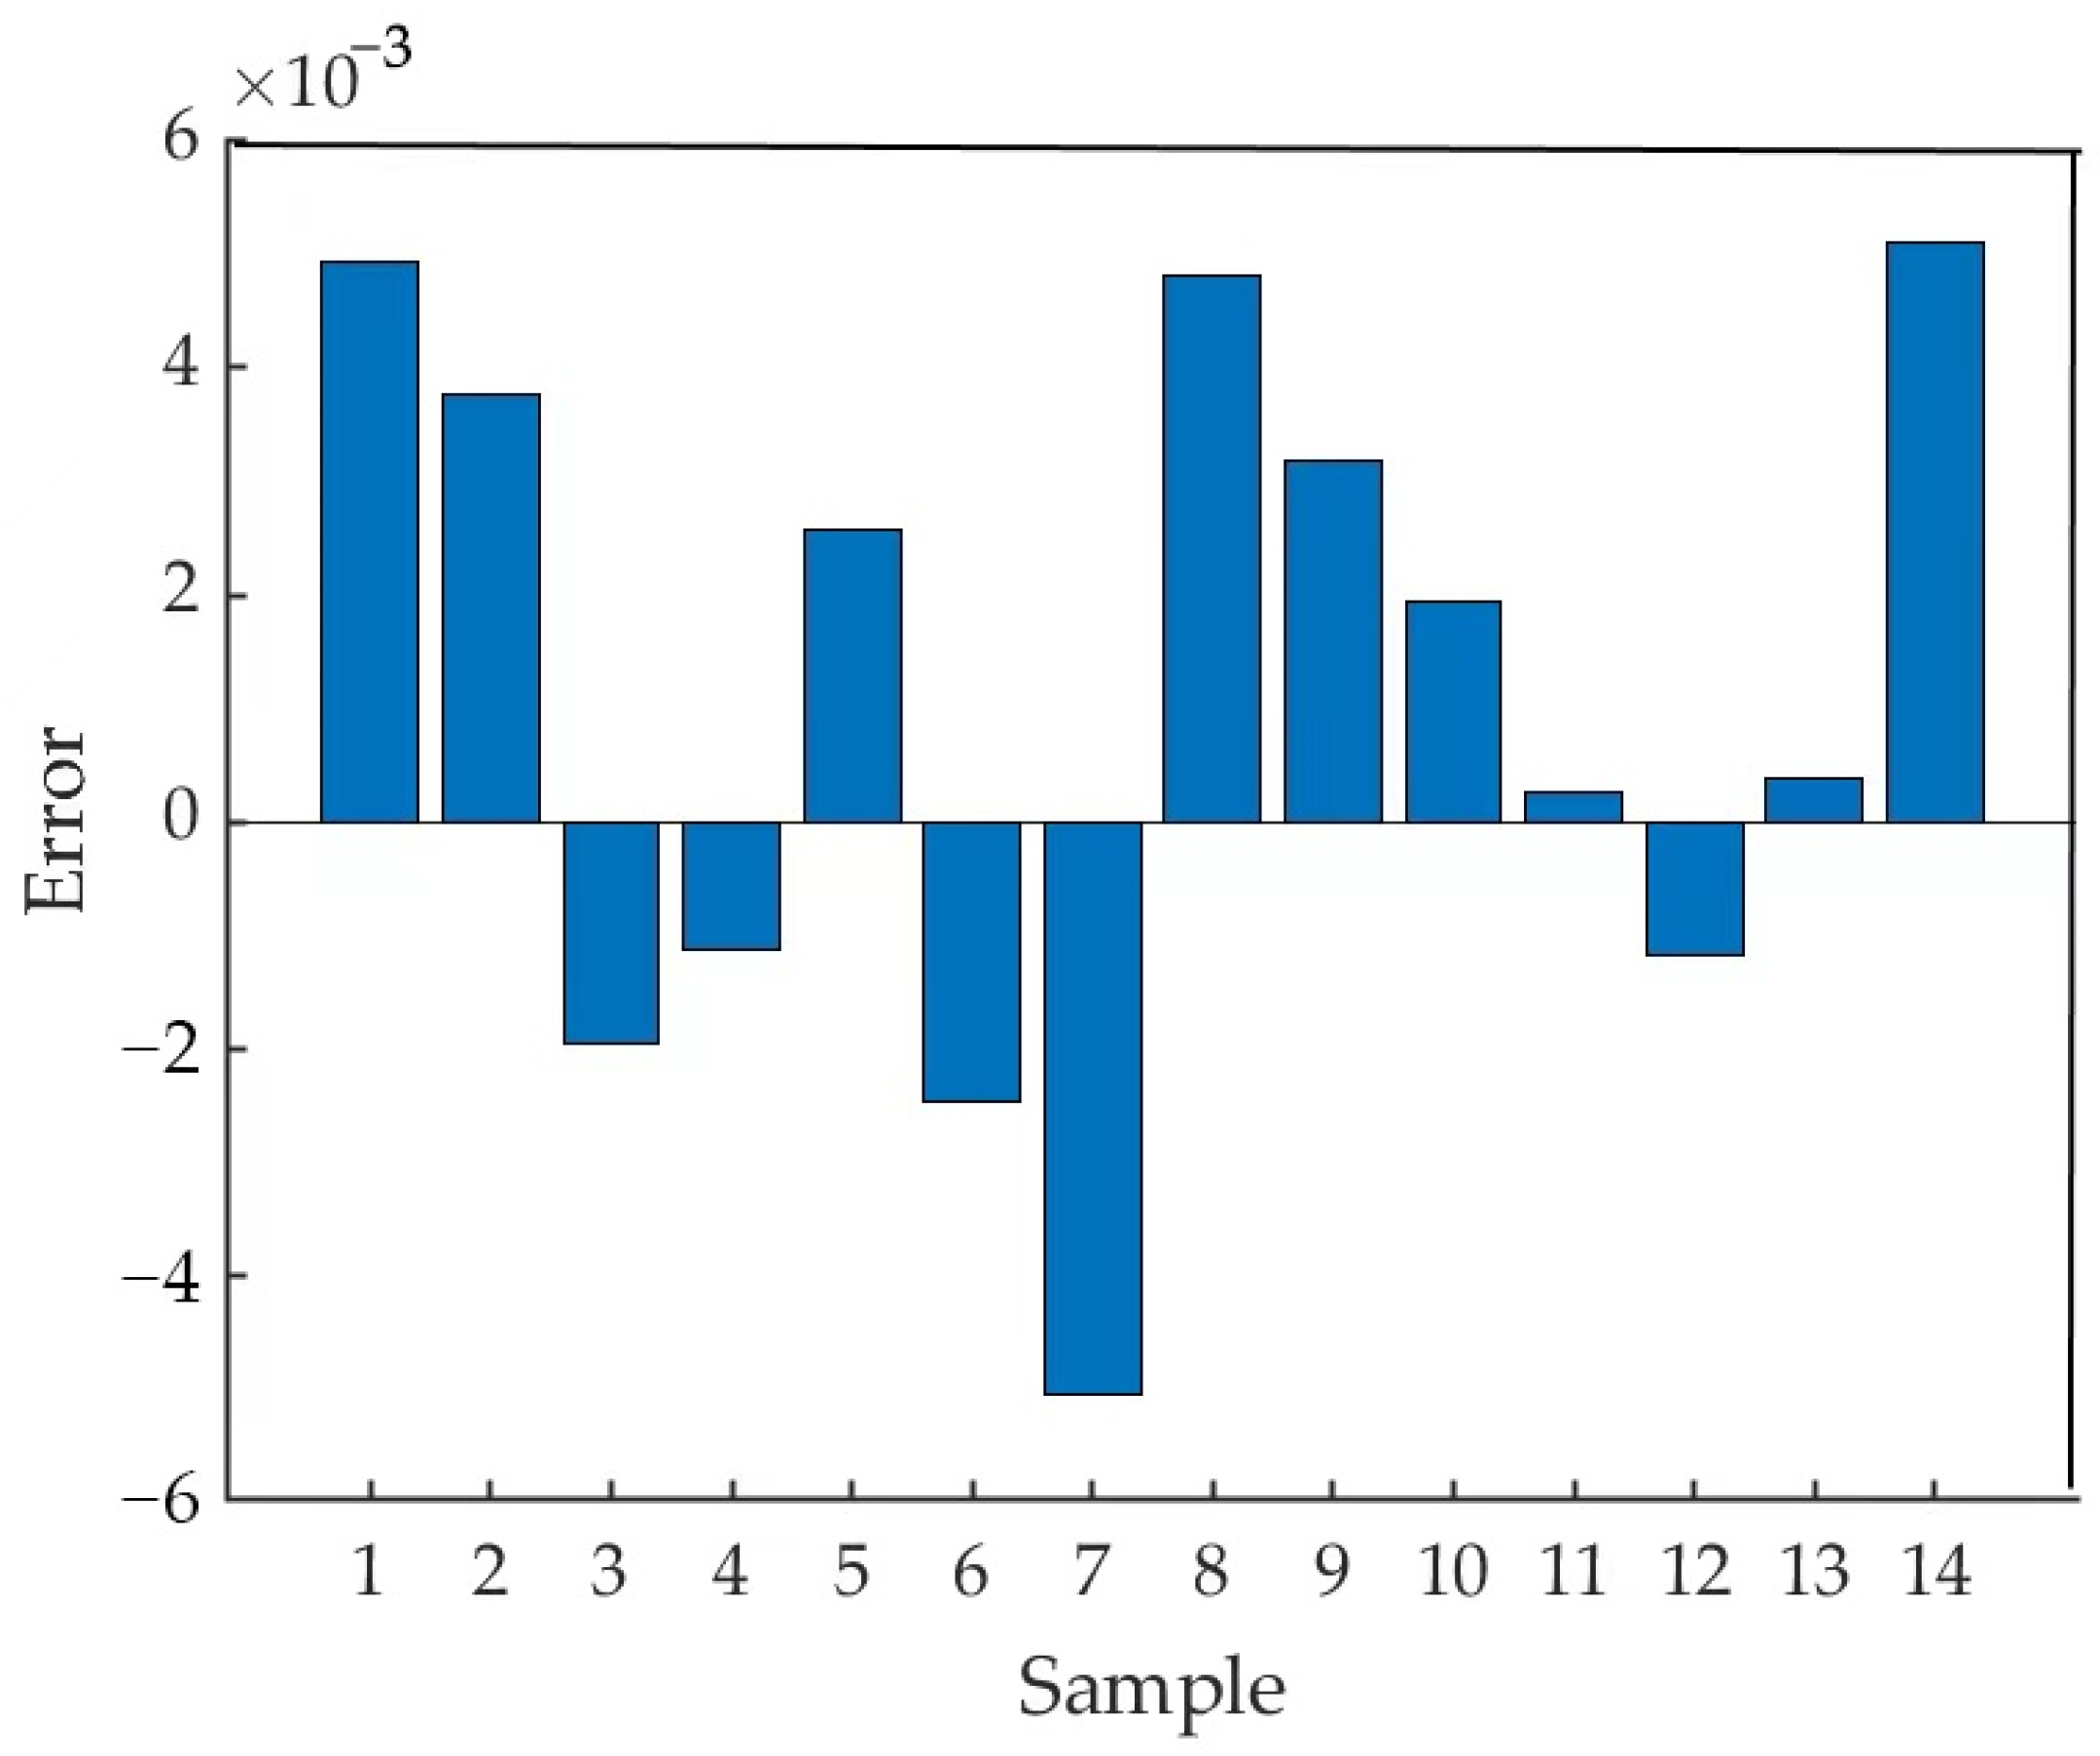
3.6. PCA–SVR Model Prediction Results

The full-frequency and PCA-selected characteristic variables were used as independent variables for SVR modeling, and the moisture content of straw compost was used as the dependent variable to establish the SVR regression model. The RBF kernel function with excellent stability and accuracy was used as the SVR function. When applying the RBF–SVR regression method, the training set was optimally searched for parameters by a grid search to determine the penalty factor c and kernel parameter g of SVR to ensure optimization of the model parameters. Table 3 shows the c and g optimization results. The three data sets of ε , ε , and ε and ε combined variables were selected using the cross-validation method for the full frequency and SPA characteristic frequency variables, respectively, and the results are presented in Table 3.
The results in Table 3 reveal that all models can respond to some extent to the internal information of the samples. From the perspective of the selected variables, the prediction results of the SVR models based on PCA have limited effect or are even slightly better than those of the SVR models based on the full variables. The SVR model developed using ε was extracted by PCA and increased by 0.1539 compared with the that developed using full variables in terms of the prediction set Rp2. However, because of the redundant information in the full variable, using the variable is not feasible. The results revealed that the predictive performance of the variables after PCA extraction did not decrease even though the number of model operations decreased. Therefore, the SVR model established after the variables were extracted by PCA can predict the moisture content of straw compost accurately.
Optimization of c and g parameters resulted in different information variables, which could be attributed to the fact that grid c and g coordinate parameters were substituted into SVR for training set modeling when grid search was performed, and the minimum root mean square error in the training set was used to select the best c and g parameters. Since different information variables have distinct training set modeling data, the optimal c and g parameters are optimized differently.
Both ε and ε could be used to predict the moisture content of straw compost to some extent based on the results of parameter selection. The prediction set Rp2 of the SVR model based on full variables and developed with ε was the highest, reaching 0.9998. The prediction set Rp2 of the SVR model based on selected characteristic variables by PCA and developed with ε and ε combined variables was 0.9877, and the RMSEP was the smallest, at 0.0026. However, the prediction set Rp2 of the SVR model based on full-frequency variables and developed with ε was higher than the correction set Rc2, which indicated that this parametric model may not be adequately generalizable. Additionally, combining two parameters rather than just one can result in complementing information, a thorough response to the inherent relationship between dielectric characteristics and moisture content, and an improved model prediction accuracy. Figure 8 displays the prediction results of PCA–SVR; the samples are concentrated near the regression line (y = x), and the prediction effect is more effective. Figure 9 displays the prediction error of the moisture content of the PCA-SVR model; the prediction errors are concentrated within ± 0.6%. Therefore, the SVR model based on the combination of ε and ε variables and based on PCA was selected as the best model for predicting the moisture content of straw compost.

4. Discussion

The current testing methods using the compost moisture content include conventional weighing, far-infrared drying, frequency-domain reflection, and time-domain reflection. The conventional weighing method is time-consuming and laborious. By contrast, far-infrared drying reduces the drying time considerably. McCartney et al. [37] used the far-infrared drying method to determine the moisture content samples of compost materials with a measurement time of 33 min, and the results were accurate to 0.1%. However, it suffers from the inability to achieve real-time measurements and the equipment is more expensive than the regular drying ovens. The time domain reflection method and frequency domain reflection method are indeed very accurate, with test error control within 3% [38], but have the disadvantage of being expensive. Time-domain reflection and frequency-domain reflection both require expensive equipment; furthermore, frequency-domain reflection is more susceptible to electrical conductivity, which is not easy to calibrate and optimize. Since the physical structure of the compost material is similar to that of soil, soil moisture content detectors can be used directly for the detection of the compost material moisture content. This study proposes a method of real-time compost moisture content detection based on dielectric properties, which can detect within 10 s compared with other moisture content detection methods. Further, the scientific rationality of the method was demonstrated experimentally. The results may contribute to the application of nondestructive testing of dielectric properties and the development of potential new moisture meters for compost moisture content detection based on dielectric properties.
In this study, first, the relationships between test frequency, moisture content, temperature, bulk density, the dielectric constant ε , and the loss factor ε of compost samples were analyzed. In the low-frequency band of less than 100 kHz, ionic conductivity is the primary cause of dielectric loss [39], which results in a gradual decrease in the loss factor ε with increasing frequency. The higher the water content, the larger the corresponding ε’ and ε , because the dielectric properties are more strongly affected by the moisture content than other factors. The variation law holds true in the study of the dielectric properties of nuts [40], pecans [41], and fruit juices [42].
Both ε and ε of the compost samples increased with the increase in the moisture content at a constant temperature. The equivalent dielectric constant model revealed that the more significant the proportion of water in the volume of the samples, the larger the dielectric constant of the samples will be. A similar pattern has been reported in other studies on peanut kernel [43], corn [44], and barley [45]. At a constant moisture content, ε and ε of the samples increased with the increase in the temperature. The increase in dielectric properties with the increase in the temperature has been observed in corn [46], wheat [47], beans [48], and chestnuts [49].
When the moisture content was greater than 25%, both ε and ε of the samples increased considerably with the increase in the bulk density. This phenomenon could be attributed to the increase in the bulk density of the samples, increasing the number of dielectrics in the capacitor. Furthermore, under the action of the applied electric field, more dielectrics are polarized, and the ability of the samples to store charge increases, and thus, more electric field energy can be stored, which increases the dielectric constant ε . The energy consumed by friction and collision between polar molecules increases, which revealed an increasing trend of the loss factor ε . A similar trend was observed in wheat seeds and wheat flour [50].
The analysis revealed that the moisture content of the compost could be expressed in terms of the dielectric parameters of the compost. Therefore, the coupled PCA–SVR algorithm with parameter optimization was used in this experiment, and the results revealed that the full variables and the characteristic variables selected by PCA did not differ considerably, which indicated that both ε and ε can predict the analysis of compost moisture content to some extent. However, moisture conditions of the compost at various decomposition stages differed considerably. Furthermore, the dielectric parameters were affected considerably by material species, bulk weight, and temperature. In this study, only the moisture profile of the composted sheep manure straw after decomposition was discussed based on dielectric properties. Although the model can predict the compost moisture content satisfactorily, some limitations still exist. Therefore, for improving the accuracy of the dielectric method for detecting the moisture content of compost materials in the composting process, further studies are critical for different stages and species of compost.

5. Conclusions

To investigate the feasibility of using dielectric properties for detecting the moisture condition of compost, a practical, rapid, and accurate method was proposed for detecting the moisture content of compost based on dielectric properties. In this study, the compost was subjected to frequencies of 1–100 kHz, a moisture content of 5–35%, a temperature of 25–65 °C, and a bulk density of 665.6–874.3 kg/m3. The dielectric constant ε and the loss factor ε of straw compost decreased with the increase in the frequency but increased with the increase in moisture content and temperature. When the moisture content was less than 25%, the effect of bulk density on the dielectric properties of samples was not apparent. However, when the moisture content was between 25% and 35%, both the dielectric constant ε and the loss factor ε of the samples increased with the increase in the bulk density. The prediction performance of the model was analyzed by comparing the full-frequency variables and the selected characteristic variables using PCA. The SVR model, which combined the dielectric constant ε and the loss factor ε , exhibited the best ability for predicting the moisture content. PCA was used to select characteristic variables. The prediction set coefficient of determination and the root mean square error were 0.9877 and 0.0026, respectively. The results indicated that the dielectric properties of compost exhibited excellent application potential in predicting the moisture content of compost.

Author Contributions

Conceptualization, R.W. and T.R.; methodology, T.R.; software, L.F.; validation, R.W., T.R. and L.F.; formal analysis, T.R.; resources, T.W. (Tieliang Wang); data curation, T.W. (Tiejun Wang); writing—original draft preparation, T.R.; writing—review and editing, L.F.; visualization, T.R.; supervision, R.W. All authors have read and agreed to the published version of the manuscript.

Funding

This research was funded by the Natural Science Foundation of Liaoning Province (2022-NLTS-19-05), and the “Jie Bang Gua Shuai” Science and Technology Program Major Project of Liaoning Province (2022JH1/10400017).

Institutional Review Board Statement

Not applicable.

Informed Consent Statement

Not applicable.

Data Availability Statement

The data presented in this study are available on request from the corresponding author.

Acknowledgments

The authors would like to thank the Natural Science Foundation of Liaoning Province (2022-NLTS-19-05), and the “Jie Bang Gua Shuai” Science and Technology Program Major Project of Liaoning Province (2022JH1/10400017). We appreciate Shenyang Agricultural University for providing the test instruments and equipment as well as the test site. The authors are grateful to the editor and the anonymous reviewers for their comments.

Conflicts of Interest

The authors declare no conflict of interest.

References

  1. Guo, R.; Li, G.; Jiang, T.; Frank, S.; Chen, T.; Zhao, Y.; Shen, Y. Effect of aeration rate, C/N ratio and moisture content on the stability and maturity of compost. Bioresour. Technol. 2012, 112, 171–178. [Google Scholar] [CrossRef] [PubMed]
  2. Heitkamp, F.; Wendland, M.; Offenberger, K.; Gerold, G. Implications of input estimation, residue quality and carbon saturation on the predictive power of the Rothamsted Carbon Model. Geoderma 2012, 170, 168–175. [Google Scholar] [CrossRef]
  3. Ren, L.; Cai, C.; Zhang, J.C.; Yang, Y.; Luo, L.; Huang, H.; Zhou, Y.; Qin, P.; Yu, M. Key environmental factors to variation of ammonia-oxidizing archaea community and potential ammonia oxidation rate during agricultural waste composting. Bioresour. Technol. 2018, 270, 278–285. [Google Scholar] [CrossRef] [PubMed]
  4. Rasapoor, M.; Nasrabadi, T.; Kamali, M.; Hoveidi, H. The effects of aeration rate on generated compost quality, using aerated static pile method. Waste Manag. 2009, 29, 570–573. [Google Scholar] [CrossRef] [PubMed]
  5. Rich, N.; Bharti, A.; Kumar, S. Effect of bulking agents and cow dung as inoculant on vegetable waste compost quality. Bioresour. Technol. 2017, 252, 83–96. [Google Scholar] [CrossRef]
  6. Wang, Y.; Ai, P.; Cao, H.; Liu, Z. Prediction of moisture variation during composting process: A comparison of mathematical models. Bioresour. Technol. 2015, 193, 200–205. [Google Scholar] [CrossRef]
  7. Juan, M.; Kai, J.; Liang, S.; Mengting, W.; Xiaojie, Z.; Enshuai, D. Effects of FeSO4 dosage on nitrogen loss and humification during the composting of cow dung and corn straw. Bioresour. Technol. 2021, 341, 125867. [Google Scholar] [CrossRef]
  8. Subirats, J.; Murray, R.; Scott, A.; Lau CH, F.; Topp, E. Composting of chicken litter from commercial broiler farms reduces the abundance of viable enteric bacteria, Firmicutes, and selected antibiotic resistance genes. Sci. Total Environ. 2020, 746, 141113. [Google Scholar] [CrossRef]
  9. Mengchun, G.; Bing, L.; An, Y.; Fangyuan, L.; Lijuan, Y.; Yanxia, S. The effect of aeration rate on forced-aeration composting of chicken manure and sawdust. Bioresour. Technol. 2010, 101, 1899–1903. [Google Scholar] [CrossRef]
  10. Min, L.; Xia, H.; Jian, T.; Xing, L.; Rui, Z.; Yi, T.; Can, W.; Zhong, P. Influence of moisture content on chicken manure stabilization during microbial agent-enhanced composting. Chemosphere 2021, 264, 128549. [Google Scholar] [CrossRef]
  11. Chua, H.; Parkinson, G.; Haigh, A.D.; Gibson, A.A. A method of determining the moisture content of bulk wheat grain. J. Food Eng. 2007, 78, 1155–1158. [Google Scholar] [CrossRef]
  12. Yang, N.; Tang, Y. Detection of moisture content of tomato leaves based on dielectric properties and IRIV-GWO-SVR algorithm. Trans. Chin. Soc. Agric. Eng. 2018, 34, 188–195. [Google Scholar] [CrossRef]
  13. Wang, R.; Tang, Y.; Huang, S.; Du, G.; Zhang, J. Feasibility of non-destructive quality test of fruit based on electrical properties. J. Food Saf. Qual. 2012, 3, 471–474. [Google Scholar] [CrossRef]
  14. Nelson, S.O.; Soderholm, L.H.; Yung, F.D. Determining the dielectric properties of grain. Agric. Eng. 1953, 34, 608–610. [Google Scholar]
  15. Sun, J.; Zhang, G.; Mao, H.; Wu, X.; Yang, N.; Li, Q. Non-destructive Moisture Content Detection of Corn Leaves Based on Dielectric Properties and Regression Algorithm. Trans. Chin. Soc. Agric. Mach. 2016, 47, 257–264+279. [Google Scholar] [CrossRef]
  16. Guo, W.; Yang, J.; Liu, C. Wheat straw moisture meter based on alternative current impedance method. Trans. Chin. Soc. Agric. Eng. 2013, 23, 46–52. [Google Scholar] [CrossRef]
  17. Xue, X.; Shen, X.; Shen, X.; Yi, T.; Xiao, Z.; De, Z.; Mei, H.; Wei, W. Estimation of density and moisture content in asphalt mixture based on dielectric property. Constr. Build. Mater. 2021, 298, 123518. [Google Scholar] [CrossRef]
  18. McKeown, M.S.; Trabelsi, S.; Tollner, E.W. Effects of temperature and material on sensing moisture content of pelleted biomass through dielectric properties. Biosyst. Eng. 2016, 149, 1–10. [Google Scholar] [CrossRef]
  19. Szypłowska, A.; Lewandowski, A.; Yagihara, S.; Saito, H.; Furuhata, K.; Szerement, J.; Kafarski, M.; Wilczek, A.; Majcher, J.; Woszczyk, A.; et al. Dielectric models for moisture determination of soils with variable organic matter content. Geoderma 2021, 401, 115288. [Google Scholar] [CrossRef]
  20. Bittelli, M.; Tomei, F.; Anbazhagan, P.; Pallapati, R.R.; Mahajan, P.; Meisina, C.; Bordoni, M.; Valentino, R. Measurement of soil bulk density and water content with time domain reflectometry: Algorithm implementation and method analysis. J. Hydrol. 2021, 598, 126389. [Google Scholar] [CrossRef]
  21. Leão, T.P.; da Costa BF, D.; Bufon, V.B.; Aragón FF, H. Using time domain reflectometry to estimate water content of three soil orders under savanna in Brazil. Geoderma Reg. 2020, 21, e00280. [Google Scholar] [CrossRef]
  22. Satoh, Y.; Kakiuchi, H. Calibration method to address influences of temperature and electrical conductivity for a low-cost soil water content sensor in the agricultural field. Agric. Water Manag. 2021, 255, 107015. [Google Scholar] [CrossRef]
  23. Cai, L.; Chen, T.B.; Gao, D.; Liu, H.T.; Chen, J.; Zheng, G.D. Time domain reflectometry measured moisture content of sewage sludge compost across temperatures. Waste Manag. 2013, 33, 12–17. [Google Scholar] [CrossRef]
  24. Calamita, G.; Brocca, L.; Perrone, A.; Piscitelli, S. Electrical resistivity and TDR methods for soil moisture estimation in central Italy test-sites. J. Hydrol. 2012, 454, 101–112. [Google Scholar] [CrossRef]
  25. Soo, L.; Damla, D.; Samet, O.; Fanbin, K.; Jeyamkondan, S. A comparison between the open-ended coaxial probe method and the parallel plate method for measuring the dielectric properties of low-moisture foods. LWT 2020, 130, 109719. [Google Scholar] [CrossRef]
  26. Gilbert, N.; Mewis, R.E.; Sutcliffe, O.B. Classification of fentanyl analogues through principal component analysis (PCA) and hierarchical clustering of GC–MS data. Forensic Chem. 2020, 21, 100287. [Google Scholar] [CrossRef]
  27. Yan, W.; Qian, J.; Ge, Y.; Ye, K.; Zhou, C.; Zhang, H. Principal component analysis of MALDI-TOF MS of whole-cell foodborne pathogenic bacteria. Anal. Biochem. 2020, 592, 113582. [Google Scholar] [CrossRef] [PubMed]
  28. Alcantara, G.M.; Dresch, D.; Melchert, W.R. Use of non-volatile compounds for the classification of specialty and traditional Brazilian coffees using principal component analysis. Food Chem. 2021, 360, 130088. [Google Scholar] [CrossRef]
  29. Kelter, R. Bayesian model selection in the M-open setting—Approximate posterior inference and subsampling for efficient large-scale leave-one-out cross-validation via the difference estimator. J. Math. Psychol. 2021, 100, 102474. [Google Scholar] [CrossRef]
  30. Jiang, G.; Wang, W. Error estimation based on variance analysis of k-fold cross-validation. Pattern Recognit. 2017, 69, 94–106. [Google Scholar] [CrossRef]
  31. Ye, Y.; Wang, L.; Wang, Y.; Qin, L. An EMD-LSTM-SVR model for the short-term roll and sway predictions of semi-submersible. Ocean. Eng. 2022, 256, 111460. [Google Scholar] [CrossRef]
  32. Vincent, B.; Duhamel, C.; Ren, L.; Tchernev, N. A PCA and SVR based method for continuous industrial process modelling. IFAC-PapersOnLine 2018, 51, 1604–1609. [Google Scholar] [CrossRef]
  33. Liu, Y.; Pender, G. A flood inundation modelling using v-support vector machine regression model. Engineering Appl. Artif. Intell. 2015, 46, 223–231. [Google Scholar] [CrossRef]
  34. Zhang, L.; Chen, J.; Zhu, T. Image denoising based on iterative generalized cross-validation and fast translation invariant. J. Vis. Commun. Image Represent. 2015, 28, 1–14. [Google Scholar] [CrossRef]
  35. Wang, J.; Tang, J.; Wang, Y.; Swanson, B. Dielectric properties of egg whites and whole eggs as influenced by thermal treatments. LWT Food Sci. Technol. 2009, 42, 1204–1212. [Google Scholar] [CrossRef]
  36. Guo, W.; Wang, S.; Tiwari, G.; Johnson, J.A.; Tang, J. Temperature and moisture dependent dielectric properties of legume flour associated with dielectric heating. LWT Food Sci. Technol. 2010, 43, 193–201. [Google Scholar] [CrossRef]
  37. McCartney, D.; Tingley, J. Development of a rapid moisture content method for compost materials. Compost. Sci. Util. 1998, 6, 14–25. [Google Scholar] [CrossRef]
  38. Greco, R.; Guida, A. Field measurements of topsoil moisture profiles by vertical TDR probes. J. Hydrol. 2008, 348, 442–451. [Google Scholar] [CrossRef]
  39. Mohapatra, A.; Shanmugasundaram, S.; Malmathanraj, R. Grading of ripening stages of red banana using dielectric properties changes and image processing approach. Comput. Electron. Agric. 2017, 143, 100–110. [Google Scholar] [CrossRef]
  40. Trabelsi, S.; Lewis, M.A.; Nelson, S.O. Microwave moisture meter for in-shell peanut kernels. Food Control. 2016, 66, 283–290. [Google Scholar] [CrossRef]
  41. Lawrence, K.C.; Nelson, S.O.; Kraszewski, A.W. Temperature-dependence of the dielectric-properties of pecans. Trans. ASAE 1992, 35, 251–255. [Google Scholar] [CrossRef]
  42. Zhu, X.; Guo, W.; Wu, X. Frequency-and temperature-dependent dielectric properties of fruit juices associated with pasteurization by dielectric heating. J. Food Eng. 2012, 109, 258–266. [Google Scholar] [CrossRef]
  43. Trabelsi, S.; Nelson, S.O. Microwave dielectric properties of shelled and unshelled peanuts. Trans. ASAE 2004, 47, 1215–1222. [Google Scholar] [CrossRef]
  44. Sacilik, K.; Colak, A. Determination of dielectric properties of corn seeds from 1 to 100 MHz. Powder Technol. 2010, 203, 365–370. [Google Scholar] [CrossRef]
  45. Guo, W.; Wang, J.; Liu, C. Predicating Moisture Content of Pearl Barley Based on Dielectric Properties. Trans. Chin. Soc. Agric. Mach. 2012, 43, 113–117. [Google Scholar] [CrossRef]
  46. Nelson, S.O. RF and Microwave dielectric properties of shelled, yellow-dent field corn. Trans. ASAE 1979, 22, 1451–1457. [Google Scholar] [CrossRef]
  47. Sokhansanj, S.; Nelson, S.O. Dependence of dielectric properties of whole-grain wheat on bulk density. J. Agric. Eng. Res. 1988, 39, 173–179. [Google Scholar] [CrossRef]
  48. Jiao, S.; Johnson, J.; Tang, J.; Tiwari, G.; Wang, S. Dielectric properties of cowpea weevil, black-eyed peas and mung beans with respect to the development of radio frequency heat treatments. Biosyst. Eng. 2011, 108, 280–291. [Google Scholar] [CrossRef]
  49. Guo, W.; Wu, X.; Zhu, X. Temperature-dependent dielectric properties of chestnut and chestnut weevil from 10 to 4500 MHz. Biosyst. Eng. 2011, 110, 340–347. [Google Scholar] [CrossRef]
  50. Ling, B.; Lyng, J.G.; Wang, S. Radio-frequency treatment for stabilization of wheat germ: Dielectric properties and heating uniformity. Innov. Food Sci. Emerg. Technol. 2018, 48, 66–74. [Google Scholar] [CrossRef]
Figure 1. Preparation of straw compost samples with various moisture contents.
Applsci 13 00917 g001
Figure 2. Testing system of straw compost electrical property. (1) Computer; (2) LCR meter; (3) LCR digital bridge test line; (4) acrylic box; (5) sample; (6) aluminum plate.
Applsci 13 00917 g002
Figure 3. Operational process of the PCA–SVR coupling algorithm.
Applsci 13 00917 g003
Figure 4. Frequency dependence of dielectric properties at various moisture contents: (a) dielectric constant, (b) loss factor.
Applsci 13 00917 g004
Figure 5. Moisture dependence of dielectric properties at various temperatures: (a) dielectric constant, (b) loss factor.
Applsci 13 00917 g005
Figure 6. Temperature dependence of dielectric properties at various moisture contents: (a) dielectric constant, (b) loss factor.
Applsci 13 00917 g006
Figure 7. Bulk density dependence of dielectric properties at various moisture contents: (a) dielectric constant, (b) loss factor.
Applsci 13 00917 g007aApplsci 13 00917 g007b
Figure 8. Predicted results of the moisture content of the PCA–SVR model.
Applsci 13 00917 g008
Figure 9. Prediction error of the moisture content of the PCA-SVR model.
Applsci 13 00917 g009
Table 1. Bulk density values of samples at various moisture contents.
Moisture
Content/%
Bulk Density/(kg·m−3)
Level ILevel IILevel III
5665.6467683.7607720.7207
10677.9661695.6522730.5936
15692.6407711.1111747.6636
20704.8458723.9819765.5502
25720.7207737.3272784.3137
30761.9048816.3265855.6150
35802.0175829.0155874.3169
Table 2. Principal Component Analysis Extraction Results.
ParametersNumber of Extracted Principal ComponentsCumulative Contribution Rate %
ε 199.90701
ε 199.91443
ε and ε 295.10533
Table 3. Prediction Results and Parameter Optimization of Support Vector Machine Model.
ParametersVariable Selection MethodParameter OptimizationCorrection SetPrediction Set
cgRc2RMSECRp2RMSEP
ε Full Frequency80.000970.91530.00790.99980.0107
PCA10240.000980.88130.00930.99570.0470
ε Full Frequency1.4140.002760.97110.02830.84090.1169
PCA1280.00280.99830.00680.99480.0212
ε and ε Full Frequency2.8280.00390.99870.02370.95550.0100
PCA90.510.00390.99990.00690.98770.0026
Disclaimer/Publisher’s Note: The statements, opinions and data contained in all publications are solely those of the individual author(s) and contributor(s) and not of MDPI and/or the editor(s). MDPI and/or the editor(s) disclaim responsibility for any injury to people or property resulting from any ideas, methods, instructions or products referred to in the content.

