Communication

Magnetic Vortex Phase Diagram for a Non-Optimized CaKFe4As4 Superconductor Presenting a Wide Vortex Liquid Region and an Ultra-High Upper Critical Field

1
Department of Physics “E.R. Caianiello”, University of Salerno, Via Giovanni Paolo II, 132, 84084 Fisciano, SA, Italy
2
CNR-SPIN Salerno, Via Giovanni Paolo II, 132, 84084 Fisciano, SA, Italy
3
ENEA, Via Enrico Fermi, 45, 00044 Frascati, RM, Italy
4
ENEA, Via Anguillarese, 301, 00123 Roma, Italy
*
Authors to whom correspondence should be addressed.
Appl. Sci. 2023, 13(2), 884; https://doi.org/10.3390/app13020884
Submission received: 14 November 2022 / Revised: 2 January 2023 / Accepted: 6 January 2023 / Published: 9 January 2023
(This article belongs to the Section Materials Science and Engineering)

Abstract

:

Featured Application

This work concerns the study of the vortex phase diagram in CaKFe4As4, whose knowledge can be helpful for the understanding of the applicative ranges in field and temperature of these materials with not-optimized fabrication characteristics, as usually is found in superconducting wires and cables for power applications.

Abstract

To draw a complete vortex phase diagram for a CaKFe4As4 polycrystalline iron-based superconductor, different kinds of magnetic measurements have been performed focusing on the critical parameters of the sample. Firstly, magnetic moment versus field measurements m(H) were performed at low fields in order to evaluate the lower critical field Hc1. After that, by performing relaxation measurements m(t), a field crossover Hcross was detected in the framework of a strong pinning regime. The irreversibility field Hirr as a function of the temperature curve was then drawn by plotting the critical current densities Jc versus the field for temperatures near Tc. Jc(H) has demonstrated a second magnetization peak effect phenomenon, and the second peak field Hsp has been identified and plotted as a function of temperature, providing information about an elastic to plastic transition in the vortex lattice. Finally, the upper critical field Hc2 as a function of the temperature has been obtained. Hc1, Hcross, Hsp, Hirr, Hc2 have been fitted and used for drawing the complete vortex phase diagram of the sample. It can be helpful for the understanding of the applicative ranges in the field and temperature of the materials with not-optimized fabrication characteristics, as usually is found in superconducting wires and cables for power applications.

1. Introduction

The iron based superconductors (IBS) found out in 2008 [1] are probably the most intriguing material to investigate since the high-Tc superconductors (HTS) discovery by Bednorz and Muller in 1986 [2]. In fact, although the HTS critical temperature Tc is well above the liquid nitrogen temperature in many cases, materials such as YBCO or BSCCO have been not exploited completely for their use in power applications of superconductivity due to some problems: high values of anisotropy [3,4], superconductor-insulator-superconductor (SIS) grain boundary junction [5,6]etc. On the other hand, although the IBS have a lower Tc than HTS, they show lower values of anisotropy [7,8] and superconductor-normal-superconductor (SNS) grain boundary junction [9,10] together with high values of Jc and Hc2 [11,12]. Among all the IBS families, the recently discovered 1144 family has attracted the attention of researchers due to its analogy in the crystal structure with the well-known 122 IBS family [13]. In the 1144 family, the CaKFe4As4 presents interesting peculiarities such as relatively high Tc ≈ 35 K [14,15], large upper critical field [16,17], and very high Jc at high fields as well [17,18]. Moreover, in very recent years, CaKFe4As4 wires and tapes have been successfully fabricated by the powder-in-tube method [19,20] opening perspectives in terms of using this material for practical purposes. It is worth underlining that Refs. [19,20] have not performed a thorough magnetic analysis of the material nor the construction of a complete vortex phase diagram as instead shown in this work. The CaKFe4As4 can form during the fabrication process also spurious phases such as CaFe2As2 and KFe2As2 [14] and a large number of impurities. So, it is clear that the superconducting properties and critical parameters can be drastically enhanced if these phases and the grain boundaries formation are reduced by improving the fabrication process. In this framework, one of the most common problems in applications of superconducting materials on a large scale is the difficulty of not being able to optimize their superconducting characteristics in the entire volume of the application. In fact, the characteristics of such materials can differ particularly in the case of using well-optimized samples with perfect crystalline structure compared to when considering volumes of material much larger than a single crystal. In this context, the study of non-optimized samples becomes very useful to understand the field and temperature behavior of their superconducting critical parameters. In general, the first and third harmonic of the AC magnetic susceptibility is a valid approach to studying the vortex dynamics [21,22] but it often requires difficult analysis processes. In this context, it is worth underlining that an in-depth study of the temperature dependence of the modulus of the first and third harmonic of the AC magnetic susceptibility gives very accurate information about the vortex melting line [23,24]. The results are usually influenced by the values of the amplitude and frequency of the AC magnetic field together with the possibility to use a superimposed DC field. So, it reveals a very useful investigation when it is necessary to individuate the vortex melting line of the superconductor with well-fixed AC and DC field parameters. Alternatively, DC magnetization can be used. Its response as a function of the temperature, the magnetic field, and the time gives information about the critical parameters of the sample useful to draw a complete vortex phase diagram. In the present study, we report the superconducting properties of a non-optimized CaKFe4As4 superconductor by using DC magnetization measurements in magnetic fields up to 9 Tesla and temperatures in the range 5–35 K. In particular, the attention has been focused on drawing the vortex phase diagram of the sample. At this aim, different critical parameters such as Hc1, Hirr, etc. have been obtained. The results showed that the sample is perspective in terms of energy/high-power applications due to its very large Hc2 values and the strong pinning behavior. Nevertheless, the observed very wide vortex liquid region makes us understand that the efficiency of the pinning is low. Then, the sample must be optimized by improving, for instance, the fabrication process.

2. Materials and Methods

A disk-shaped pellet having a diameter equal to 3 mm and a thickness equal to 0.65 mm has been analyzed by means of DC magnetic measurements. The sample has been obtained by using a mechanochemically assisted synthesis route [25]. The fabrication details are reported in Ref. [15]. The sample has been characterized by measuring the magnetic moment as a function of the temperature m(T), the magnetic field m(H), and the time m(t). The measurements have been performed in perpendicular field configuration (field applied perpendicular to the disk surface) by using a QD-PPMS doted of a vibrating sample magnetometer. The residual entrapped field in the PPMS superconducting magnet [26] has been decreased below 1 × 10⁻⁴ T by oscillating the field around zero [27]. For the m(T) measurements, the sample was cooled down to 2.5 K without a magnetic field. After that, the field was turned on and the data was acquired by increasing the temperature (Zero Field Cooling) up to 300 K. For the m(H) measurements, after cooling the sample at the target temperature, the field has been increased to +9 T, decreased to −9 T, and finally increased again to +9 T. For the m(t) measurements, firstly the target temperature has been reached in zero fields. Then, a field equal to 8 T has been set and then decreased to the measurement field. After waiting for about 100 s for avoiding a metastable magnetic states [28], the data have been acquired for 10,800 s. Table 1 summarizes the measurement parameter values used in this work.

3. Results and Discussion

To draw the complete sample vortex phase diagram, the lower critical field Hc1 has been the first studied critical parameter. In particular, the first magnetization was measured versus the field at several temperatures. In Figure 1, the m(H) curves have been reported up to 0.1 T at 5 K, 10 K, 15 K, 20 K, and 25 K. It is visible the initial linear behavior of the magnetic moment due to the Meissner state and the reduction of the superconducting signal due to the temperature increase.
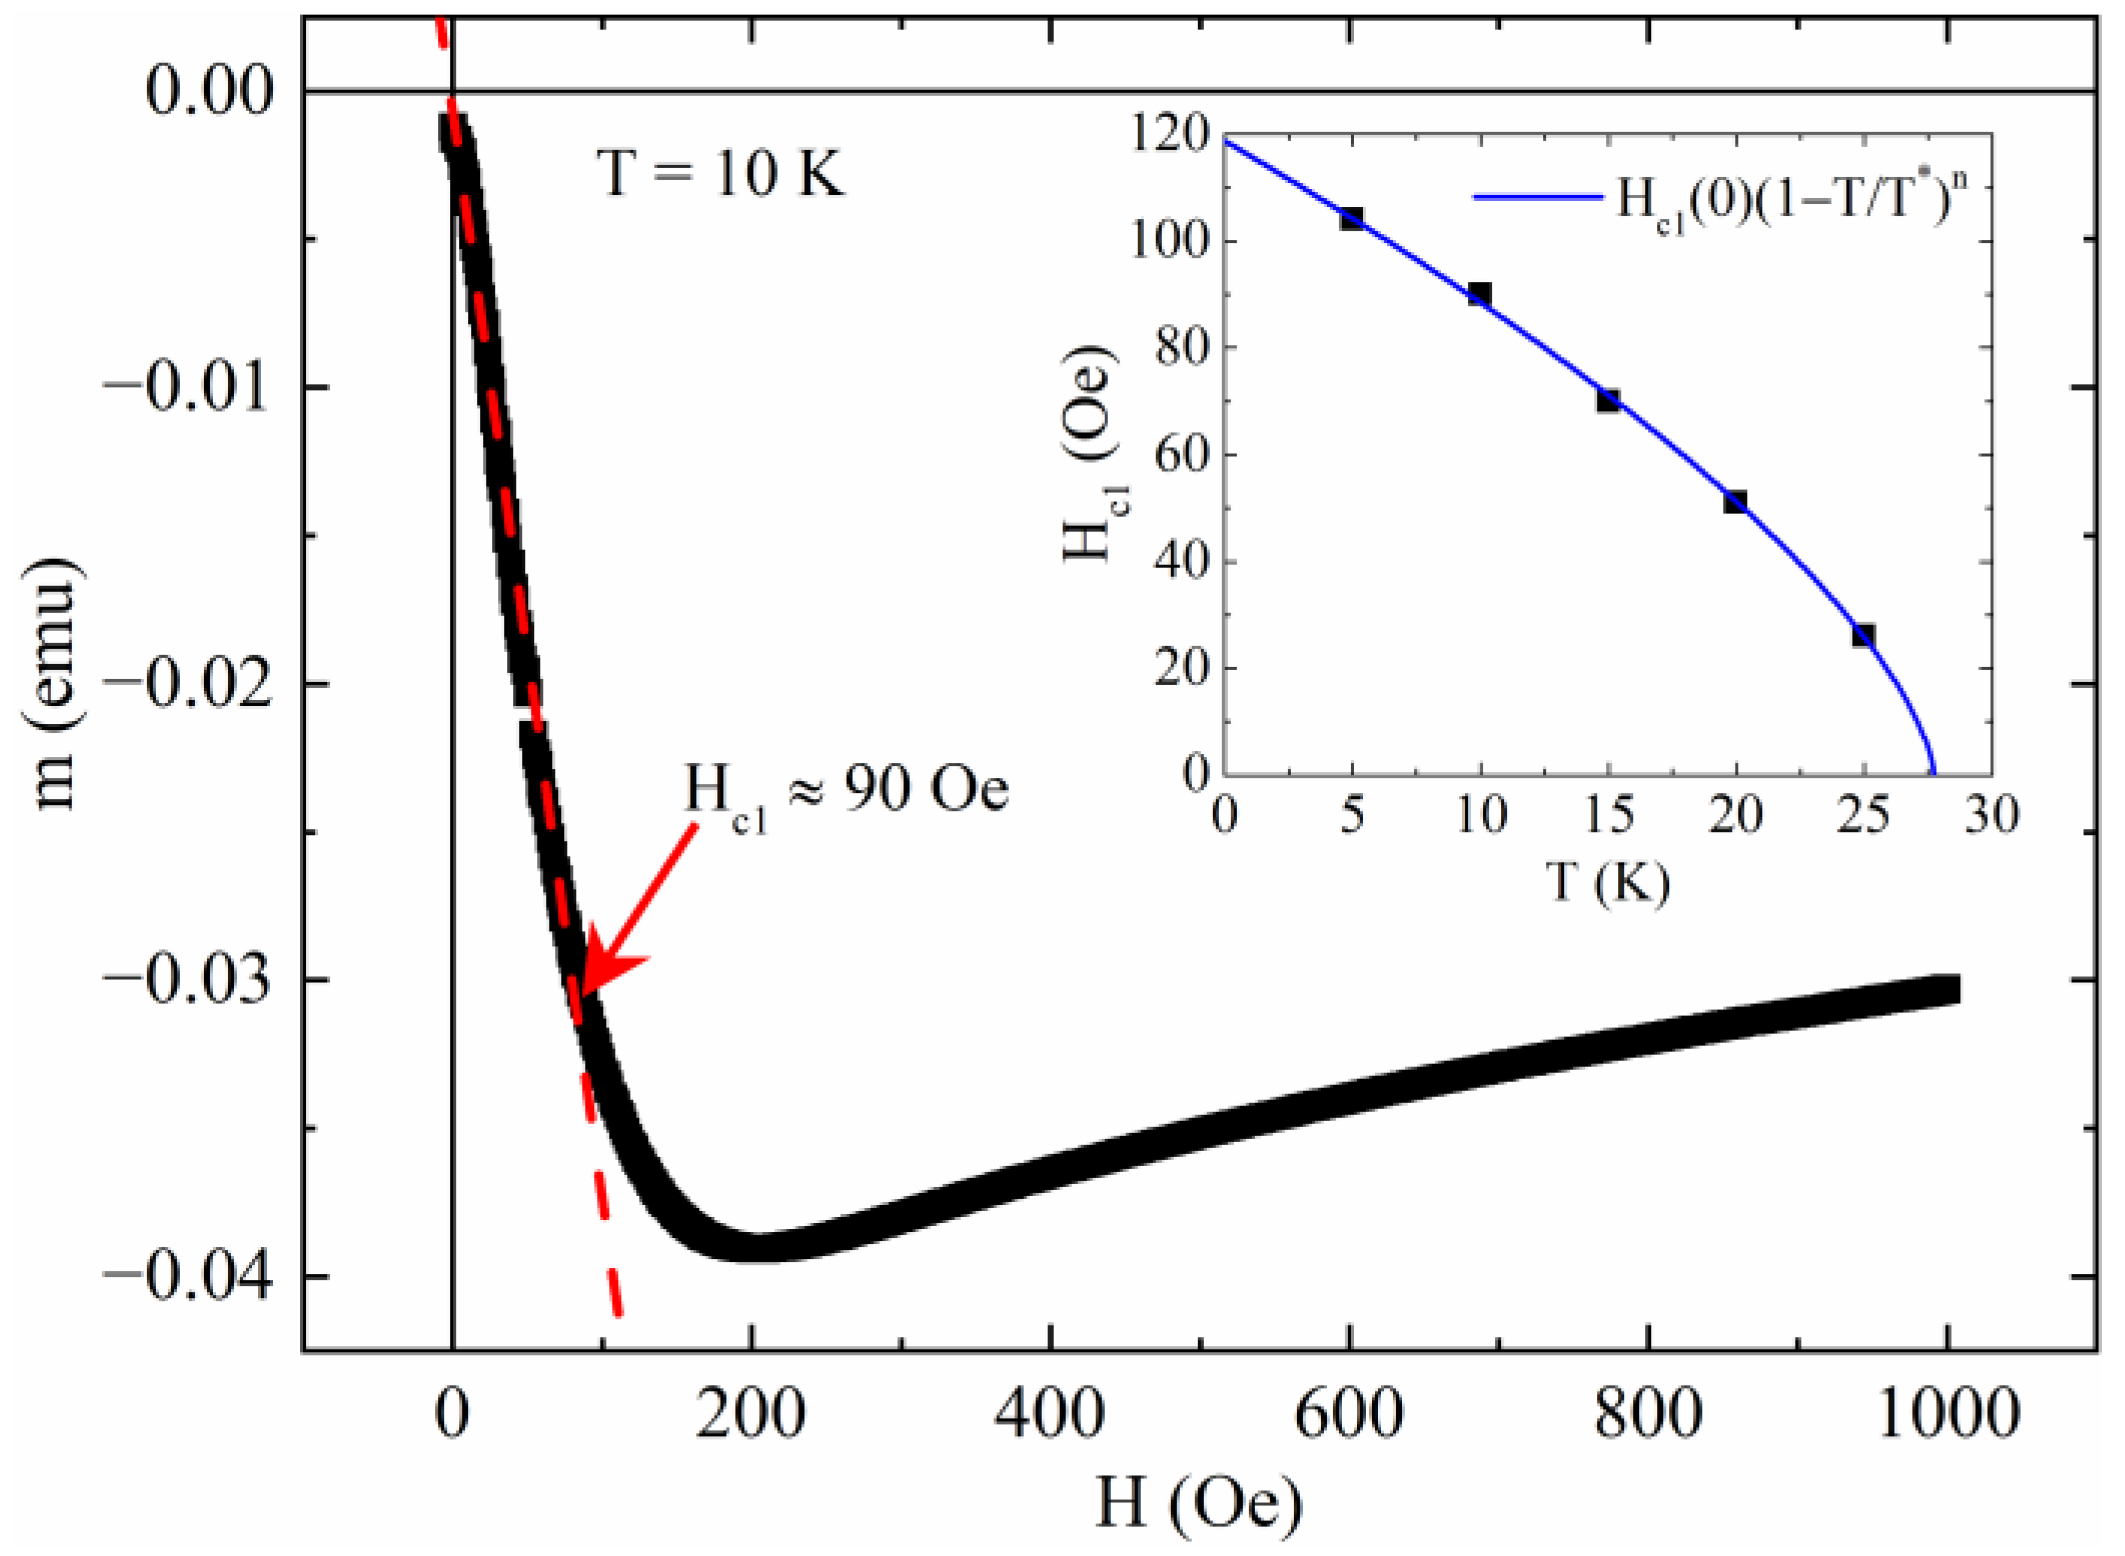
In the main panel of Figure 2, Hc1 has been determined for T = 10 K. The dashed red line and the red arrow individuate the linear behavior due to the Meissner state and the Hc1 value, respectively. Considering all the temperatures, the Hc1(T) behavior has been obtained and fitted with the power law [29]:
H c 1 ( T ) = H c 1 ( 0 ) ( 1 T / T * ) n  
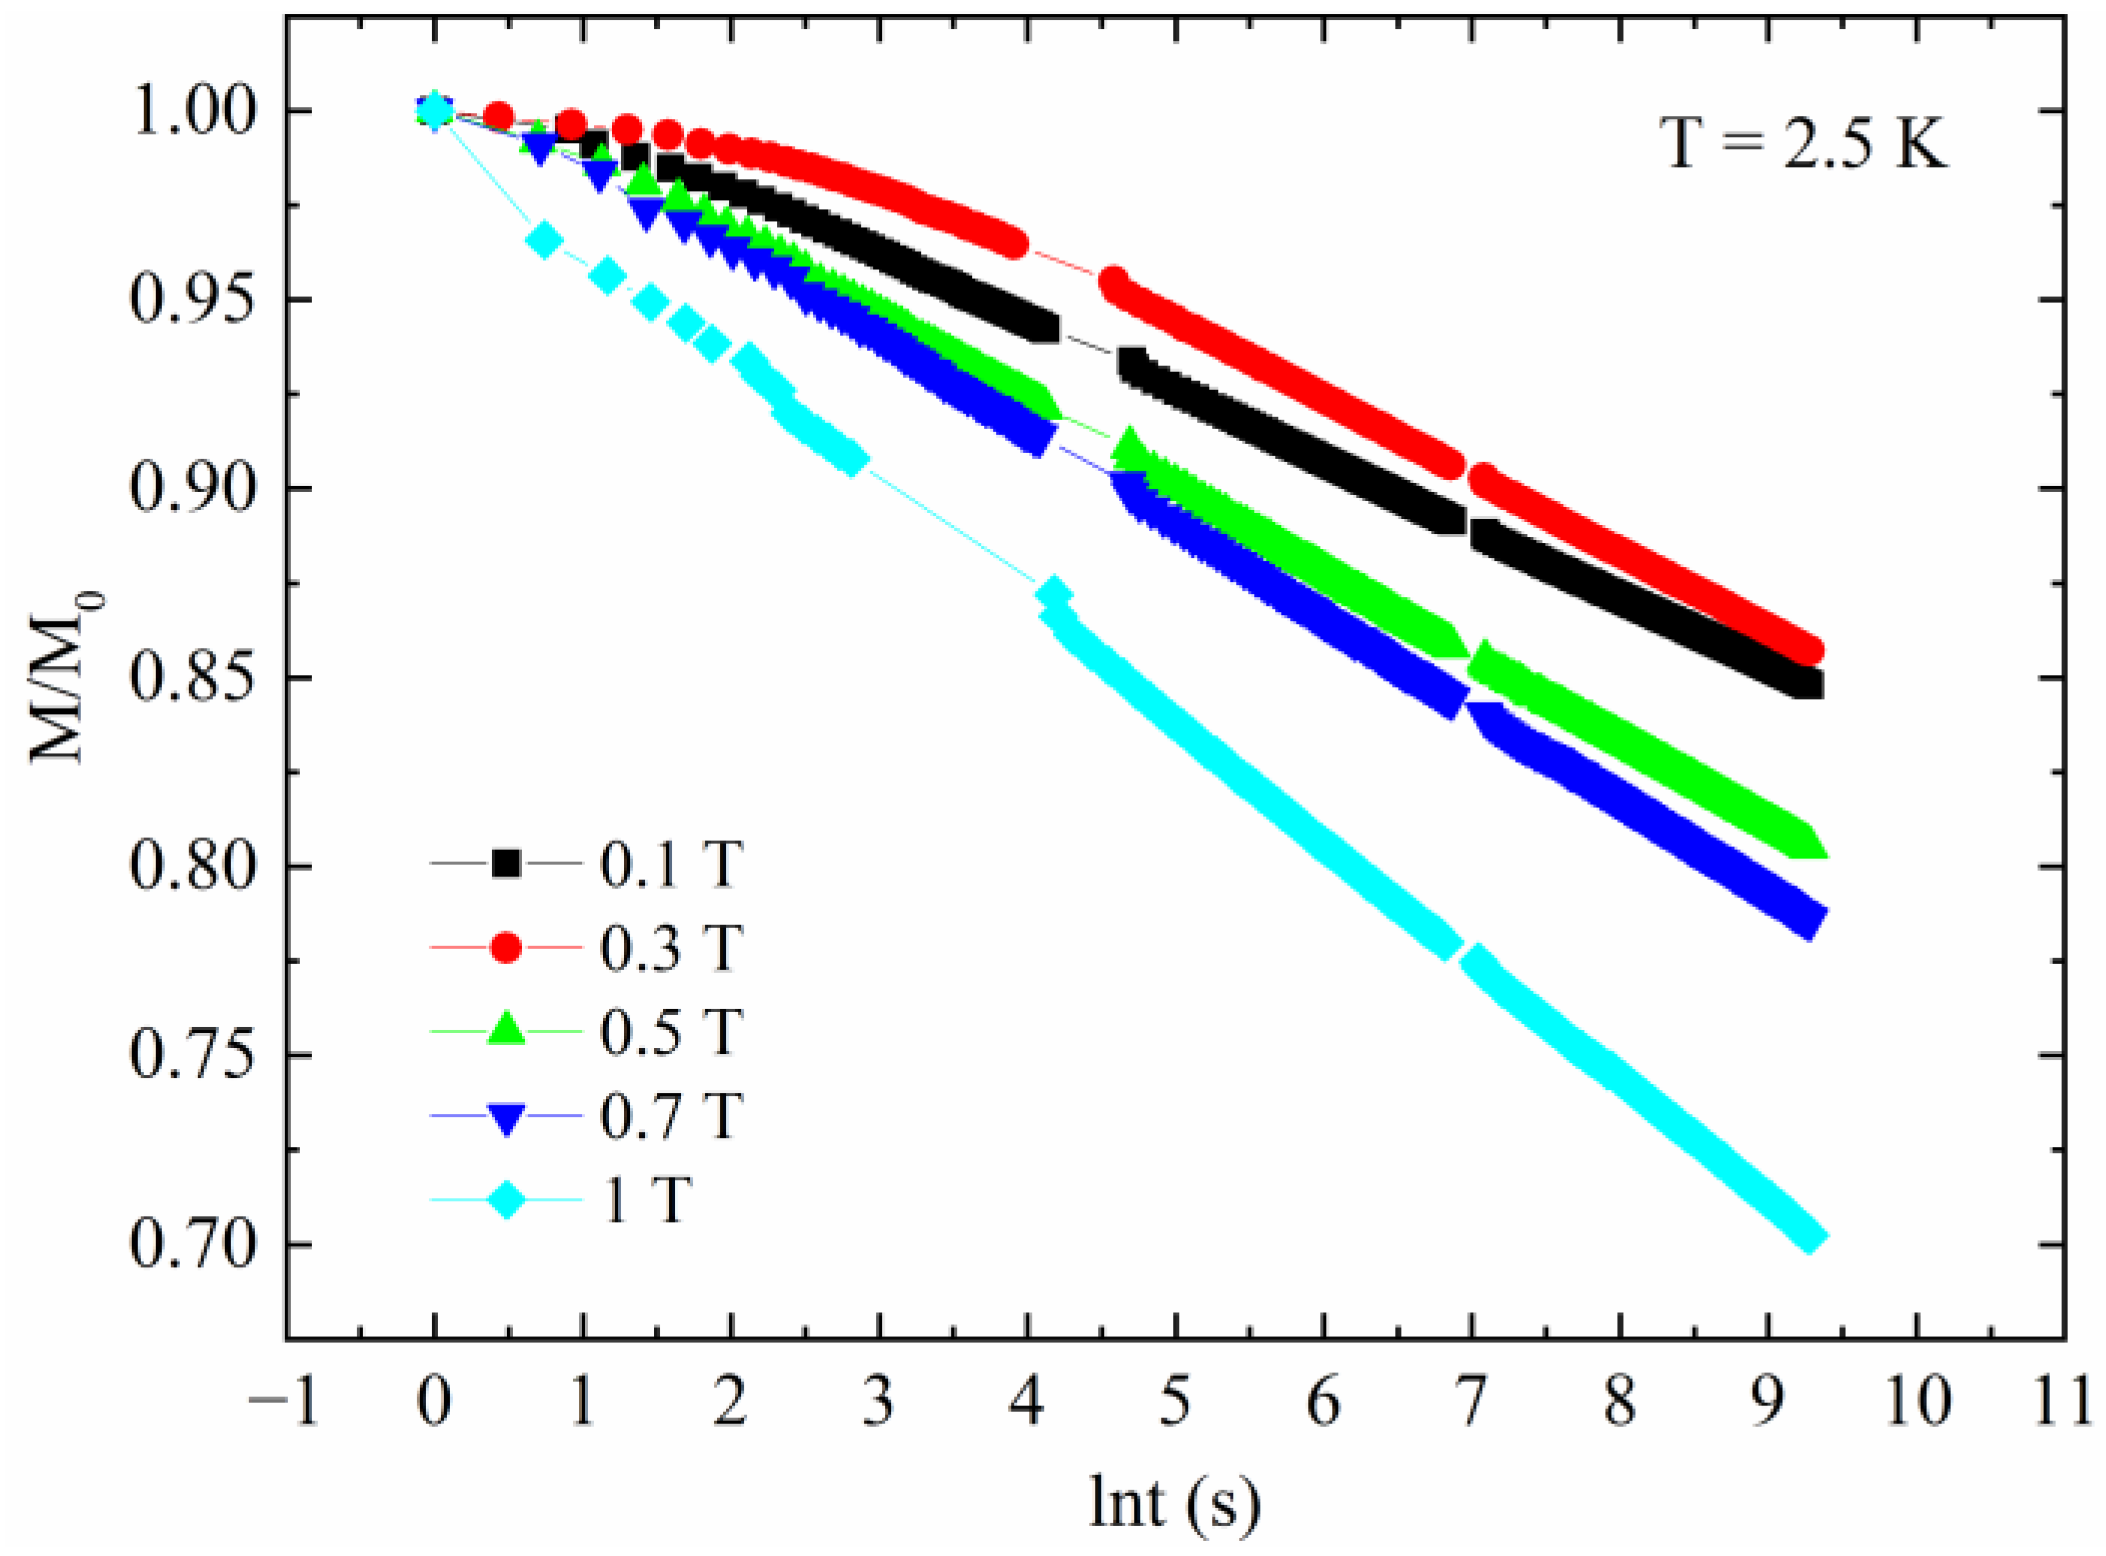
where Hc1(0) is the value of Hc1 at T = 0 K and T* indicates when the phenomenon is undetectable. The Hc1(T) curve together with its fit is reported in the inset of Figure 2. From the fit procedure, Hc1(0) ≈ 120 Oe, T* ≈ 27.7 K, n ≈ 0.67 have been obtained. The study of the Hc1(T) line is interesting since below it the sample is in the Meissner state while above it the vortices start to enter the sample causing dissipation processes. From our previous work [15], we already know that a strong pinning regime characterizes our sample. Now, we want to determine how the vortex interact with each other by means of magnetic relaxation measurements. At this aim, m(t) measurements have been made at several temperatures and fields. Figure 3 shows relaxation measurements at 2.5 K between 0.1 T and 1 T.
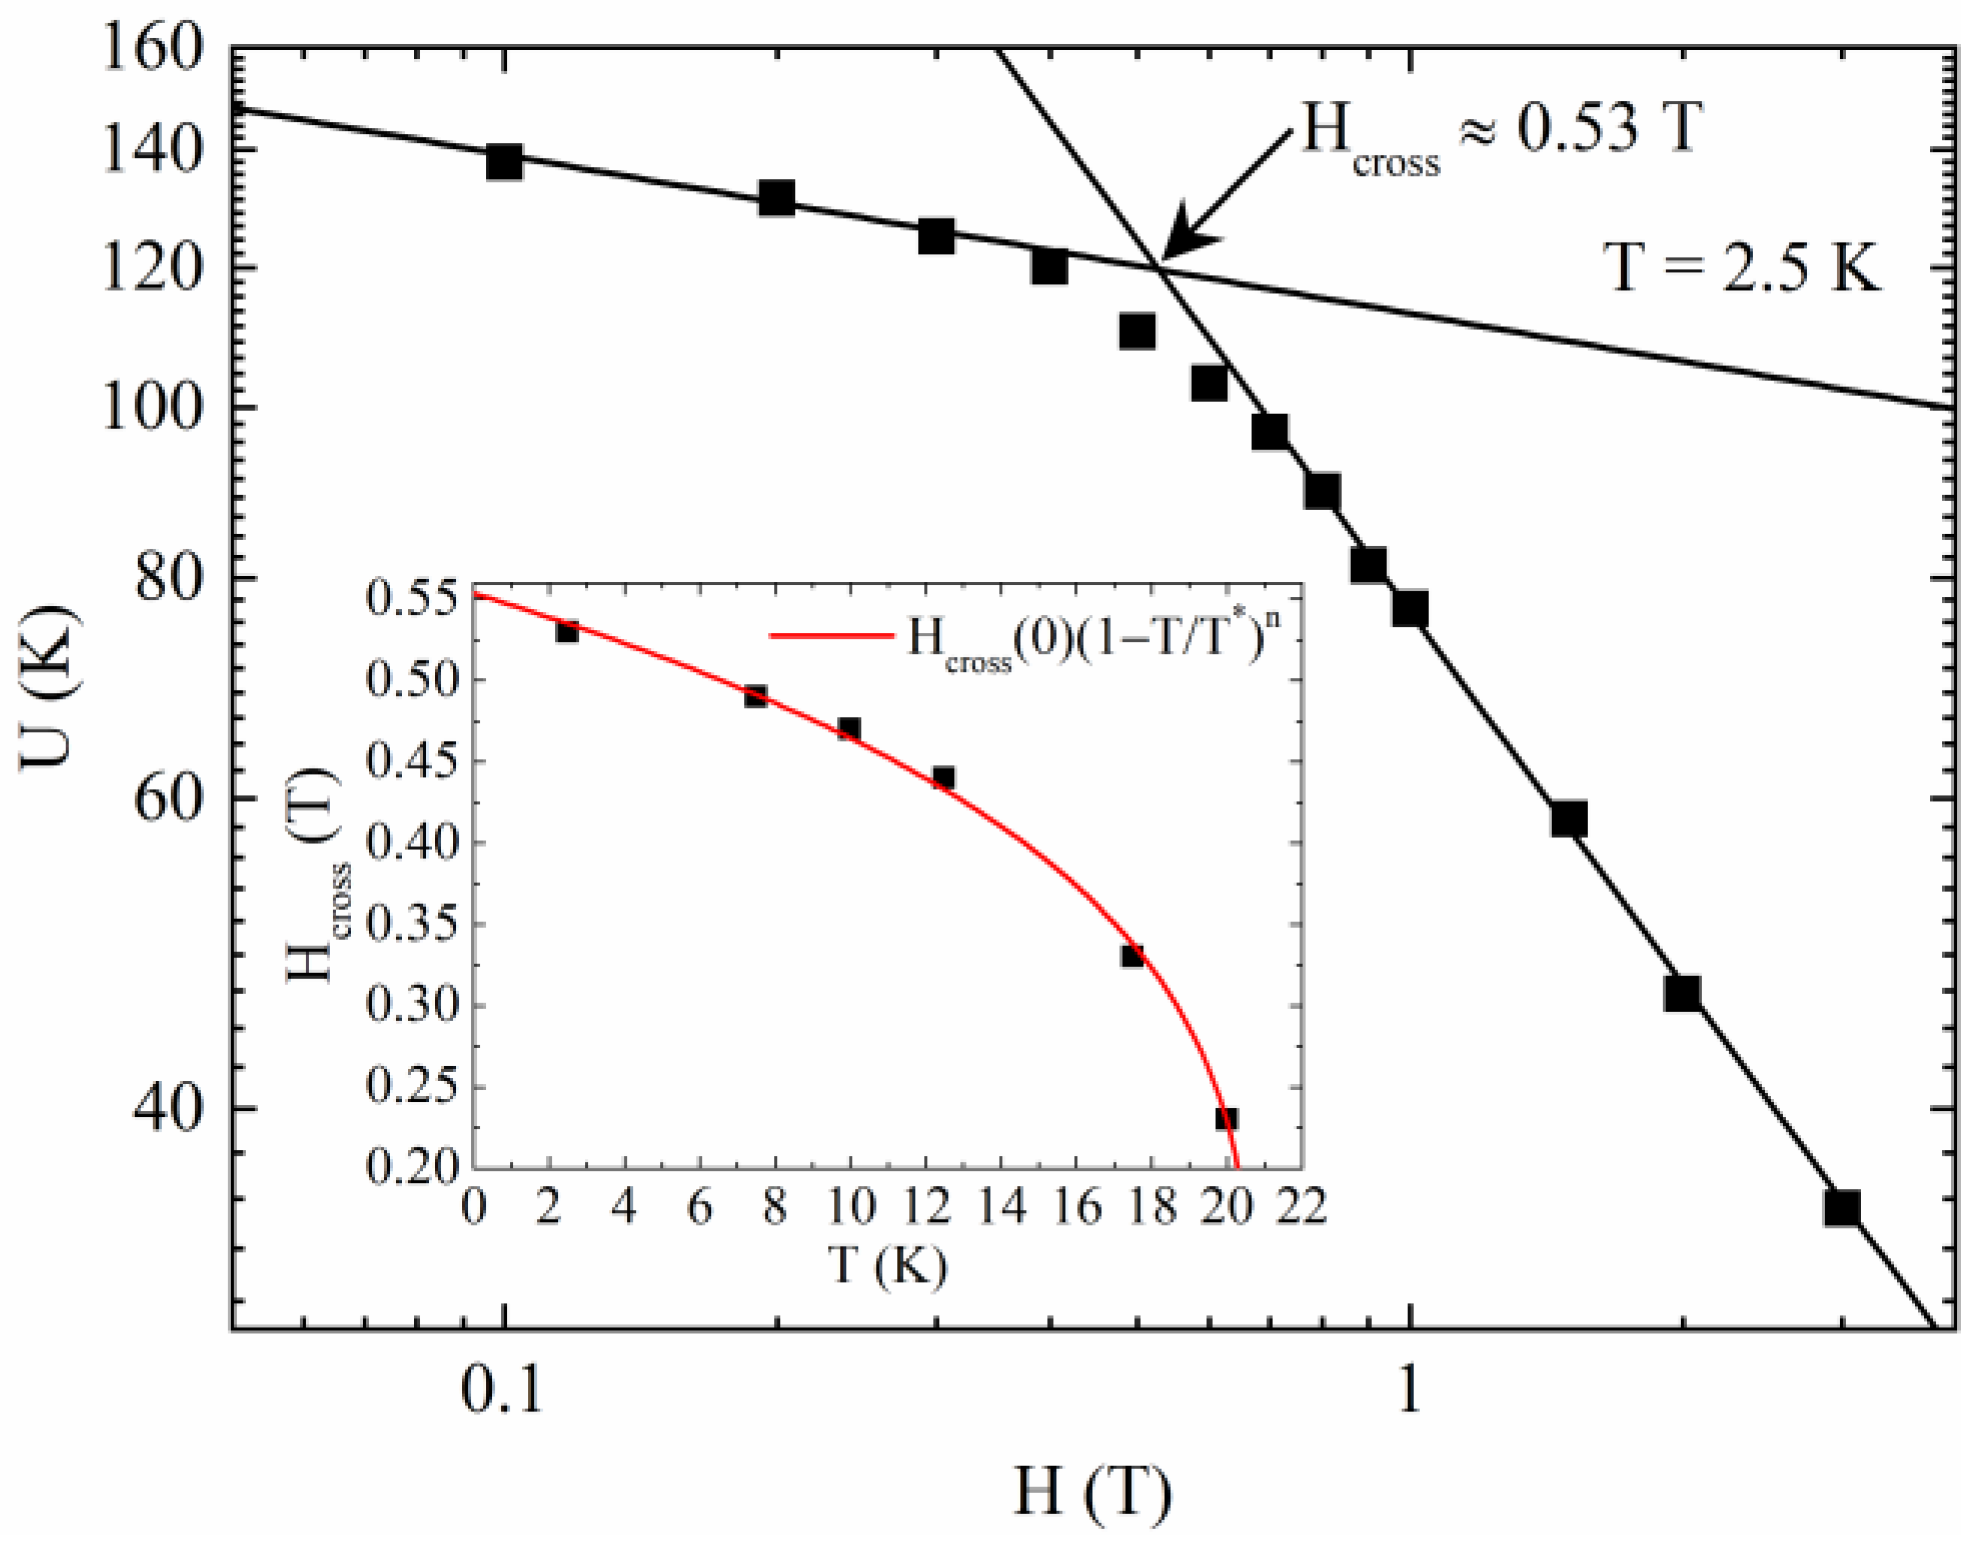
From Figure 3, the pinning energy versus field U(H) values have been extracted by means of U = −Tdln(t)/dln(|M|) [30,31]. In Figure 4, the U(H) for T = 2.5 K has been shown. It can be noted how the U(H) behavior changes for increasing fields. When the field is low, U(H) decrease is slow while the U(H) decrease is faster when the field is increased. These curve behaviors were fitted with U ( H ) H α where α specifies the pinning regime of the sample.
Specifically, a single vortex pinning regime is obtained when α ≈ 0 [32] while a collective pinning regime is individuated by α > 0.5 [33]. From the fitting procedure, the field where the U(H) behavior changes was obtained, i.e., Hcross ≈ 0.53 T. When H < Hcross, α ≈ 0.09 indicates that the vortices do not interact with each other (single vortex regime). When H > Hcross, α ≈ 0.7 indicates a collective pinning behavior. The same fitting procedure can be repeated at different temperatures. The temperature dependence of Hcross as is shown in the inset of Figure 4 together with its fit with the power law
H cross ( T ) = H cross ( 0 ) ( 1 T / T * ) n
where Hcross(0) ≈ 0.55 T is the value of Hcross at T = 0 K, T* ≈ 20.75 K indicates when the phenomenon is undetectable, and n ≈ 0.27 is the exponent. The study of Hcross(T) line can be interesting since below it the sample shows a field behavior of the pinning energy almost constant which could allow a better transport of current. In order to find the irreversibility line, the critical current density Jc versus H curves have been shown in the main panel of Figure 5. A second magnetization peak phenomenon, similar to others observed in literature for iron-based superconductors [34,35,36,37], has been detected. The second peak position Hsp, individuated by a black dashed line in the main panel of Figure 5, typically identifies the transition between the elastic and the plastic distortion of the vortex lattice in the framework of a strong pinning [38,39,40,41]. The Hsp values have been extracted at the different temperatures and plotted in the inset(a) of Figure 5. In particular, the Hsp(T) values have been fitted with the power law
H sp ( T ) = H sp ( 0 ) ( 1 T / T * ) n  
where Hsp(0) ≈ 1.3 T is the value of Hsp at T = 0 K, T* ≈ 30.4 K indicates when the phenomenon is undetectable, and n ≈ 0.14 is the exponent. The Hsp(T) line is very appealing for applications since for H approaching Hsp the Jc is increasing with the field while for H > Hsp it is decreasing. On the other hand, the black solid line in the main panel of Figure 5 indicates the irreversibility field Hirr values. Specifically, Hirr can be obtained with the criterion of Jc = 100 A/cm2 [42]. In the inset(b) of Figure 5, Hirr versus temperature is shown together with the fit with the equation
H irr ( T ) = H irr ( 0 ) ( 1 T / T * ) n  
where Hirr(0) ≈ 26 T is the value of Hirr at T = 0 K, T* ≈ 31.1 K indicates when the phenomenon is undetectable, and n ≈ 0.86 is the exponent. The Hirr(T) line is very important since it individuates the vortex liquid region where no pinning forces act and high dissipations occur in the material. Naturally, this region must be avoided in the framework of power applications of superconductivity.
Finally, m(T) curves have been performed in ZFC conditions at different magnetic fields (see the main panel of Figure 6) to evaluate the Hc2 values. Particularly, they have been estimated by determining the onset of the magnetization drop at the different fields. Hc2(T) curve is shown in the inset of Figure 6 together with the fit with the power law
H c 2 ( T ) = H c 2 ( 0 ) ( 1 T / T c ) n  
where Hc2(0) ≈ 212 T is the value of Hc2 at T = 0 K, Tc = 35 K is the critical temperature of the sample at H ≈ 0 T [15], and n ≈ 0.9 is the exponent. The Hc2(T) line is important to determine the maximum appliable magnetic field to the material without its transition to the normal state.
It is worth to underline the huge Hc2(0) value which overcomes 200 T. Moreover, the n exponent values for Hirr and Hc2 are minor than 1 different from what happens in iron-based materials of different families [36,43,44,45,46,47]. All the features discussed so far can be summarized by constructing the H(T) vortex phase diagram. In the main panel of Figure 7, Hc1, Hirr, Hc2 are reported together with their fit. It is possible to note a very wide vortex liquid region where the vortices are unpinned [48,49,50]. In the framework of power applications of superconductivity, it is worth having the Hirr line near the Hc2 one to hinder the vortices movement inside the material and the consequent dissipation with depression of critical current density. From this point of view, the sample must be optimized even if its critical current density values are in agreement with the literature [17,25,51]. It is worth to underline that the strong pinning region is very narrow compared with the vortex liquid one as shown in the main panel of Figure 7. This suggests the presence of a few strong pinning centers and a bad connection among the grains of the polycrystalline sample. This usually causes a fast Jc decrease as a function of the field due to the efficiency lack of the pinning acting in the sample which leads to wide vortex liquid regions. In the inset of Figure 7, the strong pinning region has been magnified. Even with the zoom, the region below the Hc1 line is barely visible indicating a very weak Meissner state. Between the Hc1 and Hcross lines, a single vortex behavior has been found. On the other hand, collective pinning characterized by elastic deformations of the vortex lattice can be noted between Hcross and Hsp lines. Between Hsp and Hirr lines, the plastic deformations rule the vortex dynamics of the sample. It is interesting to highlight that this plastic deformations area is the widest in the framework of the strong pinning region. When plastic deformations act in a sample, the pinning energy as a function of the temperature decreases quickly [52,53,54]. This is coherent with the weak pinning strength found in the sample. Finally, the next fascinating challenge is to improve the sample fabrication process in order to drastically reduce the vortex liquid region by nearing the Hirr line to the Hc2 one. Reaching this target, a huge strong pinning region will be achieved allowing the sample to sustain high Jc in very high magnetic fields so becoming an interesting candidate for power applications of superconductivity.

4. Conclusions

A CaKFe4As4 polycrystalline sample has been analyzed by means of DC magnetic measurements performed as a function of the temperature, the magnetic field, and the time in order to determine its superconducting critical parameters. By fitting all the reported characteristic fields with the power law H ( T ) = H ( 0 ) ( 1 T / T * ) n , a rich vortex phase diagram has been drawn showing a very wide vortex liquid region. An opening for the upcoming researchers can be to reduce this zero-pinning region by optimizing the fabrication process of the sample so making it more suitable for power applications. A further opening for future studies can also be the doping of non-optimized samples by using different elements in order to understand the behavior of the critical parameters analyzed in this work. Anyway, the study of non-optimized superconductors becomes very useful to understand how the superconducting critical parameters behave in presence of a magnetic field since this kind of sample can have an analogous magnetic behavior of wires and cables used in the power applications of superconductivity.

Author Contributions

Conceptualization, A.G., A.L., A.M. and F.V.; methodology, A.G. and A.L.; validation, A.G., A.L. and M.P.; formal analysis, A.G. and A.L.; investigation, A.G., A.L., A.M., A.N. and G.G.; data curation, A.G., A.L., A.M. and F.V.; writing—original draft preparation, A.G. and A.L.; writing—review and editing, A.M., F.V., A.N., G.G. and M.P.; visualization, A.N., G.G., M.P.; supervision, G.G. and M.P.; project administration, G.G. and M.P. All authors have read and agreed to the published version of the manuscript.

Funding

This research received no external funding.

Institutional Review Board Statement

Not applicable.

Informed Consent Statement

Not applicable.

Data Availability Statement

The data sets that support the findings in this study are available from the corresponding author upon reasonable request.

Conflicts of Interest

The authors declare no conflict of interest.

References

  1. Kamihara, Y.; Watanabe, T.; Hirano, M.; Hosono, H. Iron-based layered superconductor La[O(1-x)F(x)]FeAs (x = 0.05-0.12) with T(c) = 26 K. J. Am. Chem. Soc. 2008, 130, 3296–3297. [Google Scholar] [CrossRef] [PubMed]
  2. Bednorz, J.G.; Müller, K.A. Possible high Tc superconductivity in the Ba-La-Cu-O system. Z. Phys. B Condens. Matter 1986, 64, 189–193. [Google Scholar] [CrossRef]
  3. Moodera, J.S.; Meservey, R.; Tkaczyk, J.E.; Hao, C.X.; Gibson, G.A.; Tedrow, P.M. Critical-magnetic-field anisotropy in single-crystal YBa2Cu3O7. Phys. Rev. B 1988, 37, 619–622. [Google Scholar] [CrossRef] [PubMed]
  4. Naughton, M.J.; Yu, R.C.; Davies, P.K.; Fischer, J.E.; Chamberlin, R.V.; Wang, Z.Z.; Jing, T.W.; Ong, N.P.; Chaikin, P.M. Orientational anisotropy of the upper critical field in single-crystal YBa2Cu3O7 and Bi2.2CaSr1.9Cu2O8+x. Phys. Rev. B 1988, 38, 9280–9283. [Google Scholar] [CrossRef] [PubMed]
  5. Ambegaokar, V.; Baratoff, A. Tunneling Between Superconductors. Phys. Rev. Lett. 1963, 10, 486–489. [Google Scholar] [CrossRef]
  6. Delin, K.A.; Kleinsasser, A.W. Stationary properties of high-critical-temperature proximity effect Josephson junctions. Supercond. Sci. Technol. 1996, 9, 227–269. [Google Scholar] [CrossRef]
  7. Yuan, H.Q.; Singleton, J.; Balakirev, F.F.; Baily, S.A.; Chen, G.F.; Luo, J.L.; Wang, N.L. Nearly isotropic superconductivity in (Ba,K)Fe2As2. Nature 2009, 457, 565–568. [Google Scholar] [CrossRef]
  8. Grimaldi, G.; Leo, A.; Martucciello, N.; Braccini, V.; Bellingeri, E.; Ferdeghini, C.; Galluzzi, A.; Polichetti, M.; Nigro, A.; Villegier, J.-C.; et al. Weak or Strong Anisotropy in Fe(Se,Te) Superconducting Thin Films Made of Layered Iron-Based Material? IEEE Trans. Appl. Supercond. 2019, 29, 1–4. [Google Scholar] [CrossRef]
  9. Katase, T.; Ishimaru, Y.; Tsukamoto, A.; Hiramatsu, H.; Kamiya, T.; Tanabe, K.; Hosono, H. Advantageous grain boundaries in iron pnictide superconductors. Nat. Commun. 2011, 2, 409. [Google Scholar] [CrossRef] [Green Version]
  10. De Gennes, P.G. Boundary effects in superconductors. Rev. Mod. Phys. 1964, 36, 225–237. [Google Scholar] [CrossRef]
  11. Galluzzi, A.; Buchkov, K.; Nazarova, E.; Tomov, V.; Grimaldi, G.; Leo, A.; Pace, S.; Polichetti, M. Transport properties and high upper critical field of a Fe(Se,Te) iron based superconductor. Eur. Phys. J. Spec. Top. 2019, 228, 725–731. [Google Scholar] [CrossRef]
  12. Fiamozzi Zignani, C.; De Marzi, G.; Corato, V.; Mancini, A.; Vannozzi, A.; Rufoloni, A.; Leo, A.; Guarino, A.; Galluzzi, A.; Nigro, A.; et al. Improvements of high-field pinning properties of polycrystalline Fe(Se,Te) material by heat treatments. J. Mater. Sci. 2019, 54, 5092–5100. [Google Scholar] [CrossRef]
  13. Rotter, M.; Tegel, M.; Johrendt, D. Superconductivity at 38 K in the iron arsenide (Ba1-xKx)Fe2As2. Phys. Rev. Lett. 2008, 101, 107006. [Google Scholar] [CrossRef] [Green Version]
  14. Iyo, A.; Kawashima, K.; Kinjo, T.; Nishio, T.; Ishida, S.; Fujihisa, H.; Gotoh, Y.; Kihou, K.; Eisaki, H.; Yoshida, Y. New-Structure-Type Fe-Based Superconductors: CaAFe4As4 (A = K, Rb, Cs) and SrAFe4As4 (A = Rb, Cs). J. Am. Chem. Soc. 2016, 138, 3410–3415. [Google Scholar] [CrossRef] [PubMed]
  15. Galluzzi, A.; Leo, A.; Masi, A.; Varsano, F.; Nigro, A.; Grimaldi, G.; Polichetti, M. Critical Current and Pinning Features of a CaKFe4As4 Polycrystalline Sample. Materials 2021, 14, 6611. [Google Scholar] [CrossRef] [PubMed]
  16. Meier, W.R.; Kong, T.; Kaluarachchi, U.S.; Taufour, V.; Jo, N.H.; Drachuck, G.; Böhmer, A.E.; Saunders, S.M.; Sapkota, A.; Kreyssig, A.; et al. Anisotropic thermodynamic and transport properties of single-crystalline CaKFe4As4. Phys. Rev. B 2016, 94, 064501. [Google Scholar] [CrossRef] [Green Version]
  17. Singh, S.J.; Bristow, M.; Meier, W.R.; Taylor, P.; Blundell, S.J.; Canfield, P.C.; Coldea, A.I. Ultrahigh critical current densities, the vortex phase diagram, and the effect of granularity of the stoichiometric high-Tc superconductor CaKFe4As4. Phys. Rev. Mater. 2018, 2, 74802. [Google Scholar] [CrossRef]
  18. Wang, C.; He, T.; Han, Q.; Ji, Z.; Lei, Q.; Tang, Q.; Li, Y.; Yu, B. Vortex creep activation energies and depinning currents in CaKFe4As4 and Ba0.6K0.4Fe2As2 revealed by AC susceptibility measurements. J. Phys. Condens. Matter 2020, 32, 415607. [Google Scholar] [CrossRef]
  19. Cheng, Z.; Dong, C.; Huang, H.; Liu, S.; Zhu, Y.; Wang, D.; Vlasko-Vlasov, V.; Welp, U.; Kwok, W.K.; Ma, Y. Chemical stability and superconductivity in Ag-sheathed CaKFe4As4 superconducting tapes. Supercond. Sci. Technol. 2019, 32, 015008. [Google Scholar] [CrossRef] [Green Version]
  20. Pyon, S.; Miyawaki, D.; Veshchunov, I.; Tamegai, T.; Takano, K.; Kajitani, H.; Koizumi, N.; Awaji, S. Fabrication and characterization of CaKFe4As4 round wires sintered at high pressure. Appl. Phys. Express 2018, 11, 123101. [Google Scholar] [CrossRef]
  21. Adesso, M.G.; Polichetti, M.; Pace, S. Harmonics of the AC susceptibility for the study of I-V curves in melt grown YBCO. Phys. C Supercond. Its Appl. 2004, 401, 196–200. [Google Scholar] [CrossRef] [Green Version]
  22. Senatore, C.; Polichetti, M.; Zola, D.; Matteo, T.D.; Giunchi, G.; Pace, S. Vortex dynamics and pinning properties analysis of MgB 2 bulk samples by ac susceptibility measurements. Supercond. Sci. Technol. 2003, 16, 183–187. [Google Scholar] [CrossRef] [Green Version]
  23. Oliveira, A.A.M.; Hur, N.; Cheong, S.W.; Ortiz, W.A. Vortex glass melting in Mg-deficient MgB2. Phys. Rev. B-Condens. Matter Mater. Phys. 2010, 82, 104506. [Google Scholar] [CrossRef]
  24. Oliveira, A.A.M.; Lisboa-Filho, P.N.; Ortiz, W.A. Solid-liquid transition in Nb powder determined by third harmonic susceptibility. J. Magn. Magn. Mater. 2008, 320, e510–e512. [Google Scholar] [CrossRef]
  25. Masi, A.; Angrisani Armenio, A.; Celentano, G.; La Barbera, A.; Rufoloni, A.; Silva, E.; Vannozzi, A.; Varsano, F. Mechanochemically assisted low temperature synthesis route of the 1144 Ca-K Iron Based Superconductor. Supercond. Sci. Technol. 2020, 33, 74003–74010. [Google Scholar] [CrossRef]
  26. Galluzzi, A.; Nigro, A.; Fittipaldi, R.; Guarino, A.; Pace, S.; Polichetti, M. DC magnetic characterization and pinning analysis on Nd1.85Ce0.15CuO4 cuprate superconductor. J. Magn. Magn. Mater. 2019, 475, 125–129. [Google Scholar] [CrossRef]
  27. Polichetti, M.; Galluzzi, A.; Buchkov, K.; Tomov, V.; Nazarova, E.; Leo, A.; Grimaldi, G.; Pace, S. A precursor mechanism triggering the second magnetization peak phenomenon in superconducting materials. Sci. Rep. 2021, 11, 7247. [Google Scholar] [CrossRef]
  28. Galluzzi, A.; Polichetti, M.; Buchkov, K.; Nazarova, E.; Mancusi, D.; Pace, S. Critical current and flux dynamics in Ag-doped FeSe superconductor. Supercond. Sci. Technol. 2017, 30, 025013. [Google Scholar] [CrossRef]
  29. Felner, I.; Kopelevich, Y. Magnetization measurement of a possible high-temperature superconducting state in amorphous carbon doped with sulfur. Phys. Rev. B-Condens. Matter Mater. Phys. 2009, 79, 233409. [Google Scholar] [CrossRef] [Green Version]
  30. Galluzzi, A.; Buchkov, K.M.; Nazarova, E.; Tomov, V.; Grimaldi, G.; Leo, A.; Pace, S.; Polichetti, M. Pinning energy and anisotropy properties of a Fe(Se,Te) iron based superconductor. Nanotechnology 2019, 30, 254001. [Google Scholar] [CrossRef]
  31. Yeshurun, Y.; Malozemoff, A.P.; Shaulov, A. Magnetic relaxation in high-temperature superconductors. Rev. Mod. Phys. 1996, 68, 911–949. [Google Scholar] [CrossRef] [Green Version]
  32. Blatter, G.; Feigel’Man, M.V.; Geshkenbein, V.B.; Larkin, A.I.; Vinokur, V.M. Vortices in high-temperature superconductors. Rev. Mod. Phys. 1994, 66, 1125–1388. [Google Scholar] [CrossRef]
  33. Yeshurun, Y.; Malozemoff, A.P. Giant flux creep and irreversibility in an Y-Ba-Cu-O crystal: An alternative to the superconducting-glass model. Phys. Rev. Lett. 1988, 60, 2202–2205. [Google Scholar] [CrossRef]
  34. Galluzzi, A.; Buchkov, K.; Tomov, V.; Nazarova, E.; Leo, A.; Grimaldi, G.; Nigro, A.; Pace, S.; Polichetti, M. Evidence of pinning crossover and the role of twin boundaries in the peak effect in FeSeTe iron based superconductor. Supercond. Sci. Technol. 2018, 31, 015014. [Google Scholar] [CrossRef]
  35. Ionescu, A.M.; Miu, D.; Crisan, A.; Miu, L. Pinning-Induced Vortex-System Disordering at the Origin of the Second Magnetization Peak in Superconducting Single Crystals. J. Supercond. Nov. Magn. 2018, 31, 2329–2337. [Google Scholar] [CrossRef]
  36. Pramanik, A.K.; Harnagea, L.; Nacke, C.; Wolter, A.U.B.; Wurmehl, S.; Kataev, V.; Büchner, B. Fishtail effect and vortex dynamics in LiFeAs single crystals. Phys. Rev. B-Condens. Matter Mater. Phys. 2011, 83, 094502. [Google Scholar] [CrossRef] [Green Version]
  37. Miu, D.; Noji, T.; Adachi, T.; Koike, Y.; Miu, L. On the nature of the second magnetization peak in FeSe1−xTex single crystals. Supercond. Sci. Technol. 2012, 25, 115009. [Google Scholar] [CrossRef]
  38. Yang, H.; Luo, H.; Wang, Z.; Wen, H.-H. Fishtail effect and the vortex phase diagram of single crystal Ba0.6K0.4Fe2As2. Appl. Phys. Lett. 2008, 93, 142506. [Google Scholar] [CrossRef] [Green Version]
  39. Prozorov, R.; Ni, N.; Tanatar, M.A.; Kogan, V.G.; Gordon, R.T.; Martin, C.; Blomberg, E.C.; Prommapan, P.; Yan, J.Q.; Bud’ko, S.L.; et al. Vortex phase diagram of Ba(Fe0.93Co0.07)2As2 single crystals. Phys. Rev. B 2008, 78, 224506. [Google Scholar] [CrossRef] [Green Version]
  40. Salem-Sugui, S.; Ghivelder, L.; Alvarenga, A.D.; Cohen, L.F.; Yates, K.A.; Morrison, K.; Pimentel, J.L.; Luo, H.; Wang, Z.; Wen, H.H. Flux dynamics associated with the second magnetization peak in the iron pnictide Ba1-xKxFe2As2. Phys. Rev. B-Condens. Matter Mater. Phys. 2010, 82, 054513. [Google Scholar] [CrossRef]
  41. Sharma, S.; Vinod, K.; Sundar, C.S.; Bharathi, A. Critical current density and magnetic phase diagrams of BaFe 1.29Ru0.71As2 single crystals. Supercond. Sci. Technol. 2012, 26, 015009. [Google Scholar] [CrossRef] [Green Version]
  42. Shabbir, B.; Wang, X.; Ghorbani, S.R.; Shekhar, C.; Dou, S.; Srivastava, O.N. Hydrostatic pressure: A very effective approach to significantly enhance critical current density in granular iron pnictide superconductors. Sci. Rep. 2015, 5, 8213. [Google Scholar] [CrossRef] [Green Version]
  43. Shen, B.; Cheng, P.; Wang, Z.; Fang, L.; Ren, C.; Shan, L.; Wen, H.H. Flux dynamics and vortex phase diagram in Ba(Fe1-xCox)2As2 single crystals revealed by magnetization and its relaxation. Phys. Rev. B 2010, 81, 014503. [Google Scholar] [CrossRef] [Green Version]
  44. Das, P.; Thakur, A.D.; Yadav, A.K.; Tomy, C.V.; Lees, M.R.; Balakrishnan, G.; Ramakrishnan, S.; Grover, A.K. Magnetization hysteresis and time decay measurements in FeSe 0.50Te 0.50: Evidence for fluctuation in mean free path induced pinning. Phys. Rev. B-Condens. Matter Mater. Phys. 2011, 84, 214526. [Google Scholar] [CrossRef] [Green Version]
  45. Buchkov, K.; Galluzzi, A.; Mancusi, D.; Nazarova, E.; Pace, S.; Polichetti, M. Harmonic AC magnetic susceptibility analysis of FeSe crystals with composite morphology. Phys. Scr. 2019, 94, 085804. [Google Scholar] [CrossRef]
  46. Galluzzi, A.; Buchkov, K.; Tomov, V.; Nazarova, E.; Leo, A.; Grimaldi, G.; Pace, S.; Polichetti, M. Mixed state properties analysis in AC magnetic field of strong pinning Fe(Se,Te) single crystal. Supercond. Sci. Technol. 2020, 33, 094006. [Google Scholar] [CrossRef]
  47. Singh, S.J.; Shimoyama, J.; Yamamoto, A.; Ogino, H.; Kishio, K. Transition temperature and upper critical field in SmFeAsO 1-xFx synthesized at low heating temperatures. IEEE Trans. Appl. Supercond. 2013, 23, 7300605. [Google Scholar] [CrossRef]
  48. Polichetti, M.; Adesso, M.G.; Pace, S. Response of glass and liquid phases in the vortex lattice to an external AC magnetic field at different frequencies. Phys. A Stat. Mech. Its Appl. 2004, 339, 119–124. [Google Scholar] [CrossRef] [Green Version]
  49. Adesso, M.G.; Senatore, C.; Polichetti, M.; Pace, S. Harmonics of the AC susceptibility as probes to differentiate the various creep models. Phys. C Supercond. 2004, 404, 289–292. [Google Scholar] [CrossRef] [Green Version]
  50. Marziali Bermúdez, M.; Pasquini, G.; Bud’Ko, S.L.; Canfield, P.C. Correlated vortex pinning in slightly orthorhombic twinned Ba(Fe1-xCox)2As2 single crystals: Possible shift of the vortex-glass/liquid transition. Phys. Rev. B 2013, 87, 054515. [Google Scholar] [CrossRef]
  51. Singh, S.J.; Cassidy, S.J.; Bristow, M.; Blundell, S.J.; Clarke, S.J.; Coldea, A.I. Optimization of superconducting properties of the stoichiometric CaKFe4As4. Supercond. Sci. Technol. 2019, 33, 025003. [Google Scholar] [CrossRef]
  52. Miu, L.; Miu, D. On the sensitivity of the Maley technique for the analysis of vortex-creep activation energy in disordered superconductors. Supercond. Sci. Technol. 2010, 23, 025033. [Google Scholar] [CrossRef]
  53. Miu, L.; Miu, D.; Petrisor, T.; El Tahan, A.; Jakob, G.; Adrian, H. Origin of the plateau in the temperature dependence of the normalized magnetization relaxation rate in disordered high-temperature superconductors. Phys. Rev. B-Condens. Matter Mater. Phys. 2008, 78, 212508. [Google Scholar] [CrossRef]
  54. El Tahan, A.; Jakob, G.; Miu, D.; Ivan, I.; Badica, P.; Miu, L. Vortex creep crossover in YBCO/PrBCO superlattices during standard magnetization relaxation measurements. Supercond. Sci. Technol. 2011, 24, 045014. [Google Scholar] [CrossRef]
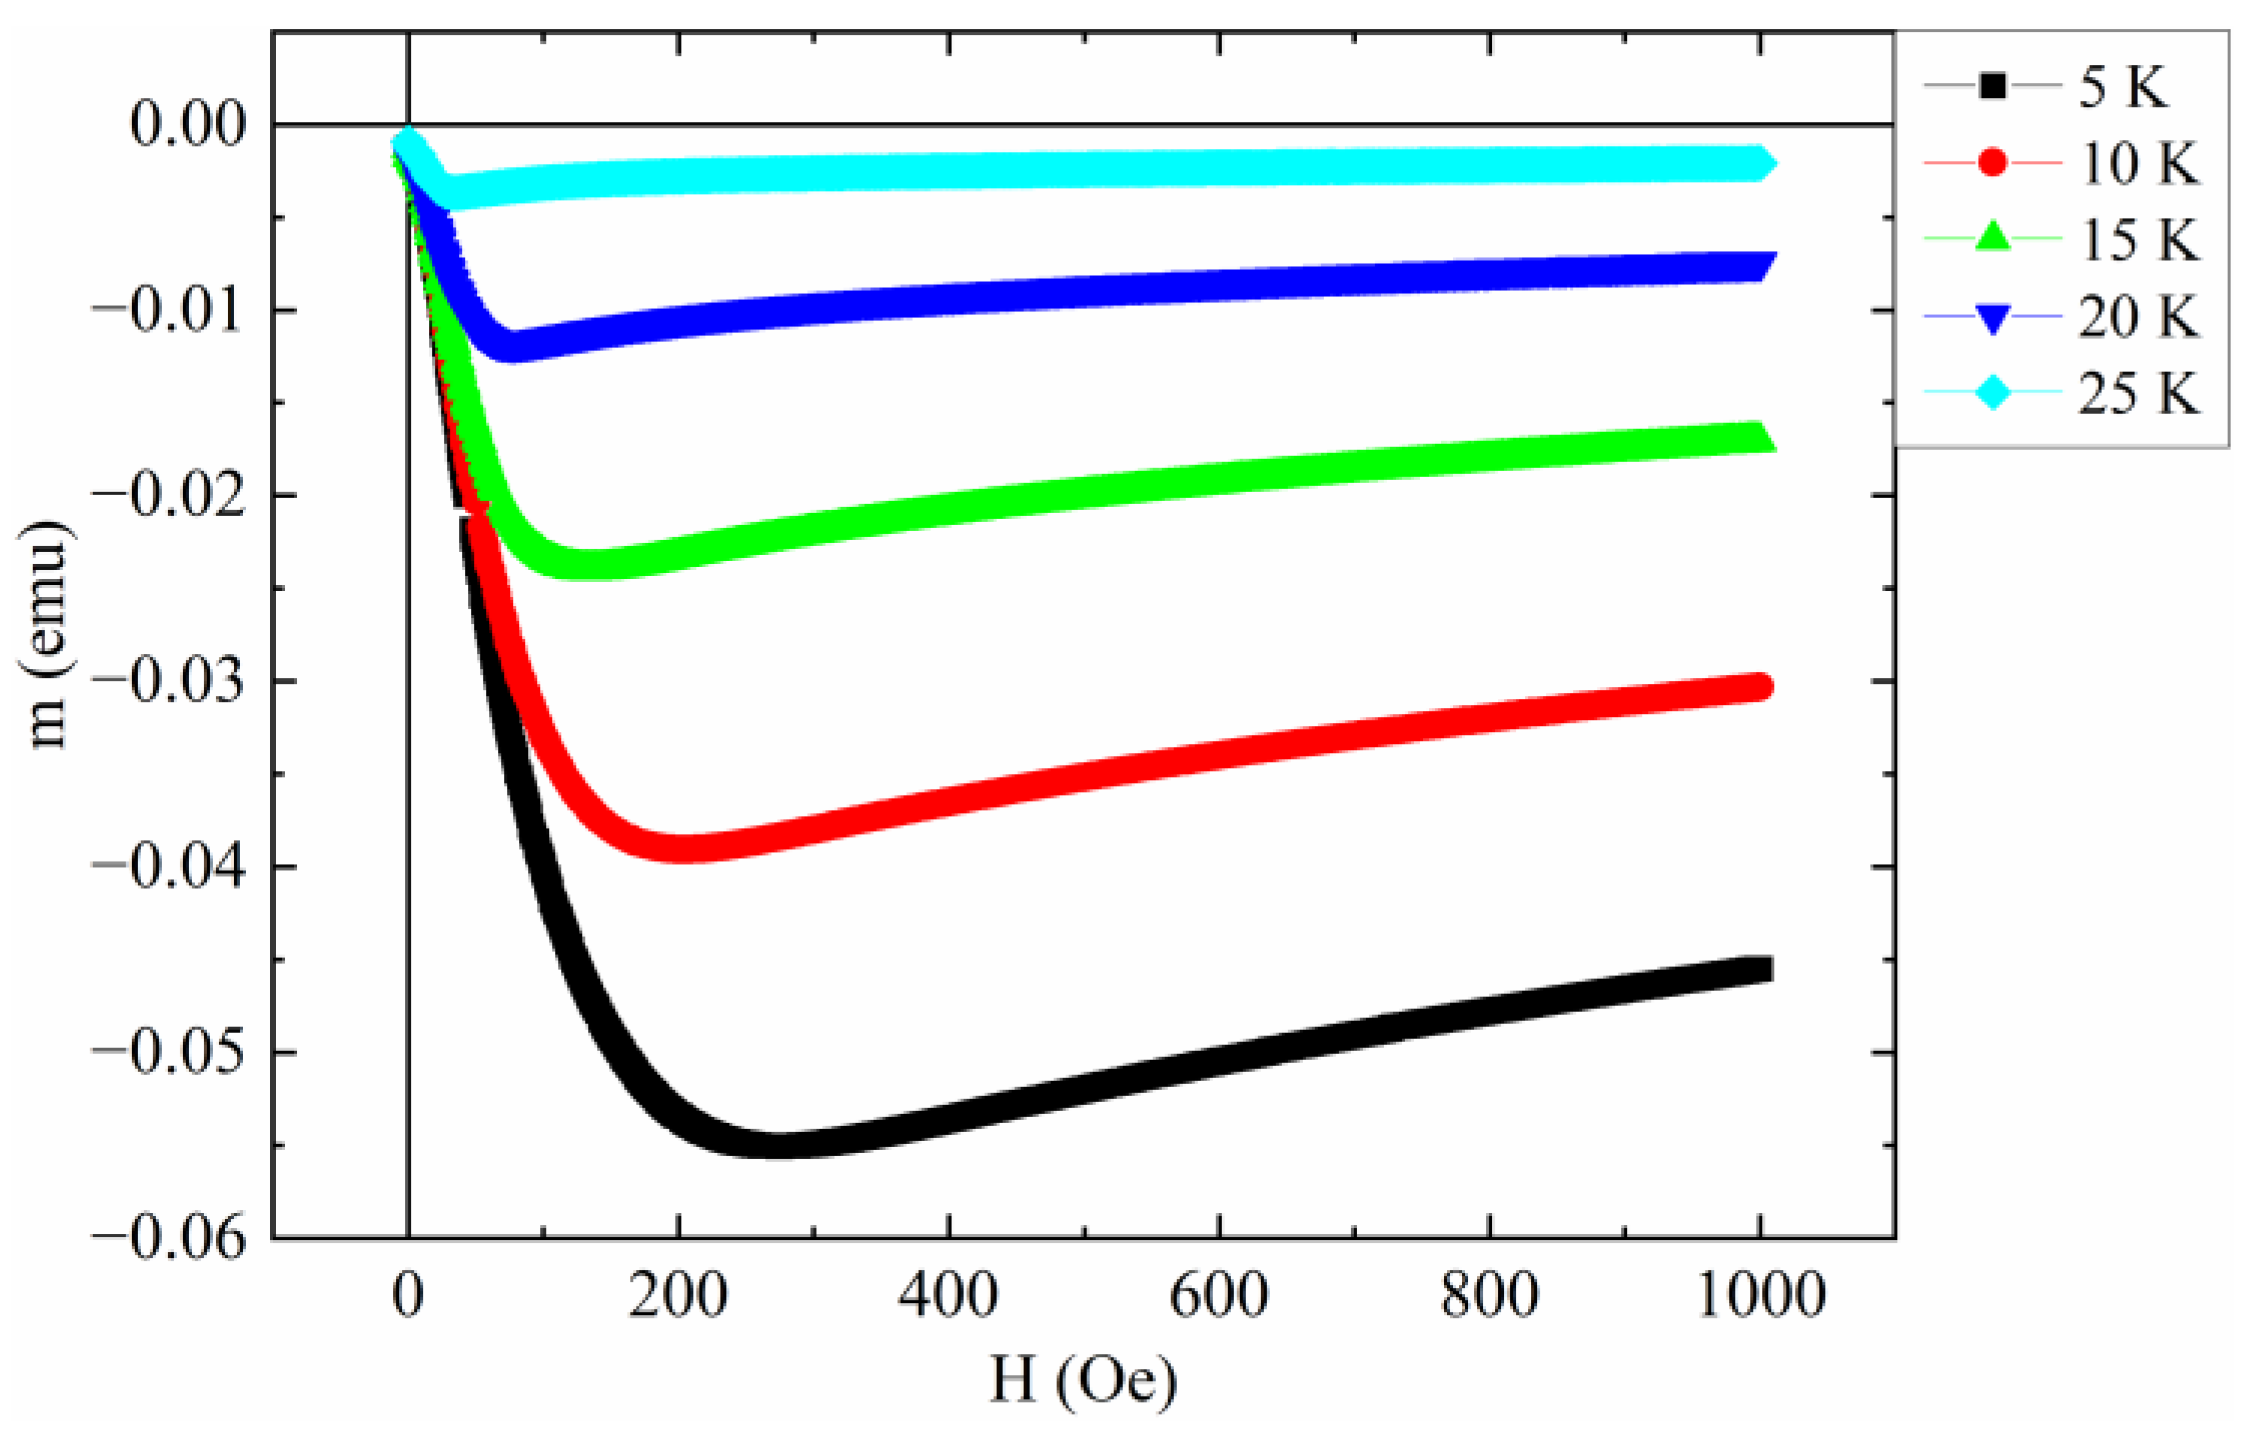
Figure 1. Field dependence of the magnetic moment at different temperatures in the range of low magnetic fields.
Applsci 13 00884 g001
Figure 2. Field dependence of the magnetic moment curve for T = 10 K. The red dashed line corresponds to the linear behavior due to the Meissner state while the red arrow indicates the Hc1 value. Inset: Hc1 versus T data are fitted with Hc1 = Hc1(0) (1 − T/T*)n. Fit results are reported in the text.
Applsci 13 00884 g002
Figure 3. Time dependence of magnetization at different magnetic fields at T = 2.5 K.
Applsci 13 00884 g003
Figure 4. Field dependence of the pinning energy at 2.5 K. The data are fitted with the power law U ( H ) H α . Fit details are reported in the text. Inset: Hcross versus T data are fitted with Hcross = Hcross(0) (1 − T/T*)n. Fit results are reported in the text.
Applsci 13 00884 g004
Figure 5. Critical current density Jc as a function of the field at different temperatures. The black horizontal line is the irreversibility line while the black dashed line individuates the second peak positions. Inset (a): Second peak values Hsp versus temperature. The data are fitted with the equation Hsp = Hsp(0) (1 − T/T*)n. Fit results are reported in the text. Inset (b): Hirr versus temperature. The data are fitted with the equation Hirr = Hirr(0) (1 − T/T*)n. Fit results are reported in the text.
Applsci 13 00884 g005
Figure 6. Magnetic moment as a function of the temperature in ZFC condition at different applied magnetic fields. Inset: Hc2 versus T data are fitted with Hc2 = Hc1(0) (1 − T/T*)n. Fit results are reported in the text.
Applsci 13 00884 g006
Figure 7. The H(T) vortex phase diagram of CaKFe4As4 polycrystalline sample. All the characteristic fields described in the main text are reported in the main panel and in the inset. The corresponding behaviors were fitted with the equation H(T) = H(0)(1−T/T*)n.
Applsci 13 00884 g007
Table 1. Measurement parameters values.
MeasurementMinimum ValueMaximum ValueRate
m(T)2.5 K300 K0.5 K/min
m(H)−9 T+9 T0.01 T/s
m(t)100 s10,800 s1 datapoint/s
Disclaimer/Publisher’s Note: The statements, opinions and data contained in all publications are solely those of the individual author(s) and contributor(s) and not of MDPI and/or the editor(s). MDPI and/or the editor(s) disclaim responsibility for any injury to people or property resulting from any ideas, methods, instructions or products referred to in the content.