Article

Utility of Ultrasonic Pulse Velocity for Estimating the Overall Mechanical Behavior of Recycled Aggregate Self-Compacting Concrete

by
Ana B. Espinosa
1,
Víctor Revilla-Cuesta
2,
Marta Skaf
1,
Flora Faleschini
3 and
Vanesa Ortega-López
2,3,*
1
Department of Construction, University of Burgos, 09001 Burgos, Spain
2
Department of Civil Engineering, University of Burgos, 09001 Burgos, Spain
3
Department of Civil, Environmental and Architectural Engineering, University of Padova, 35131 Padova, Italy
*
Author to whom correspondence should be addressed.
Appl. Sci. 2023, 13(2), 874; https://doi.org/10.3390/app13020874
Submission received: 21 December 2022 / Revised: 3 January 2023 / Accepted: 5 January 2023 / Published: 8 January 2023
(This article belongs to the Special Issue Non-Destructive Testing of Materials and Structures)

Abstract

:
Ultrasonic pulse velocity (UPV) is a non-destructive measurement technique with which the quality of any concrete element can be evaluated. It provides information on concrete health and for assessing the need for repair in a straightforward manner. In this paper, the relationship is studied between UPV readings and the mechanical behavior of self-compacting concrete (SCC) containing coarse, fine, and/or powdery RA. To do so, correlations and simple- and multiple-regression relationships between compressive strength, modulus of elasticity, splitting tensile strength, flexural strength, and UPV readings of nine SCC mixes were assessed. The correlations showed that the relationship of UPV with any mechanical property was fundamentally monotonic. The inverse square-root model was therefore the best-fitting simple-regression model for all the mechanical properties, although for bending-tensile-behavior-related properties (splitting tensile strength and flexural strength) the estimation accuracy was much lower than for compressive-behavior-related properties (compressive strength and modulus of elasticity). Linear-combination multiple-regression models showed that the properties related to bending-tensile behavior had a minimal influence on the UPV value, and that their introduction resulted in a decreased estimation accuracy. Thus, the multiple-regression models with the best fits were those that linked the compressive-behavior-related properties to the UPV readings. This therefore enables the estimation of the modulus of elasticity when the UPV and compressive strength are known with a deviation of less than ±20% in 87% of the SCC mixes reported in other studies available in the literature.

1. Introduction

Non-destructive testing (NDT) is currently gaining greater relevance in the study of construction materials [1,2] and existing historic structures [3]. It is a type of analysis with which certain properties of concrete, such as mechanical performance [4] and reinforcement corrosion [5,6], and of other construction materials, such as masonry [7], are measured without inflicting any damage. Thus, the results of NDT can be used to estimate the current mechanical properties of construction materials, without any further damage to the component that is being tested [8], provided that their accuracy limitations are kept in mind [9]. Knowing the mechanical properties allows evaluation of the degree of damage of the tested element, which means that repair or rehabilitation can be promoted and conducted with greater success both in historical constructions [10] and in more recently built concrete structures [11,12,13]. Among the NDT procedures for concrete are the hammer rebound index, electrical resistivity, and ultrasonic pulse velocity (UPV) [14,15].
UPV has been one of the most widely used NDT techniques to evaluate the quality of in situ concrete since the mid-20th century [14]. This non-destructive measurement consists of placing two transducers on the concrete surface, between which an ultrasonic pulse is transmitted through the concrete [16]. The test result is the time that the ultrasonic pulse takes to travel from the transmitting transducer to the receiving transducer. The quotient between the separation distance of the transducers and the measured time lapse is the UPV reading [17]. The measurement of this time lapse can be done by placing the transducers in three different ways. First, there is the direct method, in which the transducers are placed on opposite sides of the concrete test sample. Second, there is the semi-direct method, in which the transducers are placed on faces of the concrete test sample, usually at an angle of 90° to each other. Finally, there is the indirect method, in which the transducers are placed on the same face of the concrete test sample. The most commonly used method is the direct method, as it provides a travel time over a known distance [18].
The value of the UPV, generally measured with the direct method, can be related to different properties of concrete [19,20]. Thus, the higher the UPV, the higher the density and the lower the porosity of the concrete, and, therefore, the better its mechanical behavior [21,22]. Although UPV has traditionally been used to estimate the modulus of elasticity of concrete, its close relationship with concrete porosity has led to studies showing its usefulness at estimating other concrete properties such as compressive strength mainly by linear simple-regression models [23,24]. In this study, the aim is to go still further, by evaluating whether an overall picture of all the mechanical properties of concrete can be obtained only through the UPV index.
Currently, various types of concrete are promoted as sustainable alternatives. One of them is recycled aggregate concrete, made with recycled aggregate (RA), widely used in the production of different sorts of concrete elements [25,26,27]. This type of aggregate is mainly produced from demolition waste and other concrete elements that have been crushed. It is largely formed of natural aggregate (NA) that constitutes crushed concrete and the mortar adhering to it [28]. Furthermore, RA contains mortar fragments in its finer fractions [29]. The main advantage of this type of concrete is that it increases sustainability and reduces NA consumption [30,31]. However, the high water absorption of RA and having less dense interfacial transition zones than ordinary concrete reduce the workability and strength of the resulting concrete [32,33,34]. Thus, it is essential to balance the sustainability and performance of concrete by defining an adequate RA content [35].
Another type of concrete whose use is also increasingly common is self-compacting concrete (SCC), which is characterized by an almost liquid-like behavior in the fresh state [36,37]. The composition of the SCC must therefore have a large amount of fine particles (limestone filler, fine aggregate), a low proportion of small-size coarse aggregate, and an adequate amount of plasticizer [37,38,39]. SCC has a number of functional advantages, such as a high-pumping capacity and optimum adaptation to any type of formwork [38]. In addition, its use also has environmental benefits, since the absence of vibration saves energy and, therefore, reduces the carbon footprint of concreting [40,41]. This type of concrete can also be manufactured with RA, and the studies conducted on its use have reached similar conclusions to the tests on conventional concrete [22,40].
There are some studies in the literature that address the NDT of SCC containing RA through the UPV. On the one hand, some studies show the statistical dependence between UPV and the mechanical behavior of this type of concrete [21,42,43]. Thus, it was found that the linear-regression relationship is adequate to predict the compressive strength from the UPV [42,43], although a more reliable estimate is obtained by complementing the UPV with another non-destructive measure such as the hammer rebound index [21]. These studies have served as a basis for the current focus on the use of algorithms that can predict the compressive strength of SCC containing RA from the composition of the concrete [44]. On the other hand, it has also been demonstrated that the UPV can be used to evaluate the durability behavior of this type of concrete and to predict its expected damage by external agents using linear simple-regression models [45]. However, further research is needed on the non-destructive evaluation of this type of concrete to ensure that SCC concrete components may be repaired or rehabilitated, which will in turn promote its usage. For this purpose, the utility of the UPV as an indicator of the overall mechanical performance of the SCC containing RA by considering multiple regression can be analyzed.
In a previous study, the authors demonstrated the validity of the hammer rebound index to obtain an overview of the mechanical behavior of SCC with RA [46]. It was found that multiple-regression fitting of the hammer rebound index as a function of compressive strength, modulus of elasticity, splitting tensile strength, and flexural strength, using standardized values for all properties, showed that the hammer rebound index can be correlated with the mean weighted average values of compressive and bending-tensile behavior. So far, the scientific literature has only shown the validity of the UPV for estimating different concrete properties through simple regression on an individual basis, as detailed throughout this introduction. Therefore, the aim in this paper, using the same SCC mixes of the previous paper of the authors [46], was to evaluate whether UPV readings can be expressed through multiple regression as a function of all the mechanical properties, so that this non-destructive measure could be used to obtain an overview of the mechanical behavior of SCC containing RA.

2. Materials and Methods

In this section, the characteristics of the raw materials and the design of SCC mixes are described. Further details can be found elsewhere [46].

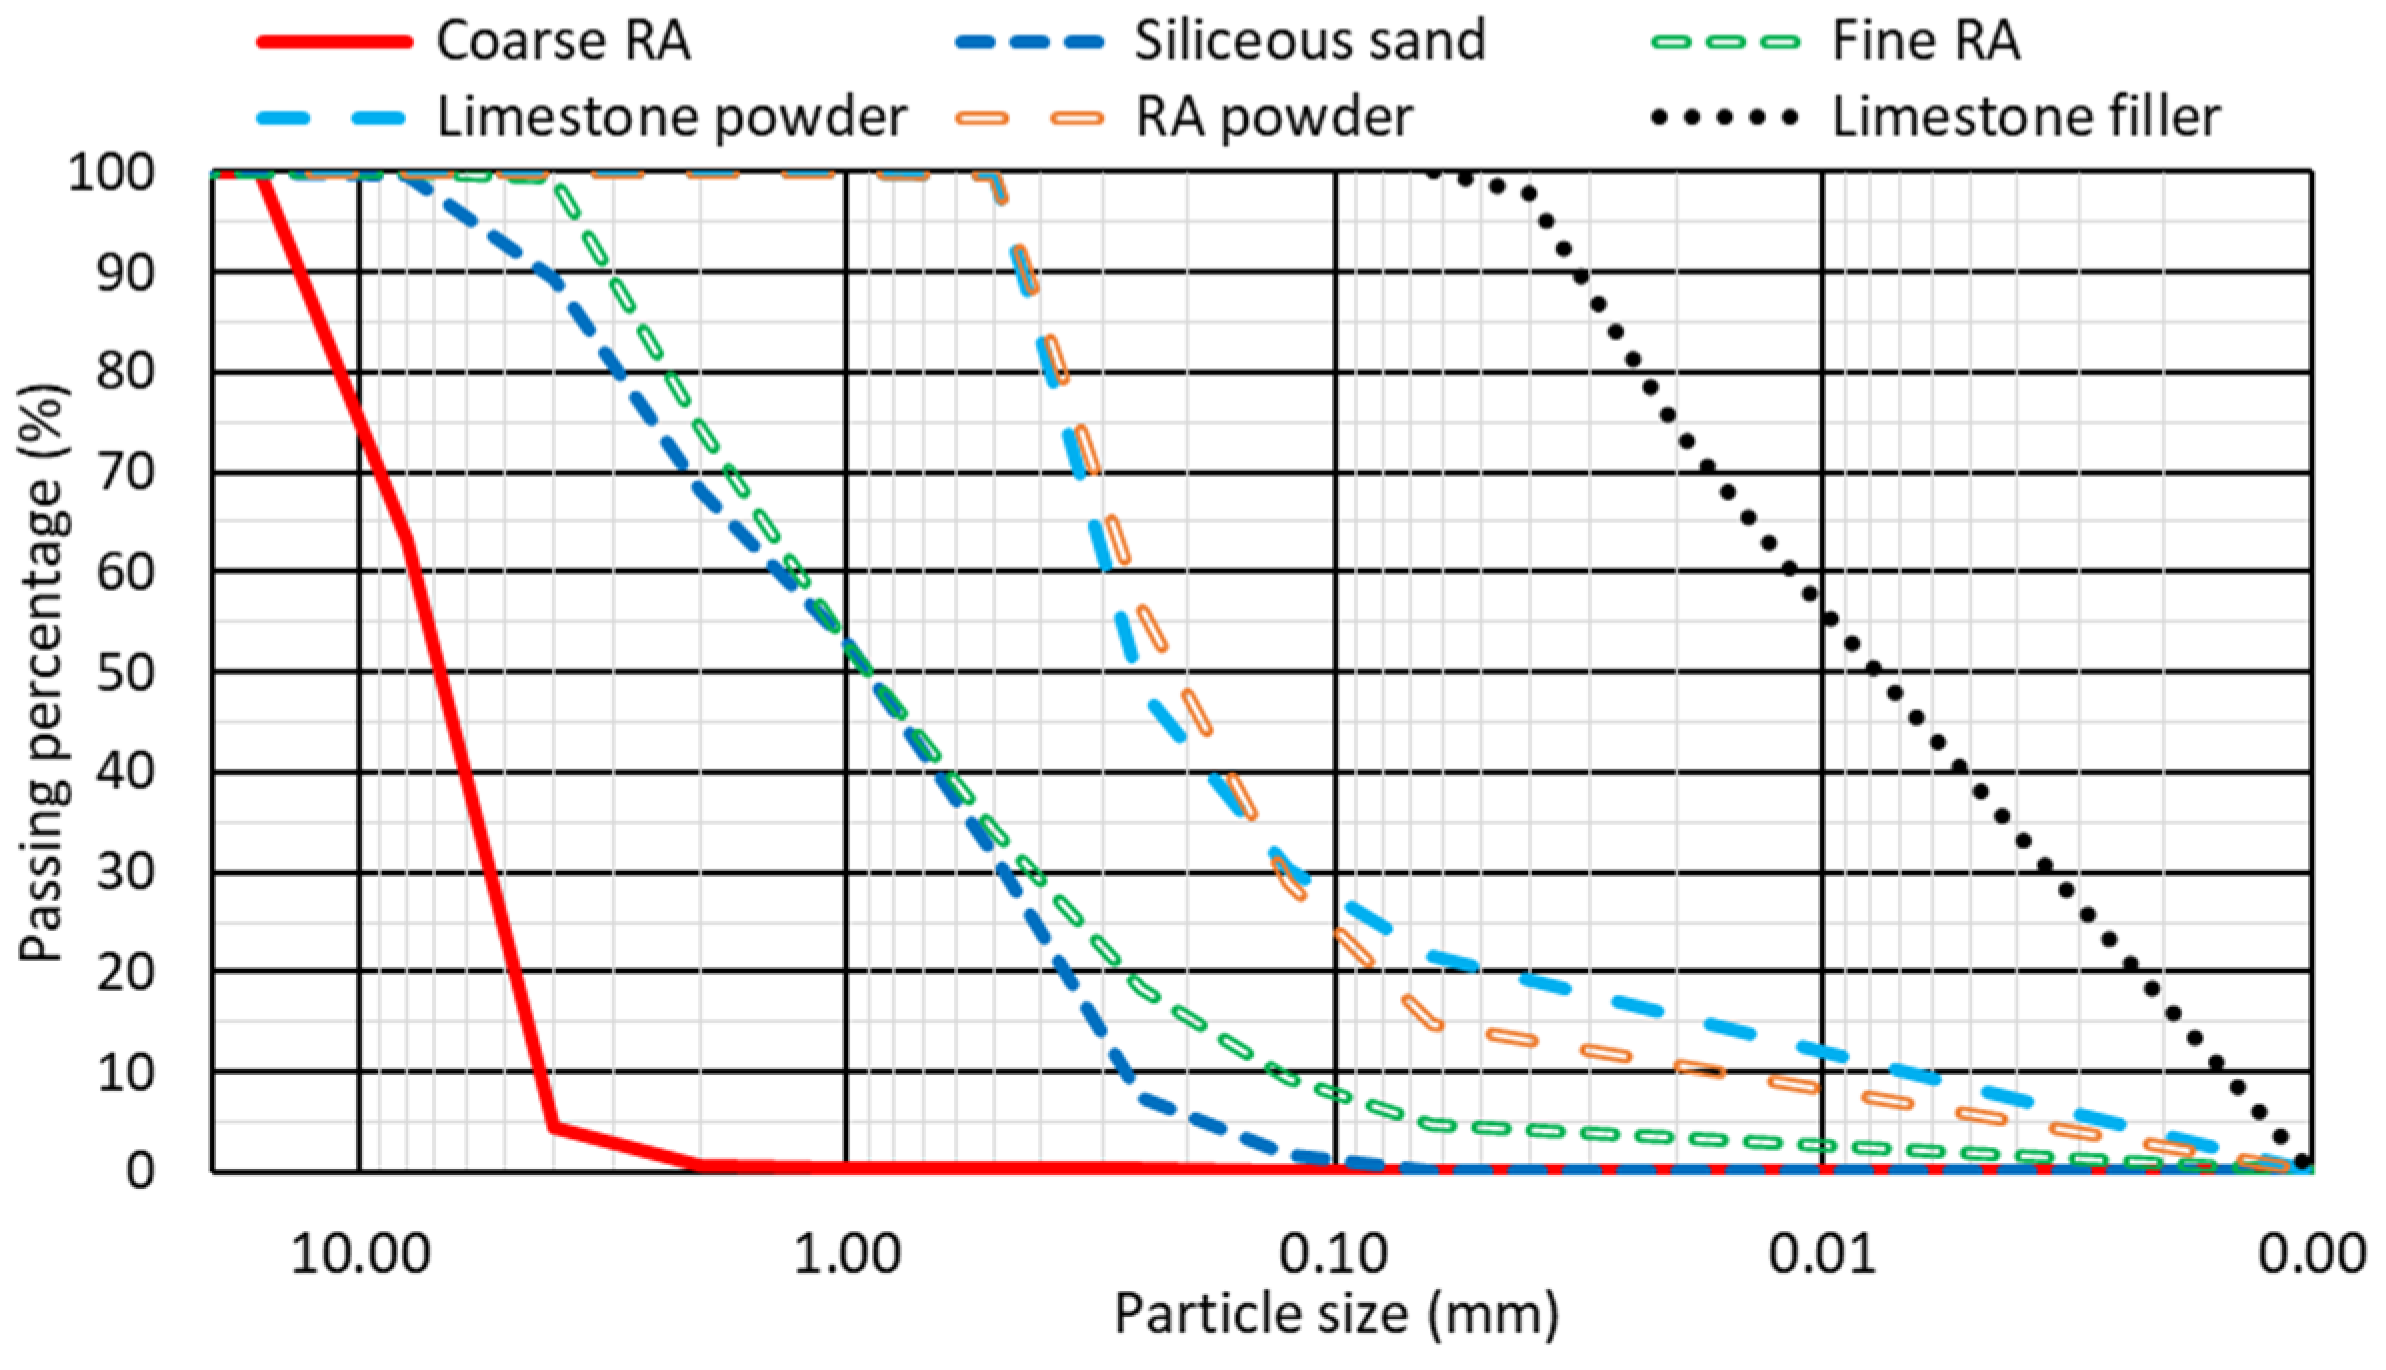
2.1. SCC Raw Materials

All the mixes were made with CEM I 52.5 R cement according to EN 197-1 [47], drinking water, a plasticizing admixture, and a viscosity regulator. The definition of a suitable proportion of both admixtures, 1.50% and 0.77% of the cement mass, respectively, promoted high levels of self-compactability to be achieved without excessively increasing the water-to-cement ratio.
Three different types of aggregate powder, the aggregate fraction responsible for providing the high amount of fine particles necessary for homogeneous dragging of the coarse-aggregate particles within the cement paste [48], were used. These three types were limestone filler <0.063 mm, limestone powder 0/0.5 mm, and RA powder 0/0.5 mm. Their particle-size distributions are represented in Figure 1, while their density and water absorption levels are shown in Table 1. The choice of these three types of aggregate powder was to evaluate the effects of aggregate-powder size and origin on SCC behavior, in addition to providing a higher number of experimental results for the statistical studies.
100% of the coarse aggregate in all SCC mixes was RA 4/12.5 mm from the crushing of rejected precast-concrete elements with a minimum age of 3 years. The fine aggregate of the mixes was composed of either natural rounded siliceous sand 0/4 mm or fine RA 0/4 mm from the crushing of the same concrete elements as the coarse fraction. Their gradation and physical properties are shown in Figure 1 and Table 1, respectively.

2.2. SCC Mix Design

A total of 9 SCC mixes were designed, which always incorporated 100% coarse RA, in order to maximize the amount of this aggregate, thus increasing the sustainability of the SCC containing RA [30]. Three mixes were designed with each aggregate powder, each incorporating a different content of fine RA by volume: 0%, 50%, and 100%. The fundamental target of the design of each mix was to achieve a slump flow between 750 mm and 850 mm (slump-flow class SF3 according to EN 206 [47]). For this purpose, the mix compositions were initially obtained from Eurocode 2 [49], after which they were empirically adapted when the nature of the aggregate powder or fine aggregate was modified:
  • All the mixes incorporated the same amount of coarse RA, cement, and admixtures.
  • The amount of water was increased when increasing the fine RA content or adding RA powder to balance their high-water absorption levels (Table 1), so that the effective water-to-cement ratio was equal to 0.40 in all mixes. The effective-water-to-cement ratio was calculated according to the 15-min water absorption levels (Table 1), as the mixing process of SCC lasted for 15 min.
  • The use of larger-sized aggregate powders (limestone powder 0/0.5 mm and RA powder 0/0.5 mm) required increased amounts of aggregate powder compared to the mixes made with limestone filler <0.063 mm, proportionally adjusting the amount of fine aggregate. This action was necessary to achieve the fine particle content for the required slump flow [38].
The composition of each mix is shown in Table 2 with the following system of labels:
  • Aggregate powder: Limestone Filler (F); Limestone powder (L); RA powder (R).
  • Percentage content of fine RA: 0% fine RA (0); 50% fine RA (50); 100% fine RA (100).

2.3. Experimental Plan

After the manufacture of the mixes, the slump-flow test EN 12350-8 [47] was performed, to verify the slump-flow class of each mix against requirements. Subsequently, 10 × 20-cm cylindrical specimens, 10 × 10 × 10-cm cubic specimens, and 7.5 × 7.5 × 27.5-cm prismatic specimens were prepared and stored in a humid chamber with 95 ± 5% humidity and a temperature of 20 ± 2 °C until they were 28 days old, at which time the experimental tests were conducted. Compressive-strength, elastic-modulus, and splitting-tensile-strength tests were performed on the cylindrical specimens as per EN 12390-3, EN 12390-13, and EN 12390-6 [47], respectively. The flexural strength was measured on prismatic specimens according to EN 12390-5 [47], while the UPV readings were taken with cubic specimens according to EN 12504-4 [47]. The mechanical properties were represented as the mean average of two determinations, while the UPV value represented the mean average of three readings, due to its greater variability [16].

3. Results and Discussion: Experimental Tests

The basic aspects of the fresh and mechanical behavior of SCC mixtures must be briefly addressed in order to gain a proper understanding of the statistical approach outlined in the following section. A much more detailed analysis of these fresh and mechanical properties is covered elsewhere [46].

3.1. Fresh Performance: Slump Flow

The slump flows of all the mixes, shown in Figure 2, were between 750 mm and 850 mm. The results met the initially established slump-flow requirement (SF3 slump-flow class), despite the 100% coarse RA incorporated in all the mixes, the angular forms of which tended to reduce concrete workability [43].
The addition of the fine fraction of RA increased the slump flow in an approximately linear way, possibly due to its higher fines content than rounded siliceous sand (Figure 1). Thus, the irregular shape of fine RA was no longer a problem, having addressed its higher water absorption in the mix design [36]. The positive effect of fine RA was not carried over to RA powder, whose use led to the lowest slump flows, some coinciding with the minimum required value of 750 mm. A plausible explanation may be that the more irregular shape and lower density of this aggregate powder in comparison with limestone aggregate powders hindered the dragging of the larger aggregate particles, thus reducing the SCC flow, as some other researchers also noted [50]. The smaller particle size of the limestone filler <0.063 mm compared to the limestone powder 0/0.5 mm also increased the slump flow of the resulting SCC.

3.2. Mechanical Performance

The mechanical properties of the nine mixes are detailed in Figure 3. It is of note that the values of the SCC containing limestone aggregate powders were adequate for structural applications, despite the use of 100% coarse RA [49].
All changes in the SCC composition affected the mechanical behavior of the mixes:
  • On the one hand, the addition of fine RA led to a decrease in all mechanical properties, with an average reduction of 30–40% when using 100% fine RA. This decrease was almost linear for the properties dependent on bending-tensile behavior (splitting tensile strength and flexural strength, Figure 3c,d). On the contrary, the decrease in compressive strength and the modulus of elasticity for a 50% fine RA content was less than expected, considering the values obtained for 100% fine RA (Figure 3a,b). It showed the mainly negative effects of small amounts of fine RA on the bending-tensile behavior of SCC, which was already worse than that of vibrated concrete, due to its higher fines content [51]. Increased porosity and weakening of the interfacial transition zones caused by the fine RA explained this worsening of the mechanical performance [22,27].
  • On the other hand, limestone powder provided the best results for strength-related properties and especially in those properties dependent on bending-tensile behavior. As found in other studies, this aggregate powder contributed to a compact and high-quality cementitious matrix [48]. The use of RA powder yielded the worst mechanical results and in the same way as fine RA, its presence explained a similar yet more pronounced strength behavior in the concrete [50,51]. Thus, a compressive strength of only 15.4 MPa was obtained when combining 100% fine RA and RA powder.

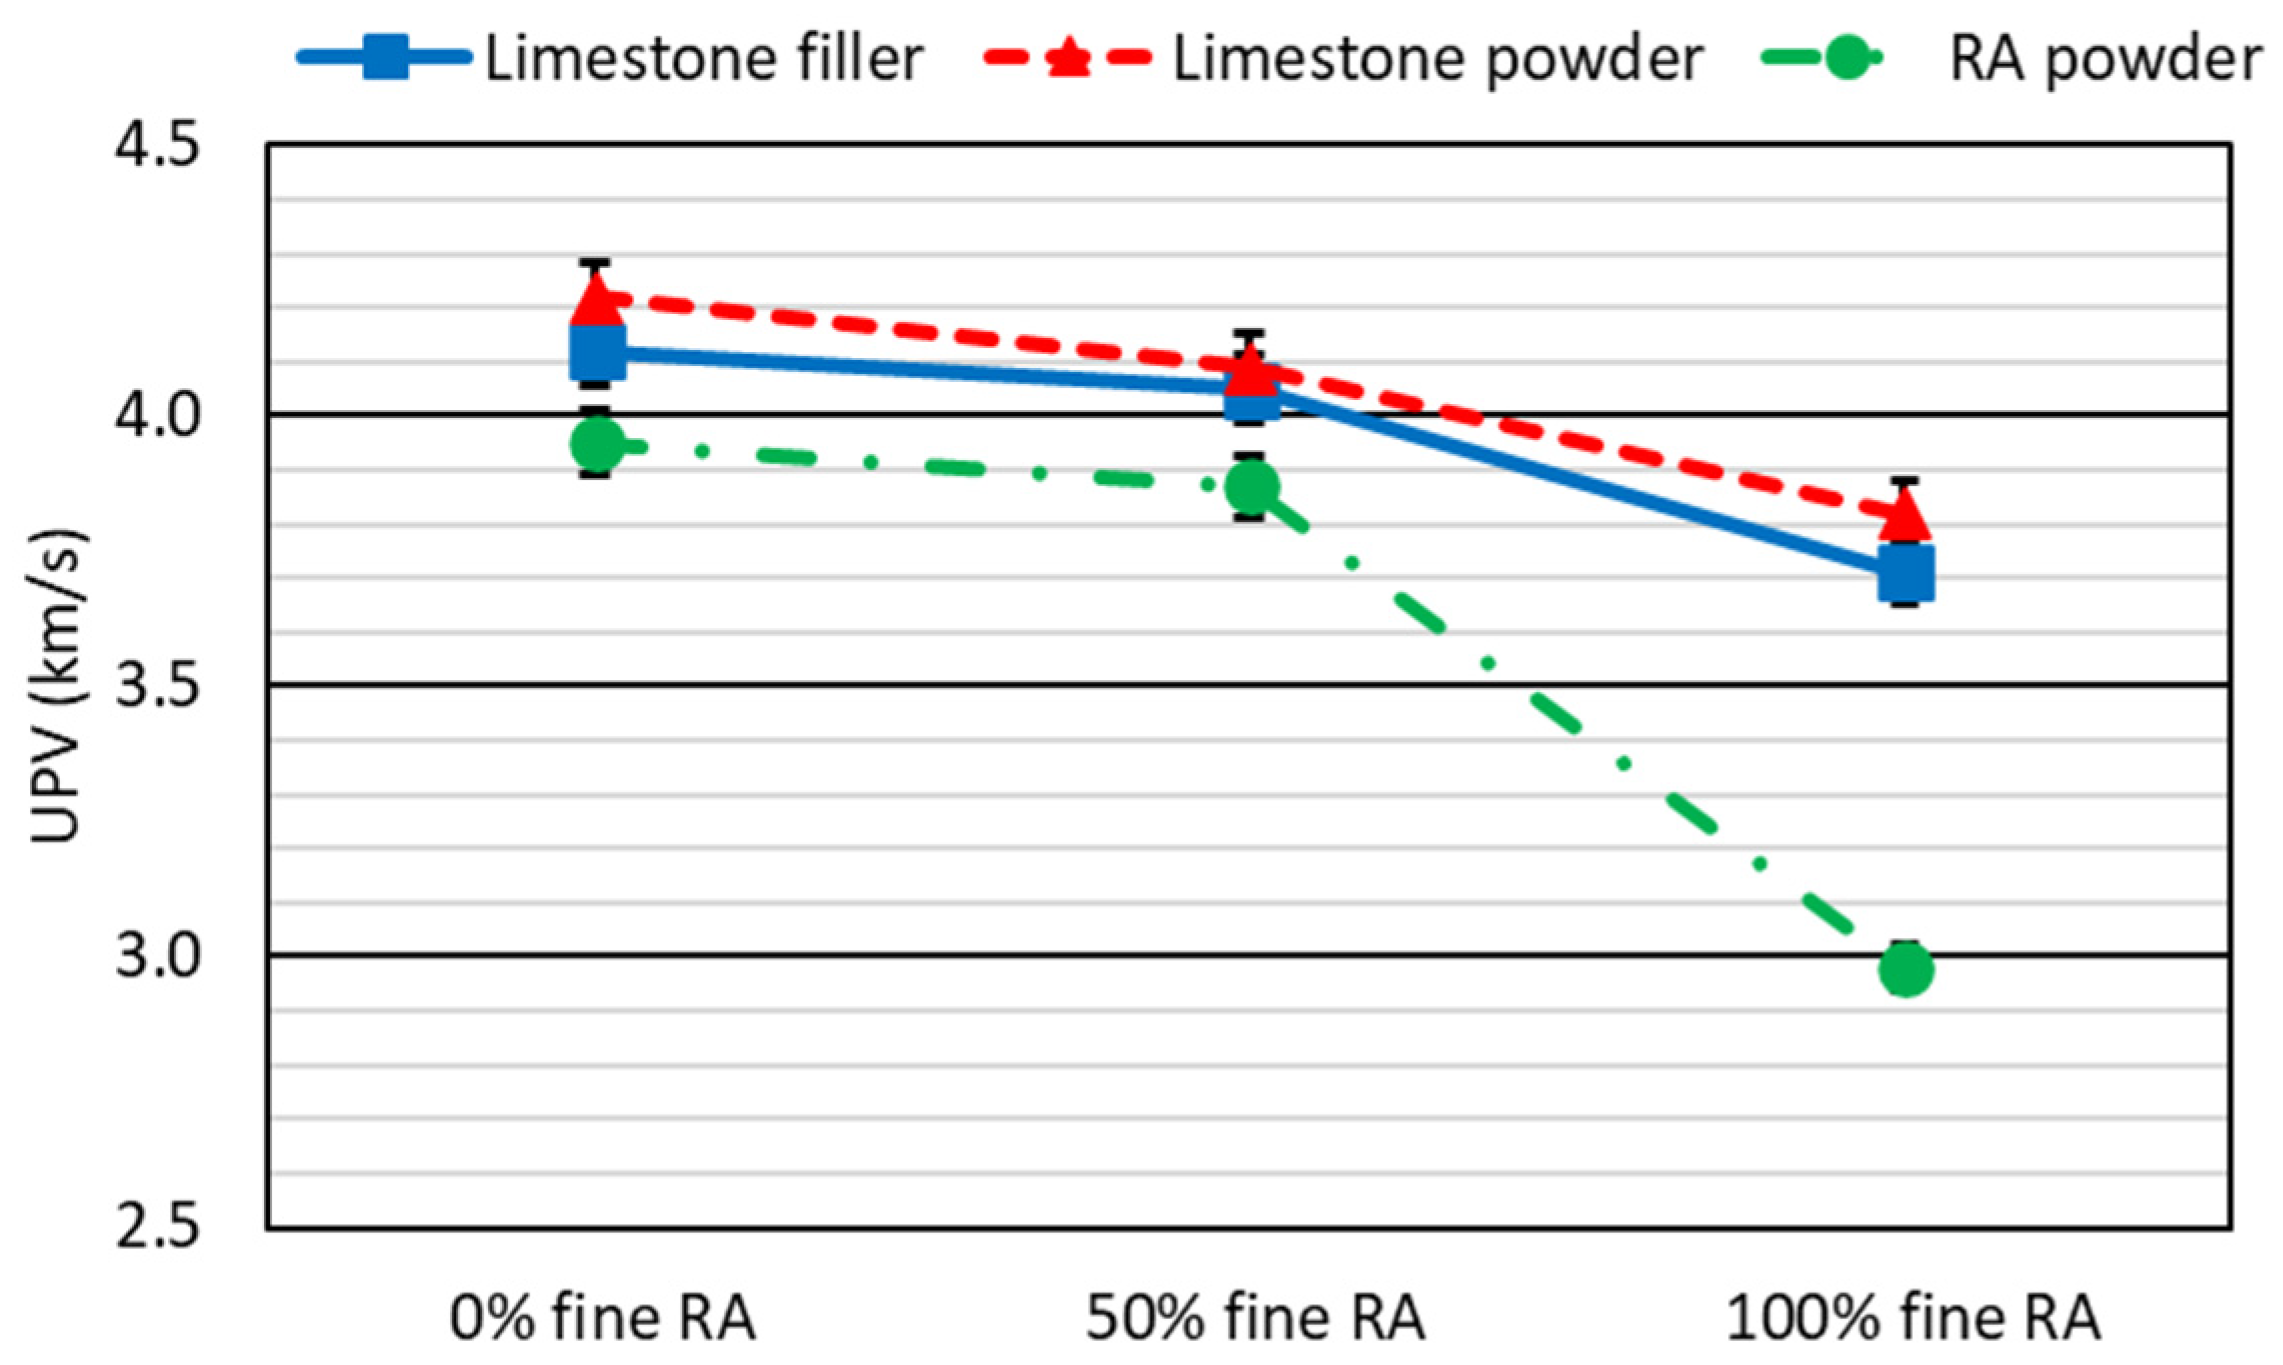
3.3. Ultrasonic Pulse Velocity (UPV)

The UPV results shown in Figure 4 reflected the same trends as the mechanical properties. This aspect is the first indicator of a relationship of statistical dependence between this NDT measure and all the mechanical properties.
The addition of fine RA led to a decrease in the UPV, due to the lower density and higher porosity of SCC after the addition of that aggregate [42], although values corresponding to a high-strength concrete were obtained in the mixes with 0% fine RA in spite of the 100% coarse RA of all the mixes. In a similar way to the mechanical properties, the UPV was higher in the mixes made with limestone powder, due to the high quality of the cementitious matrix [48], while the smallest values were obtained in the mixes made with RA power, because of the further porosity increase and density reduction it caused [50]. In fact, the use of RA powder in an SCC with 100% fine RA led to a UPV value lower than 3 km/s, corresponding to a low-strength concrete [16]. An aspect that the results of the mechanical properties such as compressive strength all confirmed (Figure 3).

4. Results and Discussion: Statistical Approach

In this section, the statistical procedure is presented to show that UPV can indeed be used to obtain a partial overview of the mechanical performance of concrete and, more specifically, SCC containing RA. The reasoning behind using both the UPV and the hammer-rebound tests is very similar [46].

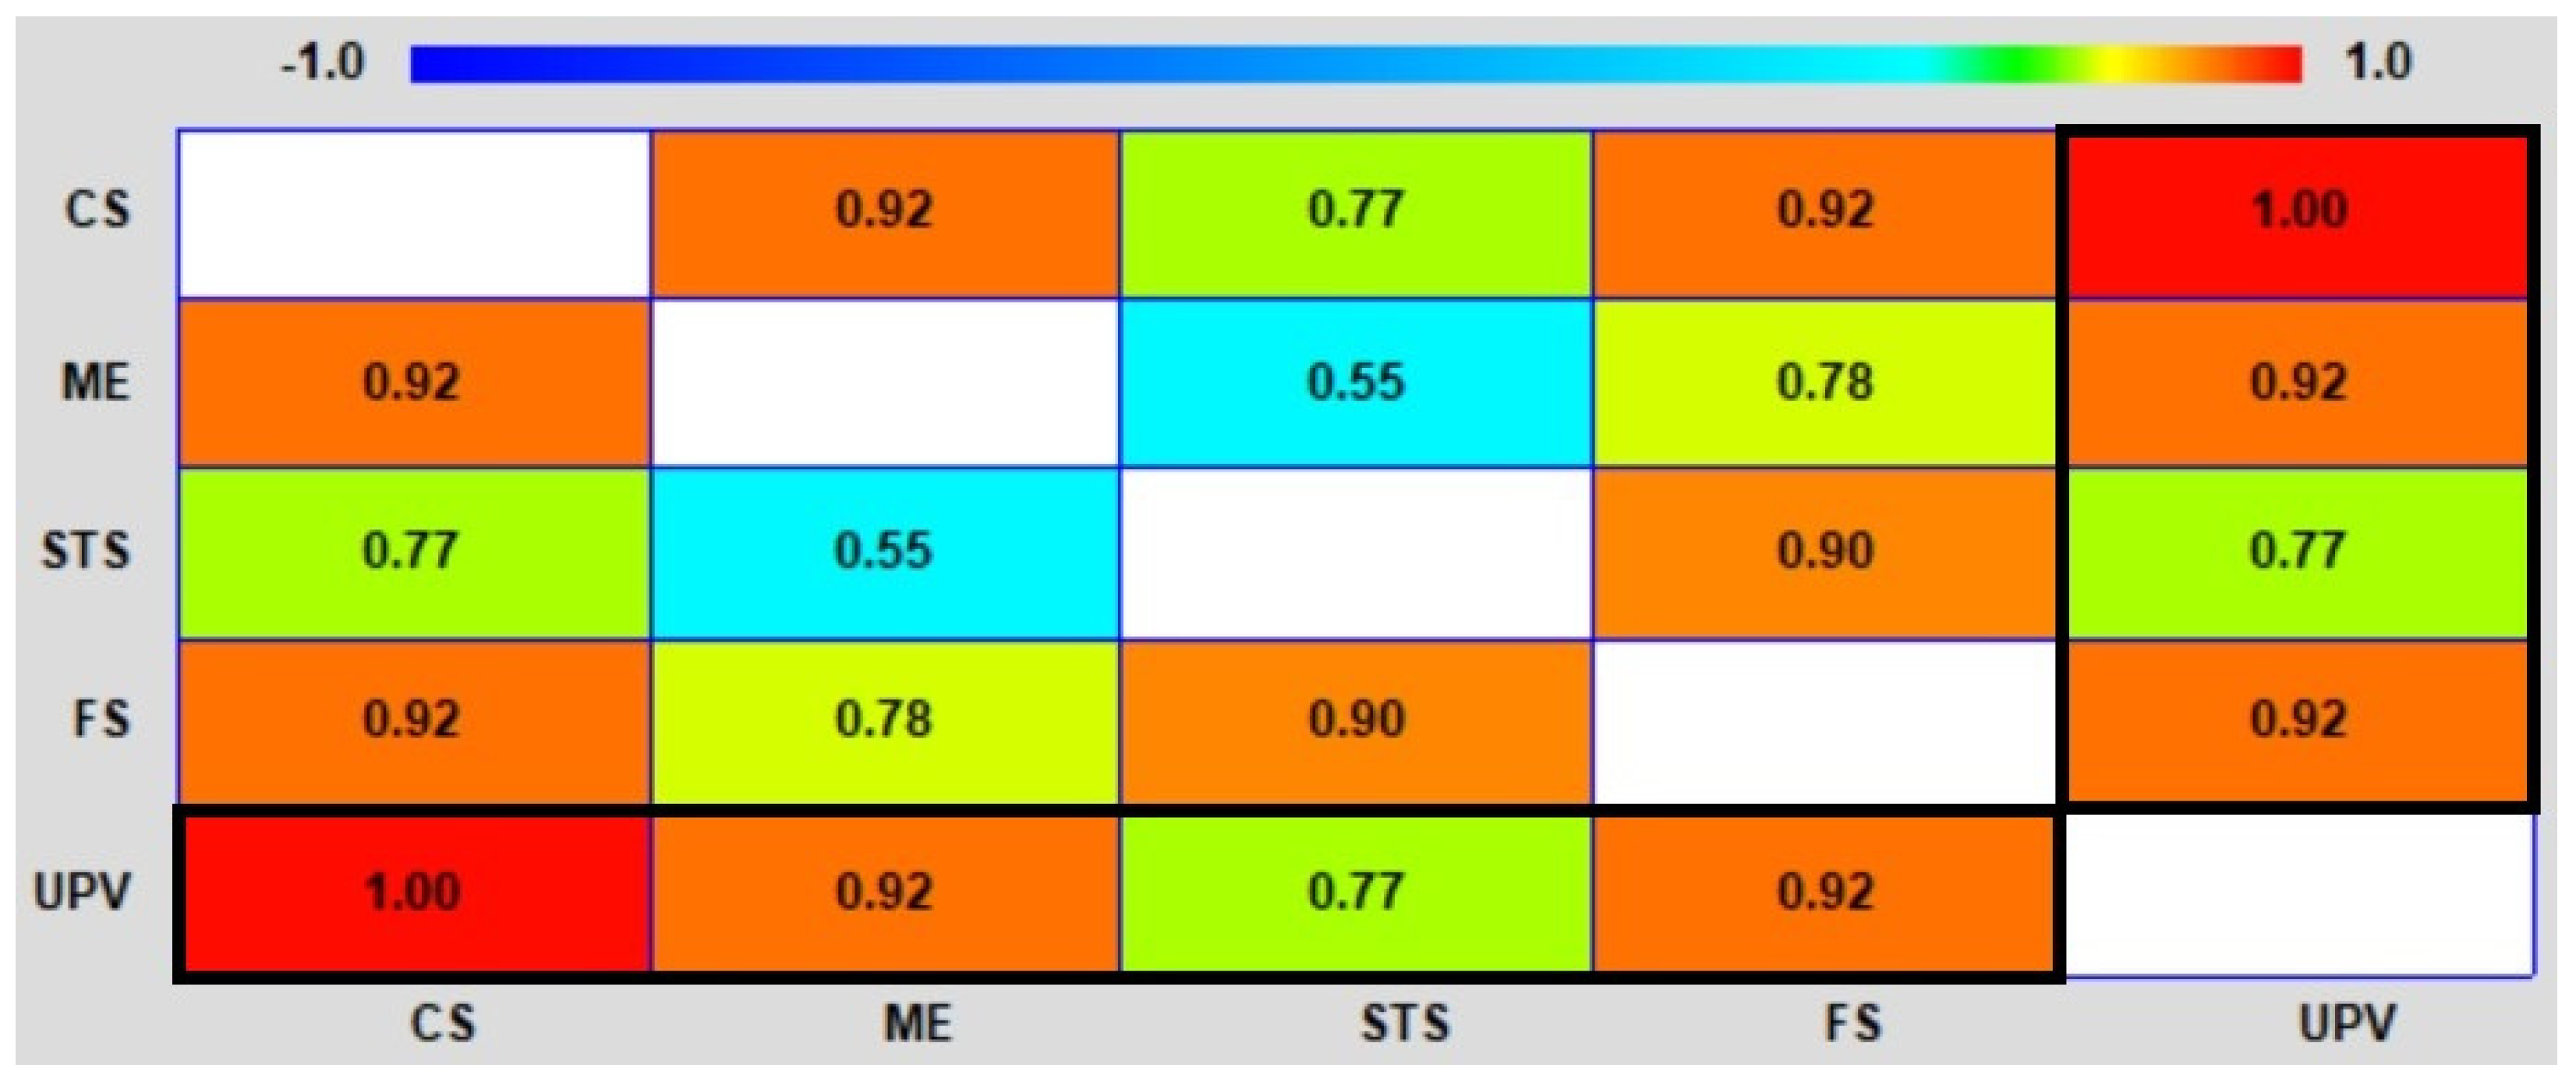
4.1. Correlation Analysis

The first step in assessing whether there is a precise relationship between the UPV readings and each mechanical property is to perform a correlation analysis of the data [52,53]. In this case, the Pearson correlation coefficient, which indicates whether there is a linear correlation, and the Spearman correlation coefficient, which reflects the existence of monotonic correlations, are shown in Figure 5 and Figure 6, respectively (compressive strength (CS); modulus of elasticity (ME); splitting tensile strength (STS); flexural strength (FS); ultrasonic pulse velocity (UPV)). Both were calculated at a 95% confidence level.
As shown in both figures, there was a strong correlation between UPV and all the mechanical properties with values above 0.70 in all cases. Its positive sign indicated that an increase in any mechanical property led to an increase in the UPV index, as is usual in concrete [14]. The highest correlation was obtained for compressive strength (Pearson correlation of 0.94 and Spearman correlation of 1.00), which showed that UPV is fundamentally related to compressive strength in these types of concrete mixes. It did not follow the usual pattern, as UPV is a property that has usually been linked to the elastic stiffness of concrete [16]. All other mechanical properties showed a similar Pearson correlation with the UPV index, at around 0.75–0.80. However, the Spearman correlations were equal to 0.92 for both modulus of elasticity and flexural strength, although the Spearman correlation was only 0.77 for splitting tensile strength. Thus, in general terms, it can be stated that the UPV index was less strongly related to the tensile-related mechanical properties than to the mechanical properties dependent on the compressive behavior of concrete, including flexural strength. It is important to note that flexural strength is influenced by both the tensile and the compressive strength of concrete [49].
Comparing both types of correlations shown above, it can be seen that the Spearman correlation values were always higher. A result that points to a monotonic relation between the UPV readings and the mechanical properties, so that, although the linear relation was adequate, the most accurate relation between the UPV readings and every mechanical property was potential. The greatest difference in the value of both correlations was obtained for the modulus of elasticity and flexural strength, each of which showed a particularly noticeable difference in accuracy between the linear and the monotonic relationship.

4.2. Simple-Regression Analysis

The simplest type of statistical model to establish a relationship between two variables is a simple-regression model, which evaluates whether one variable can be estimated from another. The final objective of this study was to determine whether the UPV result can be expressed as a function in which all the mechanical properties are reflected. In a first approach to the analysis of this aspect, a simple-regression analysis was therefore conducted, so as to study whether a UPV reading could be expressed as a function that is dependent on the value of each mechanical property considered individually.
In this simple-regression analysis, the R2 coefficients of all the conventional simple-regression models were analyzed, yielding the result that the most accurate (higher coefficient R2) simple-regression model for all the mechanical properties was an inverse square-root model, as shown in Equation (1) (UPV is ultrasonic pulse velocity, in km/s; MP is each mechanical property, all in MPa units except the modulus of elasticity in GPa; a and b are adjustment coefficients). The adjustment coefficients and coefficient R2 for each mechanical property are detailed in Table 3. The coefficients R2 for the linear models are also provided.
U P V = a b M P
The coefficients R2, confirmed the above-mentioned aspects related to the correlations. On the one hand, the Spearman correlations were higher than the Pearson correlations, so a potential model, in this case an inverse square-root model, had a higher R2 coefficient than the linear model. Therefore, the inverse square-root model was more accurate than the linear model for estimating the UPV through the mechanical properties. On the other hand, it can also be noted that while the coefficient R2 for the square-root inverse model was very high, above 90%, for compressive strength and modulus of elasticity, it was much lower, around 65–70%, for splitting tensile strength and flexural strength, properties related to the bending-tensile behavior of concrete. This aspect was already observed in the correlations, which were lower for the bending-tensile-behavior-related properties.
Based on these results, it can be stated that the UPV readings can indeed be expressed as a function of each mechanical property, which is an especially accurate relationship for the mechanical properties linked to compressive behavior. Therefore, the formula resulting from expressing the UPV as a function of the four mechanical properties will most likely depend more on the compressive strength and modulus of elasticity to achieve a higher accuracy.

4.3. Multiple-Regression Analysis

Bearing in mind the aspects discussed in the previous sections, the procedure for obtaining an expression that simultaneously links the UPV readings with all the mechanical properties is addressed in this section. First, the standardization of the variables is presented, and then the multiple-regression model is approached.

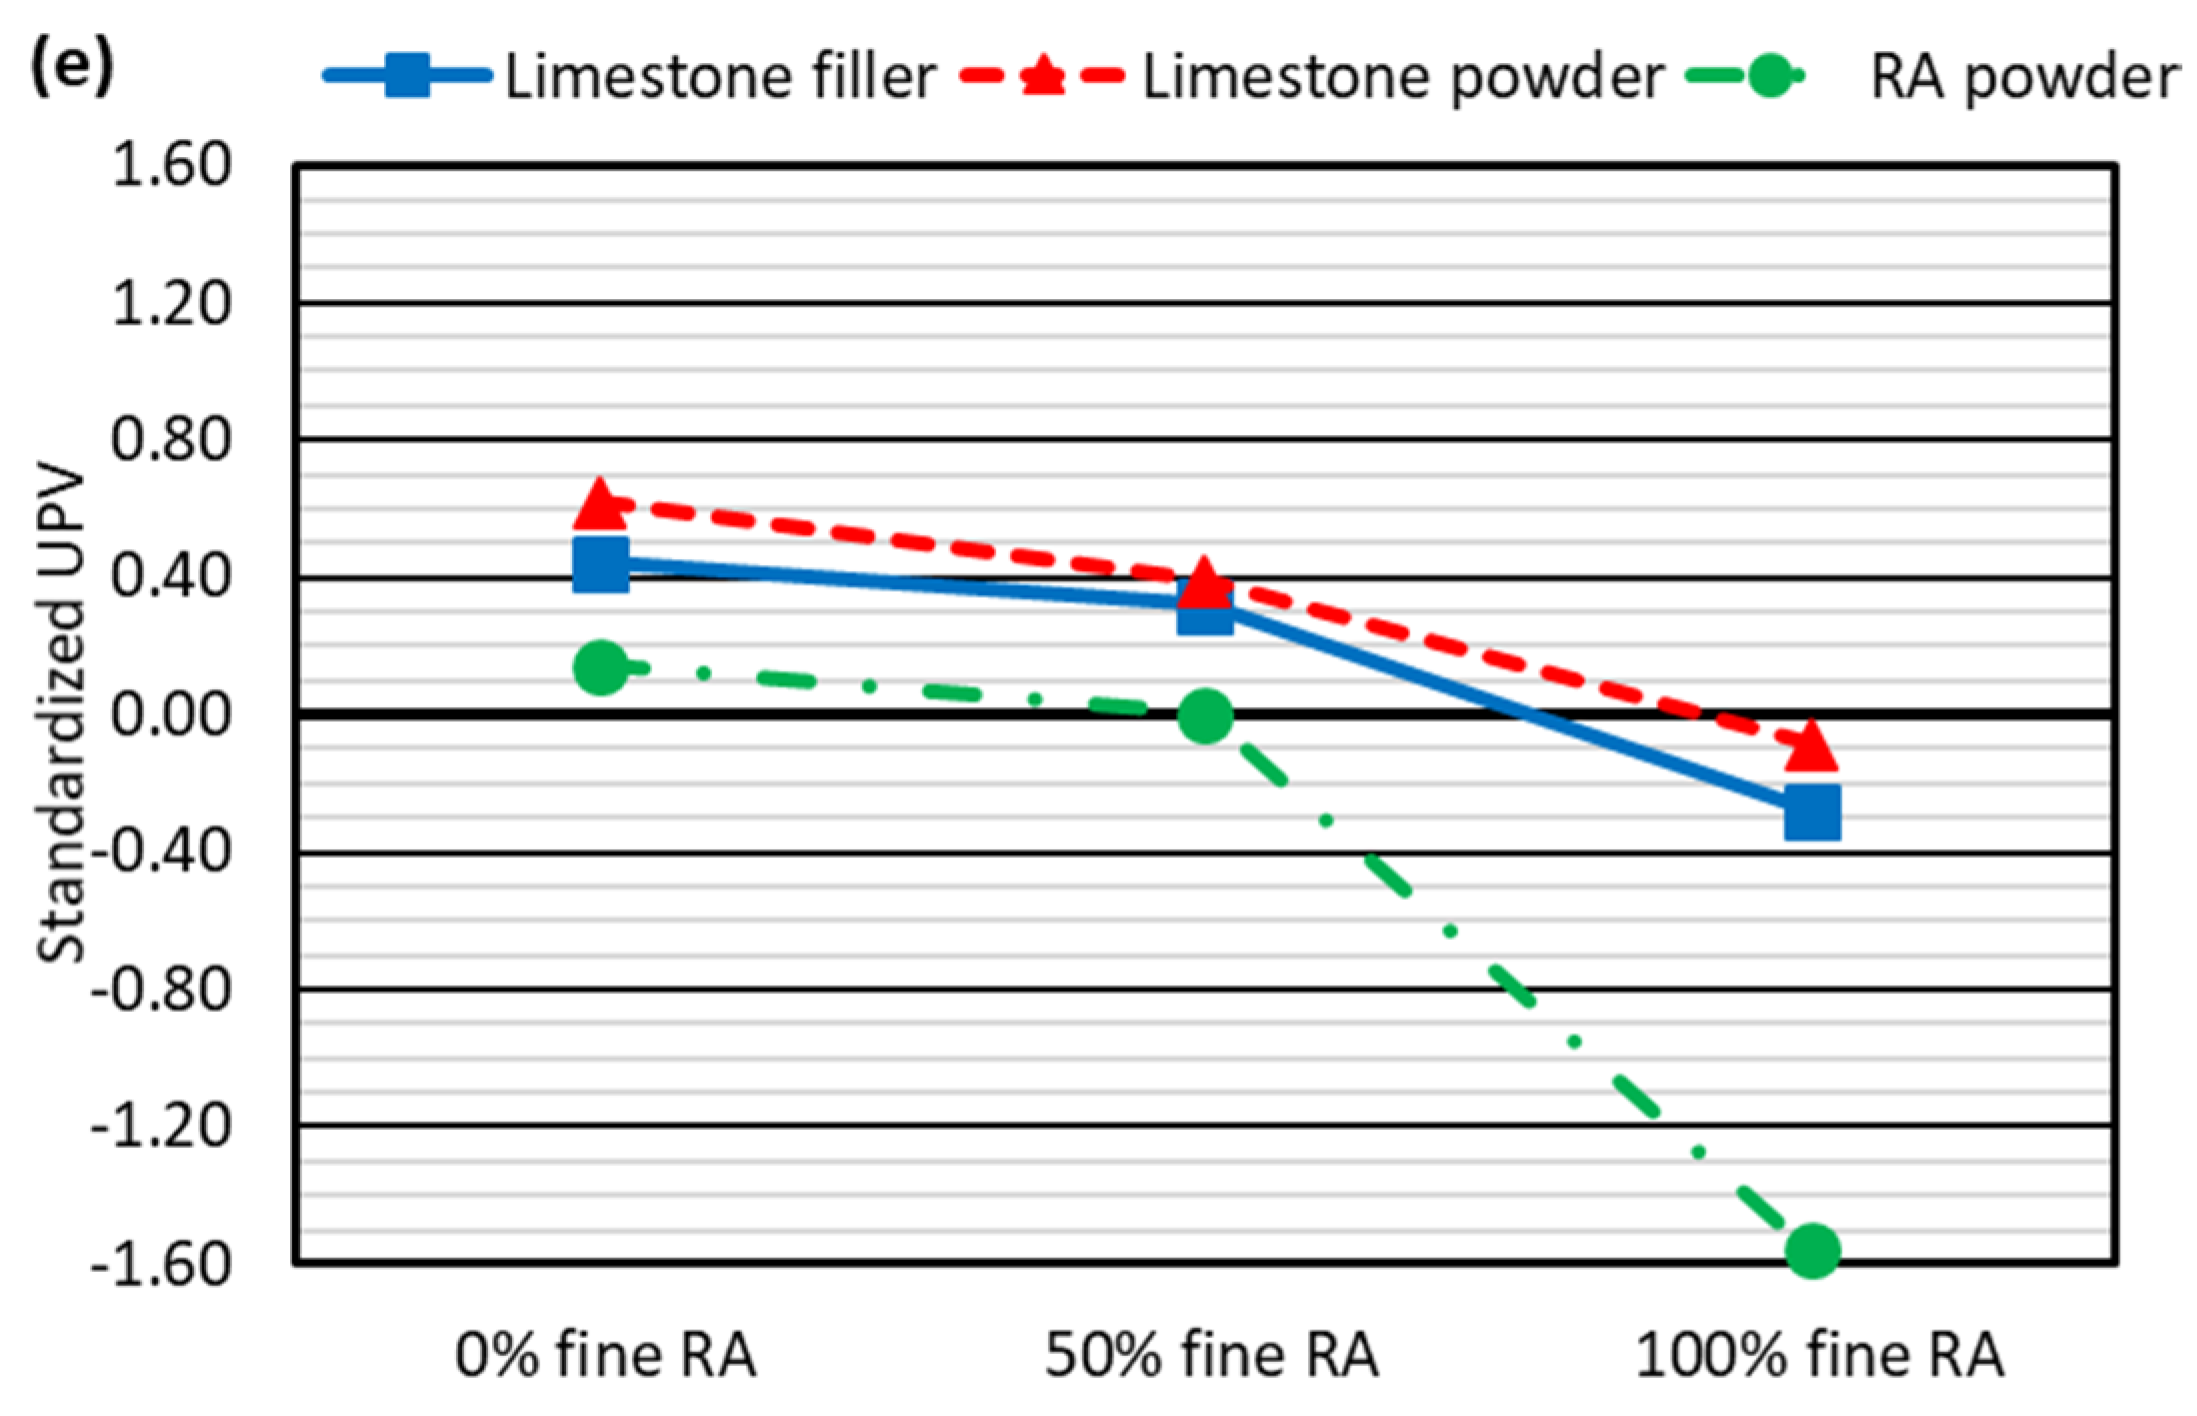
4.3.1. Standardization

In multiple-regression modeling, a variable is expressed as a function of the values of a set of variables. In this case, the aim is to express the UPV readings as a function that is dependent on a set of mechanical properties. If the real values of the mechanical properties and the UPV readings are used, then the function will not only be influenced by the statistical relation between the UPV readings and the mechanical properties, but also by their values, since all these properties are not expressed on comparable scales, so the values will also influence the estimates [43]. This aspect is reflected by the simple example of a flexural strength of 7 MPa, that is a high value, while a compressive strength of 7 MPa is a very low value, although the value of both mechanical properties is the same, which is because the scales of both mechanical properties are not comparable. This difference in the scales affects the estimation by multiple regression, and the importance of each mechanical property in the value of the UPV is not shown in the expression, otherwise the value of each one would influence the final result.
Before developing the multiple-regression models, both the UPV and the mechanical properties were standardized to address the above-mentioned problem of non-comparable scales. Thus, units were eliminated, obtaining dimensionless values in the interval (−2, 2) for both UPV and mechanical properties, and all properties were therefore expressed in values comparable to each other [54,55]. Standardization was performed according to Equation (2) (XS is the standardized property; Xexp is experimental value of the property to be standardized, in its corresponding units (MPa, GPa, or km/s); Xm is the arithmetic mean of the values of the property to be standardized for all SCC mixes, in its corresponding units; Xmax is the upper limit of the 95% confidence interval of the values of the property to be standardized for all SCC mixes, in its corresponding units; and Xmin is the lower limit of the 95% confidence interval of the values of the property to be standardized for all SCC mixes, in its corresponding units). These values for each property, obtained from the experimental results shown in Section 3, are detailed in Table 4.
X S = X e x p X m X m a x X m i n
The standardization procedure, in addition to making all the properties comparable with each other and enabling the use of multiple-regression models, defines two aspects of the properties to be known simply on the basis of their values. On the one hand, the sign can be used to determine whether a property for any mix is higher (positive sign) or lower (negative sign) than the arithmetic mean of the values of this property for all the SCC mixes, which are shown in Table 4. On the other hand, its value informs us that if that mechanical property for any mixture is within the 95% confidence interval obtained for the values of that property for all the SCC mixes (Table 4), then the standardized value must be between −0.50 and 0.50. In summary:
  • A standardized value between 0.00 and 0.50 indicates that the property is above the mean and within the confidence interval.
  • A value greater than 0.50 shows that the property is above the upper limit of the confidence interval.
  • A value between −0.50 and 0.00 indicates that the property is below the mean, but within the 95% confidence interval.
  • A value below −0.50 shows that the property is below the lower limit of the 95% confidence interval.
Figure 7 shows the standardized value of all the experimental values of the mechanical properties and the UPV. From this figure, the following aspects can be noted:
  • The compressive-behavior-related mechanical properties (compressive strength and modulus of elasticity), as well as the UPV of the mixes made with up to 50% fine RA and limestone (both types) presented values that were in general higher than the mean value (standardized values over zero).
  • The mixtures with limestone and fine natural aggregates (0% RA) were the ones that exceeded the upper limit of the 95% confidence interval (standardized values over 0.5).
  • The standardized values for those mixes made with 100% fine RA were lower than the mean value and the lower limit of the 95% confidence interval (standardized values under −0.5).
  • For the properties related to bending-tensile behavior (splitting tensile strength and flexural strength), only limestone powder 0/0.5 mm led to properties above the mean value in all cases (positive standardized values).
  • The use of RA powder together with 0% fine RA led to standardized values very close to 0.00 for all the properties that were studied, which caused the increase in fine RA content to yield values that were clearly below the mean. Furthermore, when 100% fine RA was added, they were clearly below the 95% confidence interval (standardized values under −0.5).
Despite the advantages of standardization, it generally only supports the development of linear regression models. When a simple-regression analysis of the UPV as a function of each mechanical property was separately undertaken, it was found that the only conventional model that could be fitted was the linear model shown in Equation (3) (UPVS is the standardized dimensionless value of the UPV reading; MPs is the standardized, dimensionless value of the mechanical property; a is the adjustment coefficient). The adjustment coefficients and R2 coefficients for each mechanical property are detailed in Table 5. In line with the aspects addressed in previous sections, the fit was much better than with the mechanical properties related to compressive behavior. Linear multiple-regression models were therefore developed.
U P V S = a × M P S

4.3.2. Model Development

Based on all the aspects discussed above, a linear multiple-regression model was proposed in which the UPV was expressed as a linear combination of all the mechanical properties, as shown in Equation (4) (UPVS is the standardized UPV value; CSS is the standardized compressive strength; MES is the standardized modulus of elasticity; STSS is the standardized splitting tensile strength; and FSs is the standardized flexural strength). In this model, which presented a high accuracy (coefficient R2 of 89.84%), it was found that, taking into account the sign, the sum of the coefficients of the mechanical properties was around 1. Thus, it could be stated that the use of standardized properties means that the percentage part of the UPV value that each mechanical property represents can be determined. In line with the above, the following two aspects stand out:
  • On the one hand, two mechanical properties had a negative sign, i.e., a negative contribution to the UPV value. One of these properties was the modulus of elasticity, which offset the value of compressive strength. The other one was flexural strength, which counteracted the value of splitting tensile strength. As a result, it can be affirmed that the UPV value is a weighting of the mean of the properties related to compressive behavior, compressive strength, and modulus of elasticity, and of the mean of the properties related to bending-tensile behavior, which are splitting tensile strength and flexural strength.
  • On the other hand, the weight of splitting tensile strength and flexural strength, properties related to bending-tensile behavior, had a negligible weight compared to the properties related to compressive behavior; results that are in line with the correlations and the accuracy of the simple-regression models presented in previous sections.
    U P V S = 1.269 × C S S 0.330 × M E S + 0.012 × S T S S 0.053 × F S S
The problem of the negative signs, which prevents a precise weighting of the UPV readings as a function of the mechanical properties, was addressed through a linear multiple-regression model. The model depended on the arithmetic mean of the properties related to compressive behavior (compressive strength and modulus of elasticity) and the mean of the properties related to bending-tensile behavior (splitting tensile strength and flexural strength). In Equation (5), it can be seen that the mean compressive behavior explained approximately 75% of the UPV value while the mean bending-tensile behavior represented approximately 25%. A similar result to the one in a previous study on the hammer rebound index [46], achieving an increase in the weight of the properties related to bending-tensile behavior compared to Equation (4). However, the coefficient R2 of this model was only 78.69%, which meant a notable loss of accuracy compared to Equation (4). It is clear that trying to obtain an expression with a simple physical application involving all the mechanical properties implied a low estimation accuracy.
U P V S = 0.725 × ( C S S + M E S 2 ) + 0.240 × ( S T S S + F S S 2 )
In view of the above discussion, it became clear that UPV was only slightly related to the properties linked to bending-tensile behavior. In fact, their relevance in the estimation was low and their forced introduction led to an appreciable decrease in the estimation accuracy. It was therefore decided to work with no other values than compressive strength and modulus of elasticity, properties mainly related to compressive behavior, which showed a very strong relationship with the UPV readings, both from the correlation approach, and in terms of simple regression. Thus, reconstructing the linear combination model, but only considering those two mechanical properties, yielded Equation (6), which had a coefficient R2 of 89.80%. If the weights of this model are analyzed, it can be noted that they were practically identical to those obtained in Equation (4), which showed that the properties related to bending-tensile behavior were hardly relevant in the statistical approach.
U P V S = 1.246 × C S S 0.344 × M E S
Similarly, it was decided to work with the mean value of the compressive-behavior-related properties to eliminate the effect of the signs, resulting in Equation (7). This model presented a very similar coefficient R2 to the previous one, underlining that the mean value of the properties related to compressive behavior explained around 90% of the value of the UPV. Since the introduction of the properties related to bending-tensile behavior had reduced the precision of the estimation, the remaining 10% of the UPV value can be explained in terms of the experimental variability of the UPV itself, rather than in terms of these properties, which is known to be very large, as shown in other studies [16,24].
U P V S = 0.894 × ( C S S + M E S 2 )

4.3.3. Model Applicability and Utility

The utility of both Equations (6) and (7) is clearly to estimate either the compressive strength or the modulus of elasticity, when the other mechanical property is known by a UPV reading. The known mechanical property can be determined in two different ways: it could be experimentally measured or it could be determined through the UPV using existing models [21]. In this last option, the compressive behavior of concrete can be completely evaluated by measuring only the UPV, so that through this NDT measurement, one mechanical property is first determined by means of models already available in the literature [21] and then the other mechanical property is calculated by applying the models developed in this article. Table 6 shows an example application of Equations (6) and (7), considering that the compressive strength of mix L0 is known, and its modulus of elasticity is to be calculated, for which reason the UPV index of this SCC mix was determined.
It was found that the estimations of the modulus of elasticity using both models were adequate, with a difference between the experimental value and the estimated value of about 1 GPa. The modulus of elasticity determined by applying Equation (6) was slightly more accurate, since in the development of this model both compressive strength and modulus of elasticity were individually considered. The introduction of the mean value of both properties for the development of Equation (7) led to a small loss of accuracy that was reflected in the estimation of the modulus of elasticity shown in Table 6. The aspects discussed in the previous section mean that the use of the UPV index is not advisable for estimating the properties related to bending-tensile behavior.

4.3.4. Analysis of Other Studies: Validation

Final verification of the validity of the model for estimating the modulus of elasticity of the SCC containing RA when the compressive strength and the UPV index were known was conducted through the few other studies found in the literature that measured these three concrete properties [56,57]. Equation (6) was considered, as it provided the most accurate estimates of the mechanical properties of the SCC mixes from which the models were developed (Table 6).
It was found that the modulus of elasticity could be estimated in 87% of the mixes with mechanical properties within the range of the mixes used to develop the model, with a deviation of less than ±20%, while the deviation was less than ±10% in 47% of the cases (Figure 8). When the modulus of elasticity was not correctly estimated, it was mainly due to unusual values of the compressive strength or the UPV. In those cases, higher values were obtained for the compressive strength and/or the UPV than those expected according to the trends of the mixtures through which the models were developed. The obtained results underline the utility of the model and its accurate predictions on the basis of UPV readings of two mechanical properties (modulus of elasticity and compressive strength) related to the compressive behavior of SCC containing RA.

5. Conclusions

In this paper, the validity of an overall assessment of the mechanical behavior of self-compacting concrete (SCC) with recycled aggregate (RA) on the basis of ultrasonic pulse velocity (UPV) readings was analyzed. To do so, the statistical relationships between four mechanical properties (compressive strength, modulus of elasticity, splitting tensile strength, and flexural strength) and the UPV of nine different SCC mixes made with coarse, fine and/or powdery RA were evaluated. The statistical tools used in this analysis were correlations, simple regression, and multiple regression, which led to the following conclusions:
  • UPV was strongly correlated with all the mechanical properties, although the mechanical properties related to compressive behavior (compressive strength and modulus of elasticity) presented a higher correlation. The dependence of UPV on mechanical properties was fundamentally monotonic.
  • In line with the correlation analysis, the best-fitting simple-regression model for all mechanical properties was an inverse square-root model (potential model). However, the estimation accuracy obtained for splitting tensile strength and flexural strength was lower than those for compressive strength and modulus of elasticity.
  • The mechanical properties related to bending-tensile behavior (splitting tensile strength and flexural strength) had practically no percentage influence on the UPV value when developing linear-combination multiple-regression models through standardized properties. Furthermore, their forced introduction reduced the estimation accuracy. Therefore, the development of multiple-regression models that linked UPV readings with splitting tensile strength and flexural strength was not adequate.
  • Relating UPV readings, compressive strength, and modulus of elasticity values of SCC containing RA was feasible through multiple regression, either through individual treatment of each mechanical property (Equation (6)) or as the mean value of compressive behavior (Equation (7)). Thus, both mechanical properties can be estimated from the UPV readings when one of them is known.
The test results reported in this paper have shown the utility of UPV readings for estimating compressive strength and modulus of elasticity values of SCC containing RA. Thus, it has been shown that this non-destructive measurement can be useful, not only in the evaluation of conventional vibrated concrete, but also for the evaluation of sustainable concretes containing RA.

Author Contributions

Conceptualization, A.B.E., V.R.-C., M.S. and V.O.-L.; methodology, A.B.E. and V.R.-C.; software, V.R.-C.; validation, M.S., F.F. and V.O.-L.; formal analysis, A.B.E. and V.R.-C.; investigation, A.B.E., M.S. and V.R.-C.; resources, F.F. and V.O.-L.; data curation, A.B.E. and V.R.-C.; writing—original draft preparation, A.B.E. and V.R.-C.; writing—review and editing, M.S., F.F. and V.O.-L.; visualization, M.S., F.F. and V.O.-L.; supervision, M.S., F.F. and V.O.-L.; project administration, M.S., F.F. and V.O.-L.; funding acquisition, M.S., F.F. and V.O.-L. All authors have read and agreed to the published version of the manuscript.

Funding

This research was funded by the Spanish Ministry of Universities, MICIN, AEI, EU, ERDF, and NextGenerationEU/PRTR, grant numbers PID2020-113837RB-I00, 10.13039/501100011033, and TED2021-129715B-I00; the Junta de Castilla y León (Regional Government) and ERDF, grant number UIC-231; and the University of Burgos, grant numbers SUCONS, Y135.GI.

Institutional Review Board Statement

Not applicable.

Informed Consent Statement

Not applicable.

Data Availability Statement

The data presented in this study are available on request from the corresponding author. All the data used in this study are shown in the paper.

Conflicts of Interest

The authors declare no conflict of interest.

References

  1. Chen, H.; Nie, X.; Gan, S.; Zhao, Y.; Qiu, H. Interfacial imperfection detection for steel-concrete composite structures using NDT techniques: A state-of-the-art review. Eng. Struct. 2021, 245, 112778. [Google Scholar] [CrossRef]
  2. Yumnam, M.; Gupta, H.; Ghosh, D.; Jaganathan, J. Inspection of concrete structures externally reinforced with FRP composites using active infrared thermography: A review. Constr. Build. Mater. 2021, 310, 125265. [Google Scholar] [CrossRef]
  3. Colla, C.; Grüner, F.; Dieruf, B. SMOOHS, Smart Monitoring of Historic Structures. D5.1-Part1: Report on Test Methods and Former Test Results; MPA Universität Stuttgart: Stuttgart, Germany, 2010. [Google Scholar]
  4. Varzaneh, A.S.; Naderi, M. In situ evaluation of the mechanical properties of pozzolanic concrete containing fibers. J. Crit. Rev. 2020, 7, 545–554. [Google Scholar] [CrossRef]
  5. Torres, J.; Andrade, C.; Sánchez, J. Initiation period of corrosion by chloride ion according to EHE 08 in cracked concrete elements. Inf. Constr. 2020, 72, e331. [Google Scholar] [CrossRef]
  6. Anaya, P.; Rodríguez, J.; Andrade, C.; Martín-Pérez, B.; Hombrados, C.L. Determination of wires transfer length in prestressed concrete members with different levels of corrosion. Inf. Constr. 2020, 72, 1–10. [Google Scholar] [CrossRef]
  7. D’Amato, M.; Luchin, G.; De Matteis, G. A Preliminary Study on Properties of A Weak Units–Strong Mortar Masonry: The Case Study of Matera Tufo Masonry (Italy). Int. J. Archit. Herit. 2022. [Google Scholar] [CrossRef]
  8. Zima, B.; Kędra, R. Evaluation of the resistance of steel–concrete adhesive connection in reinforced concrete beams using guided wave propagation. Arch. Civ. Mech. Eng. 2020, 20, 1. [Google Scholar] [CrossRef]
  9. Schuster, G.T. Resolution limits for crosswell migration and traveltime tomography. Geophys. J. Int. 1996, 127, 427–440. [Google Scholar] [CrossRef]
  10. Luchin, G.; Ramos, L.F.; D’Amato, M. Sonic Tomography for Masonry Walls Characterization. Int. J. Archit. Herit. 2020, 14, 589–604. [Google Scholar] [CrossRef]
  11. Liu, M.; Zhang, Q.; Tan, Z.; Wang, L.; Li, Z.; Ma, G. Investigation of steel wire mesh reinforcement method for 3D concrete printing. Arch. Civ. Mech. Eng. 2021, 21, 24. [Google Scholar] [CrossRef]
  12. Qasrawi, H. Effect of the position of core on the strength of concrete of columns in existing structures. J. Build. Eng. 2019, 25, 100812. [Google Scholar] [CrossRef]
  13. Marcos, I.; San-José, J.T.; Garmendia, L.; Santamaría, A.; Manso, J.M. Central lessons from the historical analysis of 24 reinforced-concrete structures in northern Spain. J. Cult. Heritage 2016, 20, 649–659. [Google Scholar] [CrossRef]
  14. Jones, R. The non-destructive testing of concrete. Mag. Concr. Res. 1949, 1, 67–78. [Google Scholar] [CrossRef]
  15. Krautkrämer, J.; Krautkrämer, H. Ultrasonic Testing of Materials; Springer: Berlin/Heidelberg, Germany, 1996. [Google Scholar] [CrossRef]
  16. Jones, R. The ultrasonic testing of concrete. Ultrasonics 1963, 1, 78–82. [Google Scholar] [CrossRef]
  17. Washer, G.; Fuchs, P.; Graybeal, B.A.; Hartmann, J.L. Ultrasonic Testing of Reactive Powder Concrete. IEEE Trans. Ultrason. Ferroelectr. Freq. Control 2004, 51, 193–201. [Google Scholar] [CrossRef]
  18. Chiriatti, L.; François, P.; Mercado-Mendoza, H.; Apedo, K.L.; Fond, C.; Feugeas, F. Monitoring of the rebar-concrete bond structural health through ultrasonic measurements: Application to recycled aggregate concrete. J. Civ. Struct. Health Monit. 2020, 10, 595–607. [Google Scholar] [CrossRef]
  19. Çalışkan, A.; Demirhan, S.; Tekin, R. Comparison of different machine learning methods for estimating compressive strength of mortars. Constr. Build. Mater. 2022, 335, 127490. [Google Scholar] [CrossRef]
  20. Zhang, Y.; Aslani, F.; Lehane, B. Compressive strength of rubberized concrete: Regression and GA-BPNN approaches using ultrasonic pulse velocity. Constr. Build. Mater. 2021, 307, 124951. [Google Scholar] [CrossRef]
  21. Revilla-Cuesta, V.; Skaf, M.; Serrano-López, R.; Ortega-López, V. Models for compressive strength estimation through non-destructive testing of highly self-compacting concrete containing recycled concrete aggregate and slag-based binder. Constr. Build. Mater. 2021, 280, 122454. [Google Scholar] [CrossRef]
  22. Santos, S.; da Silva, P.R.; de Brito, J. Self-compacting concrete with recycled aggregates—A literature review. J. Build. Eng. 2019, 22, 349–371. [Google Scholar] [CrossRef]
  23. Nepomuceno, M.C.S.; Bernardo, L.F.A. Evaluation of self-compacting concrete strength with non-destructive tests for concrete structures. Appl. Sci. 2019, 9, 5109. [Google Scholar] [CrossRef] [Green Version]
  24. Nguyen, N.T.; Sbartaï, Z.-M.; Lataste, J.-F.; Breysse, D.; Bos, F. Assessing the spatial variability of concrete structures using NDT techniques—Laboratory tests and case study. Constr. Build. Mater. 2013, 49, 240–250. [Google Scholar] [CrossRef]
  25. Abdulhameed, A.A.; Hanoon, A.N.; Abdulhameed, H.A.; Banyhussan, Q.S.; Mansi, A.S. Push-out test of steel–concrete–steel composite sections with various core materials: Behavioural study. Arch. Civ. Mech. Eng. 2021, 21, 17. [Google Scholar] [CrossRef]
  26. Yu, F.; Li, X.; Song, J.; Fang, Y.; Qin, Y.; Bu, S. Experimental study on flexural capacity of PVA fiber-reinforced recycled concrete slabs. Arch. Civ. Mech. Eng. 2021, 21, 166. [Google Scholar] [CrossRef]
  27. Deresa, S.T.; Xu, J.; Demartino, C.; Heo, Y.; Li, Z.; Xiao, Y. A review of experimental results on structural performance of reinforced recycled aggregate concrete beams and columns. Adv. Struct. Eng. 2020, 23, 3351–3369. [Google Scholar] [CrossRef]
  28. Xu, J.J.; Chen, W.G.; Demartino, C.; Xie, T.Y.; Yu, Y.; Fang, C.F.; Xu, M. A Bayesian model updating approach applied to mechanical properties of recycled aggregate concrete under uniaxial or triaxial compression. Constr. Build. Mater. 2021, 301, 124274. [Google Scholar] [CrossRef]
  29. Faleschini, F.; Zanini, M.A.; Hofer, L. Reliability-based analysis of recycled aggregate concrete under carbonation. Adv. Civ. Eng. 2018, 2018, 4742372. [Google Scholar] [CrossRef]
  30. Xing, W.; Tam, V.W.; Le, K.N.; Hao, J.L.; Wang, J. Life cycle assessment of recycled aggregate concrete on its environmental impacts: A critical review. Constr. Build. Mater. 2022, 317, 125950. [Google Scholar] [CrossRef]
  31. Zhan, P.M.; Zhang, X.X.; He, Z.H.; Shi, J.Y.; Gencel, O.; Hai Yen, N.T.; Wang, G.C. Strength, microstructure and nanomechanical properties of recycled aggregate concrete containing waste glass powder and steel slag powder. J. Clean. Prod. 2022, 341, 130892. [Google Scholar] [CrossRef]
  32. Barra Bizinotto, M.; Faleschini, F.; Jiménez Fernández, C.G.; Aponte Hernández, D.F. Effects of chemical admixtures on the rheology of fresh recycled aggregate concretes. Constr. Build. Mater. 2017, 151, 353–362. [Google Scholar] [CrossRef]
  33. Etxeberria, M. Evaluation of eco-efficient concretes produced with fly ash and uncarbonated recycled aggregates. Materials 2021, 14, 7499. [Google Scholar] [CrossRef] [PubMed]
  34. Nobre, J.; Bravo, M.; de Brito, J.; Duarte, G. Durability performance of dry-mix shotcrete produced with coarse recycled concrete aggregates. J. Build. Eng. 2020, 29, 101135. [Google Scholar] [CrossRef]
  35. Revilla-Cuesta, V.; Ortega-López, V.; Skaf, M.; Khan, A.U.R.; Manso, J.M. Deformational behavior of self-compacting concrete containing recycled aggregate, slag cement and green powders under compression and bending: Description and prediction adjustment. J. Build. Eng. 2022, 54, 104611. [Google Scholar] [CrossRef]
  36. Carro-López, D.; González-Fonteboa, B.; De Brito, J.; Martínez-Abella, F.; González-Taboada, I.; Silva, P. Study of the rheology of self-compacting concrete with fine recycled concrete aggregates. Constr. Build. Mater. 2015, 96, 491–501. [Google Scholar] [CrossRef]
  37. Ouchi, M.; Hibino, M.; Sugamata, T.; Okamura, H. Quantitative evaluation method for the effect of superplasticizer in self-compacting concrete. Trans. Jpn. Concr. Inst. 2000, 22, 15–20. [Google Scholar]
  38. Okamura, H. Self-compacting high-performance concrete. Concr. Int. 1997, 19, 50–54. [Google Scholar]
  39. Ouchi, M.; Edamatsu, Y.; Ozawa, K.; Okamura, H. Simple evaluation method for interaction between coarse aggregate and mortar’s particles in self-compacting concrete. Trans. Jpn. Concr. Inst. 1999, 21, 1–6. [Google Scholar]
  40. Revilla-Cuesta, V.; Ortega-López, V.; Skaf, M.; Fiol, F.; Manso, J.M. Why is the effect of recycled concrete aggregate on the compressive strength of self-compacting concrete not homogeneous? A bibliographic review. Inf. Constr. 2022, 74, e435. [Google Scholar] [CrossRef]
  41. Bier, T.A.; Rizwan, S.A. Ecological, economical and environmental aspects of self compacting concrete—Present and future. Int. J. Soc. Mater. Eng. Resour. 2014, 20, 12–16. [Google Scholar] [CrossRef] [Green Version]
  42. Singh, N.; Singh, S.P. Evaluating the performance of self compacting concretes made with recycled coarse and fine aggregates using non destructive testing techniques. Constr. Build. Mater. 2018, 181, 73–84. [Google Scholar] [CrossRef]
  43. Kazemi, M.; Madandoust, R.; de Brito, J. Compressive strength assessment of recycled aggregate concrete using Schmidt rebound hammer and core testing. Constr. Build. Mater. 2019, 224, 630–638. [Google Scholar] [CrossRef]
  44. Pazouki, G.; Pourghorban, A. Using a hybrid artificial intelligence method for estimating the compressive strength of recycled aggregate self-compacting concrete. Eur. J. Environ. Civ. Eng. 2022, 26, 5569–5593. [Google Scholar] [CrossRef]
  45. Abed, M.A.; Tayeh, B.A.; Abu Bakar, B.H.; Nemes, R. Two-year non-destructive evaluation of eco-efficient concrete at ambient temperature and after freeze-thaw cycles. Sustainability 2021, 13, 10605. [Google Scholar] [CrossRef]
  46. Revilla-Cuesta, V.; Ortega-López, V.; Faleschini, F.; Espinosa, A.B.; Serrano-López, R. Hammer rebound index as an overall-mechanical-quality indicator of self-compacting concrete containing recycled concrete aggregate. Constr. Build. Mater. 2022, 347, 128549. [Google Scholar] [CrossRef]
  47. EN-Euronorm Rue de Stassart, 36; Brussels, Belgium: European Committee for Standardization.
  48. Santamaría, A.; González, J.J.; Losáñez, M.M.; Skaf, M.; Ortega-López, V. The design of self-compacting structural mortar containing steelmaking slags as aggregate. Cem. Concr. Compos. 2020, 111, 103627. [Google Scholar] [CrossRef]
  49. EC-2 Eurocode 2: Design of Concrete Structures. Part 1-1: General Rules and Rules for Buildings; CEN (European Committee for Standardization): Brussels, Belgium, 2010.
  50. Wu, Y.; Liu, C.; Liu, H.; Hu, H.; He, C.; Song, L.; Huang, W. Pore structure and durability of green concrete containing recycled powder and recycled coarse aggregate. J. Build. Eng. 2022, 53, 104584. [Google Scholar] [CrossRef]
  51. Revilla-Cuesta, V.; Faleschini, F.; Pellegrino, C.; Skaf, M.; Ortega-López, V. Simultaneous addition of slag binder, recycled concrete aggregate and sustainable powders to self-compacting concrete: A synergistic mechanical-property approach. J. Mater. Res. Technol. 2022, 18, 1886–1908. [Google Scholar] [CrossRef]
  52. Ivanović, B.; Saha, A.; Stević, Ž.; Puška, A.; Zavadskas, E.K. Selection of truck mixer concrete pump using novel MEREC DNMARCOS model. Arch. Civ. Mech. Eng. 2022, 22, 173. [Google Scholar] [CrossRef]
  53. Wang, S.; Zhu, H.; Liu, F.; Cheng, S.; Wang, B.; Yang, L. Effects of steel fibers and concrete strength on flexural toughness of ultra-high performance concrete with coarse aggregate. Case Stud. Constr. Mater. 2022, 17, e01170. [Google Scholar] [CrossRef]
  54. Llopis-Albert, C.; Toro, W.R.V.; Farhat, N.; Zamora-Ortiz, P.; Del Pozo, Á.F.P. A new method for time normalization based on the continuous phase: Application to neck kinematics. Mathematics 2021, 9, 3138. [Google Scholar] [CrossRef]
  55. Winkler, J.R.; Mitrouli, M.; Koukouvinos, C. The application of regularisation to variable selection in statistical modelling. J. Comput. Appl. Math. 2022, 404, 113884. [Google Scholar] [CrossRef]
  56. Fiol, F.; Thomas, C.; Muñoz, C.; Ortega-López, V.; Manso, J.M. The influence of recycled aggregates from precast elements on the mechanical properties of structural self-compacting concrete. Constr. Build. Mater. 2018, 182, 309–323. [Google Scholar] [CrossRef]
  57. Uygunoğlu, T.; Topçu, I.B.; Çelik, A.G. Use of waste marble and recycled aggregates in self-compacting concrete for environmental sustainability. J. Clean. Prod. 2014, 84, 691–700. [Google Scholar] [CrossRef]
Figure 1. Particle-size distribution of the aggregates.
Applsci 13 00874 g001
Figure 2. Slump flow of SCC mixes.
Applsci 13 00874 g002
Figure 3. Mechanical performance of SCC mixes: (a) compressive strength; (b) modulus of elasticity; (c) splitting tensile strength; (d) flexural strength.
Applsci 13 00874 g003
Figure 4. Ultrasonic pulse velocity (UPV) of SCC mixes.
Applsci 13 00874 g004
Figure 5. Pearson correlation matrix. Correlations between UPV readings and mechanical properties marked within the thick black border.
Applsci 13 00874 g005
Figure 6. Spearman correlation matrix. Correlations between UPV readings and mechanical properties marked within the thick black border.
Applsci 13 00874 g006
Figure 7. Standardized properties of SCC mixes: (a) compressive strength; (b) modulus of elasticity; (c) splitting tensile strength; (d) flexural strength; (e) UPV.
Applsci 13 00874 g007aApplsci 13 00874 g007b
Figure 8. Validation of Equation (6) through other studies in the literature regarding SCC containing RA [56,57].
Applsci 13 00874 g008
Table 1. Physical properties of aggregates.
AggregateSSD Density (Mg/m3) 115-min Water Absorption (wt%)24-h Water Absorption (wt%)
Limestone filler2.770.370.54
Limestone powder2.601.952.57
RA powder2.316.327.95
Siliceous sand2.580.180.25
Fine RA2.375.777.36
Coarse RA2.424.906.25
1 SSD density: saturated-surface-dry density.
Table 2. SCC composition.
AggregateF0F50F100L0L50L100R0R50R100
Limestone filler165165165000000
Limestone powder000335335335000
RA powder000000305305305
Siliceous sand1100550094047509404750
Fine RA0505101004358650435865
Coarse RA530530530530530530530530530
Viscosity regulator2.302.302.302.302.302.302.302.302.30
Plasticizer4.504.504.504.504.504.504.504.504.50
Water185210235185210235200220245
Cement 300300300300300300300300300
Table 3. Simple-regression analysis.
Mechanical PropertyMost Accurate ModelLinear Model
abR2 (%)R2 (%)
Compressive strength21.353194.25297.9187.51
Modulus of elasticity23.404208.48290.3162.54
Splitting tensile strength25.38331.67964.8653.94
Flexural strength25.39841.21473.9062.38
Table 4. Values for the standardization of the UPV readings and the mechanical properties.
VariableXmaxXminXm
Compressive strength (MPa)42.2326.7534.49
Modulus of elasticity (GPa)33.3120.5827.01
Splitting tensile strength (MPa)3.692.703.20
Flexural strength (MPa)4.843.494.17
UPV (km/s)4.153.583.87
Table 5. Simple linear-regression model between standardized properties.
VariableaR2 (%)
Compressive strength0.93387.52
Modulus of elasticity0.76980.43
Splitting tensile strength0.73053.86
Flexural strength0.78762.26
Table 6. Calculation of the modulus of elasticity of mix L0 with the proposed models.
Calculation StepValue
Known SCC propertiesCompressive strength (MPa) 145.6
UPV (km/s)4.22
Standardized propertiesCompressive strength0.7177
UPV0.6179
Standardized modulus of elasticity with Equation (6) M E S = U P V S 1.246 × C S S 0.344 0.8034
Standardized modulus of elasticity with Equation (7) M E S = 2 × U P V S 0.894 C S S 0.6646
Modulus of elasticity with Equation (6) (GPa) (Equation (2) and Table 4) M E = M E S × ( M E u 95 M E l 95 ) + M E m 37.2
Modulus of elasticity with Equation (7) (GPa) (Equation (2) and Table 4) M E = M E S × ( M E u 95 M E l 95 ) + M E m 35.5
Modulus of elasticity: Experimental value (GPa)See Figure 3b36.4
1 Compressive strength could also be calculated through the UPV using models available in the literature [21].
Disclaimer/Publisher’s Note: The statements, opinions and data contained in all publications are solely those of the individual author(s) and contributor(s) and not of MDPI and/or the editor(s). MDPI and/or the editor(s) disclaim responsibility for any injury to people or property resulting from any ideas, methods, instructions or products referred to in the content.

