Article

Experimental Evaluation of the Factors That Influence Cylindrical Water Projection Devices against IEDs

by
José F. Ródenas-García
1,
Ramón A. Otón-Martínez
2,*,
Joaquín Sancho-Val
3,
Oscar de Francisco Ortiz
4,
Roberto Jiménez Pacheco
3 and
Iván Gil Garnacho
5
1
Cuerpo Nacional de Policía (CNP), 30120 Murcia, Spain
2
Centro Universitario de la Defensa, Universidad Politécnica de Cartagena, Cl. Coronel López Peña S/N, Base Aérea de San Javier, 30720 Murcia, Spain
3
Academia General Militar, Centro Universitario de la Defensa (CUD), 50090 Zaragoza, Spain
4
Departamento de Ingeniería Mecánica, Materiales y Fabricación, Universidad Politécnica de Cartagena, 30202 Cartagena, Spain
5
Área de Balística de Efectos y Detónica, Departamento de Sistemas de Armas y Balística de la Subdirección de Sistemas Terrestres, Instituto Nacional de Técnica Aeroespacial (INTA), Carretera de M-301, Km 10.5, 28330 San Martín de la Vega, Spain
*
Author to whom correspondence should be addressed.
Appl. Sci. 2023, 13(2), 1167; https://doi.org/10.3390/app13021167
Submission received: 19 December 2022 / Revised: 5 January 2023 / Accepted: 12 January 2023 / Published: 15 January 2023

Abstract

:
Terrorists usually employ Improvised Explosive Devices (IEDs) to cause maximum damage with a single action, in asymmetric war scenarios. In the counter-terrorism fight, bomb disposal specialists have to combat these instruments by safeguarding their lives, avoiding fortuitous IED explosion, and preserving evidence of the device that could lead to the capture of the perpetrators. Some very effective deactivation tools that combine these features are high-speed water-explosive projection devices. To understand and quantify the impacts of the many factors that intervene in their operation and effectiveness, extensive experimental tests should be conducted. However, Operations Research techniques allow robust results to be obtained by minimizing experiments. This study focuses on the use of Design of Experiments (DoE), with a factorial experiment plan divided into two levels, to analyze the influence of the amount of explosive, the diameter of the device (that is, the mass of water to be projected), the density of the water, the distance at which the IED is located, and the resistance of the inner tube material. Results show that the mass of explosive, the diameter of the device, the interaction of the mass of explosive and the density of the water, and the interaction between the resistance of the inner tube and the diameter of the container have a strong influence on the speed of projected water.

1. Introduction

The asymmetric war tactics used by terrorists lead them to prepare attacks of various kinds, and one of their main actions since the beginning of terrorism is the use of Improvised Explosive Devices (IEDs). Globally, since the end of 2001, there has been an increase in all forms of terrorism. Bombings constituted the majority of terrorist attacks in 2017, representing 47% of all attacks, these being the most common in countries affected by conflicts (around 50% of attacks), compared to 34% of attacks in countries that did not experience conflict [1].
An IED is defined by the United Nations as “a device placed or fabricated in an improvised manner incorporating destructive, lethal, noxious, pyrotechnic, or incendiary chemicals and designed to destroy, incapacitate, harass, or distract. It may incorporate military stores but is normally devised from nonmilitary components” [2]. The word “improvised” should not lead us to consider it as a system that is not very elaborate or is ineffective and lacking in technology [3]. Since the first Orsini bomb that contained gunpowder as an explosive charge and a percussion activation system (used in 1858 by the Italian Felice Orsini in an assassination attempt on the French Emperor Napoleon III), IEDs have evolved technologically into the most recent UAV-IEDs used in Islamic terrorism [4]. Additionally noteworthy is the latent threat of attack with Chemical, Biological, Radiological, or Nuclear (CBRN) agents to be disseminated with an explosive, such as in a frustrated attack at Izmailovsky Park in Moscow in 1995, in which Chechen terrorists attached a source of Cesium 137 to an explosive device, known as a dirty bomb [5]. In spite of how advanced the electronic systems may be, and the various configurations that an IED can adopt, which are as varied as the terrorist’s imagination, they all contain some basic elements, such as an activation system, an initiation system, an explosive charge, and a container (Figure 1).
Once an IED, or a suspicious object, has been detected, only Explosive Ordnance Disposal (EOD) technicians can act to neutralize or deactivate it. The deactivation of an IED consists of causing physical–chemical changes in such a way that some of the systems necessary for the explosion to take place are interrupted. Undoubtedly, the final objective of the deactivation is to achieve the total disruption of the IED so that its components are separated, and the explosion cannot take place in any way, but intervention on the device carries the risk of accidentally causing an explosion or activating some “trap system” installed by the bombmaker. Therefore, one of the main security measures that can guarantee the protection of the technician is the distance from the IED at the time of action. There are several systems and procedures used to work remotely; one of them is the use of high-speed water projection devices using explosives: the water penetrates the IED, causing the disruption of the activation and/or initiation system, while not completely destroying the components of the device. The main advantage of water is its great power to dissipate heat and its humidification capacity, compared to metallic plasma that is projected by other sorts of devices, such as those used against Unexploded Ordnances (UXOs), i.e., shaped loads or Explosively Formed Projectiles (EFPs) [6].
Among these water projection counter-IED devices, whose use dates back to the 1980s [7], two different types are found according to the direction of the projected water: directional and omnidirectional devices. Directional devices project water in a predominant direction—some through the use of an explosive sheet placed in a certain position [8] or directed in the form of a high-speed jet, where the explosive that drives the fluid is centered and the water is projected radially (spray water). Each type has its advantages and disadvantages: the directed water devices project the water at higher speeds, but the affected surface is smaller, and the EOD technician must be more precise in the placement of the device and even know the internal disposition of the IED components. On the other hand, with omnidirectional devices, the technician does not have to be concerned about the device orientation; they are cheap, simple designs and can even be made by the EOD teams themselves with mineral water bottles or similar (these are known as Mineral Water Bottles (MWBs)) [9]. There are some patented models on the market [7,9] that are offered to police forces and armies around the world. Even so, it is common for specialists to use handcrafted devices made by themselves. The system is simple: the device contains water or another fluid and an explosive charge that projects this liquid onto the IED. However, the apparent simplicity of the device is contrasted by the complexity of the explosive wave phenomenon, being necessary a study that provides more information in order to optimize variables such as the mass of explosive to be used for a particular amount of fluid, the effective distance between the device and the IED, the type of fluid, as well as other variables that influence the speed of the fluid and, therefore, its disruptive power.
However, there is a dramatic lack of studies published in the open literature on the design and analysis of the factors that intervene in the operation of water projection counter-IED devices. The few studies available are limited to directional water-jet propulsion devices. Enache et al. [10] address the study of water-jet propulsion due to high explosive detonation. They evaluate the velocity of water when experimentally measured, as compared to the prediction given by the Gurney equation. However, as the authors rightly state, the “Gurney equation can provide fair results regarding initial velocity of metallic fragments for explosively driven metal casings” [10], but gives wrong predictions for the projected water front. Radomski [11] addresses the simulation of the internal ballistics of a two-chambered recoilless projected water disruptor. Parate et al. [12] use a single base propellant, also with a directional disruptor, for an experimental study oriented towards qualification tests (impact, sealing, vibration, shock, etc.). On cylindrical devices, Cherry [8] patented a fluid-filled bottle or plastic container that contains an adjustable sheet explosive, to direct the fluid projectile towards the IED. However, to the best of the authors’ knowledge, no research work can be found in the literature on the design, optimization, or study of the parameters of an omnidirectional counter-IED device.
Consequently, the present study aims to provide new research experimental data, useful to researchers who study the optimization of omnidirectional counter-IED devices, designers, or even the EOD units of police and military forces, constructing their own devices in the most efficient way. To do so, the impact of the problem variables on the device effectiveness (which can be assimilated with the speed of the projected liquid) is analyzed, as well as the interaction between significant factors, through the Design of Experiments (DoE) and statistical analysis. This paper begins by describing the mathematical background of the used methodology and, later on, the factors selected for the tests are justified (Section 2). After this, the tests carried out are detailed and the results obtained are discussed (Section 3). Finally, the conclusions of this work are presented (Section 4).

2. Materials and Methods

The study of water projection devices against IEDs has been carried out through a combined experimental–theoretical methodology. First, experiments planned by means of DoE were performed with a number of prototypes. Then, a theoretical part based on the statistical analysis of the results was carried out.
The omnidirectional high-speed fluid projection devices are configured as shown in Figure 2. They consist of a cylindrical casing closed by both bases, containing the fluid inside, and a smaller inner cylinder placed on its symmetry axis, where an explosive material such as a detonating cord or plastic explosive is introduced. The volume between the cylindrical case and the inner tube contains water or another fluid. The initiation of the explosive is carried out through an electric detonator. Once the explosion occurs, the fluid is projected in all directions (see Figure 2).
The aim is for the water to reach the IED with the highest possible kinetic energy, in order to penetrate the container and separate its components, as observed in previous research [13,14]. Velocity is a measurable and representative variable of the kinetic energy transported by the fluid. In the present work, velocity will be therefore considered a representative indicator of the effectiveness of the counter-IED device. This is supported by the literature, as Cherry [8] states that “depending on the configuration and the amount of explosive and fluid used, water is projected at the target that has sufficient energy to penetrate rigid enclosures from fairly long stand-off”. Thus, “since the pressure induced in target materials is strongly connected to impact velocity, a special attention must be given to its evaluation” [10].
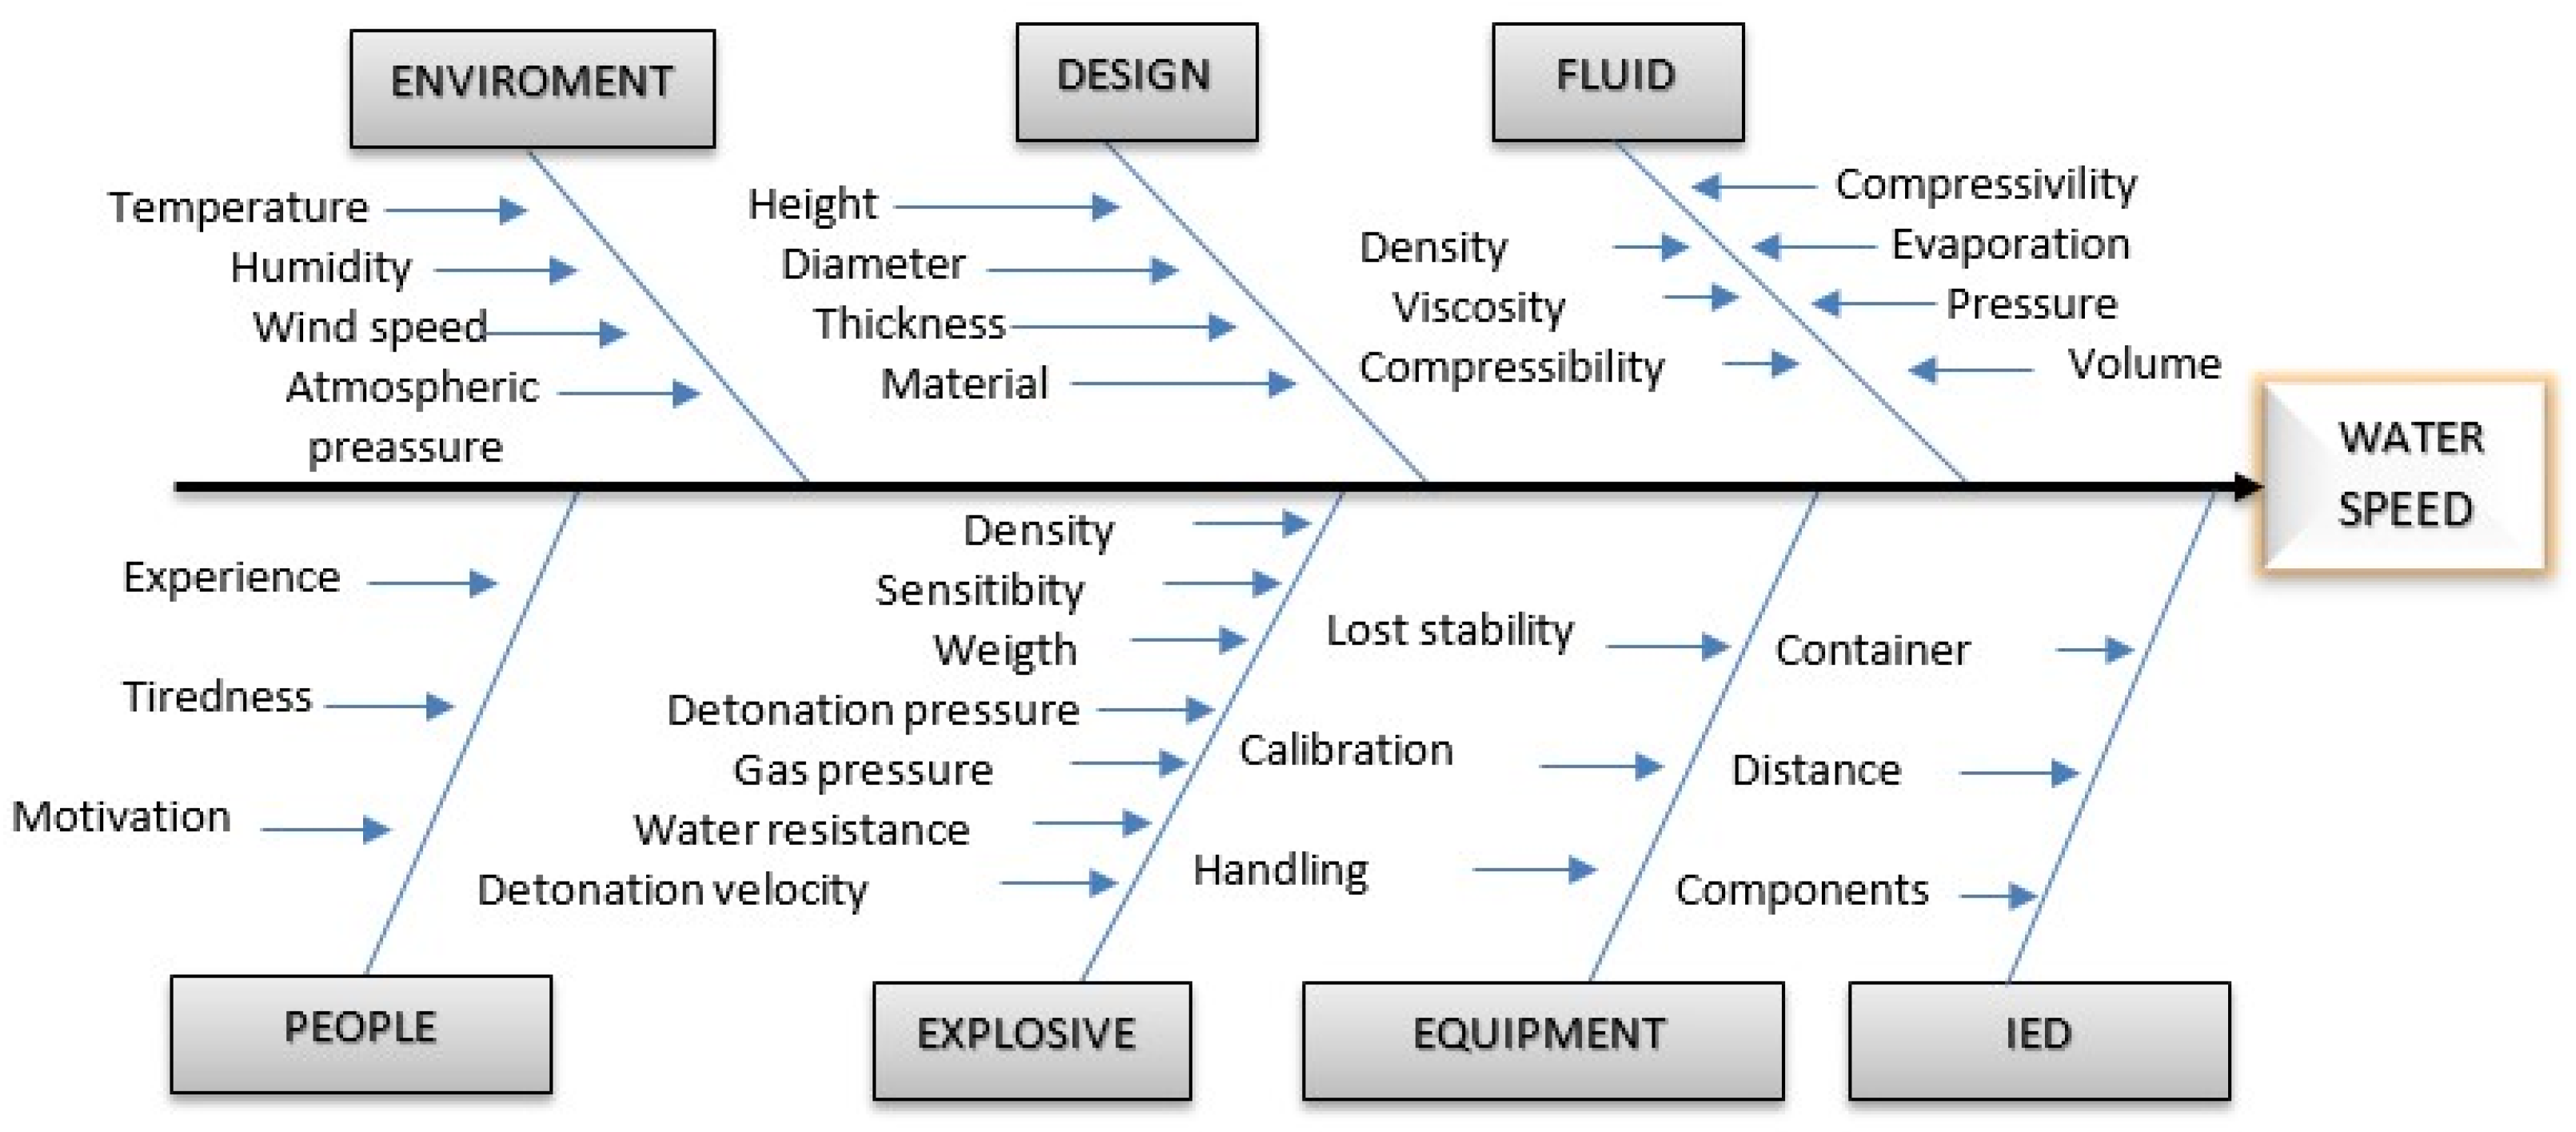
It is crucial to identify and understand in depth the factors that can influence the water velocity. However, the factors are so numerous that it is unfeasible to undertake a complete experiment in a traditional factor-by-factor manner. An approach to capture some possible influencing factors is through the Ishikawa or fishbone diagram [15], represented in Figure 3. It should be taken into account that not all the factors are controllable and not all are significant [16]. A prior analysis of the factors involved in the process allows one to choose the most appropriate ones, taking into account both the practical experience of the EOD units of police forces and the theoretical understanding of the problem.

2.1. Methodology

The methodology selected to analyze the influence of the different factors focuses on the Design of Experiments (DoE), also called the Statistical Design of Experiments. This statistical technique is applied for the planning of an experimental study to determine the relationship between the causes or factors that intervene in the problem and the measurable effects in a real process, and it also reveals the interactions between factors, which are often more important than some individual factors alone [17]. Given the industrial origin of the DoE, its main advantage is the possibility of finding significant conclusions with a small number of trials and, therefore, limited cost. Of course, the technique also has its drawbacks: the analysis of the results can be complex in experiments with a large number of factors; for better precision, a greater number of experiments is necessary, which entails greater expense. Furthermore, the method can lead to erroneous conclusions if statistical aspects such as the normality and homoscedasticity of data and independence of events are not checked, as well as if factors external to the experimentation are not controlled [16].
It is important not to increase the number of tests with the number of levels to be more than necessary. In this study, two levels are handled for each factor, being coded as (−1) or (+1), even if these are numerical or nominal, according to the previously expected negative or positive influence on the result. Thus, in a full factorial design, the total number of tests will be N tests = 2 k . The complete, multifactorial DoE has its origin in the theories of design of experiments by G. Taguchi (1924–2012) and D. Shainin (1914–2000) and allows us, in a simple way, to determine whether any factor can be discarded when observing that it does not influence the response variable [18].
The results obtained are analyzed by calculating the effects and contrasts of the main factors and their interactions, and, using the sum of their squares, the statistical analysis is carried out. The effects of each factor or interaction will be equal to the average of the responses of the high level (+1) minus the average of the responses of the low level (−1):
E f f e c t =   Y + n +   Y n
where n is the number of data collected at each level and Y are the values of the responses associated with each level. Once the influences of the factors and interactions have been quantified, their reliability is verified with an analysis of variance (ANOVA) and a diagnosis of the “residual error” to validate the statistical assumptions.
The final result of the experiment is reflected in a mathematical model with a regression equation that predicts the response based on the variation of the factors and/or their most influential interactions, within the values of the levels under study, thus being a valuable aid for the interpretation of the experiment. The form of the equation in general terms will be that of the Scheffler equation:
y = β 0 + B 1 x 1 + β 2 x 2 + + β k x k + ε
with y being the dependent variable (the response), x i ( i = 1 , , k ) are the set of predictor variables, β i ( i = 1 , , k ) are the regression coefficients, and ε is the residual error. The regression coefficients β are obtained with least squares estimation, defined as half of the effect of a particular factor or interaction [18].

2.2. Selection of the Response Variable, the Factors, and the Levels of Each Factor

The response variable must be measurable, representative of the influence of the factors studied, and be related to the objective of the study. As previously indicated in Section 1, the response variable is the water projection velocity—specifically, the speed of the cylindrical water front formed by the explosion. Regarding the choice of factors, it is intended to cover the large groups of controllable factors of the Ishikawa diagram in Figure 3, so that the factors related to the design of the device, the projected fluid, the explosive used, and the IED are considered.

2.2.1. Factors Related to the Design of the Device

Among the factors involved in the design of the device, the following are selected:
  • The diameter of the cylinder (in order to observe the influence of the mass of water related to the amount of explosive), using two diameters, 105 mm and 85 mm;
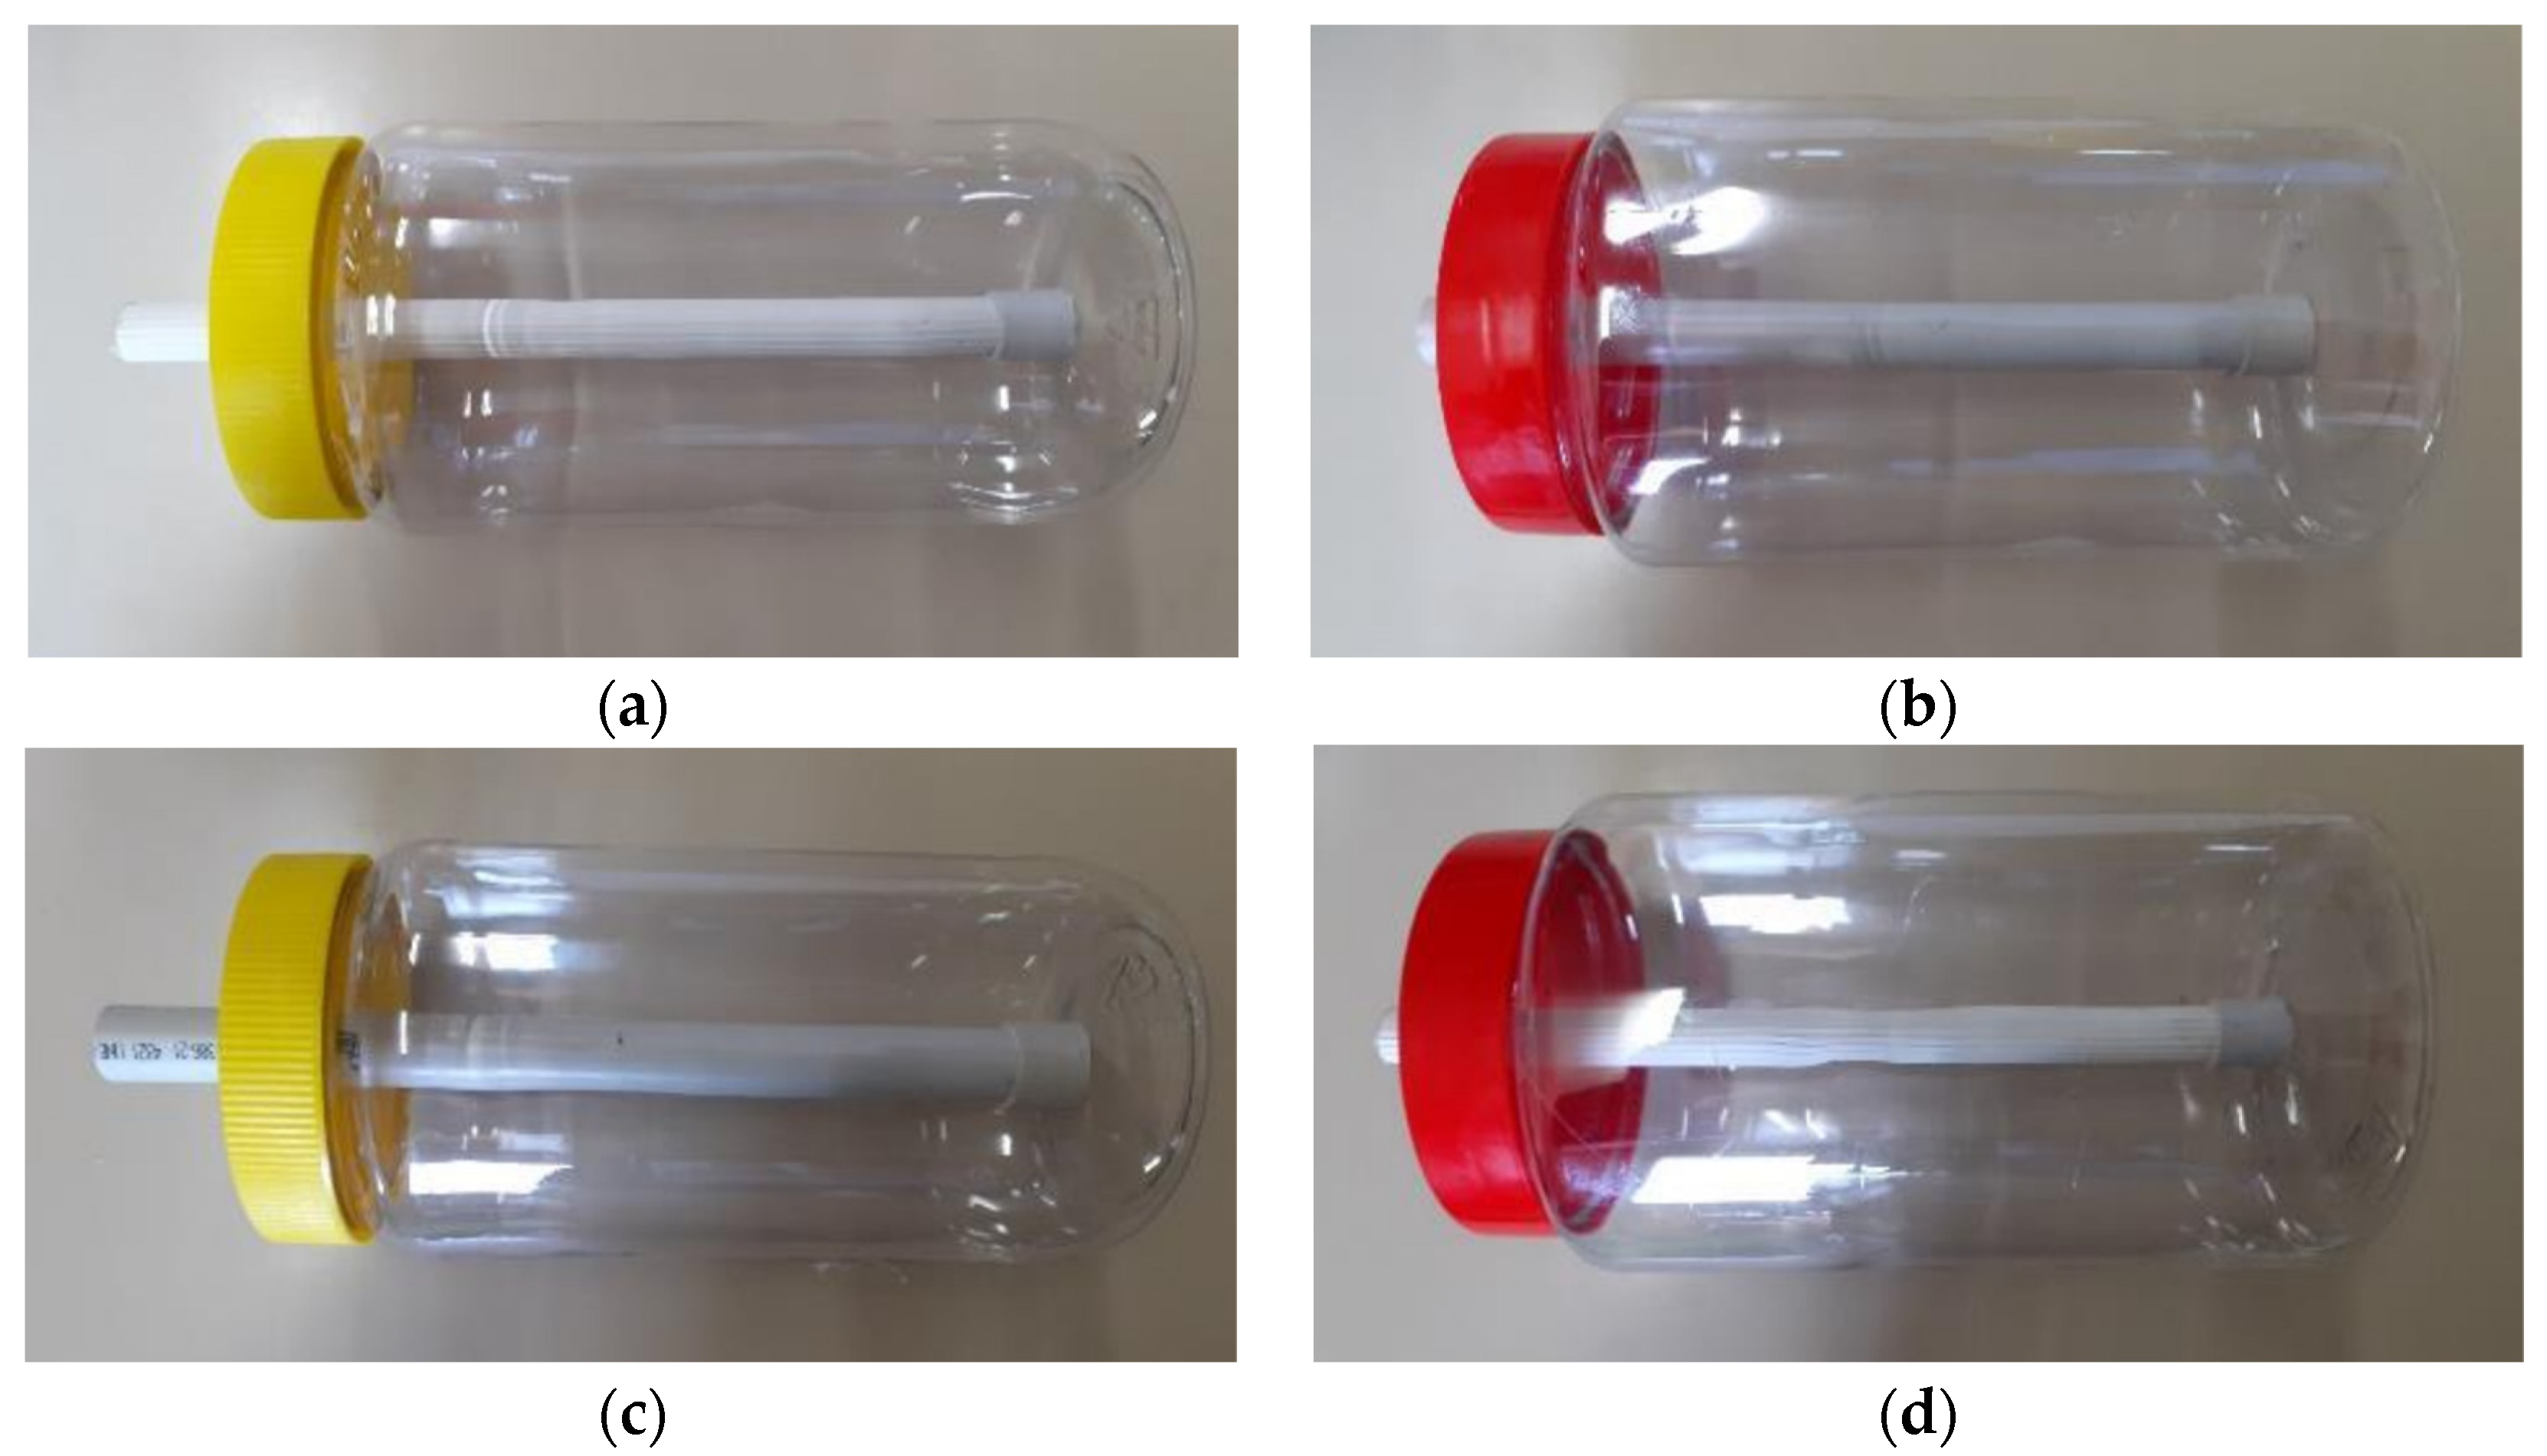
  • The material of the inner tube (two materials of different resistance are used to observe their effects on the speed of the projected liquid)—on the one hand, an inner tube of polyvinyl chloride (PVC) and another of polypropylene (PP).
This provides four different device designs, as represented in Figure 4. (The bottles with the yellow cap are 86 mm in diameter, while those with the red cap are 105 mm. Images (a) and (d) are devices with a PP inner tube, while (b) and (c) have a PVC tube.)

2.2.2. Factors Related to the Fluid

Regarding the factors related to the fluid, it is very important to take compressibility into account. The fact that gas is compressible means that it is not a suitable fluid to be projected by the explosive, since this compression capacity means that the energy of the expansion wave, which is transmitted to the fluid, is converted into a density change, which reduces the projection velocity. Therefore, the fluid to be used must be a liquid (water or another suitable liquid) that, although not completely incompressible, can be considered an incompressible fluid, as shown by Petrenko et al. in their research on liquid projectiles in hydro-cannons [14].
In this study, water is always used. To observe the influence of the different characteristics of the fluid, the variation in its density is studied, through the salinity of the water, with the addition of sodium chloride. The change in density can lead to significant differences in the speed of the water, as it is related to other properties of the liquid that can also affect the response variable [7]. In particular, the speed of sound in water (around 1500 m/s) can be affected by density changes, thus affecting the speed of the shock wave traveling through it. Moreover, salinity will provide the water with so-called colligative properties, which depend on the amount of the solute, reflected in a decrease in its freezing point and an increase in its boiling point [19]. On the other hand, high-speed water projection tests with cannons show how a nebula of atomized water and steam is formed around the hydro-jet [20]. The increase in salinity will also provide a slight increase in surface tension, which can be related to the larger size of atomized water droplets. On the contrary, greater atomization will generate the dissipation of the energy in smaller drops that will have a reduced capacity to break down an IED. Finally, the viscosity of the water is also affected by salinity. As shown in [21], the higher the salinity, the higher the viscosity. Therefore, as levels of the density factor, we can define a low level (−1) 1.00 g/cm3 and high level (1) 1.16 g/cm3.

2.2.3. Factors Related to the Explosive

Undoubtedly, the explosive will have a direct influence on the speed of the projected water. The greater the energy released, the greater the energy transferred to the mass of water. The amount of explosive will be decisive, but there are several properties that characterize it. The most important features of practical interest are listed in [22]. However, due to the number of different properties of explosives, it has been determined that using the same explosive in all the tests will simplify the experiment, varying only its quantity or specific weight per linear meter. The explosive used in this study, for ease of handling and its better adaptation to the device, is a detonating cord. This is made up of a flexible plastic tubular jacket with a core of pentaerythritol tetranitrate (PETN) inside. PETN or penthrite is a military organic explosive with a high detonation velocity. The levels of this factor are established at a low level (−1) 20 g/m and high level (1) 40 g/m.
Since the type of explosive is the same in all tests (PETN), the same is true for the detonation velocity (with a constant value of 7065 m/s) as well as the heat of explosion, Δ H d 0 ( P E T N ) = −6306 kJ/kg = −19.94 kJ/mol (for liquid H2O enthalpy of formation). In all the tests, 20 cm of detonating cord is used. This is equivalent, depending on the grammage of the cord, to 4 g of PETN (low level) and 8 g of PETN (high level). The Berthelot method [23] can be considered for TNT equivalent calculation:
T N T   E q u i v a l e n t ( % ) = 840 · Δ n · ( Δ H d 0 ) M m E X P 2
where Δ n is the number of moles of product gas for each mol of explosive, Δ H d 0 is the heat of explosion in kJ/mol, and M m E X P is the molecular weight of explosive in g/mol. For PETN, Δ n = 9 mol (for the reaction of the explosive, according to the Kistiakowsky–Wilson method), Δ H d 0 (PETN) = −6306 kJ/kg = −19.94 kJ/mol (for H2O liquid enthalpy of formation), M m P E T N = 316.1 g/mol. All this gives a TNT equivalent (%) = 151%. For the mass of explosive indicated above, this is equivalent to 6.04 g of TNT (low level) and 12.08 g of TNT (high level).

2.2.4. Factors Related to the IED

The characteristics of IEDs are very varied, so much so that we could consider the IED as a single subject of study. A variable that can be controlled by the deactivator and that relates the IED to the water projection device is the separation distance between them, since it will influence the speed of the water at the point of disruption. It is important to determine the influence of this distance so that the EOD technician can take it into account so as not to approach the IED too closely and still achieve its satisfactory deactivation. Two levels of the distance factor have been established for this study: low level (−1) 55 cm and high level (1) 40 cm.

2.3. Experimental Setup

With 5 factors (diameter of the device, resistance of the inner tube, density of the water, specific mass of the explosive, and distance to the IED), and 2 levels per factor, a complete multifactorial DoE requires a minimum of 25 = 32 tests. The design can be optimized by reducing it to a fractional factorial design of 1/2, with resolution V [12], thus obtaining a research plan of 16 tests, by which it is possible to obtain information about the influence of each of the 5 main factors, and about all two-by-two interactions [13]. The interactions of three or more factors are highly unlikely in any system and, usually, only 20% of the main effects and of the interactions of two factors are significant—that is, “a few vital” and “many trivial” [17].
The fraction of half of the 25 experiments is equivalent to 25−1. This equates the experiment to a full 4-factor multifactorial experiment (A’, B’, C’, and D’), as shown in Table 1. Once the order of the tests has been randomized to minimize uncontrollable factors, the experiments are planned as shown in Table 2. The materials and elements used for experimentation are gathered in Table 3.
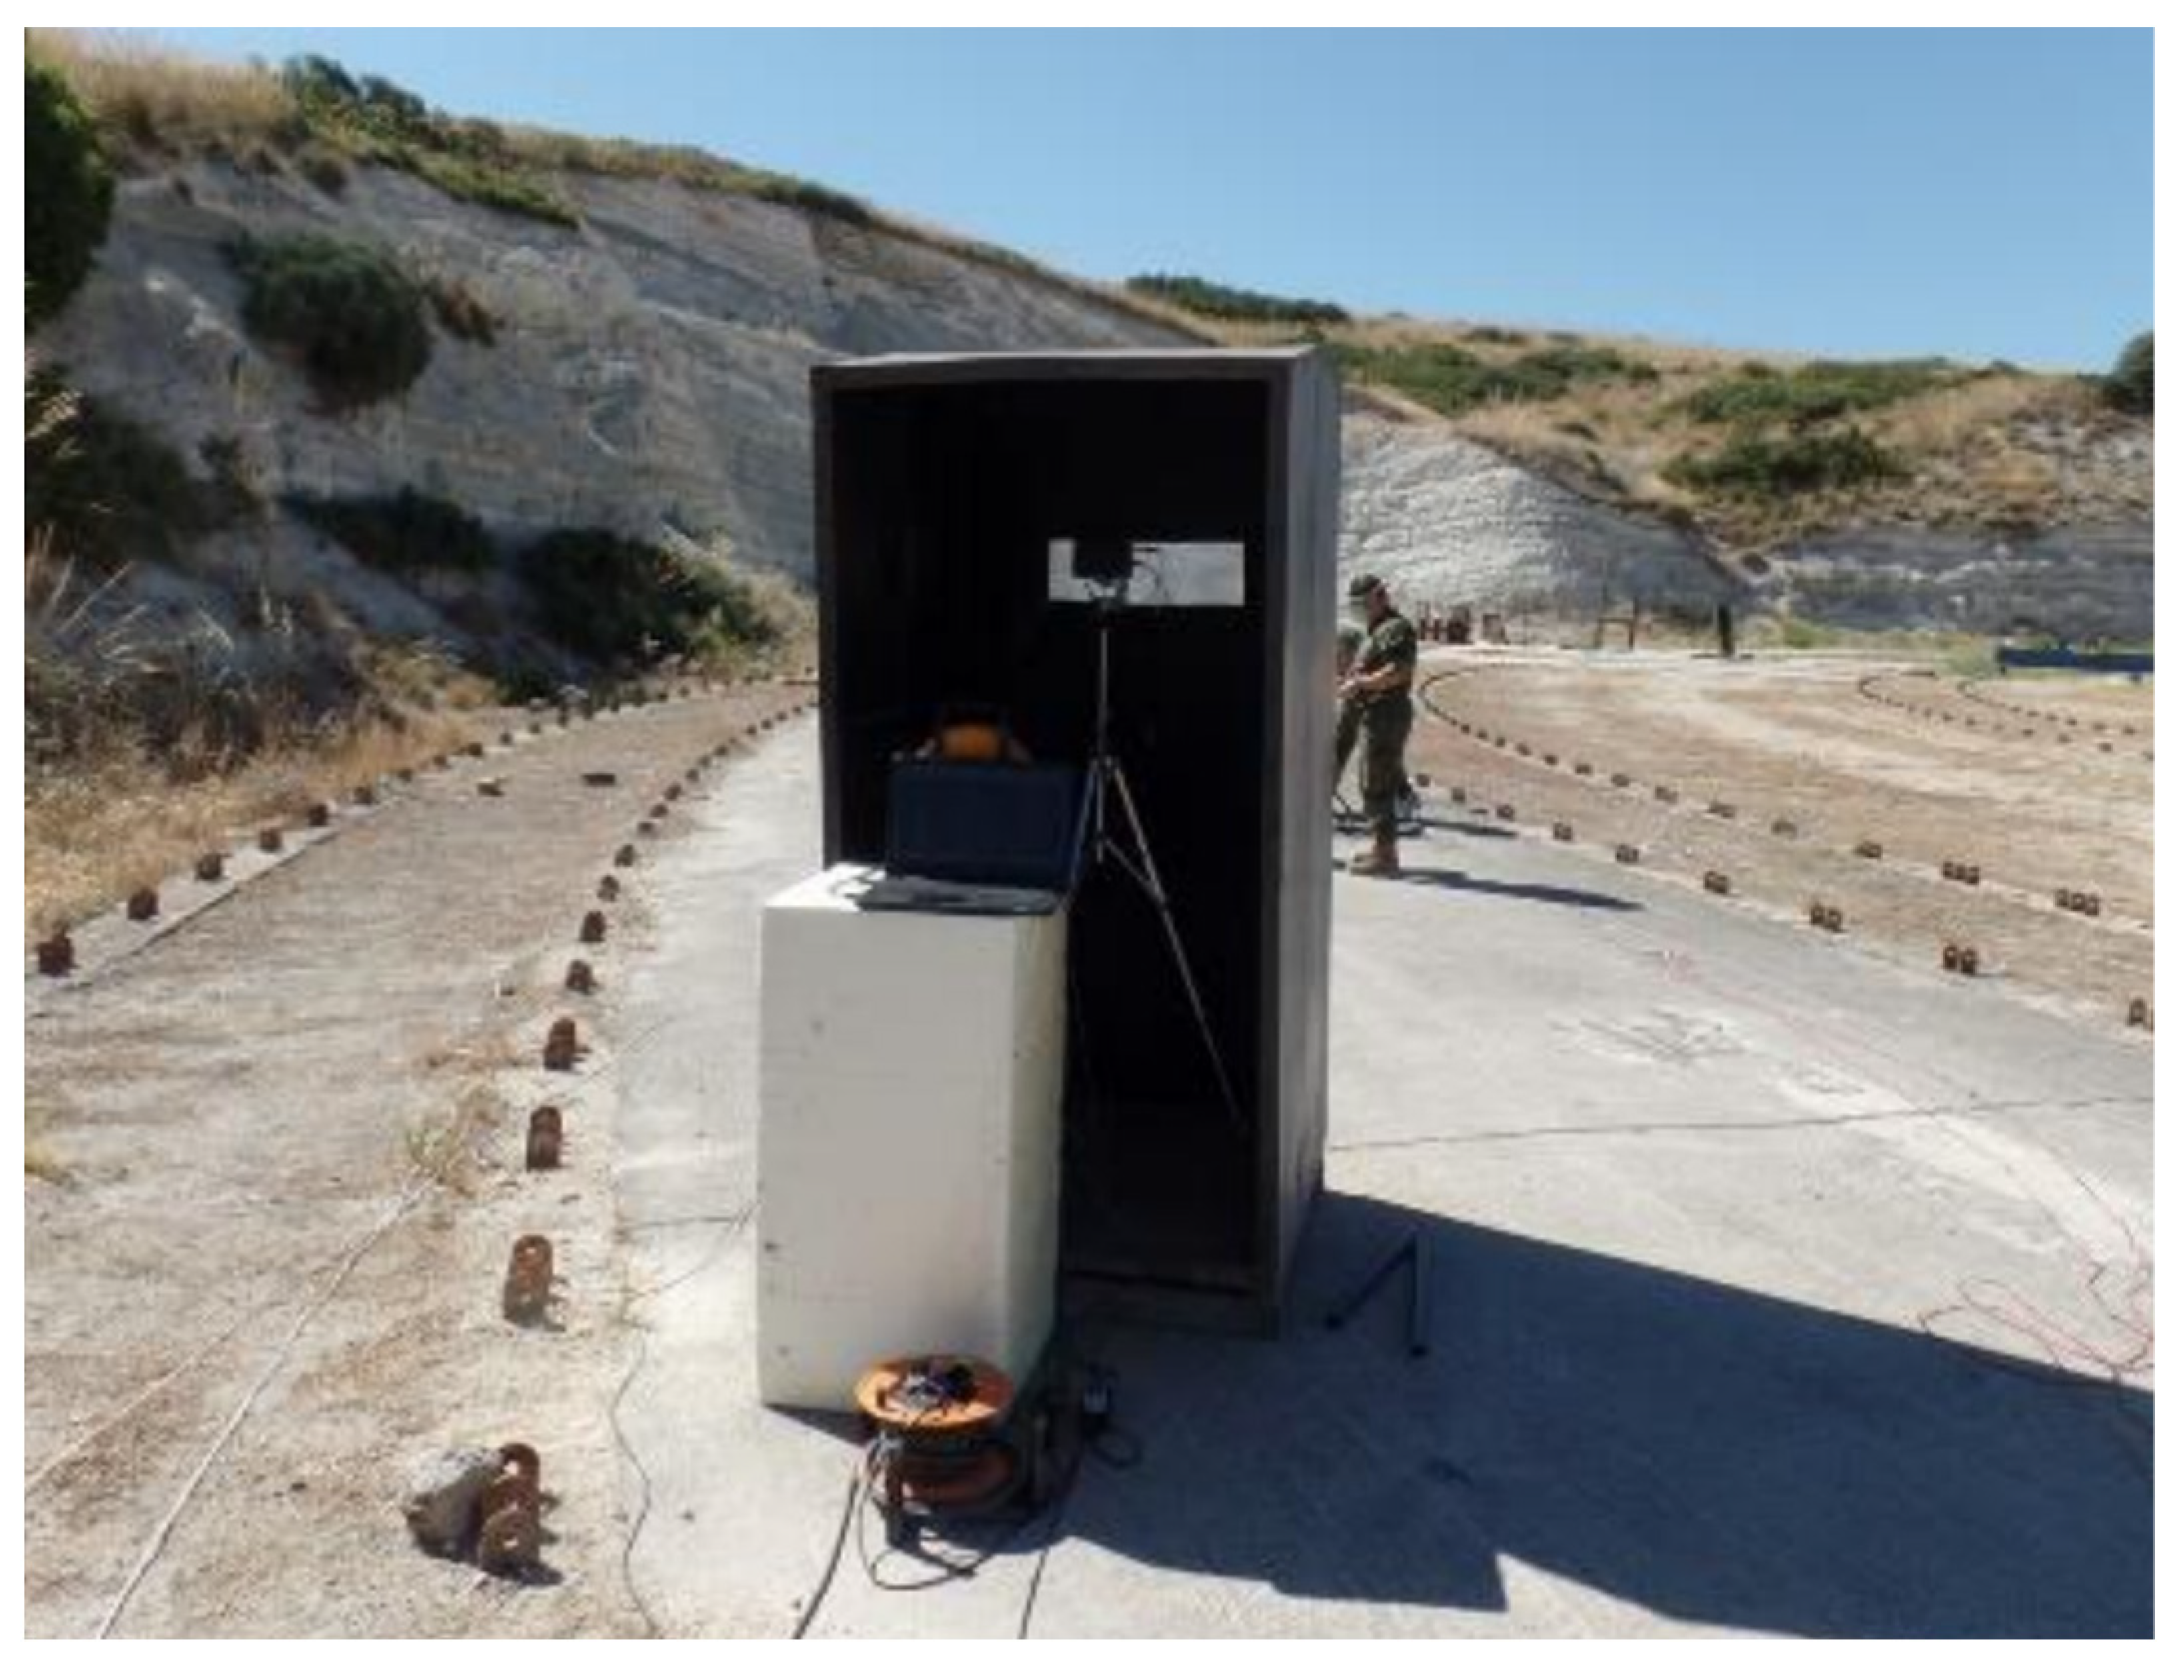
The tests have been carried out at the facilities of the Instituto Nacional de Técnica Aeroespacial (INTA) of the Ministry of Defense of Spain, with the Department of Weapons and Ballistics (Modeling and Simulation) of the aforementioned institute. For the water speed measurement, a high-speed camera (model TRI-VIT 1227) recording at 6000 fps and the software TEMA by AOStechnologies [24] were used to visualize images and measure the speed. The system with the high-speed camera was protected behind an armored box, as shown in Figure 5. TEMA uses high-speed images to measure the speed of the disk-shaped water front after detonation. To do this, it tracks points at each end of the water disk (on the left and right) in order to obtain two speed measurements for each trial. However, in the tests, the contrast of the water against the background of the images only allowed the measurement of one of the sides. Tracking the water front using the TEMA software provides a set of numerous discrete values of the average velocity of the water disk boundary displacement at very small time intervals (every 10−4 s), providing thus a graph of velocity variation with respect to time or distance. To obtain the speed value for the two levels of the distance factor (40 and 55 cm), linear interpolation between discrete values was adopted.
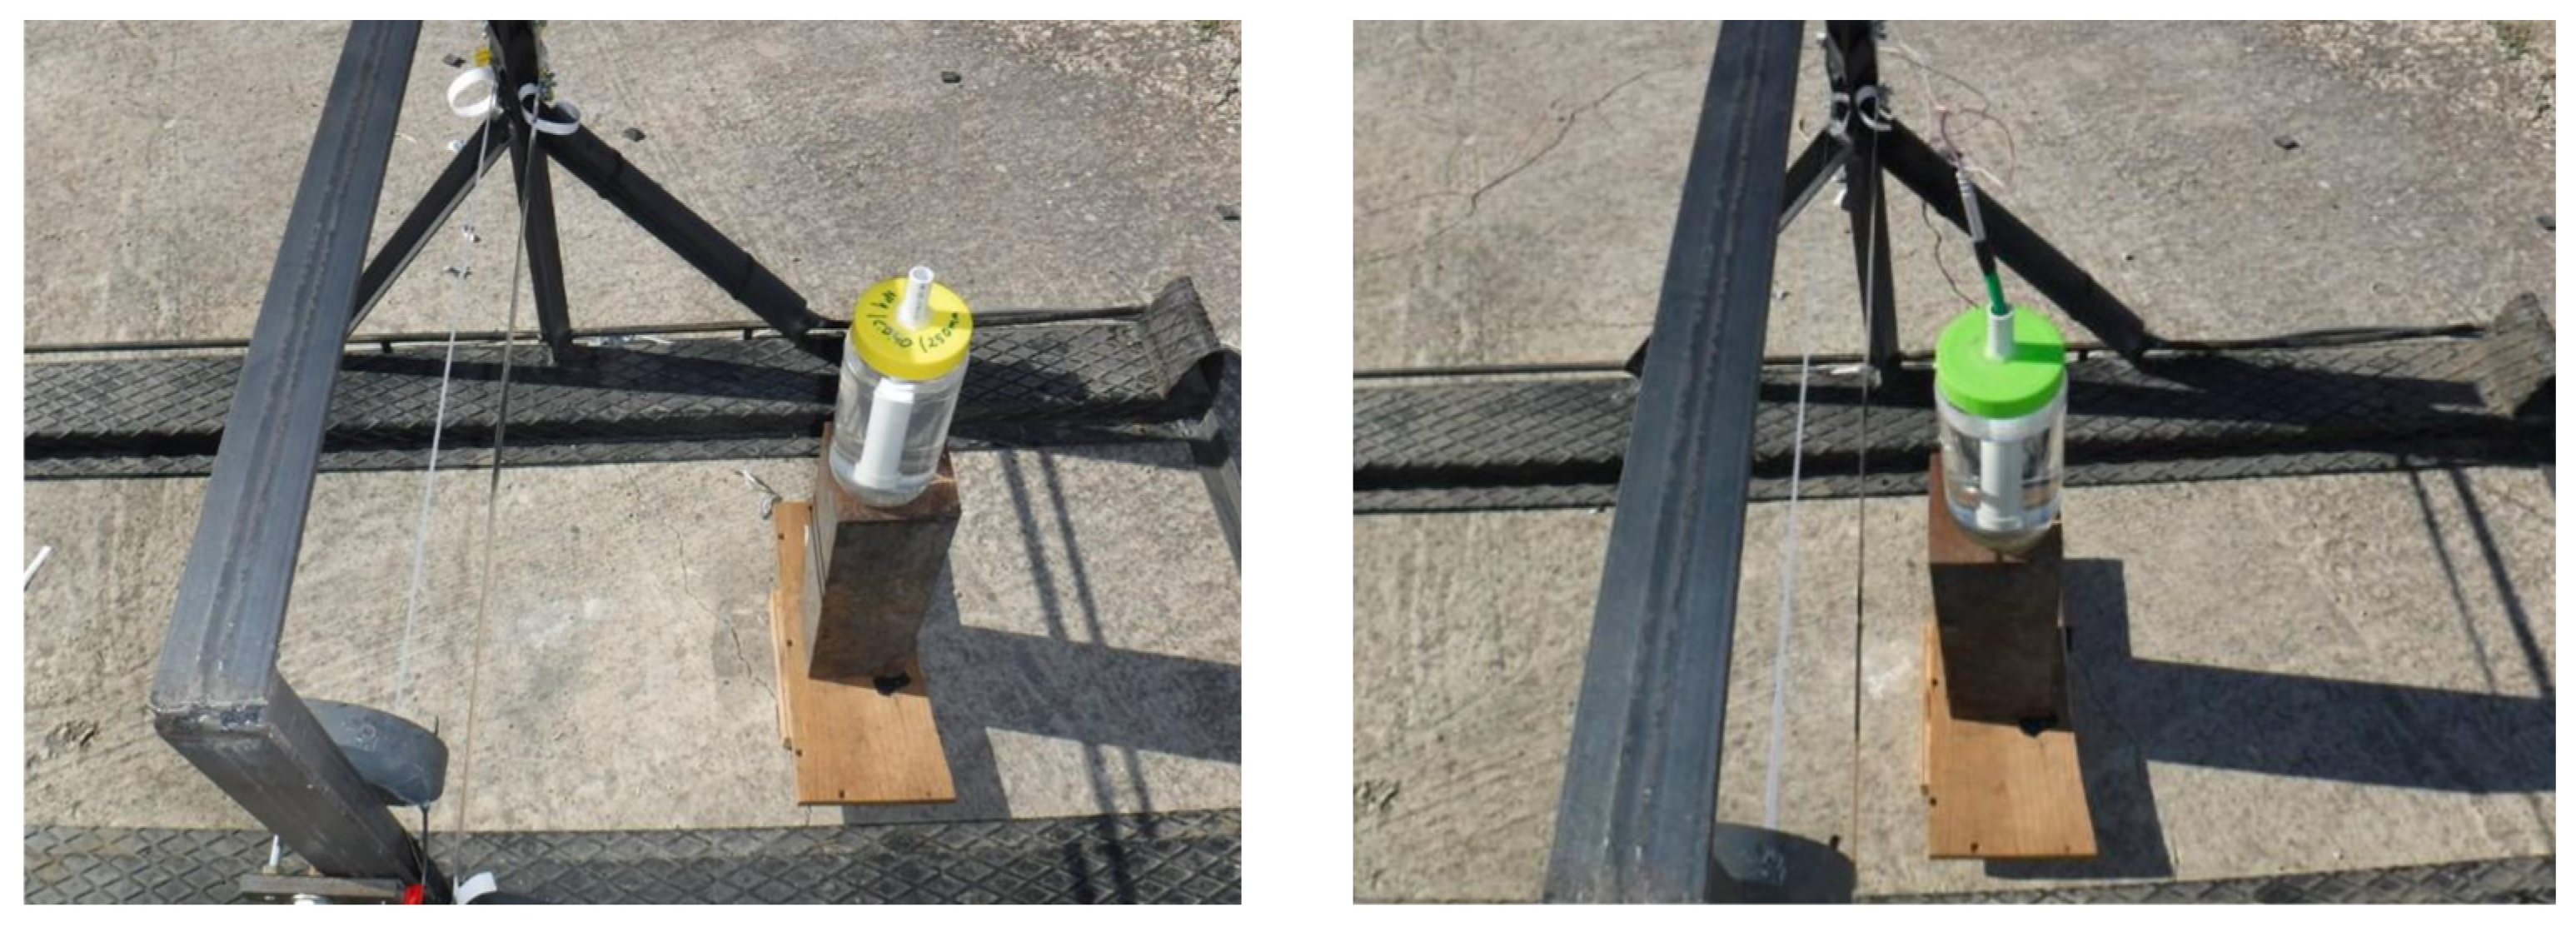
The measurement of the average speed was also carried out by means of a system formed by a frame with two parallel bands of 40 mm, which acted as two break switches (Figure 6). The breakage of each of the bands by the water front emits a signal recorded by a GN6470 data acquisition system (8 channels with a sampling rate of 250 kHz and another 8 channels sampling every 100 ns). However, during the tests, different problems arose with this system, due to errors in the signal or the interruption of the STOP band before the START band was sectioned, due to projections of the lid or the detonator ahead of the water front. Therefore, it was decided to use only the TEMA software to measure the speed of the water.

3. Results and Discussion

3.1. Experimental Tests

On the high-speed images, the same phenomena can be seen for all 16 tests (for the sake of conciseness, only images from test number 1 are shown in Figure 7): it is observed how the explosion of the detonator and the portion of the detonating cord attached to it, both being outside the cylinder by approximately 2 cm, generate intense light. Later, part of the gas resulting from the detonation is seen exiting the mouth of the inner tube that houses the explosive. This forms a dark cloud that remains above the device (Figure 7c). The high pressure of the gases generated by the explosion propels the water and increases its temperature. In this process, the water is partially vaporized and accelerated at high speed. The high-speed images (Figure 7 and Figure 8) show that the mobilized water creates a white lens or disk shape that expands. Although the product gases propel the water in an omnidirectional way, the predominant projection direction is radial to the axis of the cylinder, and part is also projected upwards in the direction parallel to the axis (detailed in Figure 8). This is due to the reflection produced at the base of the device when being in contact with a solid surface.

3.2. Discussion

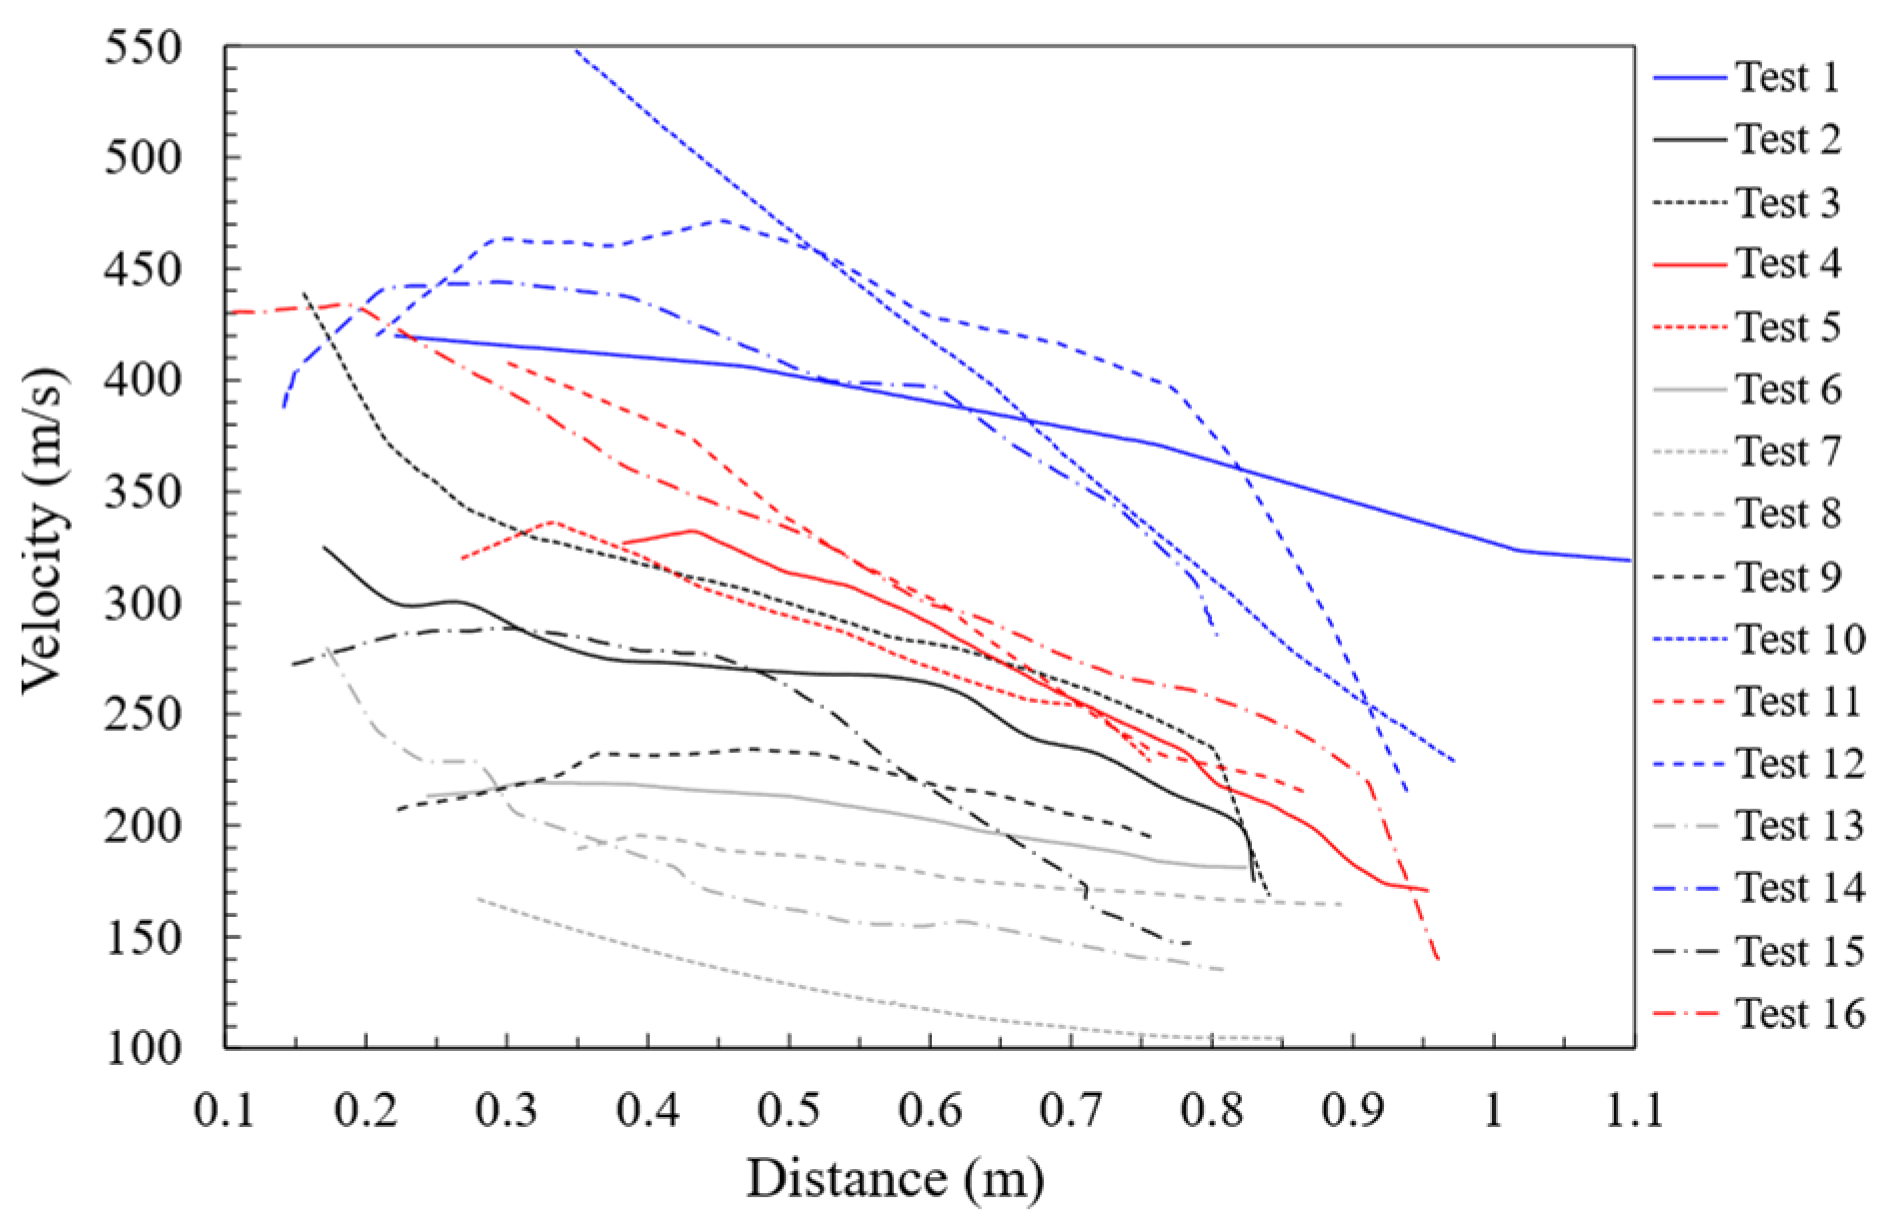
TEMA tracks the water front position with time and provides the evolution of the velocity with respect to time, which can be straightforwardly processed together with the images to obtain the evolution of the velocity with respect to the distance traveled by the front of water. For the set of 16 tests, the velocity curves versus distance are represented in Figure 9. In the velocity curves, we observe, first of all, descending velocity with distance, as would be expected as the water front increases in size. It is difficult to draw conclusions from the tangle of curves, until they are depicted in colors grouped according to the cylinder diameter and mass of explosive, following Table 2: blue for 86 mm and 40 g/m, respectively; black for 86 mm and 20 g/m; red for 105 mm and 40 g/m; and grey for 105 mm and 20 g/m. In such a way, we can qualitatively observe that the curves are somewhat grouped according to these two parameters. However, in order to quantitatively assess the importance of these factors, a statistical analysis must be performed.
Taking into account that the factor related to the position of the IED, as explained in Section 2.2.4, is the distance from the cylinder to the IED, it is necessary to obtain the value of the water velocity for a distance of 40 cm or 55 cm, depending on Table 2. These values are interpolated in the curves from Figure 9. Results are presented in Table 4.
For data analysis, Minitab17 is used [25]. In order to observe the influence of the factors and interactions (model terms) and the probability of randomness in their influence on the response, an ANOVA test is carried out. It should be borne in mind that, if all the terms of the model are included (all factors and interactions), the degree of freedom D f of the residual error is 0 (the model is saturated) and no data are obtained in relation to the F-value or p-value [25]:
D f ( r e s i d u a l   e r r o r ) = D f ( M o d e l )   D f ( f a c t o r s   a n d   i n t e r a c t i o n s ) = 15 15 = 0
If the D f of the residual error is 0, then the Mean Squared Error (MSE), which, by definition, is M S E = S S ( r e s i d u a l   e r r o r ) / D f ( r e s i d u a l   e r r o r ) , cannot be calculated. In turn, it is impossible to calculate the F-value of each of the terms given that
F t e r m = Term   mean   square Mean   square   of   residual   error = M S M S E
Then, to obtain statistical values, a stepwise analysis is applied, starting with an empty model in which the most significant factor or interaction of factors obtained in a previous analysis is incorporated. In this way, we obtain the result shown in Table 5. From the analysis, it is obtained that the “Explosive Specific Mass” factor is the most significant because it has the highest F-value (F-value = 139.97), followed by “Diameter” (F-value = 39.85), and by the interaction of “Explosive Specific Mass” and “Density” (F-value = 6.02), the interaction of “Diameter” and “Inner Tube” (F-value = 4.46), “Density” (F-value = 0.44), and, finally, by the “Inner Tube” (F-value = 0.23). Furthermore, the factor “Distance” is discarded because the purpose is to identify a useful subset of terms [25]. The fact that the distance between 40 and 55 cm is not significant is a positive conclusion of the study, because this indicates that the operator does not need to be concerned when placing the device in front of the IED, at least within this range of distances. In future work, this range of distances will be increased to identify the limits of this behavior.
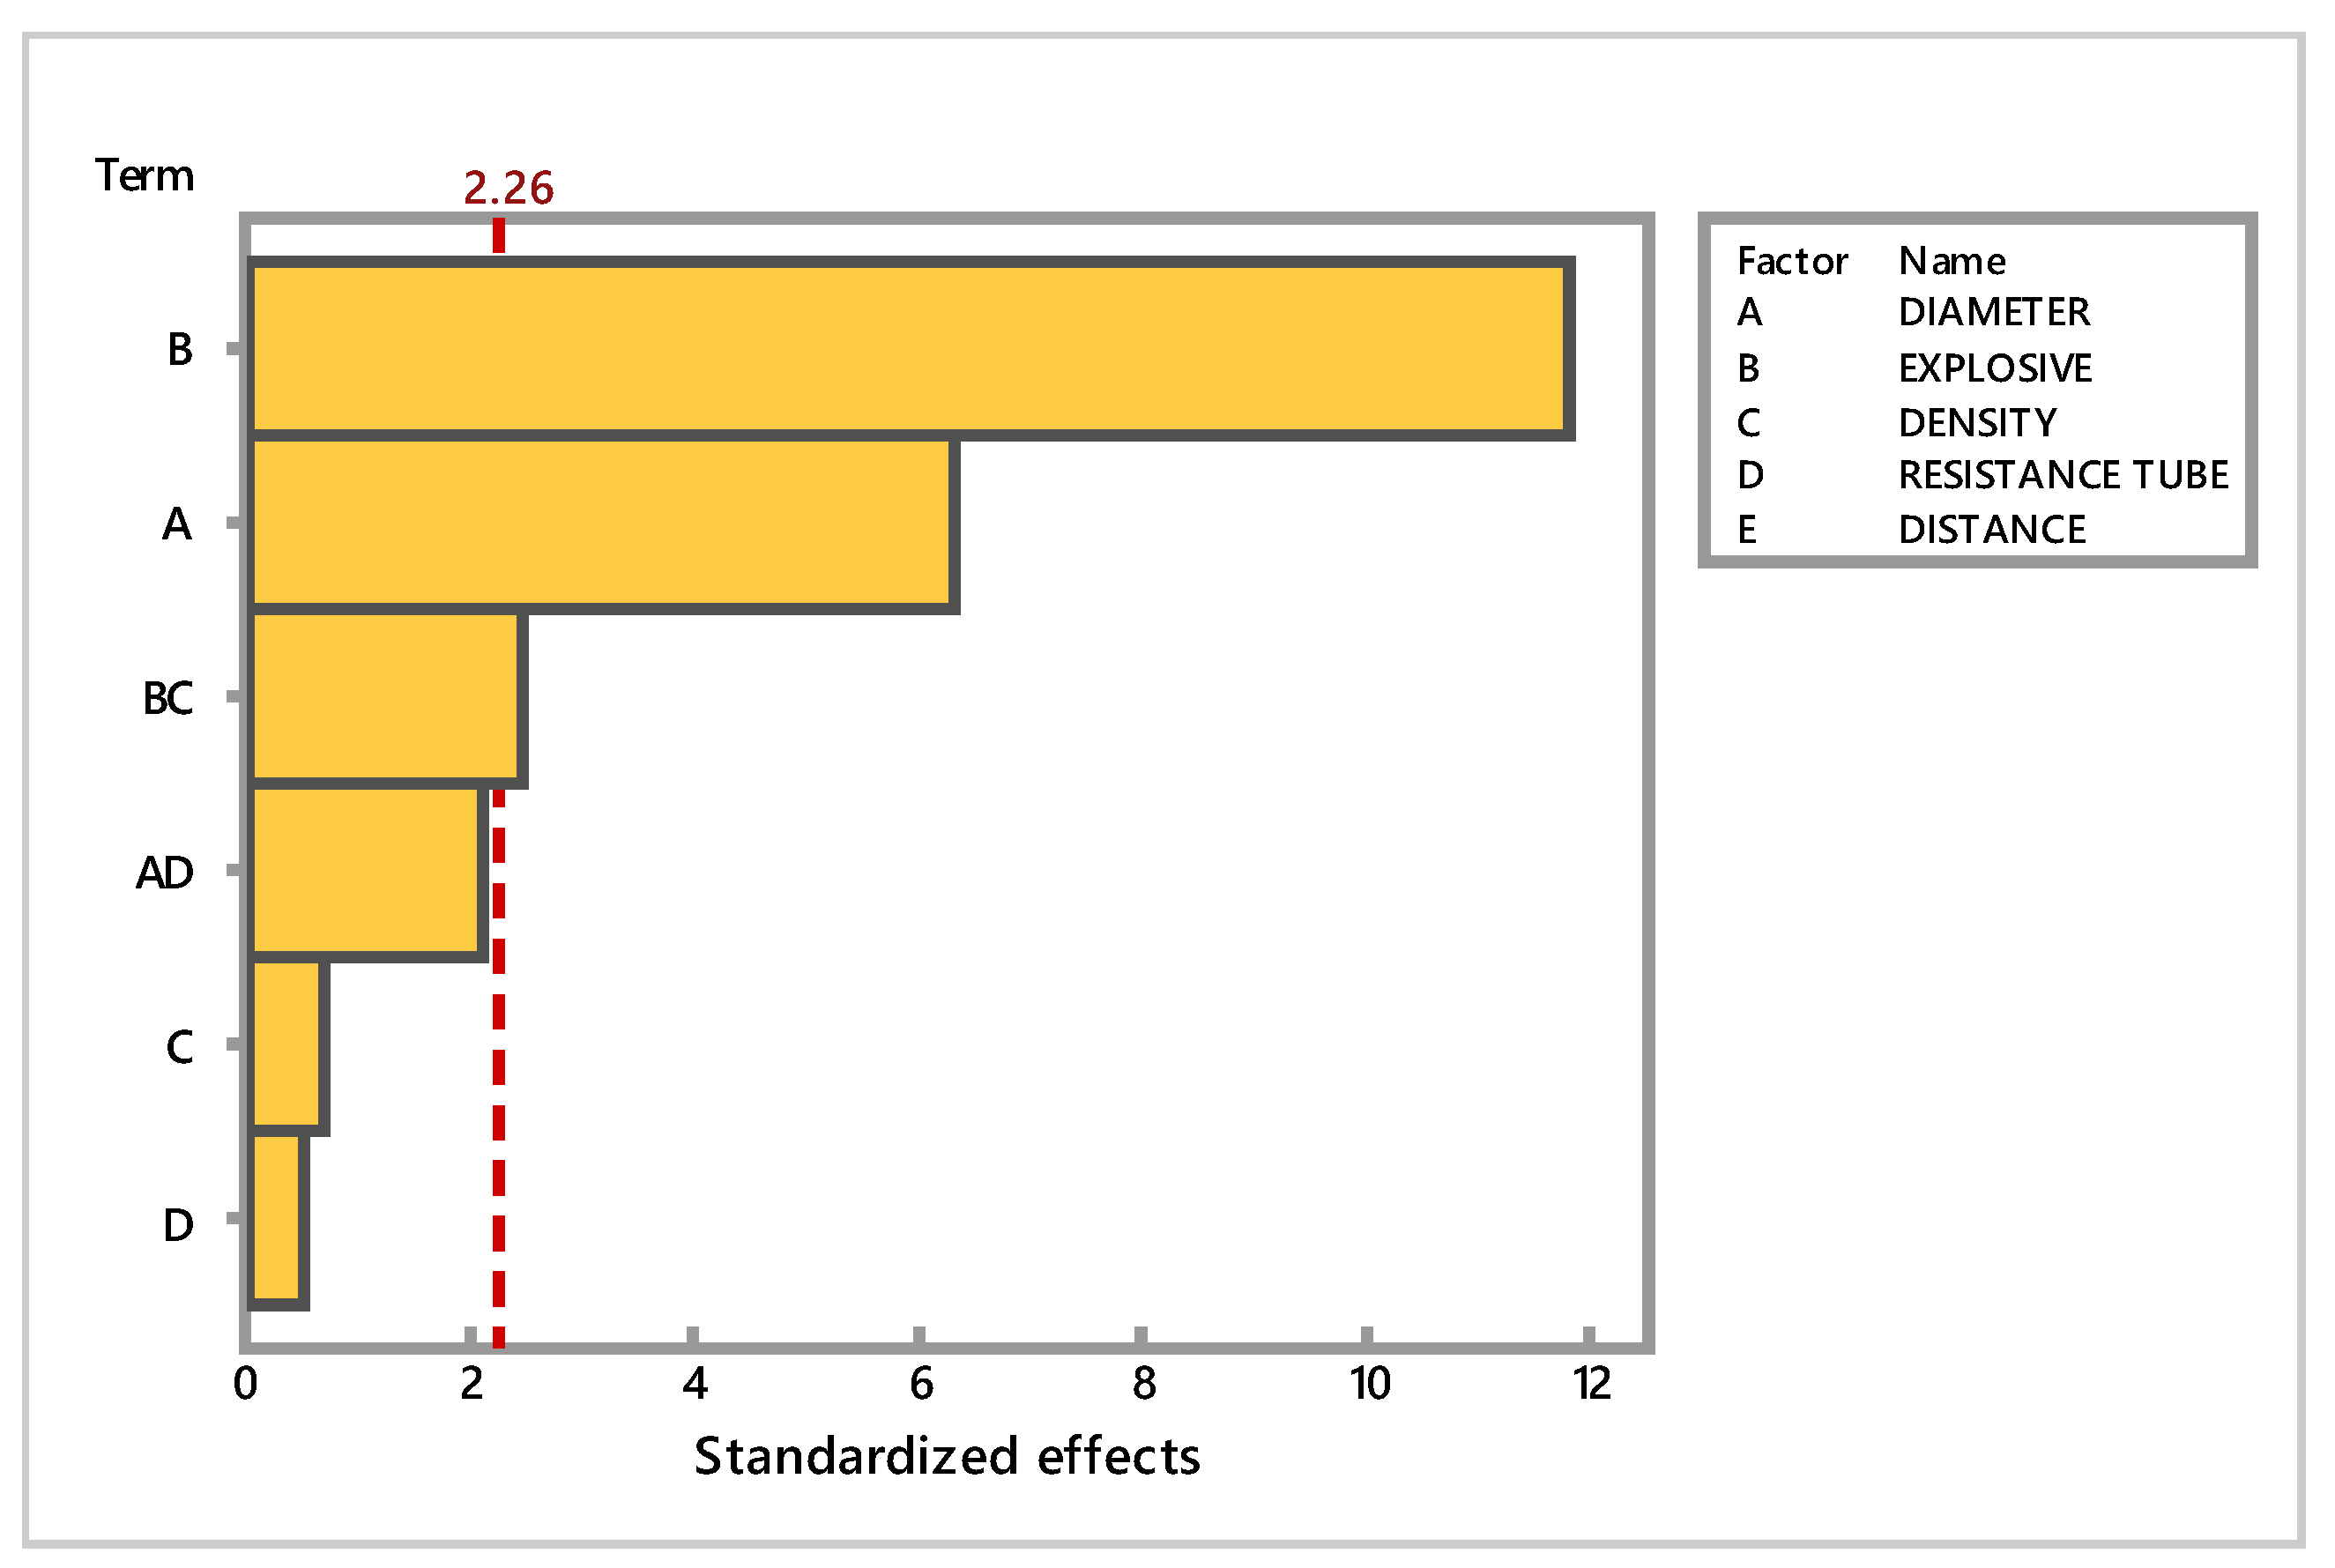
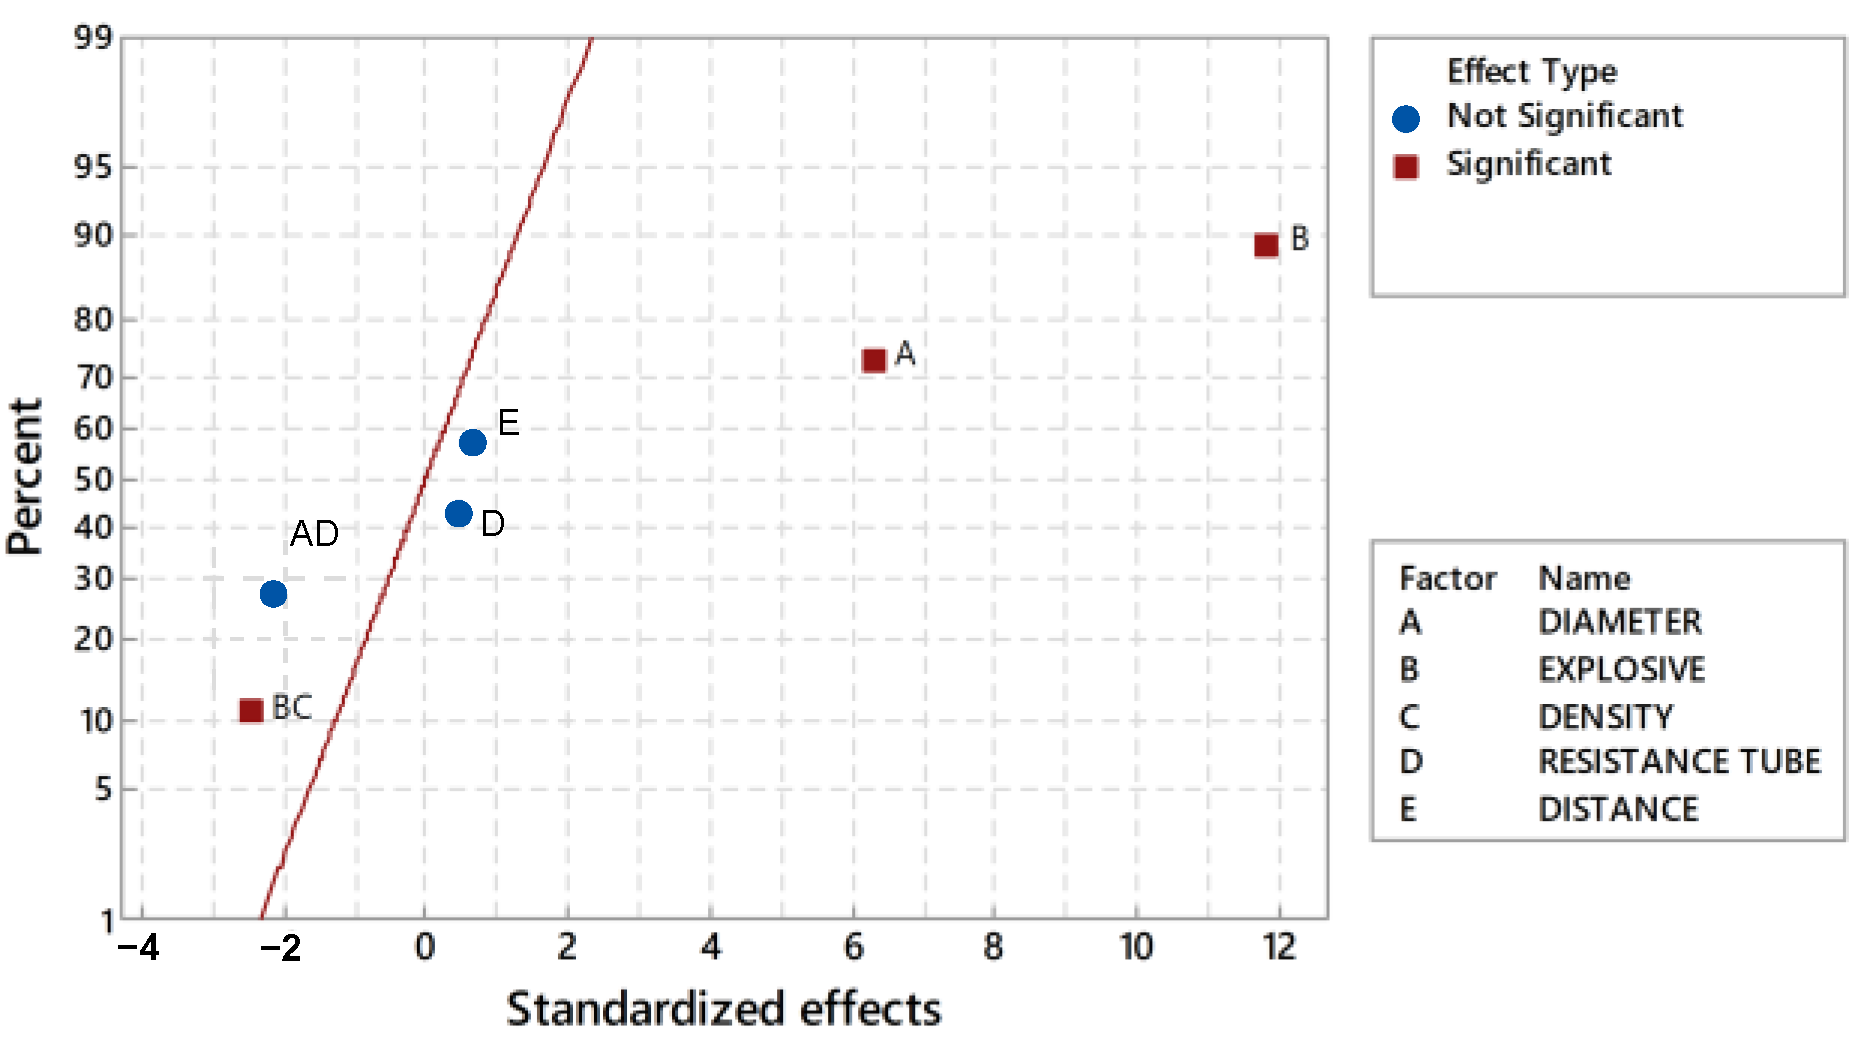
As a result of the previous factor selection, values of the adjusted R-squared and R-squared predictor of 92.50% and 85.78%, respectively, are obtained. In the Pareto diagram in Figure 10, the importance of each factor or interaction is observed, and the normal graph of standardized effects (Figure 11) indicates whether the factor or interaction positively or negatively affects the response: a fitted distribution line for effect values close to zero divides the graphic into two parts, so that the factors or interactions farthest away will be the most significant, with those that positively influence it on the right margin, and those that negatively influence it on the left margin.
The outcomes of the hypothesis test show that the factors “Explosive Specific Mass” and “Diameter”, and the interaction between “Explosive Specific Mass” and “Density”, have a p-value < 0.05, so the null hypothesis is rejected and therefore it is accepted that there is a relationship between them and the response variable (water velocity). In other words, there is reliability in accepting its significance. The interaction between “Diameter” and “Resistance Inner Tube”, with a p-value = 0.064 (which is close to the level of significance of 0.05) and with an F-value of 4.46, should not be ruled out, and it will be taken into account in future research.
Figure 12 and Figure 13 show the plots of the main effects and the most significant interactions. Figure 12 (left) represents the main effects plot for “Diameter” and “Mass of Explosive” effects. The better or worse fit of the factor line to the midline of the response is interpreted as a lesser or greater effect, respectively. The greater the slope, the greater the effect on the response variable. To analyze how the adjusted response of the two main factors is related, contour graphs are used (Figure 14), offering a two-dimensional view of the contour lines for the same response. The figure reveals how, at high levels of both variables, the velocity is high, and it is also possible to observe that with a small diameter or with little explosive, velocities of the order of 300–350 m/s can be achieved.
It is clear that the greater the amount of explosive, the greater the energy and, also, with a smaller diameter of the device, the mass of water to be displaced will be less, which will translate into the superior speed of the water. However, the deactivator does not always wish to achieve the highest speed of the water front: this will depend on the target to be hit. In other words, the velocity needed will depend on the size, mass of the IED, and its construction characteristics, such as the impact resistance of its case (a backpack, a pot, a plastic bag, etc.). In fact, in previous works, such as the patent by Alford [7], a device has been proposed that can hold up to three different amounts of explosive, depending on the effects that the deactivator wishes to achieve. However, in the previous work, the relationship between these two variables and the velocity reached by the water was not known: the novelty of the present research also lies in providing a relationship between the mass of explosive to be used and the diameter of the container to obtain a certain velocity, in the form of a regression equation valid for the range of study. It will be interesting to expand this range in future studies in order to determine in which proportions of “Mass of Explosive”–“Diameter” the effectiveness is lost, either because this ratio is very high or very low, thus providing an additional tool for the operator to calibrate the optimal device, based on the IED to be deactivated. Moreover, another topic of study would be the minimum velocity of the water front necessary to penetrate different materials.
In Figure 12 (right), the interaction plot of “Mass of Explosive” and “Density” is depicted. A high level of “Mass of Explosive” improves the response with a low level of water density, finding the optimum combination at the cut-off point of the lines. If we take into account that a high density of water will make it more incompressible, this contrasts the results obtained with the numerical simulation method by Petrenko [13], where it was concluded that “calculations for an incompressible fluid yield higher values of pressure and velocity”. The results of DoE also contrast the recommendation given in [7], where it is mentioned that it is advisable to use water with additives that lower the freezing point. However, according to the experiments, we found that the latter is not recommended to obtain a higher water speed, as long as the additive increases the density.
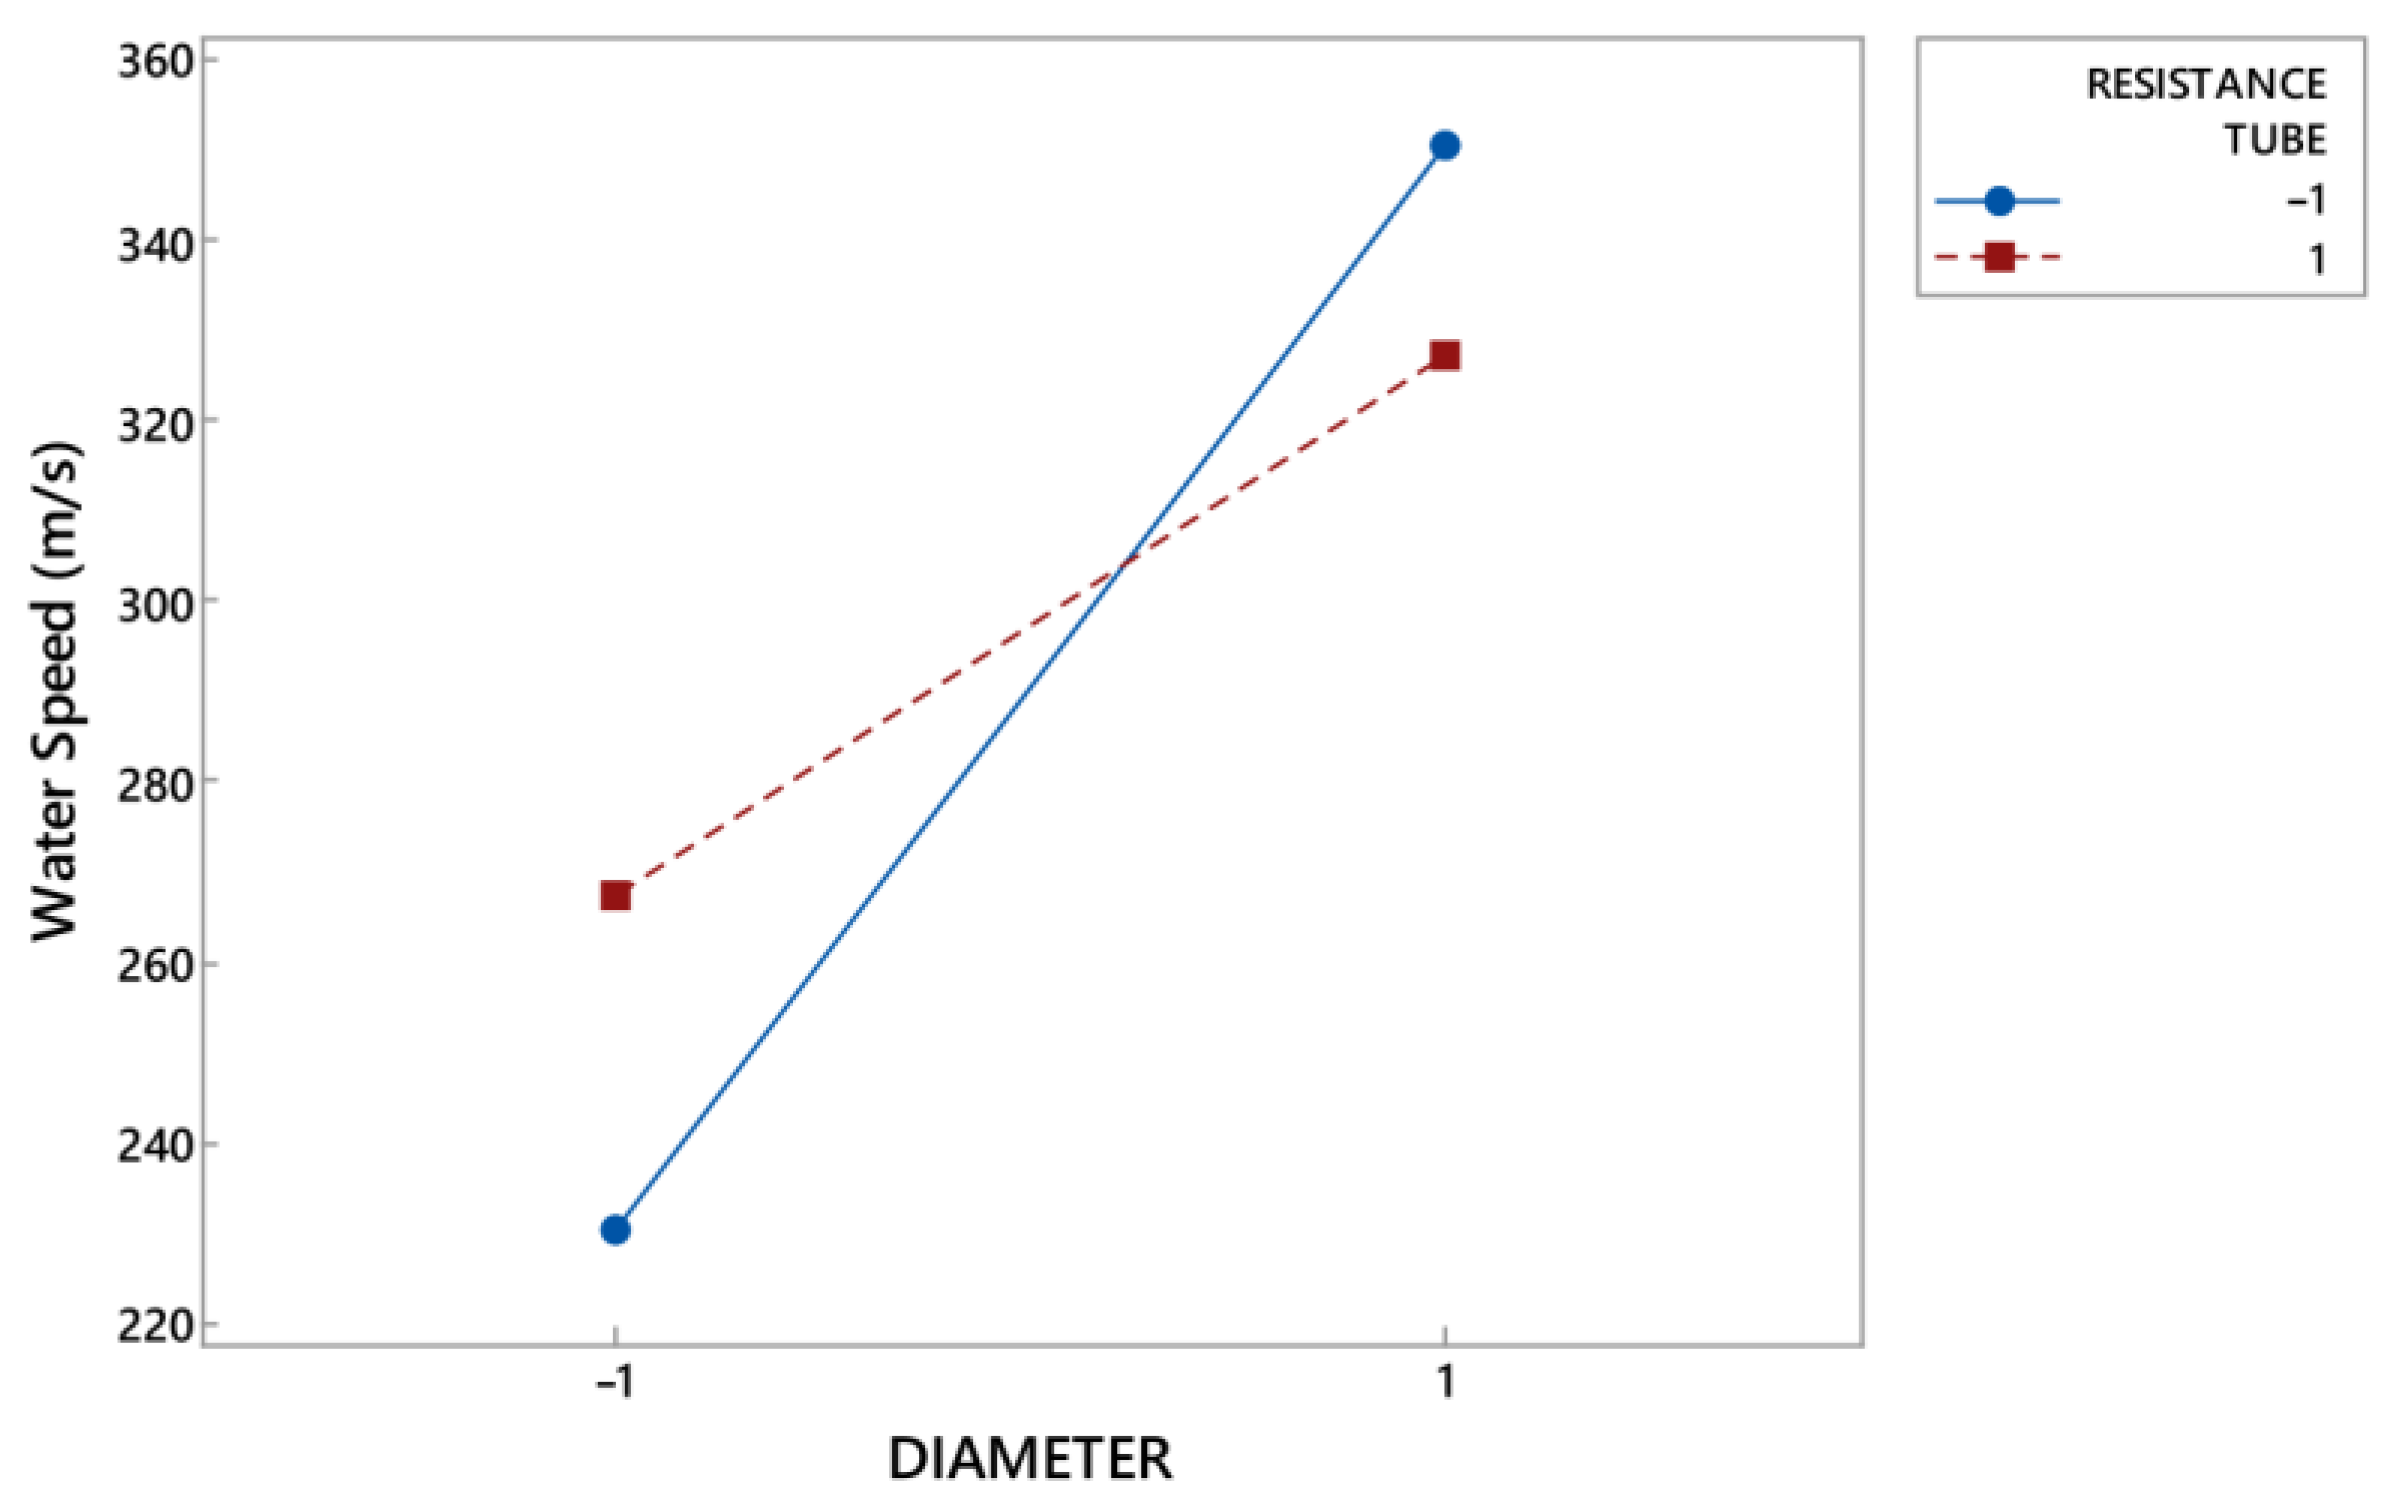
The interaction between the “Diameter” and “Resistance of the Inner Tube”, plotted in Figure 13, indicates that a combination of a low level of one factor improves the response with a high level of the other. This can be related to the good operation of an explosive, maintaining the confinement of the gases [22], either by the presence of the water wall (related to the diameter) or by the resistance of the inner tube. However, excessive resistance due to the combined effect of a large diameter with high inner tube resistance can cause a loss of gases through the upper part of the device and, thus, a lower velocity of the projected water front.
Finally, the analysis of the residuals allows us to demonstrate the goodness of the model, since the residuals follow a normal distribution (Figure 15, left). In addition, they present a constant variance with the variation of the response variable, without following a defined pattern and without outliers (Figure 15, right), where standardized residual errors are considered outliers with a value greater than 2 or less than −2.

Regression Equation

The final purpose of this study is to obtain a mathematical model in the form of a regression equation, establishing a relationship between the predictors and the response, with values of the model terms comprised between the established levels. The regression equation obtained for the response variable (water projection velocity) as a function of the most significant factors and interactions is the following:
v = 294.5 + 84.36 · B + 45.01 · A 17.50   B C 15.06 · A D + 4.72 · C + 3.43 · D
where v is the speed in m·s−1; A , B , C , and D are the values of the defined levels for “Diameter”, “Explosive Specific Mass”, “Density”, and the “Resistance of the Inner Tube”, respectively. Equation (5) can be simplified, due to the low significance of factors C and D , giving the following equation:
v = 294.5 + 84.36 · B + 45.01 · A 17.50 · B C 15.06 · A D
This equation provides results with a good level of precision, despite the limited number of experiments performed. The sample size could be larger and, of course, increasing the number of trials would reduce the variability and increase the precision of the correlation shown, by reducing the error from non-controllable factors (such as wind and other atmospheric conditions, the influence of the human factor, etc.). However, this would contradict DoE’s main idea of reducing the experiments. In addition, the lack of fit test carried out on the model confirmed that p-value > α and, therefore, there is no evidence of a lack of fit. The normal probability plot of standardized residuals, shown in Figure 15 (left), confirms this evidence by showing that the residuals follow a normal probability distribution N (0, 1). Even so, a response surface design with center (quadratic) points is planned as future work, for the most influential factors determined by this study, to allow the possible curvature in the response surface to be modeled. This will allow us, in the future, to better understand or map the region of the response surface of the experiments shown in the present work, and to determine the levels of the variables that optimize the response.

4. Conclusions

This study focuses on investigating the influence of certain factors on the effectiveness of devices against IEDs by the omnidirectional projection of water through explosives—specifically, how these factors influence the velocity of the projected water front. There is a significant lack of information in the literature on these devices, which, however, are widely used by EOD units around the world and, in many cases, even manufactured by the technicians themselves.
The factors that have been analyzed are the diameter of the device, the amount of explosive, the density of the water, the resistance of the inner tube containing the explosive, and the influence of the distance at which this device is located from the IED. For this, an experimental campaign is undertaken with planning based on DoE, and the results are analyzed through statistical analysis using ANOVA.
From the considered factors, the study shows that the most relevant are the specific mass of the explosive and the diameter of the device. It is concluded that the greater the quantity of explosive and the smaller the diameter, the greater the speed of the water front, for the range of values that have been tested. A relationship between the mass of explosive and the amount of water to be displaced according to the desired water velocity is also offered for the deactivator, considering, for future work, to expand this range and obtain a response surface. Especially remarkable is the interaction that is observed between factors such as the specific mass of the explosive and the density of the water, which exert a positive influence when these factors are combined with opposite levels, concluding that it is not advisable to increase the density of the water with salts if a higher velocity is desired. In addition, although less significant, but not negligible, the study shows the influence of the interaction between the diameter and the resistance of the inner tube, also positively influencing the velocity response, with a combination of opposite levels of these two effects. This interaction may be closely related to the effect that the degree of confinement of the detonation gases has on the detonation performance, and it will be investigated in an ad hoc study. Finally, the distance between the device and the IED has not been found to have a great influence, at the studied range. From this, it is concluded that the effectiveness of the device is not affected by slightly varying the relative position between them. All these data offer important considerations to take into account when designing or manufacturing this type of device, in order to obtain greater performance in its objective, which is none other than safely deactivating a bomb.

Author Contributions

Conceptualization, J.F.R.-G. and J.S.-V.; methodology, J.F.R.-G.; software, I.G.G.; formal analysis, J.S.-V.; investigation, O.d.F.O. and R.J.P.; data curation, J.F.R.-G. and I.G.G.; writing—original draft preparation, R.A.O.-M. and J.F.R.-G.; writing—review and editing, R.A.O.-M., J.S.-V., O.d.F.O. and R.J.P.; supervision, J.S.-V. and R.A.O.-M.; project administration, R.J.P. All authors have read and agreed to the published version of the manuscript.

Funding

This work was supported by the Cuerpo Nacional de Policía and Centro Universitario de la Defensa de Zaragoza (grant number: CUD2020-21).

Institutional Review Board Statement

Not applicable.

Data Availability Statement

Not applicable.

Conflicts of Interest

The authors declare no conflict of interest. The funders had no role in the design of the study; in the collection, analyses, or interpretation of data; in the writing of the manuscript; or in the decision to publish the results.

References

  1. Institute for Economics and Peace. Trends in Terrorism; Institute for Economics and Peace: Sydney, Australia, 2018. [Google Scholar]
  2. United Nations Mine Action Service (UNMAS) United Nation Improvised Explosive Device Disposal Standars. 2018. Available online: https://unmas.org/sites/default/files/un_iedd_standards.pdf (accessed on 10 December 2022).
  3. Centro Superior de Estudios de la Defensa Nacional. La Seguridad Frente Artefactos Explosivos. 2009. Available online: https://tienda.boe.es/detail.php?id=9788497815314 (accessed on 10 December 2022).
  4. Africa Center for Strategic Studies. 2021. Available online: https://africacenter.org/spotlight/drones-and-violent-nonstate-actors-in-africa/ (accessed on 15 December 2022).
  5. Gil, E.A. El Futuro Del Terrorismo Nuclear En La Táctica De Los Actores Individuales. Revista Insituto Español Estudios Estratégicos 2018, 12, 46–76. [Google Scholar]
  6. Liu, J.-q.; Gu, W.-b.; Lu, M.; Xu, H.-m.; Wu, S.-z. Formation of explosively formed penetrator with fins and its flight. Def. Technol. 2014, 10, 119–123. [Google Scholar] [CrossRef] [Green Version]
  7. Alford, S. Explosives. EEUU Patent US 9,322,624 B2, 26 April 2016. Available online: https://patents.justia.com/patent/9322624 (accessed on 10 December 2022).
  8. Cherry, C.R. Fluid-filled bomb-disrupting apparatus and method. U.S. Patent US6269725B1, 2001. [Google Scholar]
  9. Geneva International Centre For Humanitarian Demining. Improvised Explosive Device Clearance Good Practice Guide; Geneva International Centre For Humanitarian Demining: Geneve, Switzerland, 2020. [Google Scholar]
  10. Enache, C.; Trană, E.; Rotariu, T.; Rotariu, A.; Ţigănescu, V.T.; Zecheru, T. Numerical Simulation and Experimental Tests on Explosively-Induced Water Jet Phenomena. Propellants Explos. Pyrotech. 2016, 41, 1020–1028. [Google Scholar] [CrossRef]
  11. Radomski, M. Stability Conditions and Interior Ballistics of Recoilless Projected Water Disruptor. Propellants Explos. Pyrotech. 2014, 39, 916–921. [Google Scholar] [CrossRef]
  12. Parate, B.A.; Chandel, S.; Shekhar, H. An experimental and numerical aproach characterisation of power cartridge for water-jet application. Defecnce Technol. 2018, 14, 683–690. [Google Scholar] [CrossRef]
  13. Petrenko, O. Investigation of Formation and Applications of High-Speed Liquid; Digital Commons New Jersey Institute of Technology: Newark, NJ, USA, 2007. [Google Scholar]
  14. Petrenco, O.; Geskin, E.; Semko, A.N. Mechanics of powder hydro cannon for imcompresible fluid. In Proceedings of the 2005 WJRA American Waterjet Conference, Houston, TX, USA, 21–23 August 2005. [Google Scholar]
  15. Cliff, E. What is Total Quality Control? The Japanese Way; Defensa, M.D., Ed.; Prentice Hall: Hoboken, NJ, USA, 1985; pp. 38–47. [Google Scholar]
  16. Montgomery, D.C.; Runger, G.C. Applied Statistics and Probability for Engineers; John Wiley & Sons: Hoboken, NJ, USA, 2011. [Google Scholar]
  17. Whitcom, P.J. DOE Simplified: Practical Tools for Effective Experimentation; Productivity Inc.: Portland, OR, USA, 2007. [Google Scholar]
  18. Mongomery, D. Statistical Quality Control: A Modern Introduction, 7th ed.; John Wiley & Sons: Hoboken, NJ, USA, 2013. [Google Scholar]
  19. Engel, T.; Reid, P. Physical Chemistry; Pearson: Harlow, UK, 2014. [Google Scholar]
  20. Semko, A.N.; Rusanova, O.A.; Kazak, O.V.; Beskrovnaya, M.V.; Vinogradov, S.A.; Gricina, I.N. The use of pulsed high-speed liquid jet for putting out gas blow-out. Int. J. Multiphysics 2015, 9, 9–20. [Google Scholar] [CrossRef]
  21. Lide, D.R. Handbook of Chemistry and Physics, 90th ed.; Crc Press: Boca Raton, FL, USA, 2010. [Google Scholar]
  22. Alonso, J.B.; Herbert, H. Perforación y Voladuras de Rocas en Minería; Universidad Politécnica de Madrid: Madrid, Spain, 2013. [Google Scholar]
  23. Locking, P. TNT equivalence, berthelot theory and the traulz lead block test. In Proceedings of the 32nd International Symposium on Ballistics, Reno, NV, USA, 8–13 May 2022. [Google Scholar]
  24. TEMA Starter—Aostechnologies. Available online: https://www.aostechnologies.com/high-speed-cameras/software-solutions/tema-starter/ (accessed on 27 September 2021).
  25. Minitab Web Site. Available online: http://www.support.minitab.com (accessed on 27 September 2021).
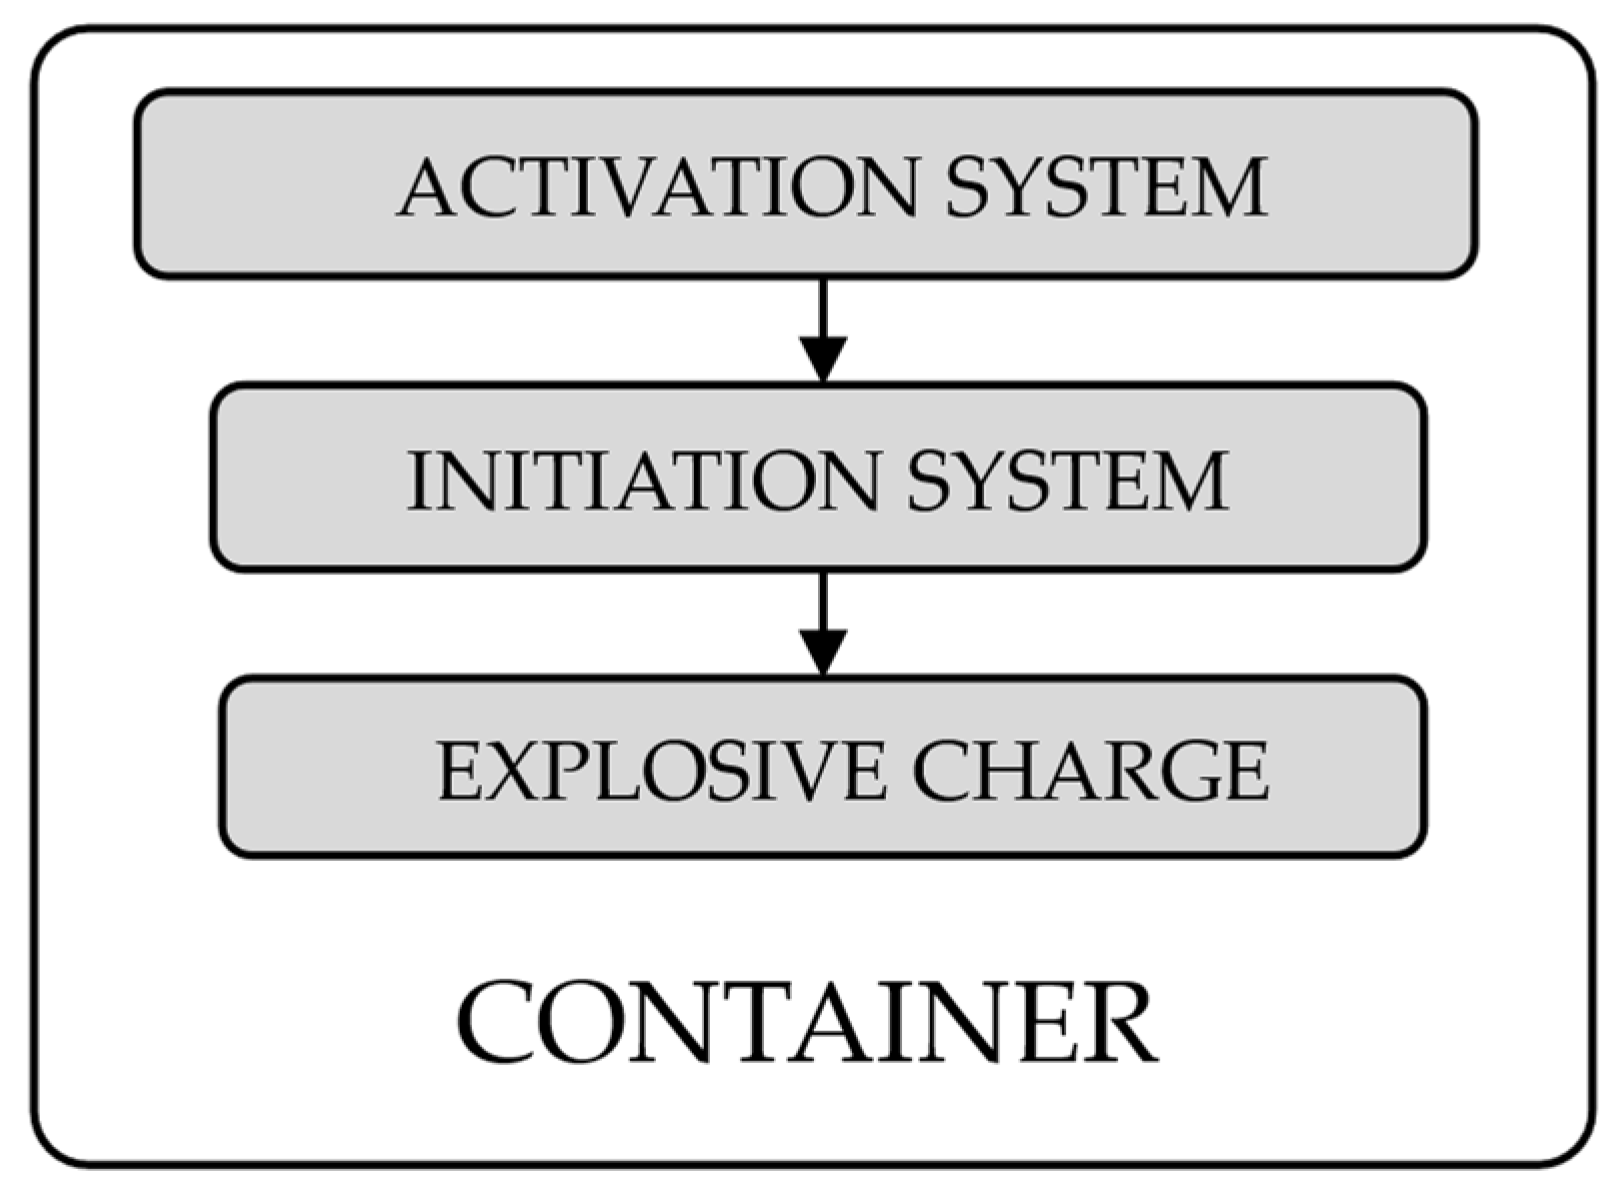
Figure 1. Basic elements of an IED.
Applsci 13 01167 g001
Figure 2. Basic sketch of the omnidirectional water projection device.
Applsci 13 01167 g002
Figure 3. Ishikawa diagram of factors that influence the case study.
Applsci 13 01167 g003
Figure 4. Four different types of bottle devices used in the experiments: (a) Ø 86 mm and PP inner tube; (b) Ø 105 mm and PVC inner tube; (c) Ø 86 mm and PVC inner tube; (d) Ø 105 mm and PP inner tube.
Applsci 13 01167 g004
Figure 5. Assembly of the measurement system with the high-speed camera, protected behind an armored box.
Applsci 13 01167 g005
Figure 6. Counter-IED loads (with and without detonator), placed next to speed measurement frame.
Applsci 13 01167 g006
Figure 7. Images of test 1 taken by the high-speed camera at 6000 fps. (a) Device prepared for detonation; (b) detonator explosion; (c) upper dark cloud formed by gases produced by the detonating cord; (d) disk of water projected by the effect of the explosion.
Applsci 13 01167 g007
Figure 8. Image of test 1. A radial disk of water and water projected vertically upwards.
Applsci 13 01167 g008
Figure 9. Experimentally measured water front velocity versus distance.
Applsci 13 01167 g009
Figure 10. Pareto diagram of absolute values of the standardized effects.
Applsci 13 01167 g010
Figure 11. Normal graph of standardized effects for a significance level α = 0.05.
Applsci 13 01167 g011
Figure 12. (Left): Main effects plot for the “Diameter” and “Mass of Explosive” effects. (Right): Interaction plot of “Mass of Explosive” and “Density”.
Applsci 13 01167 g012
Figure 13. Interaction plot of “Diameter” and “Inner Tube Resistance”.
Applsci 13 01167 g013
Figure 14. Contour plot of the effect of “Explosive Specific Mass” and “Diameter” factors over the response variable.
Applsci 13 01167 g014
Figure 15. (Left): Normal probability plot of standardized residuals. (Right): Plot of standardized residuals vs. fitted values.
Applsci 13 01167 g015
Table 1. Test matrix of the 1/2 fractional multifactorial experiment plan of 5 factors and 2 levels.
ID.2⁰2⁴Test Matrix
124816
FactorsFactors
ABCDEABCDABCD = E
000000−1−1−1−11
1100001−1−1−1−1
201000−11−1−1−1
31100011−1−11
400100−1−11−1−1
5101001−11−11
601100−111−11
711100111−1−1
800010−1−1−11−1
9100101−1−111
1001010−11−111
111101011−11−1
1200110−1−1111
13101101−111−1
1401110−1111−1
151111011111
Table 2. Design of the plan of experiments carried out.
Order Num.Diameter
(mm)
Mass of Explosive
(g/m)
Density of Water
(kg/L)
Inner Tube Resistance (Material)Distance
(cm)
186401.16PVC55
286201.00PP40
386201.16PVC40
4105401.00PVC55
5105401.16PVC40
6105201.2PP40
7105201.00PVC40
8105201.00PP55
986201.00PVC55
1086401.00PP55
11105401.16PP55
1286401.00PVC40
13105201.16PVC55
1486401.16PP40
1586201.16PP55
16105401.00PP40
Table 3. Description of the materials used.
MaterialSpecification
Polyethylene terephthalate (PET) plastic container.160 mm high × 105 mm in diameter, and screw cap.
PET plastic container.160 mm high × 86 mm in diameter, and screw cap.
PP inner tube.21 mm high × 12 mm outer diameter.
PP inner tube.21 mm high × 15 mm outer diameter.
Hot silicone for sealing and assembly of the inner tube.EVA resin, melting point 164 °F.
PVC cylinder to center the inner PP tube.15 mm × 15 mm diameter.
PVC cylinder to center the inner PP tube.15 mm × 19 mm diameter.
Detonating cord with PETN.40 and 20 g/m.
Instant insensitive electric detonators.7 mm diameter × 68 mm height, with lead trinitroresorcinate and tetracene.
Distilled water. Density: δ 1 .00 g·cm−3 at 20 °C.
A saturated solution of sodium chloride in water.Density: δ 1.16 g·cm−3 at 20 °C.
Table 4. Results of water velocity in each test.
Test N.12345678
V (m/s)396.2273.8316.2304.4318.3217.5143.0182.5
Test N.910111213141516
V (m/s)226.2441.6315.4364.1156.5432.6237.4354.8
Table 5. ANOVA results using the step-by-step method: degrees of freedom (Df), adjusted sums of squares (Adj. SS) are measures of variation for different components of the model; adjusted mean squares (Adj. MS) measures how much variation a term explains, considering the degrees of freedom.
DfAdj. SSAdj. MSF-Valuep-Value
▪ Model6155,36625,89431.830.000
▪ Linear4146,83636,70945.120.000
▪ Diameter132,41632,41639.850.000
▪ Explosive Specific Mass1113,876113,876139.970.000
▪ Density13563560.440.525
▪ Resistance Inner Tube11881880.230.642
▪ Two-Way Interaction2853042655.240.031
▪ Diameter/Resistance Inner Tube1362936294.460.064
▪ Explosive Specific Mass/Density1490149016.020.036
▪ Error97322814
Disclaimer/Publisher’s Note: The statements, opinions and data contained in all publications are solely those of the individual author(s) and contributor(s) and not of MDPI and/or the editor(s). MDPI and/or the editor(s) disclaim responsibility for any injury to people or property resulting from any ideas, methods, instructions or products referred to in the content.