Abstract
The design of fungicides is a central topic in agricultural chemistry. In this manuscript, it is shown how the Superposition of Significant Interaction Rules (SSIR) method can serve the generation of new potentially active molecules. By using SSIR, it is shown how the process becomes a simple symbolic procedure without the intervention of sophisticated statistical methods, although the results obtained are comparable.
1. Introduction
The field of Quantitative Structure-Activity Relationship (QSAR) has evolved substantially in recent years, forming a robust paradigm. Nevertheless, sophisticated or field-adapted methods are being defined to refine prediction techniques. Typically, several procedures are combined to obtain the desired results. Considering the current scenario, it can be argued that simple methods should be defined and incorporated to obtain interpretable results or simply basic tools able of filtering the databases. This is the goal of the Superposing Significant Interaction Rules (SSIR). The SSIR procedure has proven to be a useful tool in several fields. For instance, in chromatography variable selection [1], when modeling Phospholipidosis by using binary fingerprints [2] or in the treatment of transcriptomics related to leukemia and prostate cancer [3], among others.
This work constitutes a demonstration of SSIR performance by analyzing a group of 40 diphenylamine derivatives, i.e., a family of congeneric derivatives that share the same molecular skeleton or scaffold. The set has been taken from reference [4], which, in turn, collects data from references [5,6,7].
The main objective of this article is to show how reliable results can be obtained with SSIR in a very cheap and fast way. Expeditious methods are needed, as fungi cause considerable damage to agriculture annually. Furthermore, the emergence of resistance to known fungicides is an added problem to this situation. Therefore, the active search for new active agents to counteract these pests is needed [8]. For this search, the aid of computational methods, such as QSAR [9,10], is increasingly being used in the development of new derivatives of known fungicides [11], in the design of new libraries for computational screening [12], in the identification of new lead structures [13] and in the screening of natural products [14].
Recently, Zanni et al. [4] published an interesting work that, using molecular topological indices treated with linear discriminant analysis, led to the classification of diphenylamine derivatives as fungicides against three species (cucumber downy mildew, rice blast and cucumber gray mold). The approach was based on the generation of molecules from a common scaffold. The authors evaluated more than 700 compounds and proposed some as new actives. Zanni and co-workers used their own software named DesMol2 [15]. This platform is not only able of generating a virtual library, but also generating ad hoc molecular descriptors. The calculated descriptors are topological. Hence, the program deals with sets of continuous variables. In addition, these variables can be included in a standard linear discriminant classifier. The classification served not only to generate a model from molecules with known fungicidal activities, but also to propose new structures having high activity potential.
On the other hand, in our laboratory, we have developed the SSIR procedure, first described in ref. [16]. The SSIR method does not deal with continuous variables, but with symbolic descriptors. This feature greatly simplifies the process of coding common scaffold derivatives. In particular, only one symbol (e.g., a single letter) needs to be assigned to each residue that can be accommodated at a particular molecular scaffold site. The series of symbols can be repeated across different sites regardless of whether or not the residue is the same as those present at other sites. This is because placement in a different site changes the nature of the residue (unless symmetry issues arise). As a consequence, the potential molecular library becomes defined in SSIR framework simply making explicit the series of residues available at every substitution site. In practice, the figure and data reported in Table 2 of the paper by Zanni et al. are sufficient to potentially generate a subset of diphenylamine analogs. SSIR needs this information, along with knowledge of each analogue to be (enough) active or non-active as a fungicide. The encodings used by SSIR are listed below in Table 1: the second column stands for the molecular encoding and the last three columns specify the condition of being active (compound of interest or positive) or non-active (negative or non-interesting compound) as a fungicide for three fungal species, namely, cucumber downy mildew (CDM), rice blast (RB) and cucumber gray mold (CGM). The residue codes obey to the following equivalences (some are not present in the Zanni et al. article):

Table 1.
Molecular encodings with the qualitative activity as fungicide against three species.
- A: ‘H’ at all sites;
- B: ‘-CH3’ at R1 site and ‘-Cl’ at sites R2-R6;
- C: ‘-F’ at R2, R4 and R6 (not present at R6 in Table 1 of Zanni et al.);
- D: ‘-NO2’ at R2 and R6, ‘-C(CH3)3’ at R4;
- e: ‘-CH3’ at site R2 (this is not mentioned in Zanni et al., but in a personal communication of these authors);
- E: ‘-CN’ at R4;
- F: ‘-NO2’ at R4;
- g: ‘-CF3’ at R4;
- h: ‘-COCH3’ at R4;
- i: ‘-OCH3’ at R4.
The respective percentages of susceptibility have been collected for several application doses of the tested molecules. These percentages are continuous variables, but in both procedures (linear classifier or SSIR) cutoff levels must be defined to classify the training compounds as active or not. Table 1 lists the groups defined in this study. For CDM a minimum level of 90% of susceptibility was required, which defines a total of 9 molecules of interest or active (25.5% of 36 with known value). For RB, a minimum level of 100% was required, and 15 molecules are of interest (48.4% of 31). For CGM, a minimum level of 80% was considered, and 8 molecules were defined a priori as being of interest (20% of 40).
The compound fluazinam was considered in the paper by Zanni et al. but it is not considered in the present study because this structure, despite being similar to the other molecules, cannot be encoded using the same scaffold. SSIR deals with a single scaffold, in the form applied here.
2. Results
2.1. Results for CDM
The training set included 34 structures with a defined dichotomous CDM value (see Table 1), 9 were active and 25 non-active. In this case SSIR generated 520 rules of order two. Among them, 34 rules were statistically significant when the threshold p-value was set to 0.010. The minimum p-value found for a rule was 0.0002. Applying the rules to the same training set produced a classifier with an Area Under the Receiver Operator Characteristic curve (AU-ROC) of 0.953. This value was qualitatively maintained for the same set of rules in a leave-one-out (LOO) test (AU-ROC = 0.909). Figure 1 shows the ROC curve plot for this cross-validation calculation. The red dot indicates the optimal classification point. It corresponds to the cutoff value of −9 votes where 14 structures were classified as active, and 9 were actually of interest (true positive, TP) and 5 were not (false positive, FP). At this point, the figures of merit are listed in Table 2.
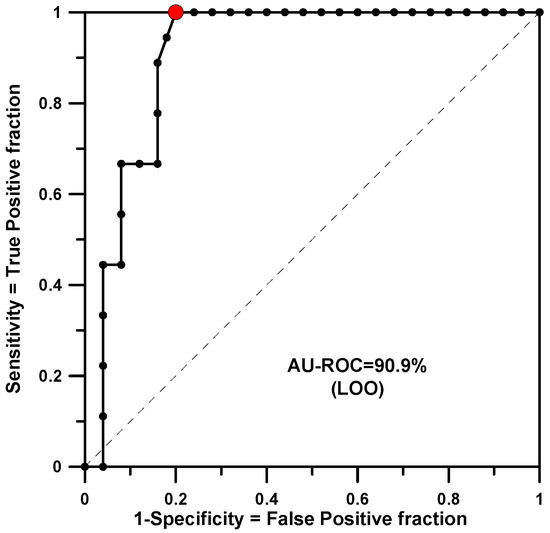
Figure 1.
AU-ROC plot for CDM obtained with a LOO cross-validation calculation.
Table 2.
Classifier parameters for the different SSIR models of this work. See more details in Section 4.
The total number of residue combinations in the library is 2 × 5 × 2 × 8 × 2 × 3 = 960 different analogues. Since 34 have a known activity classification, SSIR produced predictions for the remaining 926 structures. Once the votes derived from significant rules are collected, there are nine new structures with a maximum of positive votes and which potentially may be of interest:
ADAFAB, ADBFAD, ADACAD,
ADBFAB, ADADAD, ADAgAB,
ADAhAD, ADAiAD, ADAFBD
The model also provided predictions for the cases where the experimental value is not known in Table 1 (see the values in parentheses). In it, a capital letter means strong evidence (maximum number of positive or negative votes in the ranking), and a lower case letter signifies only some evidence (intermediate number of positive or negative votes in the ranking). In particular, from the training model, a prediction can be obtained for the six molecules with unknown value. Five of those molecules received a cumulated number of negative votes. This means that SSIR predicts that they will probably not be active. Only one structure received a positive final vote count: structure P34 is expected to be active. In fact, the activity values in Table 1 for RB and CGM also point in the same direction.
2.2. Results for RB
The modeling for RB gave the worst result for training or test. In this case there are 31 structures and 15 of them are active. SSIR generated 408 training rules and only 3 were significant (the p-value threshold was set at 0.005, the minimum p-value found for a training rule was 0.00147). In this case, and due to the small number of significant rules found, both processes (fitting and LOO) returned the same AU-ROC value of 0.881 (see Figure 2).
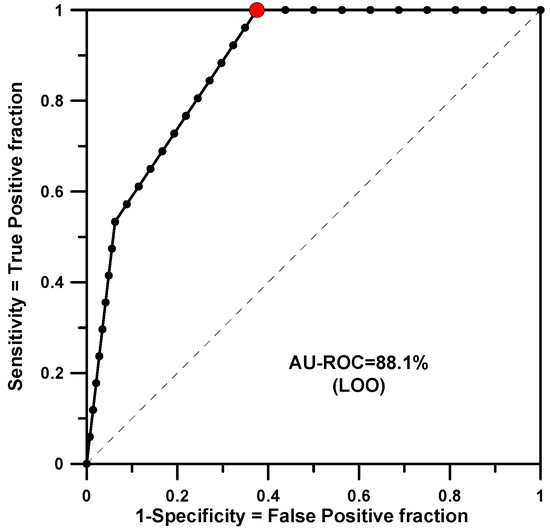
Figure 2.
AU-ROC plot for RB obtained with a LOO cross-validation calculation.
The corresponding classification and ranking parameters are shown in Table 2. The three training rules are as follows (see materials and methods section):
* |A * |A * * (p = 0.0015)
* A * |g * * (p = 0.0044)
* * * |g A * (p = 0.0019)
In this case, a prediction was also obtained to estimate the unknown values in Table 1 (see values in parentheses).
In the case of the RB property, the virtual library that can be built from analogues of known property value is of 2 × 3 × 2 × 8 × 2 × 3 = 576 members. Of these, 545 have no known property value. Since only three significant rules were found in training, it is difficult to find an active molecular proposal that receives many votes. There is a degenerate set of 36 molecules that collect a maximum of 2 positive votes:
ADABAB, ABADBD, ABAgBA, ABAEBD, ADAEAB, ABAgBB, ADAFAB,
ADAgAB, ADAhAB, ADABBB, ADABBD, ADADBB, ADADBD, ADAEBB,
ADAEBD, ADAFBB, ADAFBD, ADAgBB, ADAgBD, ADAhBB, ADAhBD,
ADAiBB, ADAiBD, ADAgAA, ADAhBA, ADAiBA, ABAgAD, ABAhBD,
ADAEBA, ABAgBD, ADADAB, ABAiBD, ADADBA, ADAiAB, ADAgBA,
ADAFBA
Among these proposals, three structures (the underlined ones) coincide with those predicted as active for CDM.
2.3. Results for CGM
The training group fit for CGM (8 active molecules out of 40) presented an AU-ROC value of 0.957. The model included 14 significant rules (p-value threshold of 0.0016) among a total of 564. The minimum p-value found was 0.000017. Predictions on training structures using a LOO test gave an AU-ROC value of 0.924 (see Figure 3).
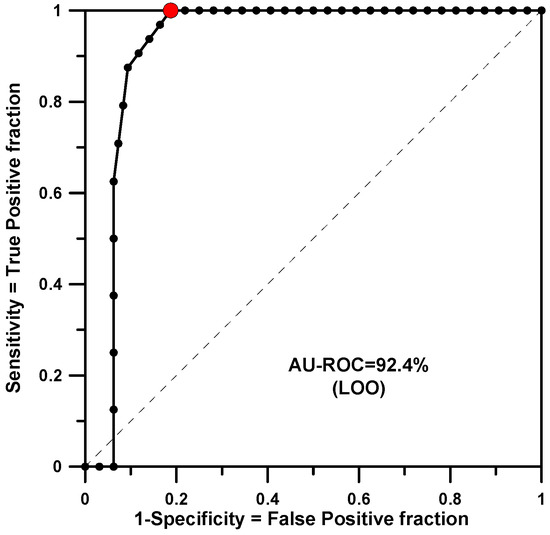
Figure 3.
AU-ROC plot for CGM obtained with a LOO cross-validation calculation.
In Figure 3, at the optimal classification point, the cutoff value is −2 votes and reproduces 8 true positives and 6 false positives. The classifier parameters at the optimal point are listed in Table 2. The universe extended by the combination of residues in this model consists of 2 × 5 × 2 × 9 × 2 × 3 = 1080 structures. A total of 29 molecules with unknown activity value have the maximum number of +10 votes:
AAAABD, ADBABD, ADBFBA, ABBBBD, ADAFBD, AAAABA, AABABD,
ABBABA, ABAABA, ADBABA, ADAABA, ABBFBD, ADBBBA, ABBFBA,
AABBBD, AAABBA, ADBFBD, ABAABD, ABBBBA, AAAFBA, ADAABD,
AAABBD, AABFBA, ADAFBA, ABBABD, AAAFBD, ADABBD, ADBBBD,
AABFBD
2.4. A Merged Model
Finally, a global or merged model has been built. This has been conducted by checking the three properties of Table 1 and classifying as active only those compounds that were active for all three species. This resulted in a set of only 5 active molecules in the group of 40. Here, 2nd-order rules were also considered and it was necessary to set a p-value threshold of 50% to obtain a saturation of rules and a good prediction in LOO. A total of 564 rules were generated and 279 were found to be significant. The training yielded an AU-ROC of 0.980. The minimum p-value found was 0.0010. The LOO calculation shows an AU-ROC value of 0.911 (see Figure 4).
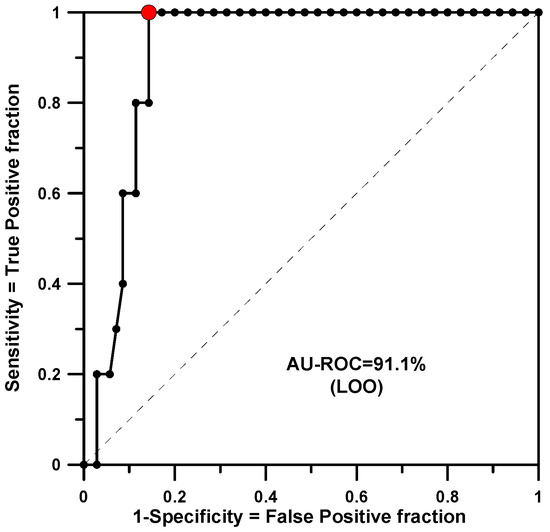
Figure 4.
AU-ROC plot for the merged model obtained with a LOO calculation.
2.5. Comparing Predictions
The CDM model generated 39 groups of predicted activities for 926 molecules. Each group gathered a number of congeners that received the same number of votes (votes ranged from −15 to +18). The model for RB generated only 4 groups of votes (this is a consequence of the small number of significant rules found) on a set of 545 structures. The model for CGM classified the 1040 external molecules into 9 groups (votes in the range −4 to +10). Finally, the merged model classified the predictions in 53 groups, with a range of votes from −92 to +73.
For the three compounds, ADBAAD, ADABAD and ABABAD, that were predicted to be active for all the three fungal species in reference [4], SSIR classified them as active or neutral in all three models (a single model for each fungal species):
- ADBAAD in the CDM model received a prediction of +15 votes and was placed in the 4th SSIR group of ranked molecules. From the RB model, it received −1 votes and was placed in the 3th group. The CGM model gave this molecule a total of +10 votes and placed it in the first ranked group, sharing the same number of votes with other 28 congeneric compounds. The merged model gave +23 votes and placed the molecule in group number 41;
- The ADABAD structure received +15 votes (4th group) from the CDM model. From the RB model, it received 0 votes and was placed in the second group. The CGM model gave this molecule −2 votes (7th group of 9). The merged model gave +11 votes and placed the molecule in group number 53;
- The ABABAD structure received 10 votes from CDM model and was placed in group number 9. From the RB model, it received 0 votes and was placed in the second group. From the CGM model, it also received −2 votes (7th group of 9). The merged model gave 9 votes and placed the molecule in group number 55 out of 135.
In addition to the above particular results, a more global and systematic test was carried out. A series of predicted structures present in the three models (CDM, RB, CGM) and having a positive number of votes derived from the respective rules were taken into account. A total of 222 structures were selected from the CDM model (all of them with +10 votes or more), 183 structures from the RB model (those with +1 vote), and the 179 structures that the CGM model ranked with +9 votes or more. The result was 31 structures common in all the three listings:
ADAFBD, ADBFBD, ADAFBB, ADAgBD, ADADBD, ADAhBD, ADBgBD,
ADAiBD, ADBFBB, ADBhBD, ADBiBD, ADBDBD, ADABBD, BDAFBD,
ABAFBB, ABBFBD, BDBFBD, ADABBB, ABBFBB, ADBBBD, ABAgBD,
ADBBBB, ABBgBD, ABADBD, ABAiBD, BBAFBD, ABAhBD, ABBiBD,
ABBDBD, ABBhBD, BBBFBD
A comparison was made with the 144 compounds listed in “Table S2 cont” of the supplementary information in reference [4] that are expected to have antifungal activity also against all three strains at the same time. A total of 8 (circa 25%) structures are shared with the above list (those underlined).
3. Discussion
All the calculations performance has been evaluated by means of the AU-ROC or F1 values. Regarding AU-ROC, usually, values above 0.75 are interpreted as acceptable or good, and this threshold was exceeded by the three properties studied. It also must be taken into account that the reported values here do not arise from a simple fit or training calculation, but from a particular kind of cross-validation, the LOO. This validation produces a prediction (i.e., reckoning of votes) for each molecule once the whole set of rules has been obtained with the remaining compounds. Hence, the excluded compound acts as a minimal validation or test set. As a consequence, the whole LOO procedure demands the construction of as many models as molecules in the set. The results obtained in this manner go beyond the quality of a single fit or training (i.e., a single calculation).
On the other hand, F1 scores (see Table 2) were above 70% for the individual models, despite the fact that only a value of 2/3 was obtained for the merged one. It is worth mentioning that, by definition, F1 did a good job balancing the precision values (PPV) here. This is because in all cases, sensitivities or recall (TPR) were 100%. This means that all active compounds were detected at the optimal classification points (red circles in the figures above). This is a good result, but is should also be noted that some non-active fungicides were classified as being actives (i.e., false positives) at those points. The accuracy takes the latter effect into account, and the F1 score balances both fractions (see definition in materials and methods section). Again, it has to be mentioned that the F1 values are evaluated among LOO cross-validated results.
Among the three individual models, the RB one is the worst, maybe due to the lack of information that SSIR was able to extract from the data provided. The training model consisted of only three significant rules, and this number of rules does not change significantly along the successive LOO loops Admittedly, this pool of rules or micro-classifiers cannot operate as a good consensus expert, despite the p-value threshold is smaller than the one considered for the CDM model. In general, if a consensus system has to be constructed, it is better to have at a disposal a bigger number of rules despite their p-values are greater. This occurs for the CDM and CGM models (34 significant in a pool of 520, and 14 significant in a pool of 564, respectively for the single overall training calculation).
The merged model performs well for the LOO predictions (AU-ROC of 91.1%), but it must be pointed out that it does not exhibit ideal conditions. Namely, the p-value threshold had to be put at a high value (0.50) for training in order to obtain an acceptable number of significant rules (279). Despite the minimal p-value found along these selected rules was low (0.0010), many of them exhibit non-standard values: 191 with p-values of 0.10 or greater and, among them, 98 with a p-value of 0.30 or greater). The model, constructed in this manner, acquired some stability and it seems that it is the reason why the LOO cross-validation produced the reported results. Some cancelation errors had probably played a role in the calculations. Again, this points to the concept that one must focus on a quite large amount of rules to act as an automated expert system instead to aim for a small number of very significant rules.
In any case, the SSIR rules can be interpreted as simple combinations of features that tend to point to desired characteristics an active compound should have. Of course, a compound will exhibit a specific set of characteristics (i.e., the actual residues placed on the scaffold) that will not conform to all the rules. However, the pool of significant rules is expected to act as a good expert if it contains an adequate number of rules that, in a sense, covers all (or a majority of) interesting features. In fact, SSIR can be interpreted as a method that produces discrete clues that probabilistically correlate with features of interest that are discovered.
The proposed methodology classifies the series of untested compounds, and it has been shown how some of them have been proposed as active in reference [4]. The reproduction of the lists with the selected compounds pointed out in reference [4] conforms to the idea that both methodologies (linear classifier from topological parameters and SSIR) aim at a common goal. The higher the degree of matches among the selected molecules, the greater the evidence that relevant features are intrinsically selected by the two methods.
4. Materials and Methods
SSIR is variable selector [1,3] and finds a wide field of application in QSAR studies when dealing with families of congeneric compounds. Here, a set of congeneric fungicides [4] is analyzed. This molecular family has been chosen in order to demonstrate how SSIR produces the results (ranks molecules) that point to the same direction as the ones of a former work. Additionally, the congeneric pool of molecules in reference [4] can be easily codified as SSIR demands. The details of SSIR method will not be repeated here in full, as they can be found elsewhere [2,16,17]. The method deals with the different substitution patterns of a congeneric family (i.e., having a common scaffold) by combining the substituents or residues that can be accommodated at each place. Each place of substitution is called a site, and each substituent assignable to each site defines a level. The SSIR algorithm consists of combining one or more sites and, for each combination of them, generating permutations of all the involved levels. Each combination of sites and respective residues generates a rule. Once a rule is generated, the training database is checked and, if several molecules satisfy the rule in this molecular subset, the balance between the number compounds of interest (active) and of no-interest (non-active) is evaluated.
For instance, one rule found in the training calculation for CDM is the following:
* |C * * * |A
This means that the rule does not care about the substitutions at sites number 1 and 3–5. The rule is of order 2 and, consequently, only two sites are considered. This rule can be read as “No substituent C at site 2 and, simultaneously, no substituent A at site 6”. This rule also shows that both choices, affirmations of presence of a residue or negations of presence (i.e., absence) can be part of the rule. The list of 34 training structures of Table 1 (CDM column) shows 8 molecules that fit the rule, and in this subset of 8, 6 analogues are active.
A simple probabilistic calculation based on the hypergeometric probability reports the degree of significance (p-value) associated with the rule obtained. Rules with a p-value equal or less that a pre-specified one are called significant rules.
For our example for rule (1), the associated p-value is obtained by adding the probabilities that the rule has of collecting 6 structures of interest (actual case) or more. This corresponds to the sum of the probabilities of collecting 6, 7 or 8 active compounds, which is obtained by adding the following products and quotients of combinatorial numbers [17]:
C(9,6)·C(25,2)/C(34,8) + C(9,7)·C(25,1)/C(34,8) + C(9,8)·C(25,0)/C(34,8) = 0.0014.
Since the p-value threshold chosen a priori was 0.01, this rule is declared significant in the present model. All the significant rules found are compiled, conforming an expert system able of evaluating any compound belonging to the same congeneric family. Therefore, any test or external molecule can be confronted with the set of significant rules. Each significant rule that fits or matches the compound gives it a positive or negative vote, as explained in references [2,16,17]. Continuing with our example, an external compound such as BBAFBD will receive a vote from rule (1), as it matches.
At the end of the count, each evaluated compound has a final number of positive or negative votes. The sum of votes ranks the evaluated molecules. Candidates with more net positive votes are expected to be more likely to be of interest (active in our case). In other words, the molecular categorization (which may be unknown along the evaluated elements) is expected to correlate with the ranking. In particular, if a series of molecules with known properties are being ranked (e.g., the training set or a test or evaluation set), the AU-ROC value is a good parameter able of evaluating the method performance (see below) [18]. It should be noted that a simple SSIR calculation including the number of molecules, sites and residues appearing in this work takes only a few seconds.
Many ranking parameters can be given [18,19,20,21,22]. For example, when defining P as the total number of active (positives) compounds in the set and N as the total number of inactive (negative) ones (the total number of elements is n = P + N), a classifier response hits with a number of true positives, TP, true negatives, TN (correct rejections), false positives, FP (false alarm or type I error), and false negatives FN (failures or type II errors), and from these parameters, other figures of merit can be defined for the classifier:
- Sensitivity or true positive rate (TPR), also called hit or recall = TP/P = TP/(TP + FN);
- Precision or positive predictive value (PPV) = TP/(TP + FP);
- False discovery rate (FDR) = 1 − PPV = FP/(TP + FP);
- F1 score or harmonic mean of precision and sensitivity = 2·TP/(2·TP + FN + FP);
- Specificity (SPC) or true negative rate (TNR) = TN/N = TN/(FP + TN);
- Fall-out or false positive rate (FPR) = 1 − SPC = FP/N = FP/(TN + FP);
- Negative predictive value (NPV) = TN/(TN + FN);
- Accuracy (ACC) or concordance = (TP + TN)/(P + N);
- Matthews correlation coefficient (MCC) =
(TP·TN − FP·FN)/SQRT[(TP + FP)·(TP+FN)·(TN+FP)·(TN+FN)]
Once the classification is stablished, one can travel along it and the classification parameters can be calculated at each point. A Receiver Operating Characteristic (ROC) curve shows the sensitivity versus the false positive rate (FPR, i.e., 1-specificity) values at each point [23,24,25,26]. Throughout the classification, it is desired to reproduce a high sensitivity (i.e., good performance at detecting positive cases) against a small false positive rate. The better the classifier, the faster the curve rises. This feature, together with the fact that these parameters are limited to values between 0 and 1, leads to an area under the ROC (AU-ROC) curve, sometimes also called area under the curve (AUC). The AU-ROC is limited to the interval of values from 0 to 1. An AU-ROC value of 0.5 denotes a neutral (non operative or random) classifier. The closer the AU-ROC is to the unit value, the better the classifier. It should be noted that the AU-ROC value can be interpreted as the probability to correctly classifying a pair of molecules, one being active and the other non-active.
Another relevant parameter to take into account in classifications is the F1 score. This value is the harmonic mean between precision and sensitivity (recall). The merit of the F1 score relies on the fact that it balances both concepts and reaches small values if any of both measures decreases. It is a good parameter that blends the concepts of what fraction of positives are actually positive (precision) and what fraction of true positives have been detected (sensitivity). The score has proven to be a good parameter even when dealing with unbalanced classes.
5. Conclusions
The SSIR model was tested on several datasets of chemical structures with known activity classification for different properties. SSIR produced ordered series of molecules that have been shown to correlate with a dichotomous classification. In all the numerical calculations, the SSIR classifier showed a good performance: values circa 90% or more for the AU-ROC, and values circa 70% or more for the F1 coefficient. In all cases, the model was able to generate a significant number of rules that were able to accurately predict the activity of unseen chemical structures in a leave-one-out cross-validation test, going beyond a simple training or fit calculation. The model was also able to identify a set of potential active structures in a virtual library of additional molecules, although the predictions were less certain when the number of significant rules found in the training data was small. Additionally, the model was able to accurately classify three chemical structures that were previously predicted to be active for multiple fungal species. Overall, the results suggest that the SSIR model is a promising tool for predicting the activity of chemical structures for different properties. According to the aim of this work, it has been demonstrated how a simple automated expert system is able to rank or classify compounds, making suggestions that point to the same direction as another method does, but cheaply.
Author Contributions
Conceptualization, E.B.; methodology, E.B.; software, E.B.; validation, E.B. and J.V.d.J.-O.; formal analysis, E.B. and J.V.d.J.-O.; investigation, E.B. and J.V.d.J.-O.; resources, E.B. and J.V.d.J.-O.; data curation, E.B.; writing—original draft preparation, E.B.; writing—review and editing, E.B. and J.V.d.J.-O.; visualization, E.B.; supervision, E.B. and J.V.d.J.-O. All authors have read and agreed to the published version of the manuscript.
Funding
This research received no external funding.
Informed Consent Statement
Not applicable.
Data Availability Statement
Not applicable.
Conflicts of Interest
The authors declare no conflict of interest.
References
- Besalú, E.; Prat, C.; Anticó, E. Investigation of volatiles in cork samples using chromatographic data and the superposing significant interaction rules (SSIR) chemometric tool. Biomolecules 2020, 10, 896. [Google Scholar] [CrossRef]
- Besalú, E. Modeling binary fingerprint descriptors with the superposing significant interaction rules (SSIR) method. Int. J. Quant. Struct. Property Rel. 2020, 5, 98–107. [Google Scholar] [CrossRef]
- Besalú, E.; De Julián-Ortiz, J.V. Ranking series of cancer-related gene expression data by means of the Superposing Significant Interaction Rules method. Biomolecules 2020, 10, 1293. [Google Scholar] [CrossRef] [PubMed]
- Zanni, R.; Galvez-Llompart, M.; Garcia-Pereira, I.; Galvez, J.; Garcia-Domenech, R. Molecular topology and QSAR multi-target analysis to boost the in silico research for fungicides in agricultural chemistry. Mol. Divers. 2019, 23, 371–379. [Google Scholar] [CrossRef] [PubMed]
- Szczechura, W.; Staniaszek, M.; Klosinska, U.; Kozik, E.U. Molecular analysis of new sources of resistance to Pseudoperonospora cubensis (Berk. et Curt.) Rostovzev in cucumber. Russ. J. Genet. 2015, 51, 974–979. [Google Scholar] [CrossRef]
- Gladieux, P.; Ravel, S.; Rieux, A.; Cros-Arteil, S.; Adreit, H.; Milazzo, J.; Thierry, M.; Fournier, E.; Terauchi, R.; Tharreau, D. Coexistence of multiple endemic and pandemic lineages of the rice blast pathogen. MBio 2018, 9, e01806–e01817. [Google Scholar] [CrossRef]
- Deng, J.J.; Huang, W.Q.; Li, Z.W.; Lu, D.L.; Zhang, Y.; Luo, X.C. Biocontrol activity of recombinant aspartic protease from Trichoderma harzianum against pathogenic fungi. Enzyme Microb. Technol. 2018, 112, 35–42. [Google Scholar] [CrossRef] [PubMed]
- Ribas e Ribas, A.D.; Spolti, P.; Del Ponte, E.M.; Donato, K.Z.; Schrekker, H.; Fuentefria, A.M. Is the Emergence of Fungal Resistance to Medical Triazoles Related to Their Use in the Agroecosystems? A Mini Review. Braz. J. Microbiol. 2016, 47, 793–799. [Google Scholar] [CrossRef] [PubMed]
- Yang, L.; Wang, Y.; Hao, W.; Chang, J.; Pan, Y.; Li, J.; Wang, H. Modeling Pesticides Toxicity to Sheepshead Minnow Using QSAR. Ecotoxicol. Environ. Saf. 2020, 193, 110352. [Google Scholar] [CrossRef]
- Yang, L.; Wang, Y.; Chang, J.; Pan, Y.; Wei, R.; Li, J.; Wang, H. QSAR Modeling the Toxicity of Pesticides against Americamysis Bahia. Chemosphere 2020, 258, 127217. [Google Scholar] [CrossRef]
- Isyaku, Y.; Uzairu, A.; Uba, S. QSAR and Molecular Docking Studies of Novel 2,5-Distributed-1,3,4-Thiadiazole Derivatives Containing 5-Phenyl-2-Furan as Fungicides against Phythophthora Infestans. Beni Suef Univ. J. Basic Appl. Sci. 2020, 9, 11. [Google Scholar] [CrossRef]
- Thind, T.S. Changing Trends in Discovery of New Fungicides: A Perspective. Indian Phytopathol. 2021, 74, 875–883. [Google Scholar] [CrossRef]
- Galvez-Llompart, M.; Zanni, R.; Galvez, J.; Garcia-Domenech, R. Molecular Topology QSAR Strategy for Crop Protection: New Natural Fungicides with Chitin Inhibitory Activity. ACS Omega 2020, 5, 16358–16365. [Google Scholar] [CrossRef] [PubMed]
- Gao, Y.; Tian, X.; Li, J.; Shang, S.; Song, Z.; Shen, M. Study on Amphipathic Modification and QSAR of Volatile Turpentine Analogues as Value-Added Botanical Fungicides against Crop-Threatening Pathogenic Fungi. ACS Sustain. Chem. Eng. 2016, 4, 2741–2747. [Google Scholar] [CrossRef]
- Garcia-Pereira, I. Desmol2 Software, 2018, Department of Physical Chemistry. Faculty of Pharmacy, University of Valencia. Available online: http://desmol2.uv.es (accessed on 18 October 2022).
- Besalú, E. Fast Modeling of Binding Affinities by Means of Superposing Significant Interaction Rules (SSIR) Method. Int. J. Mol. Sci. 2016, 17, 827. [Google Scholar] [CrossRef]
- Besalú, E.; Pogliani, L.; De Julián-Ortiz, J.V. Superposing Significant Interaction Rules (SSIR) method: A simple procedure for rapid ranking of congeneric compounds. Croat. Chem. Acta 2016, 89, 481–492. [Google Scholar] [CrossRef]
- Besalú, E.; de Julián-Ortiz, J.V.; Pogliani, L. On Plots in QSAR/QSPR methodologies. In Quantum Frontiers of Atoms and Molecules; Putz, M.V., Ed.; NOVA Publishing Inc.: New York, NY, USA, 2010; pp. 589–605. ISBN 978-1-61668-158-6. [Google Scholar]
- Parikh, R.; Mathai, A.; Parikh, S.; Sekhar, G.C.; Thomas, R. Understanding and using sensitivity, specificity and predictive values. Indian J. Ophthalmol. 2008, 56, 45–50. [Google Scholar] [CrossRef]
- Trevethan, R. Sensitivity, specificity, and predictive values: Foundations, pliabilities, and pitfalls in research and practice. Front. Public Health 2017, 5, 307. [Google Scholar] [CrossRef]
- Wikipedia. Available online: https://en.wikipedia.org/wiki/Positive_and_negative_predictive_values (accessed on 18 October 2022).
- Wikipedia. Available online: https://en.wikipedia.org/wiki/Sensitivity_and_specificity (accessed on 18 October 2022).
- Egan, J.P. Signal Detection Theory and ROC Analysis; Academic Press: New York, NY, USA, 1975. [Google Scholar]
- Bamber, D.C. The area above the ordinal dominance graph and the area below the receiver operating characteristic graph. J. Math. Psychol. 1975, 12, 387–415. [Google Scholar] [CrossRef]
- Hanley, J.A.; McNeil, B.J. The meaning and use of the area under a receiver operating characteristic (ROC) curve. Radiology 1982, 143, 29–36. [Google Scholar] [CrossRef]
- Hanley, J.A.; McNeil, B.J. A method of comparing the areas under receiver operating characteristic curves derived from the same cases. Radiology 1983, 148, 839–843. [Google Scholar] [CrossRef] [PubMed]


Disclaimer/Publisher’s Note: The statements, opinions and data contained in all publications are solely those of the individual author(s) and contributor(s) and not of MDPI and/or the editor(s). MDPI and/or the editor(s) disclaim responsibility for any injury to people or property resulting from any ideas, methods, instructions or products referred to in the content. |
© 2023 by the authors. Licensee MDPI, Basel, Switzerland. This article is an open access article distributed under the terms and conditions of the Creative Commons Attribution (CC BY) license (https://creativecommons.org/licenses/by/4.0/).