Abstract
TMS contaminates concurrent EEG recordings with Auditory Evoked Potentials (AEPs), which are caused by the perceived impulsive acoustic noise of the TMS coils. We hereby introduce a novel and perceptually motivated/tuned method for the suppression of auditory evoked EEG artifacts of rTMS under the name of “Auditory Fine-Tuned Suppressor of TMS-Clicks” (TMS-click AFTS). The proposed method is based on the deployment of a psychophysically-matched wide-band noise (WBN) masking stimulus, whose parametric synthesis and presentation are based upon adaptive psychophysical optimization. The masking stimulus is constructed individually for each patient/subject, thus facilitating aspects of precision medicine. A specially designed automation software is used for the realization of an adaptive procedure for optimal parameterization of masking noise level, optimizing both the subject’s comfort and the degree of AEP reduction. The proposed adaptive procedure also takes into account the combined effect of TMS intensity level and can as well account for any possibly available subject’s hearing acuity data. To assess the efficacy of the proposed method in reducing the acoustic effects of TMS, we performed TMS-EEG recordings with a 60 channel TMS-compatible EEG system in a cohort of healthy subjects (n = 10) and patients with epilepsy (n = 10) under four conditions (i.e., resting EEG with and without acoustic mask and sham TMS-EEG with and without acoustic mask at various stimulus intensity levels). The proposed approach shows promising results in terms of efficiency of AEP suppression and subject’s comfort and warrants further investigation in research and clinical settings.
1. Introduction
Transcranial Magnetic stimulation coupled with EEG, known as TMS-EEG, is a recently introduced neurophysiological technique that revolutionized the investigation of the human brain in health and disease as it allowed, for the first time in a non-invasive manner, the monitoring of the EEG effects of TMS stimuli (including, inter alia, the recording of TMS-evoked potentials (TEPs) and the effects on functional brain connectivity, EEG oscillations and epileptiform discharges) [1,2,3]. TMS-EEG is a challenging technique from a methodological point of view. For instance, TMS can contaminate concurrent EEG recordings with Auditory Evoked Potentials (AEPs), which are caused by the perceived impulsive acoustic noise of the TMS coils. These percepts may be formed either by air- or bone-conducted hearing [4,5,6]. To overcome this issue, previous research has proposed three general directions for AEP artifact reduction/removal, including (a) EEG signal processing-based elimination, (b) AEP suppression using various auditory masking stimuli [4,7] and (c) sham stimulation realistically mimicking the auditory/somatosensory components of TMS [8,9]. In this work, we elaborate upon the second family of approaches, regarding the issue of AEP suppression.
There is still an ongoing effort on the possible ways for generating auditory suppression stimuli as well as conforming with issues of protection of the subjects’ hearing. Thus, our aims are (a) to increase efficiency of suppression by optimizing audio suppressor parameters based on perceptual and individualized criteria, (b) to provide the TMS community with software that employs the computational and perceptual fine-tuned individualization necessary for research/treatment, and (c) to account for hearing protection and patient comfort due to the impulsive nature and high levels of acoustic TMS clicks while still maintaining Auditory Potentials suppression efficiency. The potential of more harmful effects on hearing of impulsive and impact noises in comparison to continuous noises has been well documented in the literature [10,11,12].
2. The Proposed Approach
Figure 1 depicts the major components of our hybrid approach, which feature:
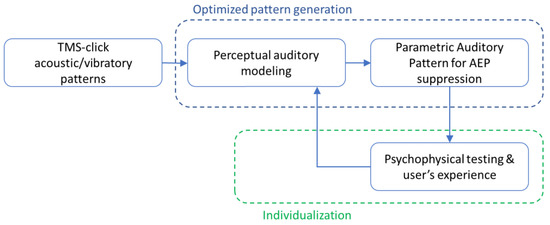
Figure 1.
Schematic representation and components of the proposed AFTS approach.
- A module for generating a psychophysically determined auditory potentials suppression stimulus, which consists of properly shaped continuous wide-band noise (WBN), matched to the TMS clicks’ characteristics.
- Individualization by means of an adaptive procedure for optimal level determination, together with a GUI-based software for the automation and standardization of the procedure.
- Other benefits (facilitation of more precise control of pattern specification, increased suppression efficiency, hearing safety and comfort).
These characteristics allow a call name for the proposed novel approach as “Auditory Fine-Tuned Suppressor of TMS-Clicks” (abbreviated as TMS-click AFTS). We employ a 2-stage process for the parametric determination of suppressors’ characteristics. First, the characteristics of TMS clicks are analyzed and fed into a module which employs auditory perception modeling and subsequent inversion in order to generate an appropriate audio suppressor for the acoustic click evoked potentials. Next, we reshape the suppressor’s pattern by an adaptive psychophysical procedure individually for each subject, either at the beginning of the TMS session, or prior to it, thus serving as a form of subject’s acquaintance.
3. Procedures and Material
The determination of the characteristics of TMS clicks’ acoustic and vibratory excitation (Figure 2) aims at forming a composite auditory excitation pattern based on a combination of the direct acoustic trail of the click and any possible vibration of the skull transmitted vibration due to contact with the coil. This vibratory pattern is converted into an airborne equivalent excitation through the use of equivalence to air-conduction pressure thresholds. More specifically, the levels of vibratory patterns of the TMS clicks are compared to the equivalent levels of bone-conduction thresholds for normal hearing subjects, which are directly equivalent to air-conduction SPL’s [13,14]. The difference of octave-band log vibration levels from the rTMS compared to the bone-conduction reference thresholds are added to the respective equivalent air-conduction reference thresholds. In this manner, the vibratory levels are converted to equivalent air-conduction sound levels.
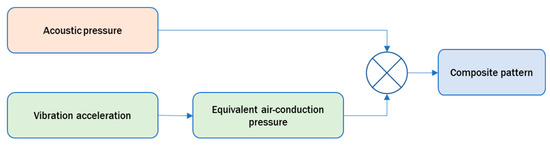
Figure 2.
Procedure for the estimation of hearing stimulation pattern.
For the recording of the acoustic patterns of TMS click, we employed a Bruel 4100-family HATS, while for the vibratory pattern, we used an Analog Devices ADXL1005Z triaxial accelerometer device which was held in place by being bitten it between the subjects’ front teeth. Figure 3 shows a typical acoustic recording of the TMS click and its equivalent octave spectrum (at the tympanic membrane, without ear plugs/muffs). The recorded sound levels were Lmax.~106 dB (SPL), Limp, eq.~98 dB (SPL) at the subject’s ear canal at the highest TMS intensities, which are in agreement with findings of previous works and mandates taking measures for both hearing protection and elaborate elimination of auditory generated artifacts.
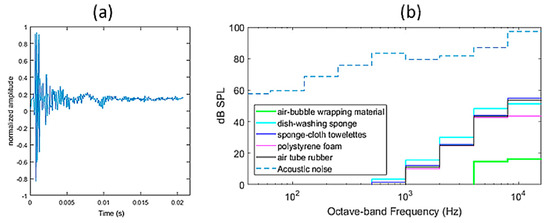
Figure 3.
Typical rTMS click waveform in (a), and octave-band spectra of acoustic noise excitation (dashed line) and equivalent acoustic excitations of vibratory component (colored solid lines) when using layers of various materials between the coil and skull in (b).
The obtained composite excitation patten drives the parametric synthesis of a wide-band noise (WBN) masking stimulus, which is obtained through a spectral envelope filtering of a white-noise source. Thus, the employed suppressor consists of only a continuous acoustic signal without transients.
Suppressor’s Pattern Specification
The suppressor’s pattern is determined on the grounds of auditory excitation and loudness of the rTMS click acoustic patterns [15,16].
More specifically, the sequence of rTMS-click’s acoustic pattern is converted to an equivalent auditory excitation and, subsequently, to a spectrotemporal loudness pattern [17,18,19], namely , where is the process of time-varying loudness computation and is the rTMS-click sequence. The suppressor’s spectral density is determined from so that its estimated loudness is [16].
The finer specification of the suppressor pattern’s main characteristics is performed individually for each patient (Figure 4) by a specially designed software module, which spectrally reshapes (for each individual subject) the output of the suppressor’s core perceptual computation and generation module, and it determines optimal ranges of stimulation parameters through an adaptive psychophysical optimization.
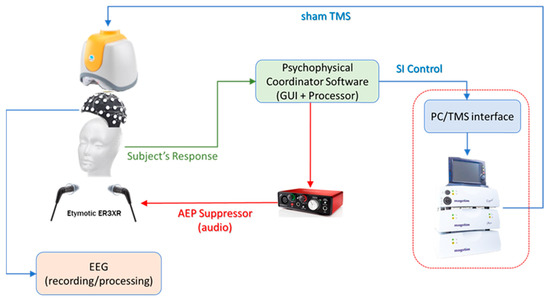
Figure 4.
Procedure for the fine-tuning of the suppressor’s parameters.
Various factors which can cause deviations from the initially designed pattern of the suppressor mandate the fine tuning of its parameters for optimal individualized adaptation. Among others, such factors can be:
- Intersubject variability of external ear’s acoustics and deviations from the measured rTMS-click pattern at the concha of the standard torso simulator’s pinna.
- Intersubject variability in perceptual sensitivity of rTMS-click detection under the concurrent presentation of the suppressor.
- Intersubject variability in the perception of loudness of the suppressor and/or the rTMS-click due to binaural presentation.
- Variability due to earphones insertion and fit into the ear canal.
The individualized wide-band noise (WBN) masking stimulus is psychophysically fine-tuned (matched) so that the subject does not detect any repetitive TMS sound when presented with both the suppressor and the rTMS stimulation. The fine tuning of the suppressor determines the optimal values of three parameters that modify the suppressors spectral pattern:
- parameter for frequency shifting of the whole pattern, namely
- spectral slope parameter around the frequency of maximum , namely , and
- overall gain which accounts for overall loudness adjustment.
The final log spectral density of the suppressor is
where is the initial log spectral density of the suppressor in dB. The frequency shifting parameter and the spectral slope parameter are allowed to vary in the intervals Hz and dB/oct, respectively.
The complete psychophysically matched wide-band noise (WBN) masking stimulus determination is conducted through a specially designed Psychophysical Coordination software (based on National Instruments’ LabVIEW), which is used for the realization of an adaptive procedure for optimal placement of suppressor’s parameters, thus targeting both the subject’s comfort and the degree of AEP reduction.
The adaptive psychophysical procedure, in a sequence of runs, for each of several pairs of the frequency shifting and the spectral slope parameters, determines the minimum value of the gain parameter that satisfies non-audibility of the rTMS sequence, using an adaptive stair-case procedure [20]. Finally, a 2AFC preference procedure (without replacement) [21] for minimum loudness among suppressor patterns (with the triads of parameters at the previously determined minimal gains) yields the final fine-tuned suppressor’s pattern.
The proposed adaptive procedure also takes into account the combined effect of TMS stimulation intensity level. Additionally, the proposed methodology of suppressor’s pattern estimation is currently expanded so as to account also for the subject’s hearing acuity data (such as pure-tone audiogram) using special modifications in the estimation of loudness from the auditory excitation patterns.
In order to ensure subjects’ hearing safety, the maximum permissible acoustic exposure (according to OSHA/NIOSH standards) is also compensated in the Psychophysical Coordination software, taking into account a combination of parameters, such as the expected rTMS session time, the maximum stimulation level and the earphones’ sensitivity data. The Occupational Safety and Health Administration (OSHA, 1983) and the National Institute for Occupational Safety and Health (NIOSH, 1998) have published standards for the maximum permissible noise exposure levels under the Occupational Safety and Health Act (1970). The NIOSH criterion for Recommended Exposure Limit is set at <100 dBA for exposure duration down to 15 min, without hearing protection. It becomes clear that special attention has to be paid to hearing hazards from noise exposures (both in terms of duration and level) that are typical for rTMS sessions.
The software collects the subject’s oral or gestural responses on an adaptive psychophysical task and feeds them into a TMS stimulus and suppressor shaper loop that ultimately feed the TMS coil and the subject’s earphones that deliver the suppressor audio signal.
Although during our preliminary investigation the control of the SI was manual, we are also preparing an interface for the communication and mastering of the TMS stimulator by the Psychophysical Coordinator Software module. Such a software/hardware interface for the communication and/or control of TMS equipment with a GUI will facilitate the fully automated coordination of the standardization procedure across subjects and TMS setups, thus offering a highly individualized application in the framework of precision medicine.
Subject’s responses include ratings of listening comfort and the responses to the previously described adaptive psychophysical procedure on the various suppressor’s patterns.
Although the identification and effective elimination of the auditory component of TEPs emerged as a priority in the TMS-EEG research field, recent studies highlighted the importance of the somatosensory component [22]. According to current thinking, the somatosensory component of the TEP becomes evident > 55 ms post-TMS and is of smaller amplitude compared to the auditory component. Importantly, however, it interacts non-linearly with the latter, resulting in significant contamination in the middle and later parts of the TEP and necessitating the application of effective control measures such as spatially relevant, combined electrical–auditory sham stimulation [22]. In order to investigate the contribution of somato-sensory component through bone-conducted vibration of the skull, we have also examined the possible effect of using layers of various materials between the skull and the TMS coil, which may be of importance since TMS coils are in contact with the head/skull structures. We tested a variety of everyday materials as intermediate layers (thickness < 1 cm) between the coil and the skull (air-bubble plastic wrapping material, dish-washing sponge, sponge-cloth towelettes, closed-cell extruded polystyrene foam, bicycle tire air tube rubber). For each material, the octave-band power spectrum of the vibratory excitation was converted into an equivalent acoustic excitation (as described in the previous section). Although the equivalent acoustic power of the vibratory excitation was lower using the vibration isolation materials (especially with the air-bubble wrapping material) in comparison to the typical condition without any intermediate vibration isolation layer, the analysis of acoustic/vibratory excitation patterns (Figure 2) showed that even in the typical no-material case, the total power was dominated by the acoustic noise component (Figure 3b) as the overall power of the acoustic component was >30 dB higher than the vibratory component (when the latter is transformed into its equivalent acoustic component using the approach which was described earlier). An additional acoustic isolation of the cochlear partition is achieved by using a pair of insert earphones (Etymotic ER3XR).
4. TMS Study Protocol and EEG Recording
4.1. EEG Data
For this study, we employed an H7 coil (Brainsway Ltd., Jerusalem, Israel) [23] connected to a Magstim Rapid2 stimulator (Magstim, Spring Gardens, UK) positioned over the mid-line central area (i.e., 8 cm above the nasion along the main reference curve (nasion–inion) and conformal to the patient’s head). The employed sham H7 coil is placed within the same helmet as the verum H7 coil and produces a similar acoustic artifact as well as scalp sensations by electrical stimulation, which, however, induces negligible E-fields in the brain. It is a realistic sham procedure that has been shown to maintain the blinding in the context of various clinical trials. For instance, in the study by Carmi et al. [24], the majority of the participants (75–88%) could not guess if they were assigned in the sham or verum stimulation groups. Accordingly, it was suitable for the purpose of the broader phase II diagnostic accuracy study and was therefore employed in the present study. Sham stimuli were administered at 30, 35, 40, 50, 60, 70 and 80% of maximum stimulator intensity (SI), as also at rest (SI = 0%). This procedure was performed two times for each subject, once without the auditory mask and once with the mask. During the TMS sessions, EEG was recorded with 60 Ag/AgCl pellet electrodes placed according to the International 10-10 system and connected to a TMS compatible EEG amplifier (eXimia, Nexstim Ltd., Helsinki, Finland). The EEG signals were analog band-pass filtered from 0.1 to 500 Hz and sampled with a 1450 Hz sampling frequency and 16-bit precision. In order to reduce the TMS-induced artifact, the EEG amplifier was temporarily blocked from 100 µs before to 2 ms after the TMS pulse by a sample-and-hold circuitry [25]. A group of healthy subjects and one of patients with Genetic Generalized Epilepsy was used in this study. The data were collected in the context of a cross-sectional with delayed verification, phase II diagnostic accuracy study exploring the diagnostic and predictive potential of deep TMS with an H7 coil combined with high-density EEG in patients with Genetic Generalized Epilepsy. The paper describing this study is in preparation. Demographics of the participants are provided in Table 1.

Table 1.
Subject Demographics.
4.2. EEG Signal Preprocessing and Analysis
A series of advanced EEG cleaning procedures is applied to the data to improve signal quality and enhance the sham stimulation EPs. First, the segment of data from 5 ms prior to 25 ms after the TMS stimulus is removed and replaced with piecewise cubic spline interpolation. The data are then filtered with a zero-phase high pass FIR filter at 4 Hz, electrooculographic artifact correction is performed with multiple adaptive regression with the Conventional Recursive Least Squares Algorithm (CRLS) [26], and line noise at 50 and 100 Hz is removed using multi-tapering and Thompsons’ F-statistic [27]. Bad channels are detected using a Random Sample Consensus (RANSAC) procedure [28] and removed. Large burst artifacts are corrected using Euclidean distance Artifact Subspace Reconstruction (ASR) [29], and segments of data that cannot be adequately corrected are marked, so that the corresponding stimulations can be excluded from the analysis. Independent component analysis (ICA) is then used to remove stimulation-induced muscle artifact and persistent muscle activity [30]. Finally, the removed channels are replaced by spherical interpolation, the data are transformed to current source density (CSD) estimates [31,32] and are filtered with a zero-phase low pass FIR filter at 45 Hz. The final signal’s frequency range (4–45 Hz) corresponds to the range of typical TEPs we have observed in the case of verum TMS stimulation using the setup of this study (deep TMS with an H7 coil). In addition, it is similar to the frequency content of TEPs elicited with focal stimulation at the central area, as disclosed by ERSP analysis [33,34].
The analysis is performed on the Sham TMS AEPs, obtained by epoching the data into trials with duration of 1 s (0.5 s pre- and post-TMS) and averaging the individual trials. For each subject, there is a different number of usable trials based on the number of stimulations administered by the clinician and the data quality after the preprocessing, but the median number of trials for both groups (healthy and epileptic) was the same, equal to 31 (see Table 1 for more information). We study the AEPs as a signal, and also as the Cortical Evoked Activity (CEA) measure which is the area under the curve of the rectified AEP for a given time window. We estimate CEA values for the period from 25 to 275 ms, so as to include the auditory N100 component of the AEP. We constrain our analysis on a waveform of interest which is the average of the signals at the nine central channels FC1, FCz, FC2, C1, Cz, C2, CP1, CPz, CP2 (corresponding to the core stimulation area). The specific nine-channel ROI was chosen for two reasons. First, it was identical to the ROI that was employed in the context of a broader study on the diagnostic accuracy of deep TMS-EEG in epilepsy, thereby ensuring the relevance of the findings of the present study with the clinical one. Second, this particular ROI corresponds roughly to the topography of the TMS-evoked AEP [35]. Accordingly, both when using verum and sham stimulation, the employed ROI is appropriate for the purpose of the study.
For the statistical analysis of the results, we employ a linear mixed-effects model [36], cluster-based permutation tests [37] and exponential model fitting with nonlinear least squares. All computations are performed in SPSS and MATLAB using custom scripts and the EEGLAB toolbox [38].
5. Results
A linear mixed-effects model with three variables was used to investigate the relation of the CEA values to subject’s health condition, stimulus intensities (SIs) and auditory mask use with a random factor corresponding to subjects to account for within-subject variability. The subject’s health condition (two levels—healthy/epileptic) is a simple categorical variable, while the SI and the auditory mask use during the stimulations are repeated measures with eight and two levels, respectively. The procedure indicated that the CEA values were not different between the subject health conditions (F = 0.819, p = 0.366), while they differed with the use of the auditory mask (F = 21.295, p < 0.001) and across the SI levels (F = 7.246, p < 0.001). Additionally, the interaction term between the mask and SI variables was determined to be statistically significant (F = 9.690, p < 0.001). Pairwise comparisons (LSD test) showed that the mask and no mask conditions were statistically significant different for the cases of SI = 40, 50, 60, 70 (p = 0.010, <0.000, 0.002, <0.000, respectively), while no difference was observed for the cases of SI = 0, 30, 35 and 80 (p = 0.192, 0.424, 0.124, 0.750, respectively). Based on these results, in the ensuing analyses, we pool together the epileptic and healthy groups to achieve a larger sample size and higher statistical power, and we concentrate mostly on the comparison of use of auditory mask vs. no mask case.
Figure 5 presents results for CEA as a function of SI. Figure 5a shows the CEA values for all subjects and cases individually, along with exponential mode fits () separately for the cases of auditory mask and no mask. It is evident that the two exponential fits are different from each other, validating further the ANOVA results. The exponential factor for the case of auditory mask is b = 0.4022 (CI: 0.140, 0.664), while for the case of no mask is almost double that, with b = 0.737 (CI:0.465, 1.009). The constant terms are comparable for both cases, with a = 0.565 (CI: 0.478, 0.653) and a = 0.538 (CI: 0.461, 0.614) respectively. In Figure 5b, we show the average CEA per SI for the two cases. With no mask, CEA increases almost linearly with respect to SI. On the other hand, the mask keeps CEA relatively constant for all SIs, except for SI = 80%, where we observe an abrupt increase. Figure 5c depicts the percentage decrease in CEA with the use of the mask, which ranges from around 20% for SIs = 30–40% to 30% for SI = 70%. Again, we note that for SI = 80%, there is minimal decrease.
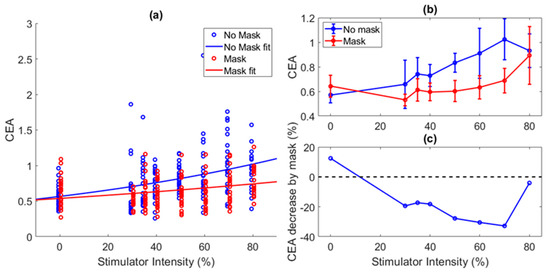
Figure 5.
(a) Scatterplot of CEA values per SI and exponential line fit for the cases of no mask (blue circles and lines) and mask (red circles and lines), (b) average CEA as a function of SI for the cases of no mask (blue) and mask (red), (c) percentage decrease in CEA when the auditory function is used, as a function of SI.
In Figure 6, we present the global AEPs (average across all subjects) elicited from the stimulations for the different SIs and auditory mask conditions. The Figure also presents the results of cluster-based permutation tests. These tests are used to identify contiguous time points (i.e., time periods, or point clusters) for which signals from two conditions (e.g., evoked potentials) are statistically significant different. Herein, we use these tests to compare the stimulations to the resting condition for the two mask conditions separately, as also to compare the mask/no mask conditions between them for each SI individually. In the panels of the first row, we see that when there is no auditory mask, the sham stimulation deviates statistically significantly (p < 0.05) from the resting condition for SI = 35% and higher with an evident AEP. On the contrary, when the mask is applied (middle row of panels), the sham stimulation cannot be distinguished from the resting condition for SI of up to 50%. Finally, comparing the mask vs. no mask case, significant difference can be observed for SI in the range from 35% to 70%. For SI = 60 and 70%, even though the mask is not able to completely eliminate the AEP, it significantly reduces its amplitude. At the maximum SI of 80%, the mask seems to lose its efficiency, which is something that we are currently investigating. These results are in partial agreement with those we obtained from the linear mixed-effect model previously.
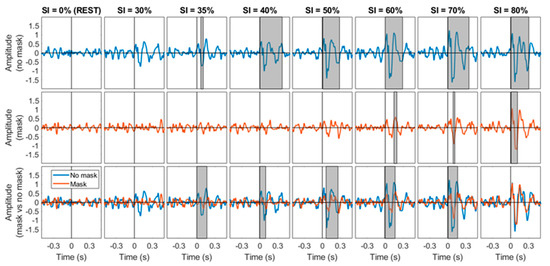
Figure 6.
AEPs for the case of no mask (first row), use of auditory mask (middle row) and both (bottom row) for the different stimulation intensities (columns). The gray shaded patch corresponds to the time period of statistically significant difference between the AEPs for the comparison of stimulation vs. rest condition (first and second row), and stimulation with vs. without mask (third row).
6. Discussion and Future Work
In this work, we introduced a novel perceptually motivated method for the suppression of auditory evoked EEG artifacts of rTMS under the name “Auditory Fine-Tuned Suppressor of TMS-Clicks” (TMS-click AFTS). Herein, our hybrid approach features (a) psychophysically driven continuous wide-band noise (WBN) masking stimulus, matched to the TMS clicks’ characteristics, (b) acoustic isolation of airborne/bone sound using insert earphones with highly effective insertion loss, (c) a complete adaptive procedure for optimal masking level determination and AEP reduction, together with a custom software for the automation and standardization of the procedure.
All three features operate in tandem in order to provide a maximally efficient solution for AEP artifacts by reducing the subject’s exposure both to the TMS click and the masking noise. The efficiency of the method to suppress the EEG’s auditory artifact of the TMS clicks is remarkable across a wide range of stimulation intensities.
In contrast to other related approaches [4], our suppressor contains only continuous acoustic signals (namely, we do not mix transients that mimic TMS-clicks) and follows a perceptual optimization-based parameter determination instead of free variation of several GUI variables, which can be of significant convenience for the clinical personnel and may offer the advantages of highly accurate subject individualization and efficiency. The current study reports on results for H-coils. Our preliminary data and results of application with 8-figure coils are also in line with the present findings.
Regarding the relative contribution of bone-conducted vibration due to coil stimulation to the induced auditory excitation, our approach offers the possibility of also including vibratory data in the determination of the optimal acoustic suppressor. Under real TMS stimulation conditions, we observed a reduction in the vibratory component (especially with the air-bubble wrapping material) compared to the typical condition without any intermediate vibration isolation layer. The equivalent auditory excitation of this component was nevertheless shown to be much lower (<−30 dB) than that ofnits acoustic counterpart. However, this finding must be verified by further testing in a bigger sample of subjects and/or measurement setups.
Regarding hearing safety, our computational procedure also takes into account the widely accepted standardized maximum permissible exposure levels (according to OSHA and NIOSH) in the generation and presentation of suppressor stimuli, thus ensuring minimal hearing burden. The overall subjects’ judgement regarding comfort was very high.
Currently, we are extending the presented framework of optimized analysis and individualization by implementing additional functionality (Figure 7), which further improves the efficiency of the computational approach beyond the ca. 20–40% reduction in CEA amplitudes (at stimulation intensities 30–70%) (Figure 5c) compared to the absence of the suppressor. We are also including measures of the subject’s hearing acuity (such as PTA, etc.) ensuring the subject’s hearing safety/comfort, completing the Automation Software and TMS machinery Interfacing, and employing ML for more precise control of pattern specification. These additional features are the subject of ongoing investigations.
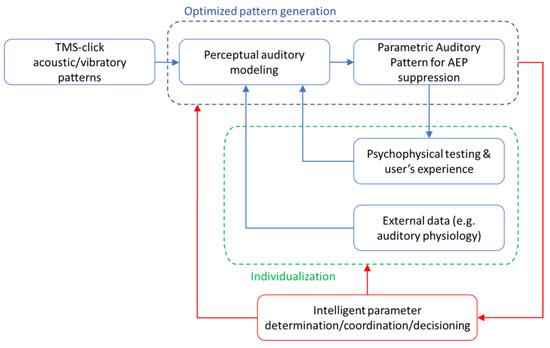
Figure 7.
Advanced features and functionality of the proposed approach.
The current study’s aim was to introduce a computationally and psychophysically optimized framework of auditory artifact suppression which can be more justifiable on perceptual grounds and also offer some advantages over existing approaches that rely on arbitrary adjustments of auditory masks’ parameters. Additionally, we are also currently preparing a series of additional investigations which will focus on the comparative examination of various artifact suppression approaches, also including the application with different types of coils (e.g., 8-figure).
Author Contributions
Conceptualization, K.P., I.V., D.K. and V.K.K.; methodology, K.P., I.V. and V.K.K.; software, K.P. and I.V.; validation, K.P., I.V. and V.K.K.; formal analysis, I.V.; investigation, K.P., E.C. and V.K.K.; resources, E.C., S.Z., Y.R. and A.Z.; data curation, K.P. and I.V.; writing—original draft preparation, K.P. and I.V.; writing—review and editing, S.Z., D.K. and V.K.K.; visualization, K.P. and I.V.; supervision, K.P. and V.K.K.; project administration, V.K.K.; funding acquisition, V.K.K. All authors have read and agreed to the published version of the manuscript.
Funding
This work was supported by the Action “Bilateral and Multilateral RTD cooperation between Greece and Israel”, supported by GSRT and IIA under grant agreement number 122994/i4.
Institutional Review Board Statement
The study was conducted in accordance with the Declaration of Helsinki and approved by the Aristotle University of Thessaloniki and National Ethics Committee (protocol code: 118371/2019 and date of approval: 14 October 2019).
Informed Consent Statement
Informed consent was obtained from all subjects involved in the study.
Data Availability Statement
No publicly archived datasets are available. The data are not publicly available due to privacy reasons.
Acknowledgments
The authors wish to thank Matteo Fecchio for most helpful discussions regarding the application of acoustic masks in TMS-EEG experiments.
Conflicts of Interest
The authors declare no conflict of interest. The funders had no role in the design of the study; in the collection, analyses, or interpretation of data; in the writing of the manuscript, or in the decision to publish the results.
References
- Ilmoniemi, R.J.; Kičić, D. Methodology for combined TMS and EEG. Brain Topogr. 2010, 22, 233–248. [Google Scholar] [CrossRef] [PubMed]
- Tremblay, S.; Rogasch, N.C.; Premoli, I.; Blumberger, D.M.; Casarotto, S.; Chen, R.; Di Lazzaro, V.; Farzan, F.; Ferrarelli, F.; Fitzgerald, P.B.; et al. Clinical utility and prospective of TMS–EEG. Clin. Neurophysiol. 2019, 130, 802–844. [Google Scholar] [CrossRef] [PubMed]
- Julkunen, P.; Kimiskidis, V.K.; Belardinelli, P. Bridging the gap: TMS-EEG from lab to clinic. J. Neurosci. Methods 2022, 369, 109482. [Google Scholar] [CrossRef] [PubMed]
- Russo, S.; Sarasso, S.; Puglisi, G.; Palù, D.D.; Pigorini, A.; Casarotto, S.; D’Ambrosio, S.; Astolfi, A.; Massimini, M.; Rosanova, M.; et al. TAAC-TMS Adaptable Auditory Control: A universal tool to mask TMS clicks. J. Neurosci. Methods 2022, 370, 109491. [Google Scholar] [CrossRef]
- Eeg-Olofsson, M.; Stenfelt, S.; Taghavi, H.; Reinfeldt, S.; Håkansson, B.; Tengstrand, T.; Finizia, C. Transmission of bone conducted sound–Correlation between hearing perception and cochlear vibration. Hear. Res. 2013, 306, 11–20. [Google Scholar] [CrossRef]
- Reinfeldt, S.; Stenfelt, S.; Håkansson, B. Estimation of bone conduction skull transmission by hearing thresholds and ear-canal sound pressure. Hear. Res. 2013, 299, 19–28. [Google Scholar] [CrossRef]
- Ross, J.M.; Sarkar, M.; Keller, C.J. Experimental Suppression of TMS-EEG Sensory Potentials. Neuroscience 2022, 16, 1663. [Google Scholar] [CrossRef]
- Biabani, M.; Fornito, A.; Mutanen, T.P.; Morrow, J.; Rogasch, N.C. Characterizing and minimizing the contribution of sensory inputs to TMS-evoked potentials. Brain Stimul. 2019, 12, 1537–1552. [Google Scholar] [CrossRef]
- Conde, V.; Tomasevic, L.; Akopian, I.; Stanek, K.; Saturnino, G.B.; Thielscher, A.; Bergmann, T.O.; Siebner, H.R. The non-transcranial TMS-evoked potential is an inherent source of ambiguity in TMS-EEG studies. Neuroimage 2019, 185, 300–312. [Google Scholar] [CrossRef]
- Harrison, R.; Bielefeld, E. Assessing Hidden Hearing Loss After Impulse Noise in a Mouse Model. Noise Health 2019, 21, 35. [Google Scholar] [CrossRef]
- Mantysalo, S.; Vuori, J. Effects of impulse noise and continuous steady state noise on hearing. Occup. Environ. Med. 1984, 41, 122–132. [Google Scholar] [CrossRef] [PubMed]
- Kardous, C.; Murphy, W. How Can We Measure Impulse Noise Properly? Available online: https://blogs.cdc.gov/niosh-science-blog/2018/07/18/impulse-noise/ (accessed on 16 May 2022).
- Margolis, R.H.; Stiepan, S.M. Acoustic method for calibration of audiometric bone vibrators. J. Acoust. Soc. Am. 2012, 131, 1221–1225. [Google Scholar] [CrossRef] [PubMed]
- Katz, J. Handbook of Clinical Audiology, 7th ed.; Lippincott Williams and Wilkins: Philadelphia, PA, USA, 2014. [Google Scholar]
- Voran, S. Observations on auditory excitation and masking patterns. In Proceedings of the 1995 Workshop on Applications of Signal Processing to Audio and Acoustics, New Paltz, NY, USA, 15–18 October 1995; pp. 206–209. [Google Scholar] [CrossRef]
- Moore, B.C.J.; Glasberg, B.R.; Baer, T. A model for the prediction of thresholds, loudness, and partial loudness. J. Audio Eng. Soc. 1997, 45, 224–240. [Google Scholar]
- Necciari, T.; Balazs, P.; Kronland-Martinet, R.; Ystad, S.; Laback, B.; Savel, S.; Meunier, S. Auditory Time-Frequency Masking: Psychoacoustical Data and Application to Audio Representations. In Speech, Sound and Music Processing: Embracing Research in India; Ystad, S., Aramaki, M., Kronland-Martinet, R., Jensen, K., Mohanty, S., Eds.; CMMR FRSM 2011; Lecture Notes in Computer Science; Springer: Berlin/Heidelberg, Germany, 2012; Volume 7172. [Google Scholar] [CrossRef]
- Heijden, M.V.; Kohlrausch, A. Using an excitation-pattern model to predict auditory masking. Hear. Res. 2012, 80, 38–52. [Google Scholar] [CrossRef]
- Glasberg, B.R.; Moore, B.C.J. A model of loudness applicable to time-varying sounds. J. Audio Eng. Soc. 2002, 50, 331–342. [Google Scholar]
- Leek, M.R. Adaptive procedures in psychophysical research. Percept. Psychophys. 2001, 63, 1279–1292. [Google Scholar] [CrossRef]
- Daly, E.J., 3rd; Wells, N.J.; Swanger-Gagné, M.S.; Carr, J.E.; Kunz, G.M.; Taylor, A.M. Evaluation of the multiple-stimulus without replacement preference assessment method using activities as stimuli. J. Appl. Behav. Anal. 2009, 42, 563–574. [Google Scholar] [CrossRef]
- Chowdhury, N.S.; Rogasch, N.C.; Chiang, A.K.I.; Millard, S.K.; Skippen, P.; Chang, W.J.; Bilska, K.; Si, E.; Seminowicz, D.A.; Schabrun, S.M. The influence of sensory potentials on transcranial magnetic stimulation-Electroencephalography recordings. Clin. Neurophysiol. 2022, 140, 98–109. [Google Scholar] [CrossRef]
- Carmi, L.; Tendler, A.; Bystritsky, A.; Hollander, E.; Blumberger, D.M.; Daskalakis, J.; Ward, H.; Lapidus, K.; Goodman, W.; Casuto, L.; et al. Efficacy and Safety of Deep Transcranial Magnetic Stimulation for Obsessive-Compulsive Disorder: A Prospective Multicenter Randomized Double-Blind Placebo-Controlled Trial. Am. J. Psychiatry 2019, 176, 931–993. [Google Scholar] [CrossRef]
- Carmi, L.; Alyagon, U.; Barnea-Ygael, N.; Zohar, J.; Dar, R.; Zangen, A. Clinical and electrophysiological outcomes of deep TMS over the medial prefrontal and anterior cingulate cortices in OCD patients. Brain Stimul. 2018, 11, 158–165. [Google Scholar] [CrossRef]
- Virtanen, J.; Ruohonen, J.; Näätänen, R.; Ilmoniemi, R.J. Instrumentation for the Measurement of Electric Brain Responses to Transcranial Magnetic Stimulation. Med. Biol. Eng. Comput. 1999, 37, 322–326. [Google Scholar] [CrossRef] [PubMed]
- He, P.; Wilson, G.; Russell, C. Removal of Ocular Artifacts from Electro-Encephalogram by Adaptive Filtering. Med Biol. Eng. Comput. 2004, 24, 407–412. [Google Scholar] [CrossRef] [PubMed]
- Mitra, P.; Bokil, H. Observed Brain Dynamics; Oxford University Press: Oxford, UK, 2007; ISBN 9780199864829. [Google Scholar]
- Kothe, C.A.; Makeig, S. BCILAB: A Platform for Brain-Computer Interface Development. J. Neural Eng. 2013, 10, 056014. [Google Scholar] [CrossRef] [PubMed]
- Mullen, T.R.; Kothe, C.A.E.; Chi, Y.M.; Ojeda, A.; Kerth, T.; Makeig, S.; Jung, T.P.; Cauwenberghs, G. Real-Time Neuroimaging and Cognitive Monitoring Using Wearable Dry EEG. IEEE Trans. Biomed. Eng. 2015, 62, 2553–2567. [Google Scholar] [CrossRef]
- Rogasch, N.C.; Sullivan, C.; Thomson, R.H.; Rose, N.S.; Bailey, N.W.; Fitzgerald, P.B.; Farzan, F.; Hernandez-Pavon, J.C. Analysing Concurrent Transcranial Magnetic Stimulation and Electroencephalographic Data: A Review and Introduction to the Open-Source TESA Software. Neuroimage 2017, 147, 934–951. [Google Scholar] [CrossRef]
- Kayser, J.; Tenke, C.E. Principal Components Analysis of Laplacian Waveforms as a Generic Method for Identifying ERP Generator Patterns: II. Adequacy of Low-Density Estimates. Clin. Neurophysiol. 2006, 117, 369–380. [Google Scholar] [CrossRef]
- Kayser, J.; Tenke, C.E. Principal Components Analysis of Laplacian Waveforms as a Generic Method for Identifying ERP Generator Patterns: I. Evaluation with Auditory Oddball Tasks. Clin. Neurophysiol. 2006, 117, 348–368. [Google Scholar] [CrossRef]
- Rosanova, M.; Casali, A.; Bellina, V.; Resta, F.; Mariotti, M.; Massimini, M.J. Natural frequencies of human corticothalamic circuits. Neuroscience 2009, 29, 7679–7685. [Google Scholar] [CrossRef]
- Fecchio, M.; Pigorini, A.; Comanducci, A.; Sarasso, S.; Casarotto, S.; Premoli, I.; Derchi, C.-C.; Mazza, A.; Russo, S.; Resta, F.; et al. The spectral features of EEG responses to transcranial magnetic stimulation of the primary motor cortex depend on the amplitude of the motor evoked potentials. PLoS ONE 2017, 12, e0184910. [Google Scholar] [CrossRef]
- Ross, J.M.; Ozdemir, R.A.; Lian, S.J.; Fried, P.J.; Schmitt, E.M.; Inouye, S.K.; Pascual-Leone, A.; Shafi, M.M. A structured ICA-based process for removing auditory evoked potentials. Sci. Rep. 2022, 12, 1–19. [Google Scholar]
- McCulloch, C.E.; Searle, S.R. Generalized, Linear, and Mixed Models; John Wiley & Sons: Hoboken, NJ, USA, 2004. [Google Scholar]
- Maris, E.; Oostenveld, R. Nonparametric statistical testing of EEG- and MEG-data. J. Neurosci. Methods 2007, 164, 177–190. [Google Scholar] [CrossRef] [PubMed]
- Delorme, A.; Makeig, S. EEGLAB: An open-source toolbox for analysis of single-trial EEG dynamics including independent component analysis. J. Neurosci. Methods 2004, 134, 9–21. [Google Scholar] [CrossRef] [PubMed]


Disclaimer/Publisher’s Note: The statements, opinions and data contained in all publications are solely those of the individual author(s) and contributor(s) and not of MDPI and/or the editor(s). MDPI and/or the editor(s) disclaim responsibility for any injury to people or property resulting from any ideas, methods, instructions or products referred to in the content. |
© 2023 by the authors. Licensee MDPI, Basel, Switzerland. This article is an open access article distributed under the terms and conditions of the Creative Commons Attribution (CC BY) license (https://creativecommons.org/licenses/by/4.0/).