Abstract
The mixed convection and heat transfer in enclosures with inner heat sources widely exist in building ventilation, cooling of nuclear reactors and cooling of electronic components. In this study, the heat transfer characteristics of mixed convection in an open arc-shaped cavity with double heat sources under the condition of bottom heating and top wall cooling are studied by two-dimensional numerical simulation using ANSYS FLUENT. The influence of the Reynolds number on flow structures, transient characteristics and heat transfer characteristics in the arc cavity was studied by changing inlet wind speed. As the Reynolds number changes from 2.19 × 10⁵ to 4.38 × 10⁷, the flow in the fully developed stage will evolve from turbulent flow to periodic flow and then to steady state flow. In this study, the critical Reynolds number intervals for three different flow states are given. The increase in the Reynolds number enhances the heat convection in the cavity. The difference between heat convection and heat conduction is increased, which has a linear relationship with the Reynolds number. As the Reynolds number increases, the heat removal capacity in the middle region of the double heat sources is not always enhanced, which is due to the sudden change in flow structure and flow state around Re = 1.18 × 10⁷.
1. Introduction
Mixed convection in the cavity is a classic problem in heat transfer and fluid flow field, which has a strong practical application background, such as ventilation of factory buildings and greenhouses, heat dissipation of micro-electronic devices, ventilation of rooms with radiators in winter, etc. In hot summer and cold winter regions, structures often face local overheating, poor ventilation and high pollutant concentration. Therefore, the problem of flow heat transfer in the inner space of the structure has attracted extensive attention.
In recent years, many scholars have studied the problem of convective heat transfer in cavities, including natural convection and mixed convection, and the research methods involve theoretical analysis, numerical simulation, model tests, etc.
The study on natural convection in cavities has been relatively extensive. In terms of theoretical analysis, Plapp [1] used linear stability analysis to solve the vertical thermal boundary layer in 1957 and discussed the instability of the specific boundary layer. As a relatively simple method in theoretical analysis, dimensional analysis has been applied by a large number of scholars in the research of convective heat transfer of cavities with different shapes [2,3,4,5]. As a relatively economical and convenient means, numerical simulation has been widely used in recent years. Holtzman [6] studied natural convection in an isosceles triangle cavity by combining numerical simulation with flow visualization experiment and obtained the influence rule of aspect ratio and Grashof number on flow bifurcation. Welhezi et al. [7] conducted a three-dimensional numerical simulation for a closed square cavity with external cooling and internal heat source, and they found that the heat transfer increased significantly with the increase in Rayleigh number. When the Rayleigh number was 107, the optimal heat transfer effect was achieved. With the expansion of application fields, some scholars have extended the types and states of fluids in recent years [8,9]. Although the method of the model test has operational limitations and equipment requirements, as the most authentic and intuitive method, it has been applied in a large number of studies, including the smoke flow method, schlieren experiment and interference imaging. Eckert [10] first used the interference imaging method to display the flow and temperature distribution in the cavity in 1960, and the schlieren experiment is relatively simple and easy to operate. It has been widely used in subsequent studies with the development of PIV technology [11,12,13].
The study of mixed convection in a cavity is not as significant as that of natural convection, and its development started late. The research either focuses on the discussion of the wind environment and thermal comfort inside the long-span structure, which focuses on the evaluation scheme for the actual project, or the theoretical analysis of the flow structure and heat transfer characteristics in the micro-scale model. The first part of the study mainly used a combination of numerical simulation and field measurement. For example, Wong et al. [14] used wind tunnel tests and computational fluid dynamics (CFDs) simulation to study the active chimney effect to enhance natural ventilation, considering the design factors including the size and location of the chimney. Su et al. [15] used the wind tunnel test and CFDs to study the natural ventilation and dust suppression effect of coal sheds with porous wind walls under the action of wind. By estimating the ventilation volume and dust suppression rate, the dust suppression effect of coal sheds with different gable walls was quantified. The latter part is mainly analyzed by numerical simulation [16,17,18,19,20].
A series of simulation studies have been carried out for the mixed convection of different forms of heat sources and different shapes of cavities [21,22,23,24]. Although a large number of studies have been conducted on in-depth studies on the problem of convective heat transfer in cavities, there are few studies on mixed convection in the cavity with an opening. Some previous research model structures are relatively more basic and simplified and lack the exploration of unsteady characteristics and a comprehensive consideration of ventilation and heat dissipation efficiency. However, this is closely related to the comfort of the actual engineering structure environment. Especially in recent years, the environmentally friendly coal shed has been widely used. The heat release of coal piles causes local overheating of the environment, which affects the comfort level and the health of the operators.
Therefore, this study takes the current large-span coal shed as the engineering background and simplifies its structure into a curved cavity. The two-dimensional numerical simulation is adopted to conduct a transient study on the fluid flow and the heat transfer inside the curved cavity. This paper discusses the influence of different Re on the flow structure, heat transfer efficiency, heat dissipation efficiency and transient flow characteristics in the fully developed stage of the curved cavity. It is of important practical significance to create a good indoor wind and thermal environment.
2. Physical Model and Numerical Method
2.1. Arc-Shaped Cavity Model
The model considered in this study is an arc-shaped cavity with free opening and closing of the opening and containing an internal heat source. Figure 1 is a schematic diagram of the two-dimensional arc-shaped cavity model. The origin of the coordinates is set at the midpoint of the bottom edge, and the height of the arc-shaped cavity is H (H = 49 m). The length of the bottom side is L (L/H = 2.76). The height of the entrance on both sides is h1 (h1/H = 0.12). The width of the export on the top side is d (d/H = 0.34). The heat source is an isosceles trapezoid, the heat source height is h2 (h2/H = 0.28), the top bottom length is l1 and the bottom length is l2 (l1/l2 = 0.22). The two heat sources are symmetrically distributed. The monitoring point in the arc cavity is located near the heat source, and the dimensionless coordinates are P6(−0.37, 0.34) and P6*(0.37, 0.34). The arc wall surface is set at a fixed temperature to reflect the ambient temperature.
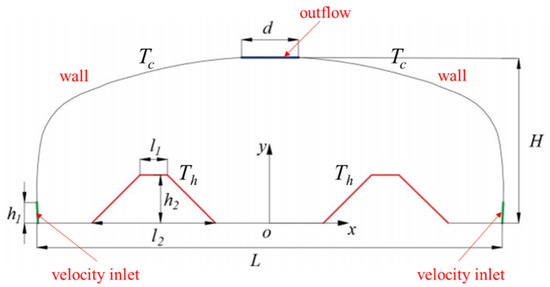
Figure 1.
Schematic of the arc-shaped cavity.
2.2. Basic Governing Equations
The governing equations of flow field and temperature field in the coal shed are Navier–Stokes equations and energy equations based on the Boussineq hypothesis. In order to facilitate the comparison of working conditions with different Rayleigh numbers, the governing equation processed in this paper is dimensionless, and the dimensionless scale is as follows [25]:
x, y ≅ H; (T − T0) ≅ (Th −Tc);
u, v ≅ u0; ρ ≅ μu0/H.
The dimensionless governing equations are continuity, Navier–Stokes and energy equations, as follows:
In fluid mechanics, Re, Ra, Pr, Nusselt number (local: Nu′ and average: Nu) and aspect ratio (A) are important dimensionless parameters that control the intensity of mixed convection heat transfer. Here, the working fluid considered for this study is air (Pr = 0.71). Other definitions are as follows:
At the initial time, the working fluid is isothermal and motionless and satisfies T0 = 0. It is assumed that the arc wall isothermal cooling is Tc = −0.008 and equal to the external temperature. The heat source wall is isothermal heating with Th = 0.9677 ignoring the radiation effect. The bottom of the curved cavity is adiabatic, there is no slip or deformation on all walls and the fluid velocity on the wall is zero, as shown in Equation (9). The whole structure is subject to vertical downward gravity g = −9.8 m/s2.
u = 0, v = 0, T0 = 0 (τ = 0)
2.3. Numerical Method
In this study, the governing Equations (1)–(4) are discretized by the finite volume method using ANSYS FLUENT (17.2). The convection term of the equation is discretized by the second-order upwind scheme, and the diffusion term is discretized by the second-order central difference scheme. The time term is discretized using the second-order implicit scheme. The separated solver was selected for solving, and the SIMPLE algorithm is used to solve the coupling problem of pressure and velocity [26]. Due to the large scale of the model studied in this paper and the high Re involved (up to 105~107), the improved turbulence model (RNG k-ε model) is used for numerical solution, and the standard wall function is used to calculate the region near the boundary layer.
For large-scale models, it is difficult to verify the numerical with experimental results. However, according to the study on the numerical simulation method of natural convection with a high Rayleigh number in a closed cavity mentioned in the literature [27], when the Rayleigh number is high (especially Ra ≥ 108), the flow transitions into turbulence and is particularly sensitive to various disturbances. Therefore, the turbulence model should be selected for numerical simulation. In addition, some scholars [28] have used the RNG k-ε model to conduct numerical simulation research on cavities containing independent heat sources. Therefore, the numerical method proposed in this paper is reasonable and suitable.
Symmetric block-structured grids are used to partition the computational domain. Figure 2 shows a grid division diagram. When dividing the grid, the height of the first layer is set to 0.16 m and the growth factor is set to 1.008. The quality of the divided mesh is tested, and the test results show that the mesh quality is good and that the aspect ratio is less than 20.
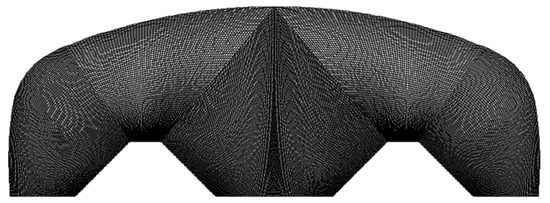
Figure 2.
Diagram of mesh distribution.
Before the calculation, grid and time step independence studies are carried out to test four groups of grids with mesh quantities: 40,000, 81,000, 97,000 and 160,000 as well as four different time steps: 0.2, 0.4, 0.6 and 0.8. It is worth noting that all the independent validations mentioned were conducted at Re = 3.29 × 10⁶. The accuracy of this study was verified by comparing the time–mean temperature of symmetrical monitoring points P6(−0.37, 0.34) and P6*(0.37, 0.34) in the flow-sensitive region. The convergence criteria are less than 10−5.
The results of grid and time step sensitivity tests are shown in Table 1 and Table 2, respectively. The results in Table 1 are compared with 210 × 495 as the benchmark. The results show that when the number of grids is greater than 97,000, the change rate of monitoring variables is less than 1%. Similarly, the comparison of the remaining results in Table 2 with 0.2 as the basis shows that when the time step is less than 0.4, the relative error is almost less than 2%. Therefore, based on the calculation accuracy and calculation time, the grid with a grid quantity of 97,000 is selected as the calculation grid, and the time step is selected as 0.2.

Table 1.
Grid independence verification.
Table 2.
Step size independence verification.
3. Results and Discussion
Figure 3 shows the time evolution of Nu on the heat source wall in the range of Re from 105 to 107. With the development of time, the general trend of Nu increases firstly, then fluctuates slightly and finally becomes quasi-steady. As Re increases from 2.19 × 10⁵ to 4.38 × 10⁶, the changes in black and red curves are disordered and irregular in the full development stage. When Re = 7.67 × 10⁶, the variation of Nu shows a pattern of oscillating fluctuation, which is approximately periodic. When Re is increased to 1.39 × 10⁷, the Nusselt number does not change with the development of time, showing a steady-state characteristic. It can be preliminarily seen that when the Ra is fixed, with the increase in Re, the flow in the curved cavity of the double heat source presents a transformation from weak turbulence to periodic and then to steady state, and the heat transfer near the heat source also first intensifies and then becomes weak, with little overall fluctuation. However, to determine how the flow field changes with Re and to calculate the range of Re values of flow transition, a large number of numerical calculations are necessary, which will be discussed in detail in Section 3.1.
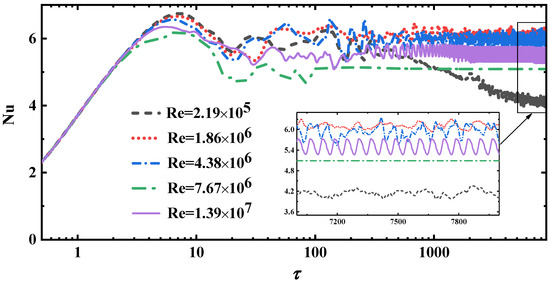
Figure 3.
The time development series of averaged Nu on the heated wall in the fully developed stage.
3.1. Transient Characteristics
As it is discussed in Figure 3, with the increase in Re, the flow in the arc cavity changes from weak turbulence to periodic and then to steady normal. When Re = 7.67 × 10⁶, a periodic oscillation of the flow can be observed. In order to quantitatively observe this transformation and obtain the critical Reynold numbers, this study involves a large range of Re from 2.19 × 10⁵ to 4.38 × 10⁷.
Figure 4 shows the time evolution and frequency spectrum analysis results at monitoring points under different Re. It can be seen that with the increase in Re, the temperature at the monitoring point does have a rule of transition from turbulent flow to periodic flow and then to constant transition, which is consistent with the results of Figure 3. As shown in Figure 4a,b, the temperature time series oscillates visibly, and the power spectrum has no clear main harmonic frequency. When Re = 6.14 × 10⁶, the flow remains aperiodic. Although the frequency spectrum cannot clearly show the main frequency and harmonious frequency, there is a trend of transition to periodicity. In Figure 4c (Re = 6.15 × 10⁶), the temperature development sequence at the monitoring point is visibly periodic, and a clear master frequency appears in the spectrum diagram, with the master frequency of f = 0.00656. It can be seen that the critical Re for the transition from weak turbulence to periodic flow is between 6.14 × 10⁶ and 6.15 × 10⁶ in the case of mixed convection in a curved cavity with air as the medium.
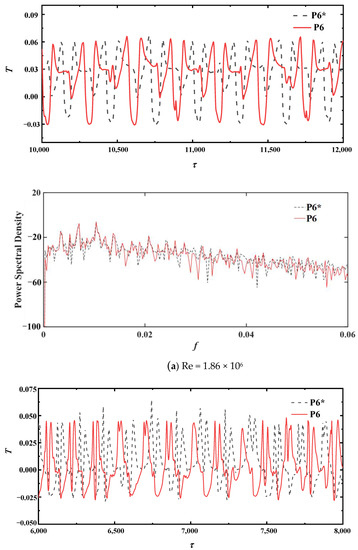
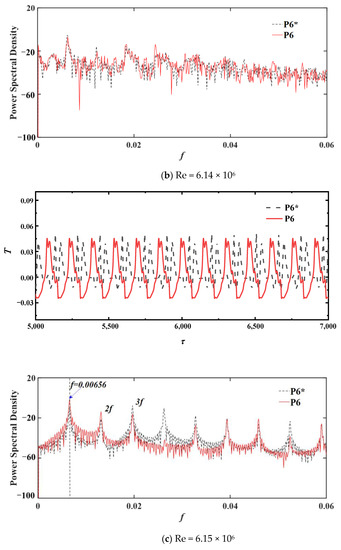
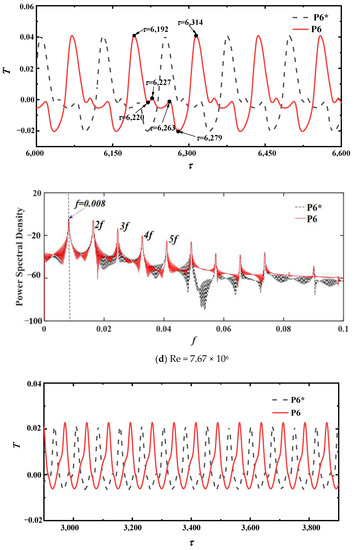
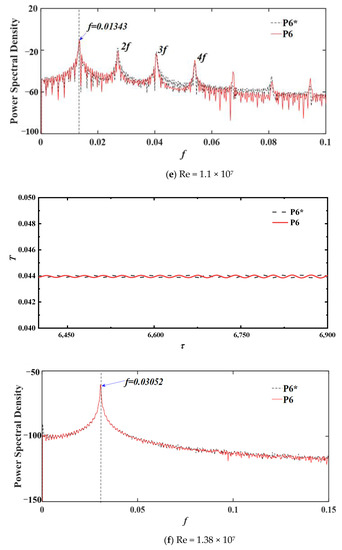
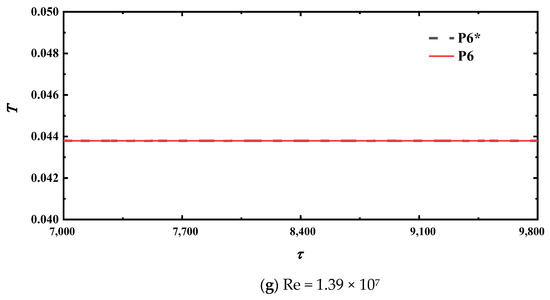
Figure 4.
Temperature time series and PSD of the mixed convection at P6, P6* with different Re.
In Figure 4d–f (Re = 7.67 × 10⁶, 1.1 × 10⁷ and 1.38 × 10⁷, respectively), the time series of temperature at the monitoring points remain periodic, but the amplitude decreases with the increase in Re. The main frequency f in the corresponding frequency spectrum is 0.008, 0.01343 and 0.03052, respectively. The double harmonic frequency becomes clearer, and the number of harmonic frequencies decreases, and finally even disappears. As Re increases to Re = 1.39 × 10⁷, the temperatures at the monitoring point no longer change with time, and the temperature time series at the symmetric point coincides with a steady state. Therefore, the critical Re for the transition from periodic flow to steady flow is between 1.38 × 10⁷ and 1.39 × 10⁷.
In conclusion, with a fixed Ra (Ra = 2.36 × 10¹²), with the increase in Re (105~107), the fluid in the arc cavity undergoes the evolution from turbulent flow to periodic flow and then to steady flow. The flow period and amplitude become smaller with the increase in Re, the main harmonic frequency of the corresponding spectrum becomes clearer, the main frequency increases with the increase in Re and the number of harmonic frequencies decreases to disappear. Finally, the flow tends to be steady.
In Figure 3 and Figure 4, periodic characteristics of flows are observed from the transient perspective. In order to display the changes of flow structure in the curved cavity more intuitively from spatial dimension, we select the temperature isotherm and streamline distribution in one cycle after the flow enters the full development stage when Re = 7.67 × 10⁶. Figure 5 shows the temperature isotherm and streamline in a period (τ = 6192~6314). The cold plume invades from the two corners of the cavity along both inclined sides of the heat source and moves upward near the top of the heat source due to the entrainment of the rising hot plume in the core region. The cold and hot plume front generate rapid energy exchange, and the speed decreases and tilts toward the middle area. These rising plumes near the two heat sources oscillate, forming a higher-temperature convective vortex in the middle area of the two heat sources, and resulting in a low-temperature area directly on both sides of the heat source and the cavity wall surface.
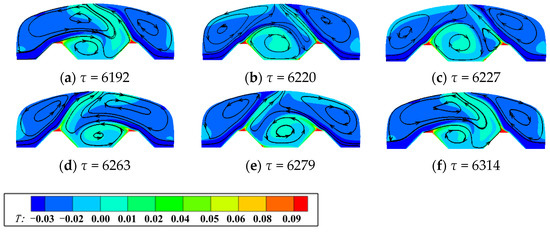
Figure 5.
Evolution of isotherms and streamlines in a period for Re = 7.67 × 10⁶.
3.2. Flow Structures
Figure 6 shows the temperature isotherm and streamline under different Re at fixed time (τ = 4620). It can be seen that the flow in the arc cavity is in a transition gradually from asymmetric multicellular structure to bi-cellular structure with the increase in Re. When Re is small (Re = 2.19 × 10⁵), the flow structure in the curved cavity is asymmetric, and the streamline is disordered. There are multiple convection cells, and the vertical temperature on both sides of the heat source presents obvious stratification, indicating that heat conduction plays a leading role. With the increase in Re (6.58 × 10⁵ ≤ Re ≤ 2.19 × 10⁶), the cold intrusion flow on both sides gradually overflows the top of the heat source and acts with the rising hot plume in the middle to form a front. With the increase in Re, the temperature in the middle–high temperature zone decreases, and the temperature stratification on both sides of the heat source is still visible. As Re continues to increase (9.86 × 10⁶ ≤ Re ≤ 1.14 × 10⁷), the intensity of the hot and cold plume fronts near the two heat sources gradually increases and oscillates alternately in the middle area of the arc-shaped cavity, resulting in the rapid release of high-temperature air in the core region and the formation of large convective cells (the convection cell on the right is clockwise and another one on the left is counterclockwise) on both sides of the cavity, without obvious stratification of vertical temperature.
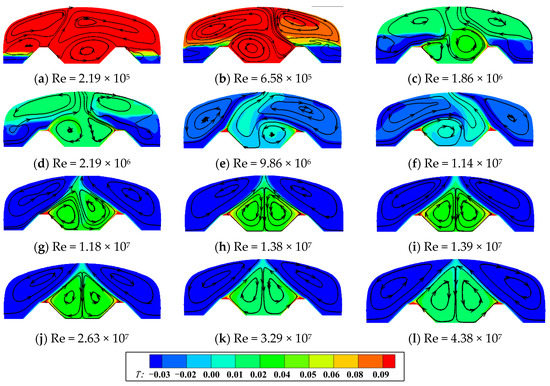
Figure 6.
Fully developed stage of isotherms and streamlines in the arc-shaped cavities for different Re.
In addition, it is worth noting that the temperature of the region between the two heat sources does not always decrease with the increase in Re. When Re is greater than 1.18 × 10⁷, the intensity of cold intrusion flow on both sides of the cavity is much stronger than that of the hot plume near the heat source. The cold and hot plume fronts are affected by the inertial force and they directly reach the top outlet position, forming two symmetric convection cells in the core area, which is not conducive to the heat discharge in the core area.
3.3. Heat Transfer
In order to study the dependence of heat transfer on Re in the arc cavity and near the heat source, the convective heat flux qcv, conductive heat flux qcd and total thermal heat flux qt in the cavity and the Nusselt number on heat source wall surface are monitored [29], in view of the phenomenon according to which the temperature in the middle region of the two heat sources changes regularly under the influence of Re. We monitor the average temperature Tm in the middle region of the two heat sources at the full development stage and introduce the effective heat coefficient m to evaluate the effect of convective heat dissipation in the arc-shaped cavity under different Re. Monitoring variables are defined as follows:
Heat flux:
Effective heat coefficient:
Figure 7 shows the variation of the average heat flux versus Re in the curved cavity with two heat sources. The total heat flux qt and convection heat flux qcv are essentially similar, and the magnitude of conduction heat flux qcd is relatively small. The heat transfer in the arc cavity is controlled by convection heat transfer. When Re is small, qcv and qcd are of the same order of magnitude. When Re is greater than 2.0 × 10⁶, there is a linear relationship, qt~4.9Re, qcv~4.89Re, qcd~0.001Re. It can be seen that the increase in Re can increase the convective heat transfer in the curved cavity structure, while the heat conduction only increases slightly. The gap between heat convection and heat conduction increases with the increase in Re, which is similar to the phenomenon observed in the cavity with a single heat source.
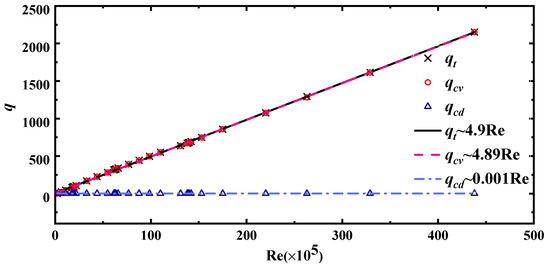
Figure 7.
The values of various heat fluxes in curved cavity under different Re numbers and their fitting curves.
In actual industrial systems, heat transfer near the heat source deserves more attention. Therefore, Figure 8 shows the variation of Nu on the heat source wall with Re. As Re is less than 1.75 × 10⁶, Nu gradually increases to reach the peak. When Re ranges from 1.75 × 10⁶ to 6.14 × 10⁶, Nu~−0.0059Re. As Re ranges from 6.15 × 10⁶ to 1.1 × 10⁷, Nu~−0.017Re. As Re continued to increase, with Re in the range of 1.31 × 10⁷ to 4.38 × 10⁷, Nu~−0.001Re.
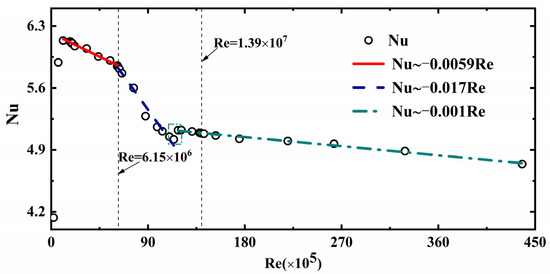
Figure 8.
The change of the averaged Nu on the heat source wall with Re.
In the range of Re from 6.14 × 10⁶ to 6.15 × 10⁶, the decreasing rate of Nu increases with Re, which corresponds to the flow state transformation described in Section 3.1. The flow changes from weak turbulence to periodic flow, the flow disturbance decreases, the convection is not so intense as before and the heat transfer effect of the heat source decreases. In the range of Re from 1.14 × 10⁷ to 1.18 × 10⁷, a small temporary rise of Nu appears. After this stage, Nu still maintains a linear decline, but the rate of declination is lower than before. This corresponds to the phenomenon that the temperature in the middle region of the two heat sources experiences a sudden rise with Re between 1.14 × 10⁷ and 1.18 × 10⁷, as reflected in Figure 6.
Figure 9 shows the variation trend of the average temperature Tm in the middle area of the two heat sources with Re. It can be divided into three ranges, as shown in Figure 9. When Re is less than 6.14 × 10⁶, Tm presents a quasi-power function decline with a gradual decline rate: Tm~0.38Re−0.64. Tm changes slightly in the range of Re from 6.15 × 10⁶ to 1.14 × 10⁷. When Re ranges from 1.14 × 10⁷ to 1.18 × 10⁷, the mean temperature rises sharply, corresponding to Figure 6g. Tm continues to decrease as Re increases, Tm~−6.4 × 10⁻⁵Re. In conclusion, the high-temperature region between the two heat sources has a significant heat removal effect in the range of Re from 6.15 × 10⁶ to 1.14 × 10⁷.
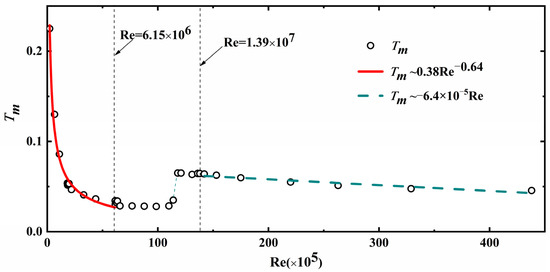
Figure 9.
The average temperature in the middle region of the two heat sources varies with Re.
Figure 10 shows the change curve of effective heat coefficient m with Re. When Re is less than 6.14 × 10⁶ (the flow is turbulent), the effective heat coefficient increases linearly with Re, m~0.039Re. In the range of Re from 6.15 × 10⁶ to 1.14 × 10⁷, the effective heat coefficient increases slowly. As Re increases from 1.14 × 10⁷ to 1.18 × 10⁷, m rises sharply. When Re exceeds 1.18 × 10⁷, m shows a slow rising state. When Re is greater than 1.39 × 10⁷, that is, when the flow enters the quasi-steady stage, m has a power function development with the increase in Re, m~2.45Re0.23. Figure 10 also shows that the heat removal capacity of the curved cavity structure generally increases with the increase in Re. Especially in the range of 1.14 × 10⁷ to 1.18 × 10⁷, the heat removal capacity presents a steep rise. In actual application, wind speed can be properly controlled to adjust Re to achieve the maximum benefit of waste heat removal.
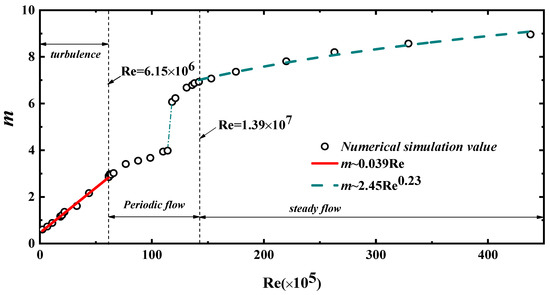
Figure 10.
The change of effective heat coefficient m with Re number.
4. Conclusions
Aiming at the problem of mixed convection in a curved cavity with an internal heat source, the transient characteristics of the fluid flow and heat transfer characteristics at the fully developed stage under different Re are studied by using a two-dimensional numerical simulation technique. The following conclusions can be drawn:
- When Ra is fixed (Ra = 2.36 × 10¹²), with the increase in Re, the flow in the arc cavity experiences a transition from turbulent flow to periodic flow and then to a steady flow. The flow period and amplitude decrease with the increase in Re, and the main frequency increases with the increase in Re. The critical Re of transition from weak turbulence to periodic flow is about 6.14 × 10⁶ and 6.15 × 10⁶, and the critical Re of transition from periodic flow to constant flow is between 1.38 × 10⁷ and 1.39 × 10⁷. The flow structure changes from asymmetric and multiple convection cells to symmetric double convection cells.
- There is a linear positive correlation between the heat flux and Re, qt~4.9Re, qcv~4.89Re, qcd~0.001Re. Increasing the number of Re increases the heat convection in the curved cavity structure, and the gap between heat convection and heat conduction also increases with the increase in Re. Nu increases first and then gradually decreases with Re. We found that for 1.75 × 10⁶ ≤ Re ≤ 6.14 × 10⁶, Nu~−0.0059Re, for 6.15 × 10⁶ ≤ Re ≤ 1.1 × 10⁷, Nu~−0.017Re and for 1.31 × 10⁷ ≤ Re ≤ 4.38 × 10⁷, Nu~−0.001Re.
- The average temperature Tm in the middle region of the two heat sources is similar to Nu, while the effective heat coefficient m generally conforms to the rising trend. After the steep rise of Re in the range from 1.14 × 10⁷ to 1.18 × 10⁷, the continued increase in Re has little effect on the removal of waste heat.
As the Reynolds number increases, the heat removal capacity in the middle region of the double heat sources is not always enhanced, which is due to the sudden change in flow structure and flow state around Re = 1.18 × 10⁷. In practical engineering problems, the inlet wind speed can be controlled in the most appropriate Re to achieve a better heat removal effect.
Author Contributions
Conceptualization, H.C., F.X. and S.C.S.; Methodology, H.C., H.A. and W.W.; Validation, Z.H.; Formal analysis, H.A. and B.H.; Resources, Z.H. and B.H.; Data curation, W.W.; Writing—original draft, H.C.; Writing—review & editing, H.A., W.W., Z.H., B.H., F.X., Q.L. and S.C.S.; Visualization, H.C.; Supervision, F.X., Q.L. and S.C.S.; Project administration, Q.L. All authors have read and agreed to the published version of the manuscript.
Funding
This research was funded by [Programs of Natural Science Foundation of Hebei Province of China] grant number [E2022210069, E2019210026], [National Natural Science Foundation of China] grant number [11802186], [Innovation research group project of Natural Science Foundation of Hebei Province of China] grant number [E2022210078], [Science and Technology Winter Olympics Special Project] grant number [21475402D] and [High-end Talents Project of Hebei Province of China] grant number [(2019) 63].
Data Availability Statement
All data produced from the simulations are used in this paper as the form of Tables and Figures.
Conflicts of Interest
The authors declare no conflict of interest.
Nomenclature
| A | Aspect ratio | T0 | The initial temperature |
| d | The width of the export on the top side of the arc cavity | Tc, Th | The external temperature, the reservoir temperature |
| g | Acceleration of gravity | Tm | The average temperature in the middle region of the two heat sources |
| H | The height of the arc cavity | u, v | Dimensionless horizontal and vertical velocity |
| h1 | The height of the entrance on both sides of the arc cavity | X, Y | Dimensionless coordinate system |
| h2 | The height of trapezoidal heat sources | κ | Thermal conductivity |
| L | The length of the bottom of the arc cavity | ρ | Medium density |
| l1 | The top length of the trapezoidal heat sources | µ | Viscosity coefficient |
| l2 | The bottom length of the trapezoidal heat sources | ω | The magnitude of vorticity |
| m | Effective heat coefficient | β | Coefficient of thermal expansion |
| Nu | Mean Nussert number of the heated wall | θ | Dimensionless temperature |
| P | Dimensionless volume force | τ | Dimensionless time |
| Pr | Prandtl number | Dimensionless temperature difference | |
| qt | Total heat flux in the y-direction | Re | Reynolds number |
| qcv | Averaged convective heat flux in the y-direction | Ra | Rayleigh number |
| qcd | Averaged conductive heat flux in the y-direction |
References
- Plapp, J.E. The analytic study of laminar boundary-layer stability in free convection. J. Aeronaut. Sci. 1957, 24, 318–319. [Google Scholar]
- Patterson, J.; Imberger, J. Unsteady natural convection in a rectangular cavity. J. Fluid Mech. 1980, 100, 65–86. [Google Scholar] [CrossRef]
- Aydın, O.; Guessous, L. Fundamental correlations for laminar and turbulent free convection from a uniformly heated vertical plate. Int. J. Heat Mass Transf. 2001, 44, 4605–4611. [Google Scholar] [CrossRef]
- Xu, F.; Patterson, J.C.; Lei, C. Transient natural convection flows around a thin fin on the sidewall of a differentially heated cavity. J. Fluid Mech. 2009, 639, 261–290. [Google Scholar] [CrossRef]
- Saha, S.C.; Patterson, J.C.; Lei, C. Natural convection boundary-layer adjacent to an inclined flat plate subject to sudden and ramp heating. Int. J. Therm. Sci. 2010, 49, 1600–1612. [Google Scholar] [CrossRef]
- Holtzman, G.A.; Hill, R.W.; Ball, K.S. Laminar natural convection in isosceles triangular enclosures heated from below and symmetrically cooled from above. Heat Transf. 2000, 122, 485–491. [Google Scholar] [CrossRef]
- Welhezi, H.; Ben-Cheikh, N.; Ben-Beya, B. Numerical Analysis of Natural Convection Between a Heated Cube and its Spherical enclosure. Int. J. Therm. Sci. 2020, 150, 105828. [Google Scholar] [CrossRef]
- Usman, M.; Son, J.H.; Park, I.S. A low-Rayleigh transition into chaos for natural convection inside a horizontal annulus at Prandtl number 0.1. Int. J. Heat Mass Transf. 2021, 179, 121658. [Google Scholar] [CrossRef]
- Tasnim, S.H.; Mahmud, S. Laminar free convection inside an inclined L-shaped enclosure. Int. Commun. Heat Mass Transf. 2006, 33, 936–942. [Google Scholar] [CrossRef]
- Eckert ER, G.; Hartnett, J.P.; Irvine, T.F. Flowvisualization studies of transition to turbulence in freeconvection flow. ASME Pap. 1960, 60, 250. [Google Scholar]
- Patterson, J.C.; Graham, T.; Schöpf, W.; Armfields, W. Boundary layer development on a semi-infinite suddenly heated vertical plate. J. Fluid Mech. 2002, 453, 39–55. [Google Scholar] [CrossRef]
- Xu, F.; Patterson, J.C.; Lei, C. Shadowgraph observations of the transition of the thermal boundary layer in a side-heated cavity. Exp. Fluids 2005, 38, 770–779. [Google Scholar] [CrossRef]
- Cui, G.; Pan, C.; Gao, Q.; Li, L.; Wang, J. Experimental study on the influence of groove direction on flow structure in turbulent boundary layer. Chin. J. Theor. Appl. Mech. 2017, 49, 1201–1212. [Google Scholar]
- Wong, N.H.; Heryanto, S. The study of active stack effect to enhance natural ventilation using wind tunnel and computational fluid dynamics (CFD) simulations. Energy Build. 2004, 36, 668–678. [Google Scholar] [CrossRef]
- Su, N.; Peng, S.; Hong, N.; Zhang, J. Experimental and numerical evaluation of wind-driven natural ventilation and dust suppression effects of coal sheds with porous gables. Build. Environ. 2020, 177, 106855. [Google Scholar] [CrossRef]
- Xia, J.; Xin, M.; Zhang, H. Numerical study of natural convection heat transfer in partially open cavity. J. Chongqing Univ. 1989, 12, 20–26. [Google Scholar]
- Chenak, A.K.; Mbaye, M.; Vasseur, P.; Bilgen, E. Mixed convection and conduction heat transfer in open cavities. Heat Mass Transf. 1995, 30, 229–235. [Google Scholar] [CrossRef]
- Khanafer, K.; Vafai, K.; Lightstone, M. Mixed convection heat transfer in two-dimensional open-ended enclosures. Int. J. Heat Mass Transf. 2002, 45, 5171–5190. [Google Scholar] [CrossRef]
- Premachandran, B.; Balaji, C. Mixed convection heat transfer from a horizontal channel with protruding heat sources. Heat Mass Transf. 2005, 41, 510–518. [Google Scholar] [CrossRef]
- Zhang, C.; Yang, M.; Shan, Y.; Zhang, L. Numerical Simulation of Mixed Convection Heat Transfer in an Enclosure with Vertical Isothermal Plate. J. Eng. Thermophys. 2009, 30, 309–311. [Google Scholar]
- Alsabery, A.; Vaezi, M.; Tayebi, T.; Hashim, I.; Ghalambaz, M.; Chamlha, A.J. Nanofluid mixed convection inside wavy cavity with heat source: A non-homogeneous study. Case Stud. Therm. Eng. 2022, 34, 102049. [Google Scholar] [CrossRef]
- Xia, S.; Mostafavi, M.; Alghazali, T.; Sadi, S.; Guerrero, J.W.G.; Suksatan, W.; Toghraie, D.; Khan, A. Numerical investigation of nanofluid mixed convection in a T-shaped cavity by considering a thermal barrier. Alex. Eng. J. 2022, 61, 7393–7415. [Google Scholar] [CrossRef]
- Ali, M.; Akhter, R.; Alim, M. Magneto-mixed convection in a lid driven partially heated cavity equipped with nanofluid and rotating flat plate. Alex. Eng. J. 2022, 61, 257–278. [Google Scholar] [CrossRef]
- Keya, S.; Yeasmin, S.; Rahman, M.; Karim, M.F.; Amin, M.R. Mixed convection heat transfer in a lid-driven enclosure with a double-pipe heat exchanger. Int. J. 2022, 13, 100131. [Google Scholar] [CrossRef]
- Sun, M. Numerical Simulation of Mixed Convective Heat Transfer in a Two-Dimensional Open Chamber. Ph.D. Thesis, Harbin Engineering University, Harbin, China, 2005. [Google Scholar]
- Lei, C.; Armfield, S.W.; Patterson, J.C. Unsteady natural convection in a water-filled isosceles triangular enclosure heated from below. Int. J. Heat Mass Transf. 2008, 51, 2637–2650. [Google Scholar] [CrossRef]
- Li, G.; Ma, H. Numerical simulation of natural convection with Gorelli number laminar flow in a closed chamber. J. Civ. Eng. Manag. 2004, 21, 14–17. [Google Scholar]
- Ma, B.; Wang, Y.; Zhao, X. Effect of inclination Angle on turbulent natural convection heat transfer in a closed square cavity with internal heat source. J. Lanzhou Jiaotong Univ. 2021, 40, 79–87. [Google Scholar]
- Cui, H.; Xu, F.; Saha, S. Transition to unsteady natural convection flow in a prismatic enclosure of triangular section. Int. J. Therm. Sci. 2017, 111, 330–339. [Google Scholar] [CrossRef]


Disclaimer/Publisher’s Note: The statements, opinions and data contained in all publications are solely those of the individual author(s) and contributor(s) and not of MDPI and/or the editor(s). MDPI and/or the editor(s) disclaim responsibility for any injury to people or property resulting from any ideas, methods, instructions or products referred to in the content. |
© 2023 by the authors. Licensee MDPI, Basel, Switzerland. This article is an open access article distributed under the terms and conditions of the Creative Commons Attribution (CC BY) license (https://creativecommons.org/licenses/by/4.0/).