
The Shear Strength of Root–Soil Composites in Different Growth Periods and Their Effects on Slope Stability

Abstract
:1. Introduction
2. Materials and Methods
2.1. Materials
2.1.1. Vegetation
2.1.2. Soil
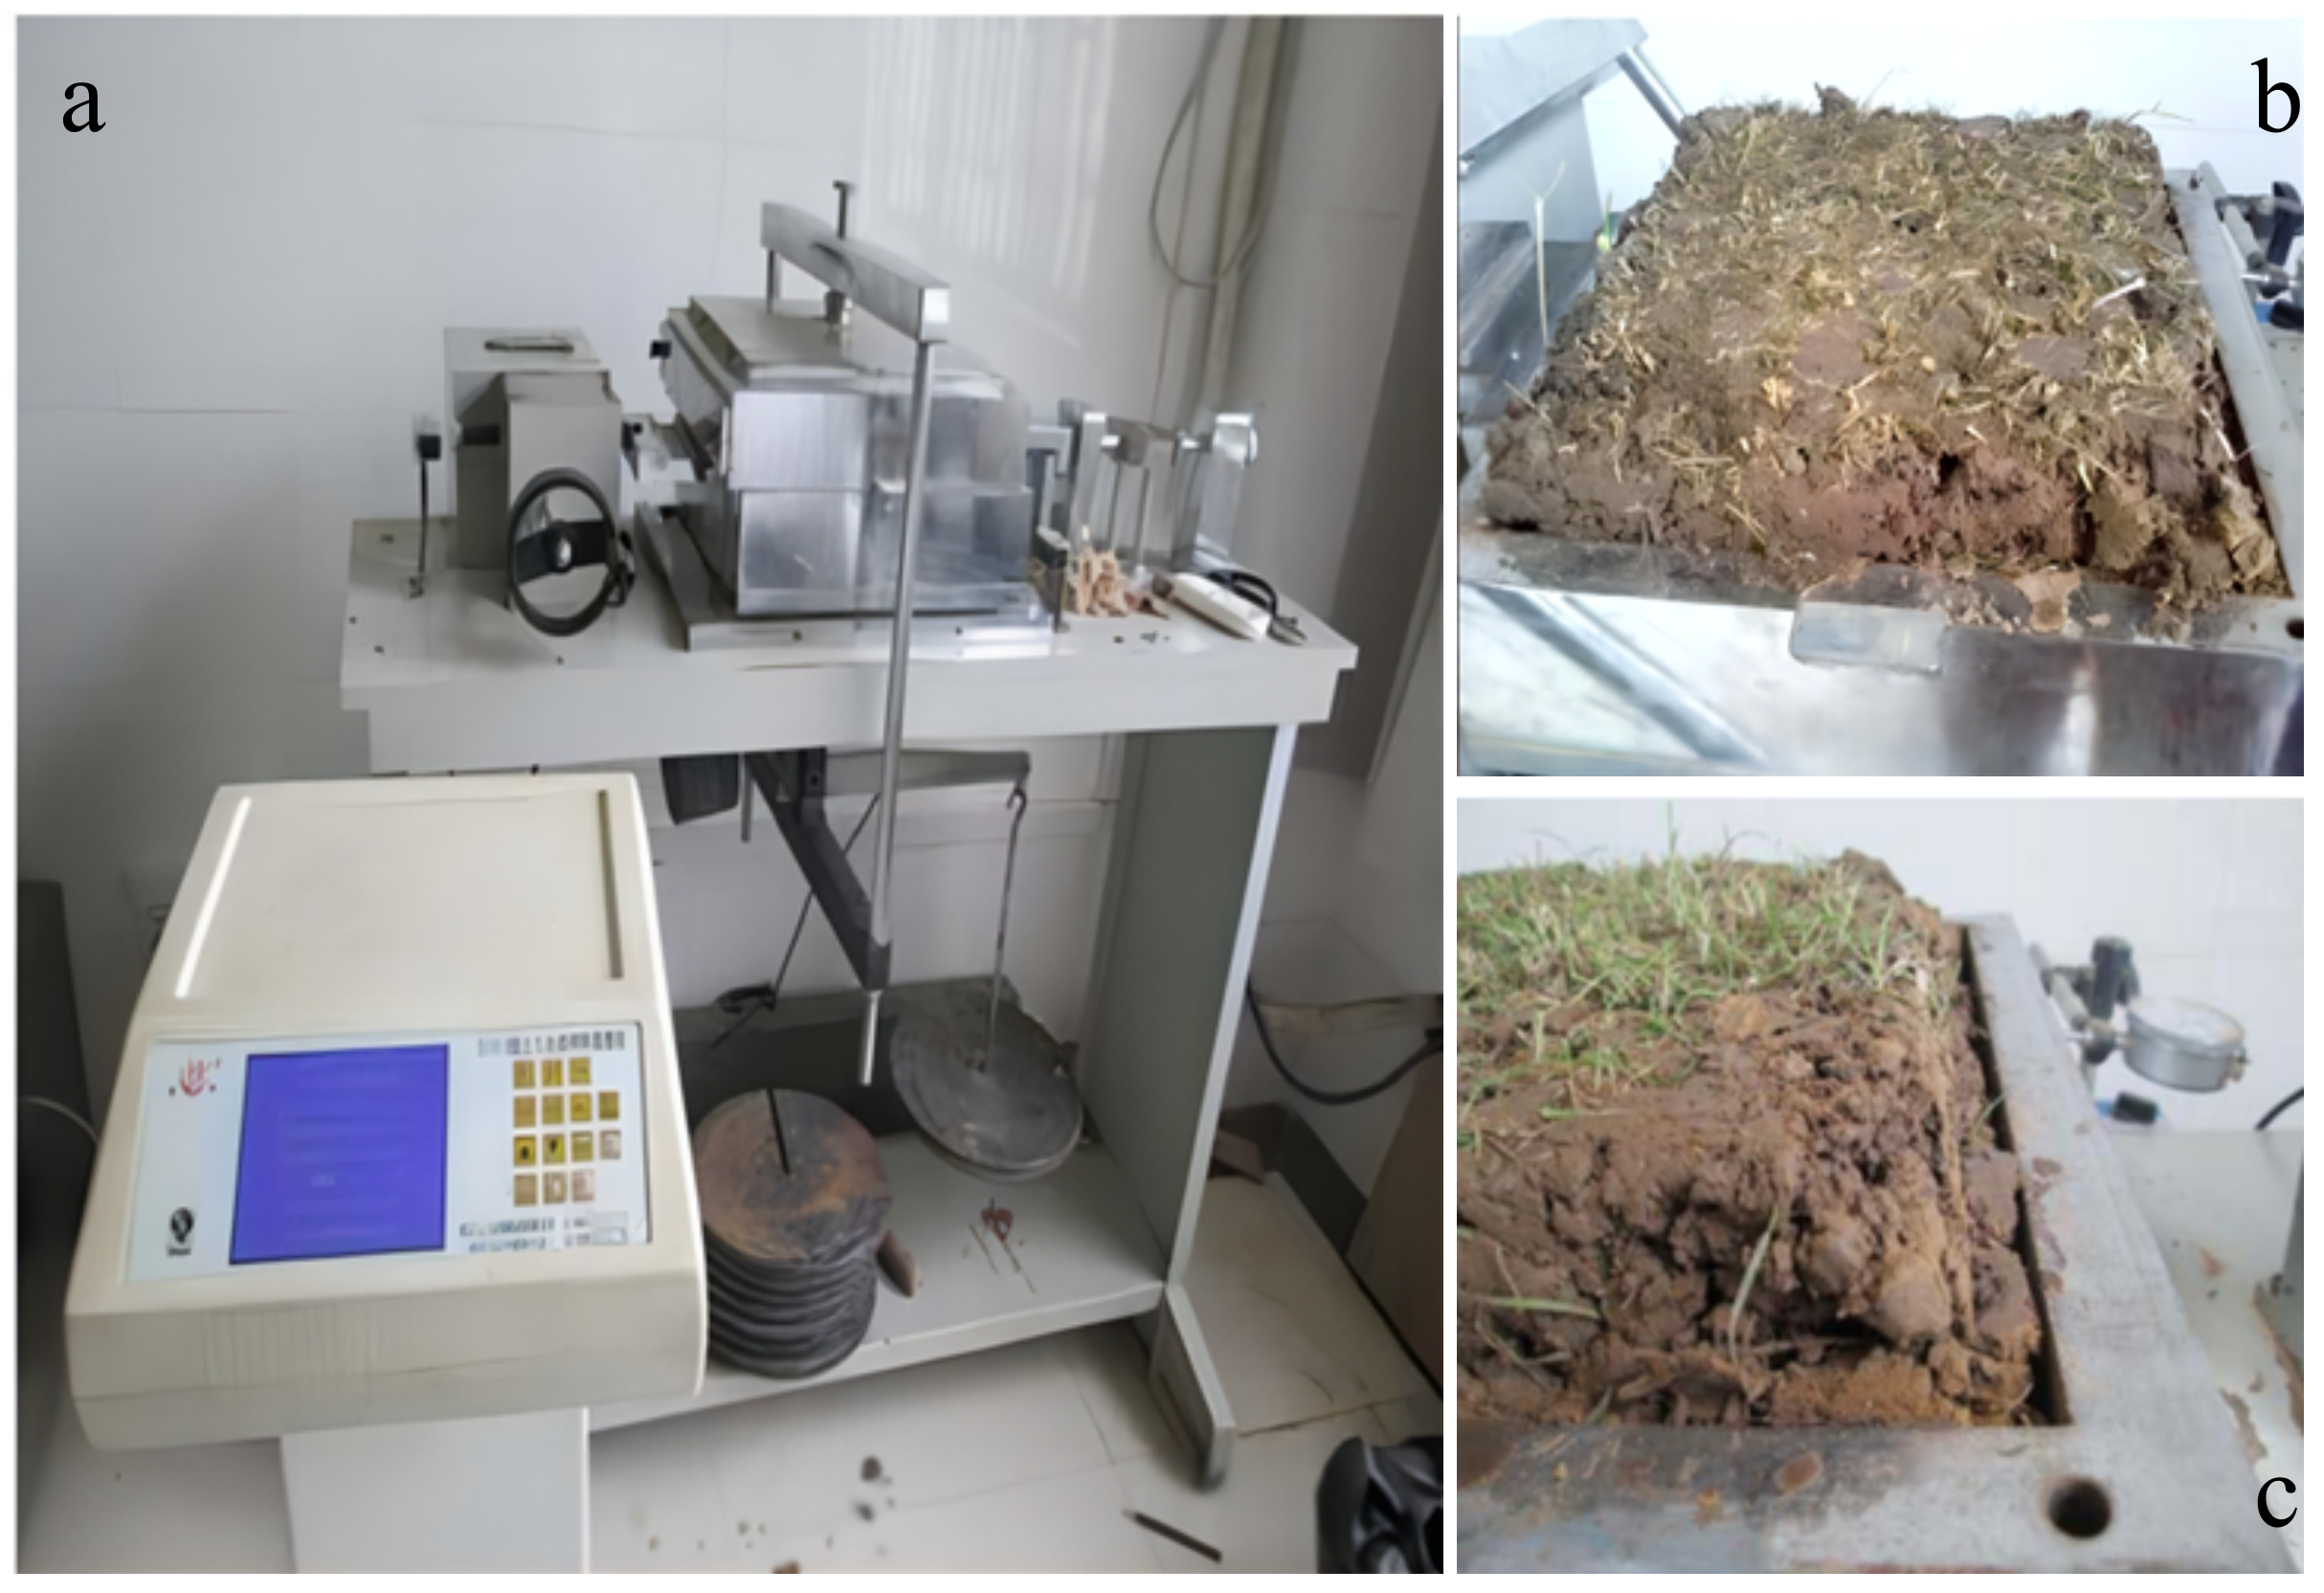
2.2. Direct Shear Tests
3. Test Results
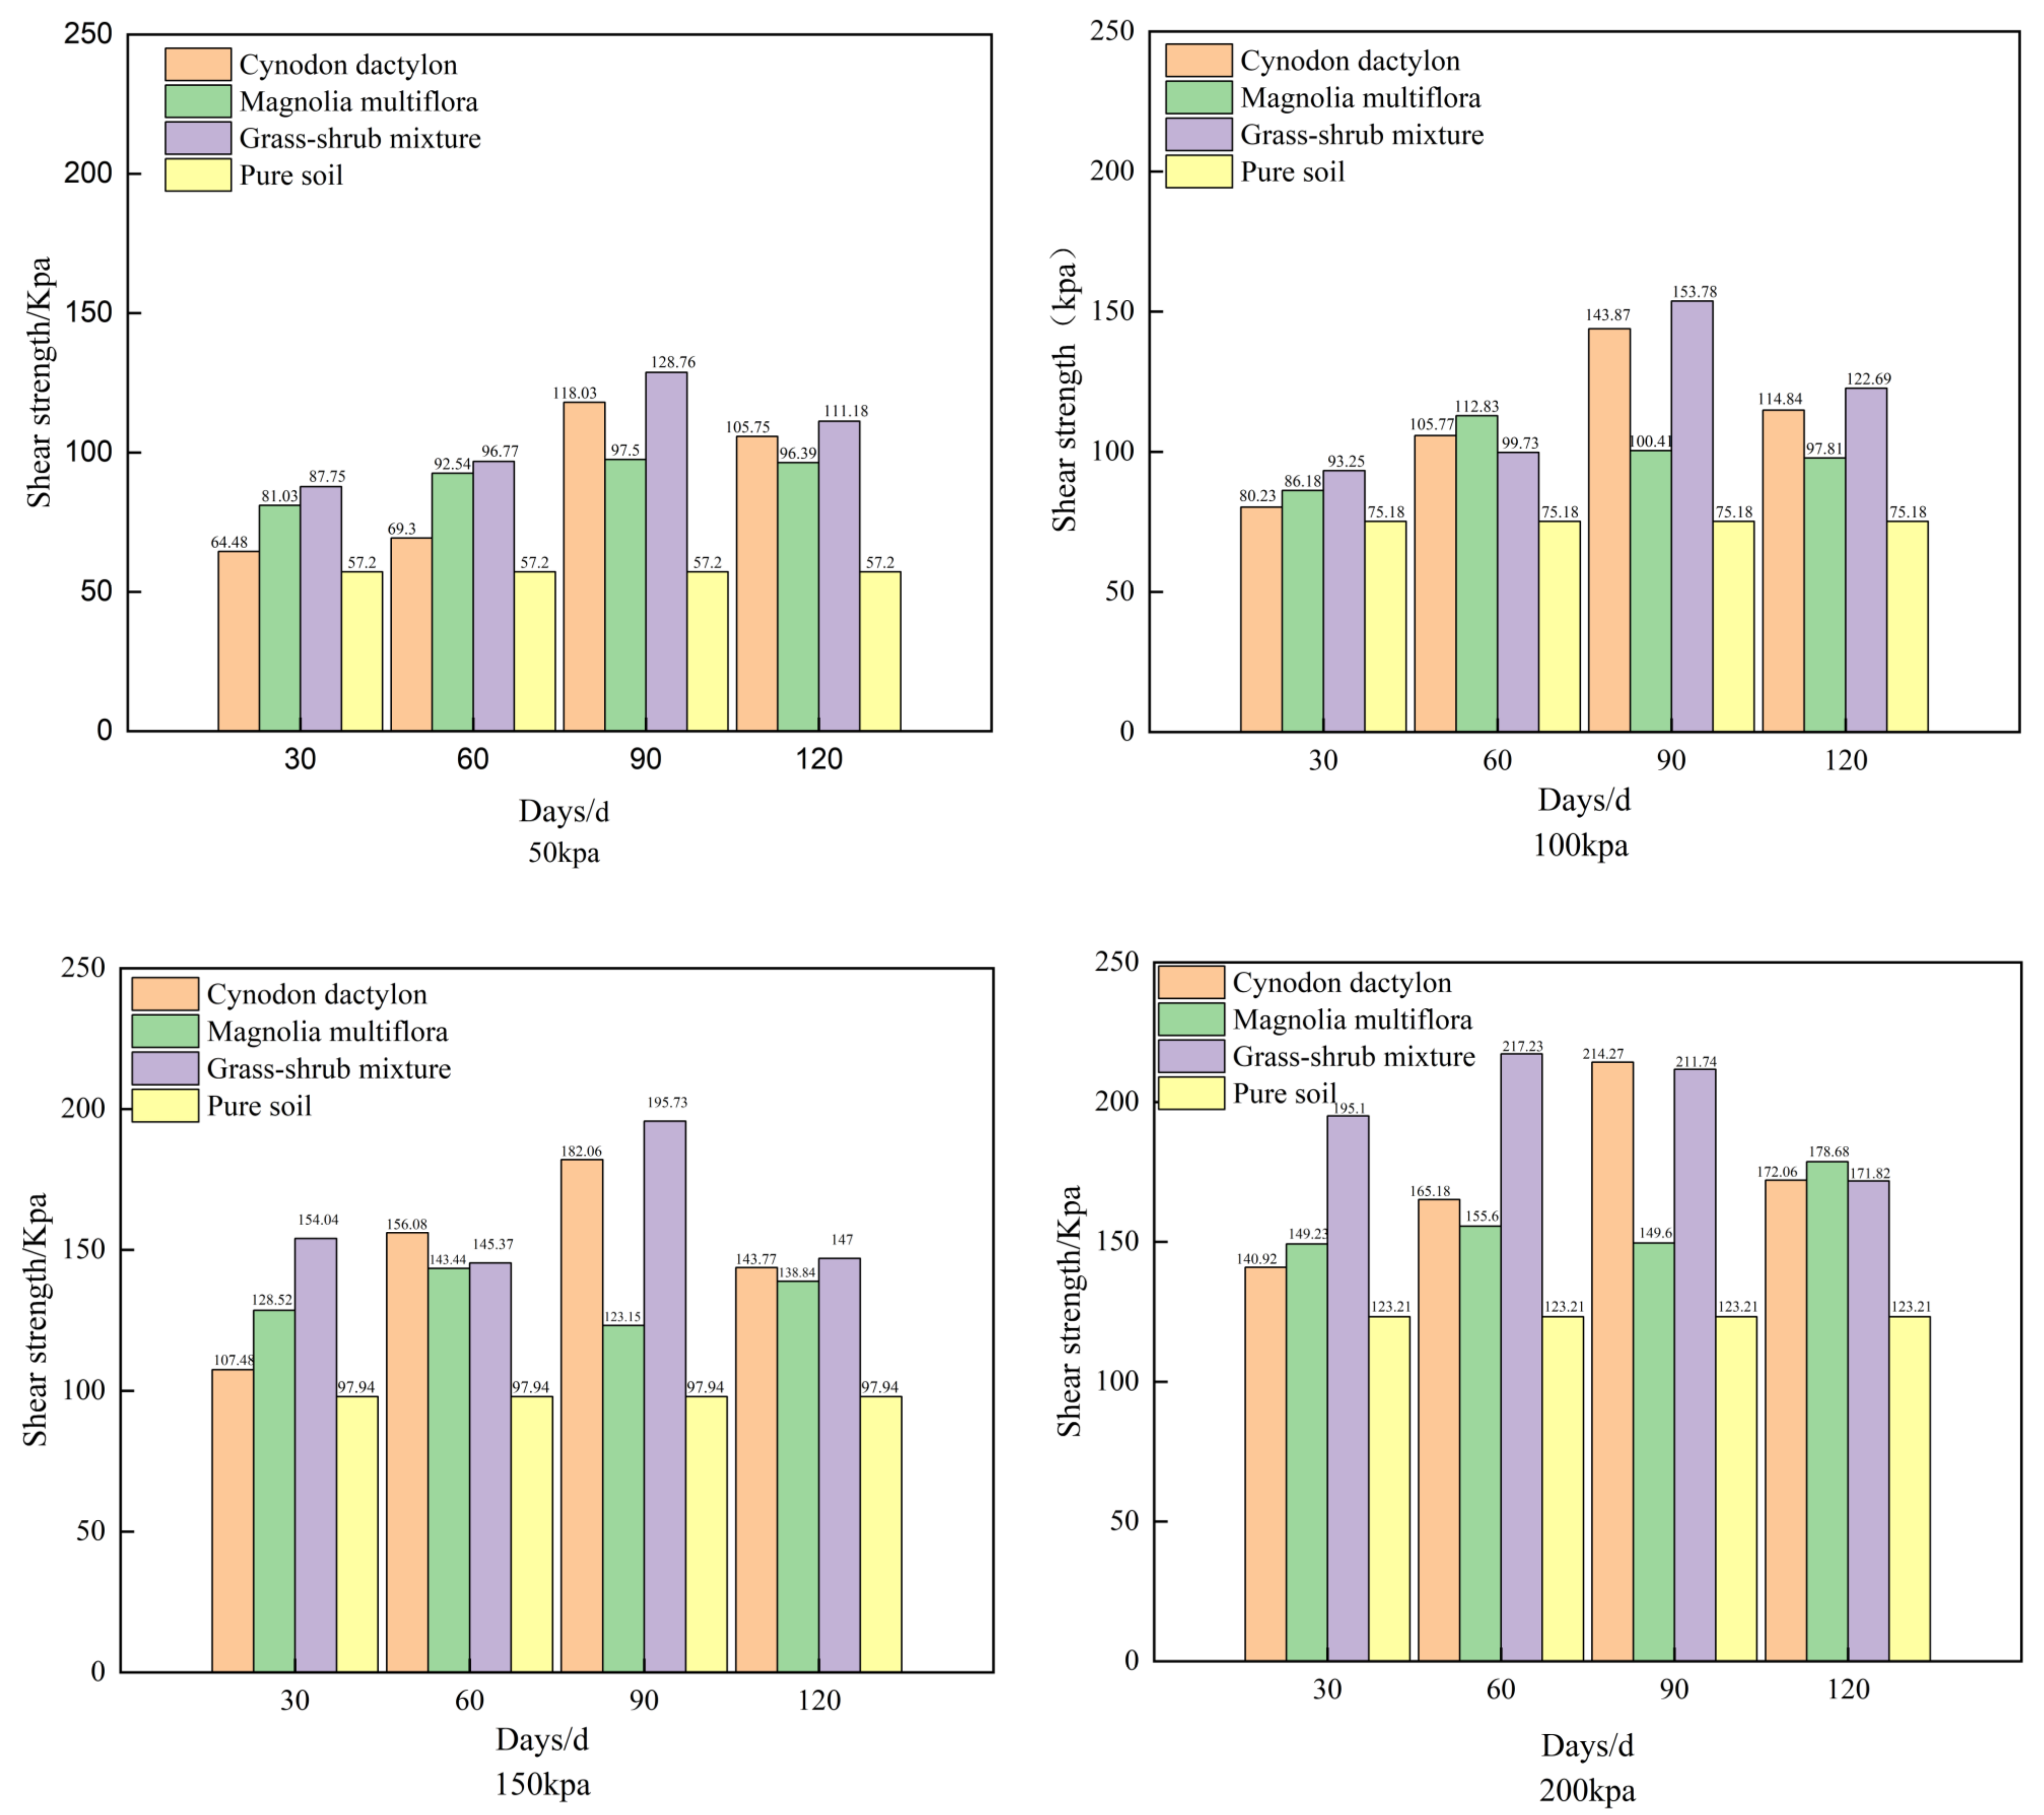
3.1. Shear Strength of the Root–Soil Composites during Different Growth Periods
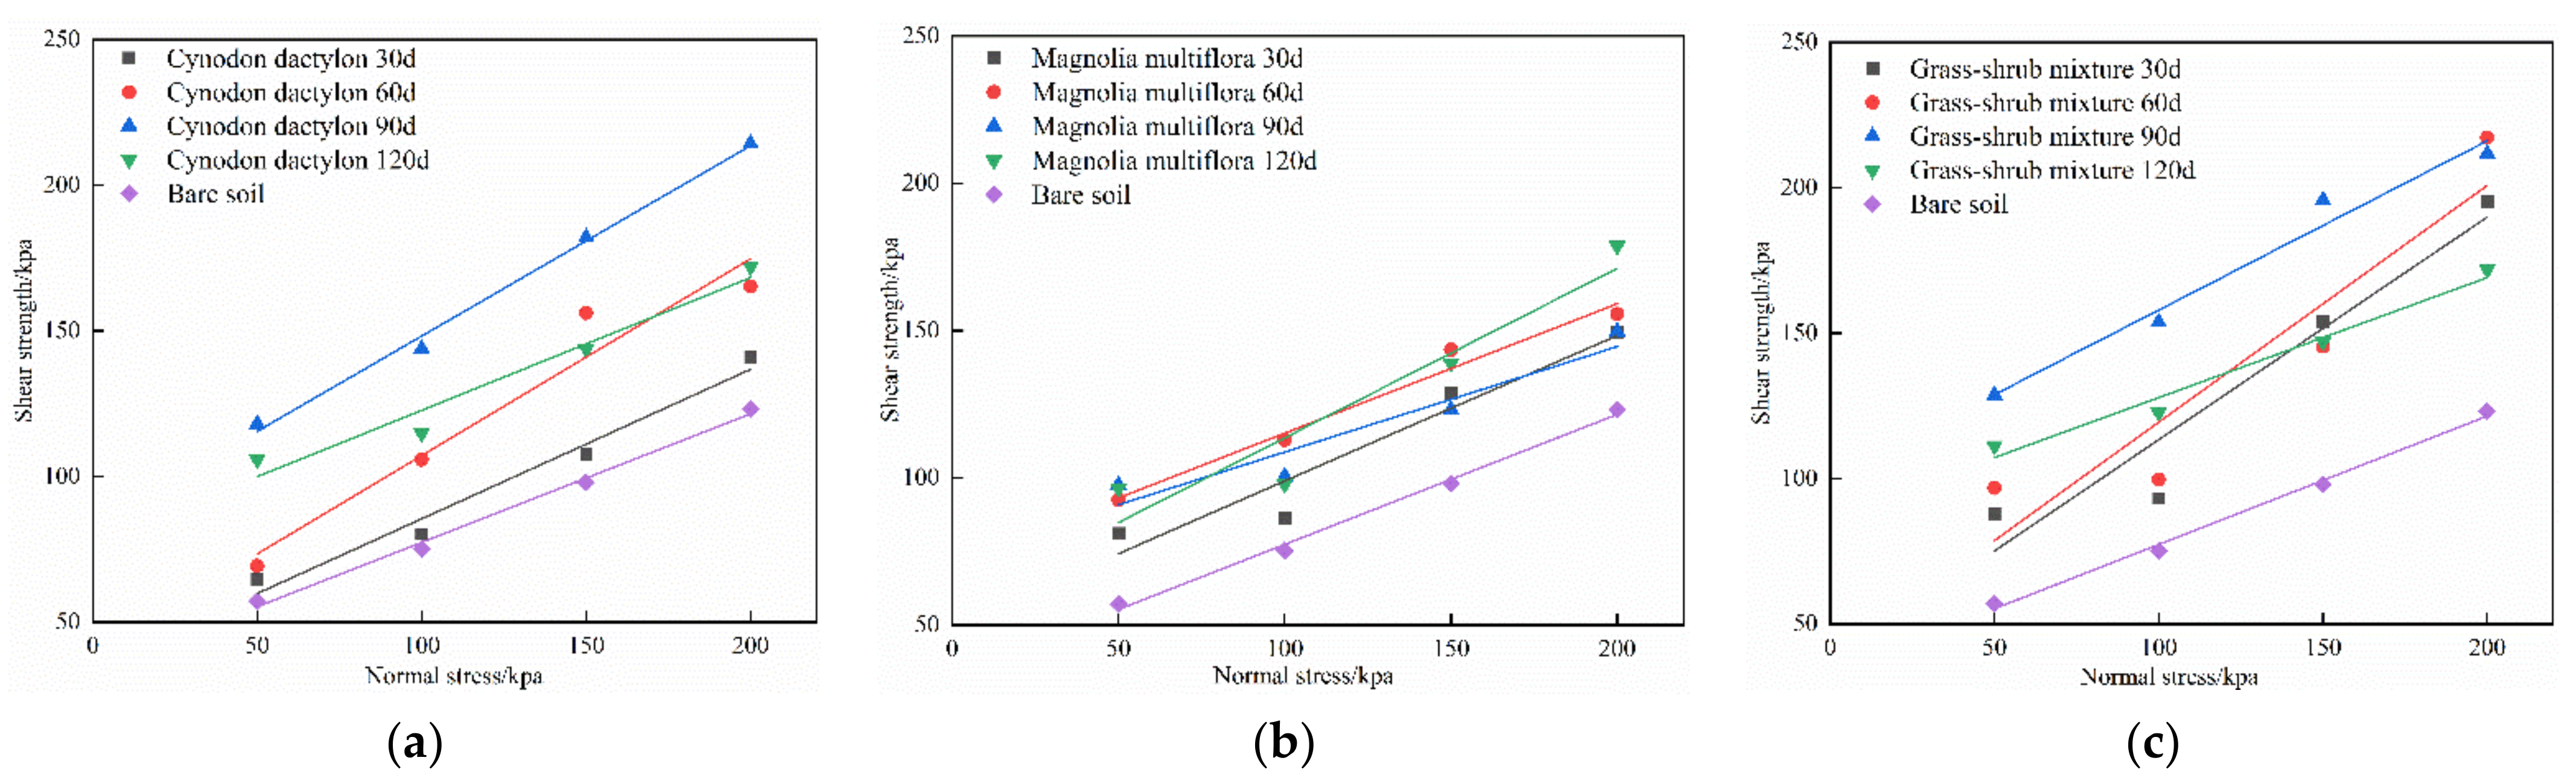
3.2. Root–Soil Composite Shear Strength Characteristics
4. Numerical Simulation of Slope Stability under Different Vegetation
4.1. Strength Reduction Method (SRM)
4.2. Numerical Model Establishment
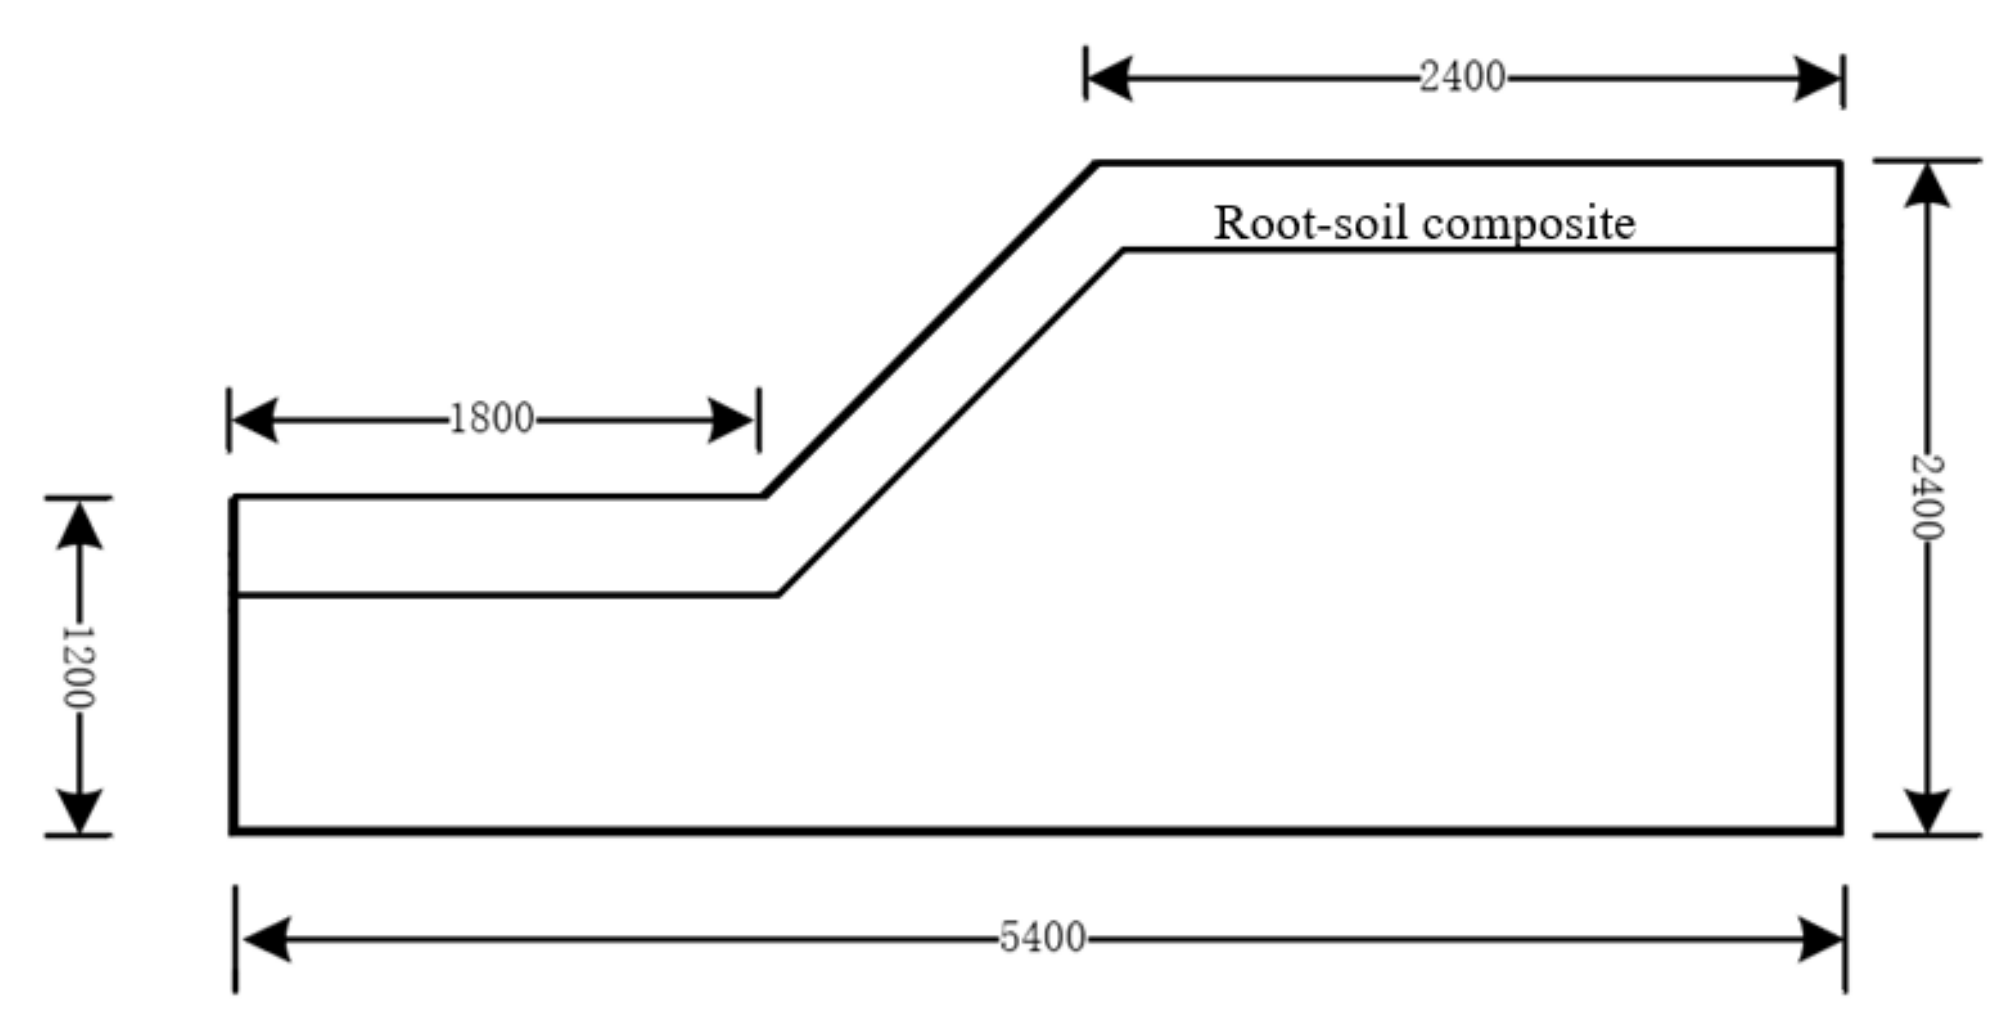
4.2.1. Slope Geometry Model and Boundaries
4.2.2. Numerical Model Working Conditions
4.3. Vegetated Slope Stability Analysis
4.3.1. FS
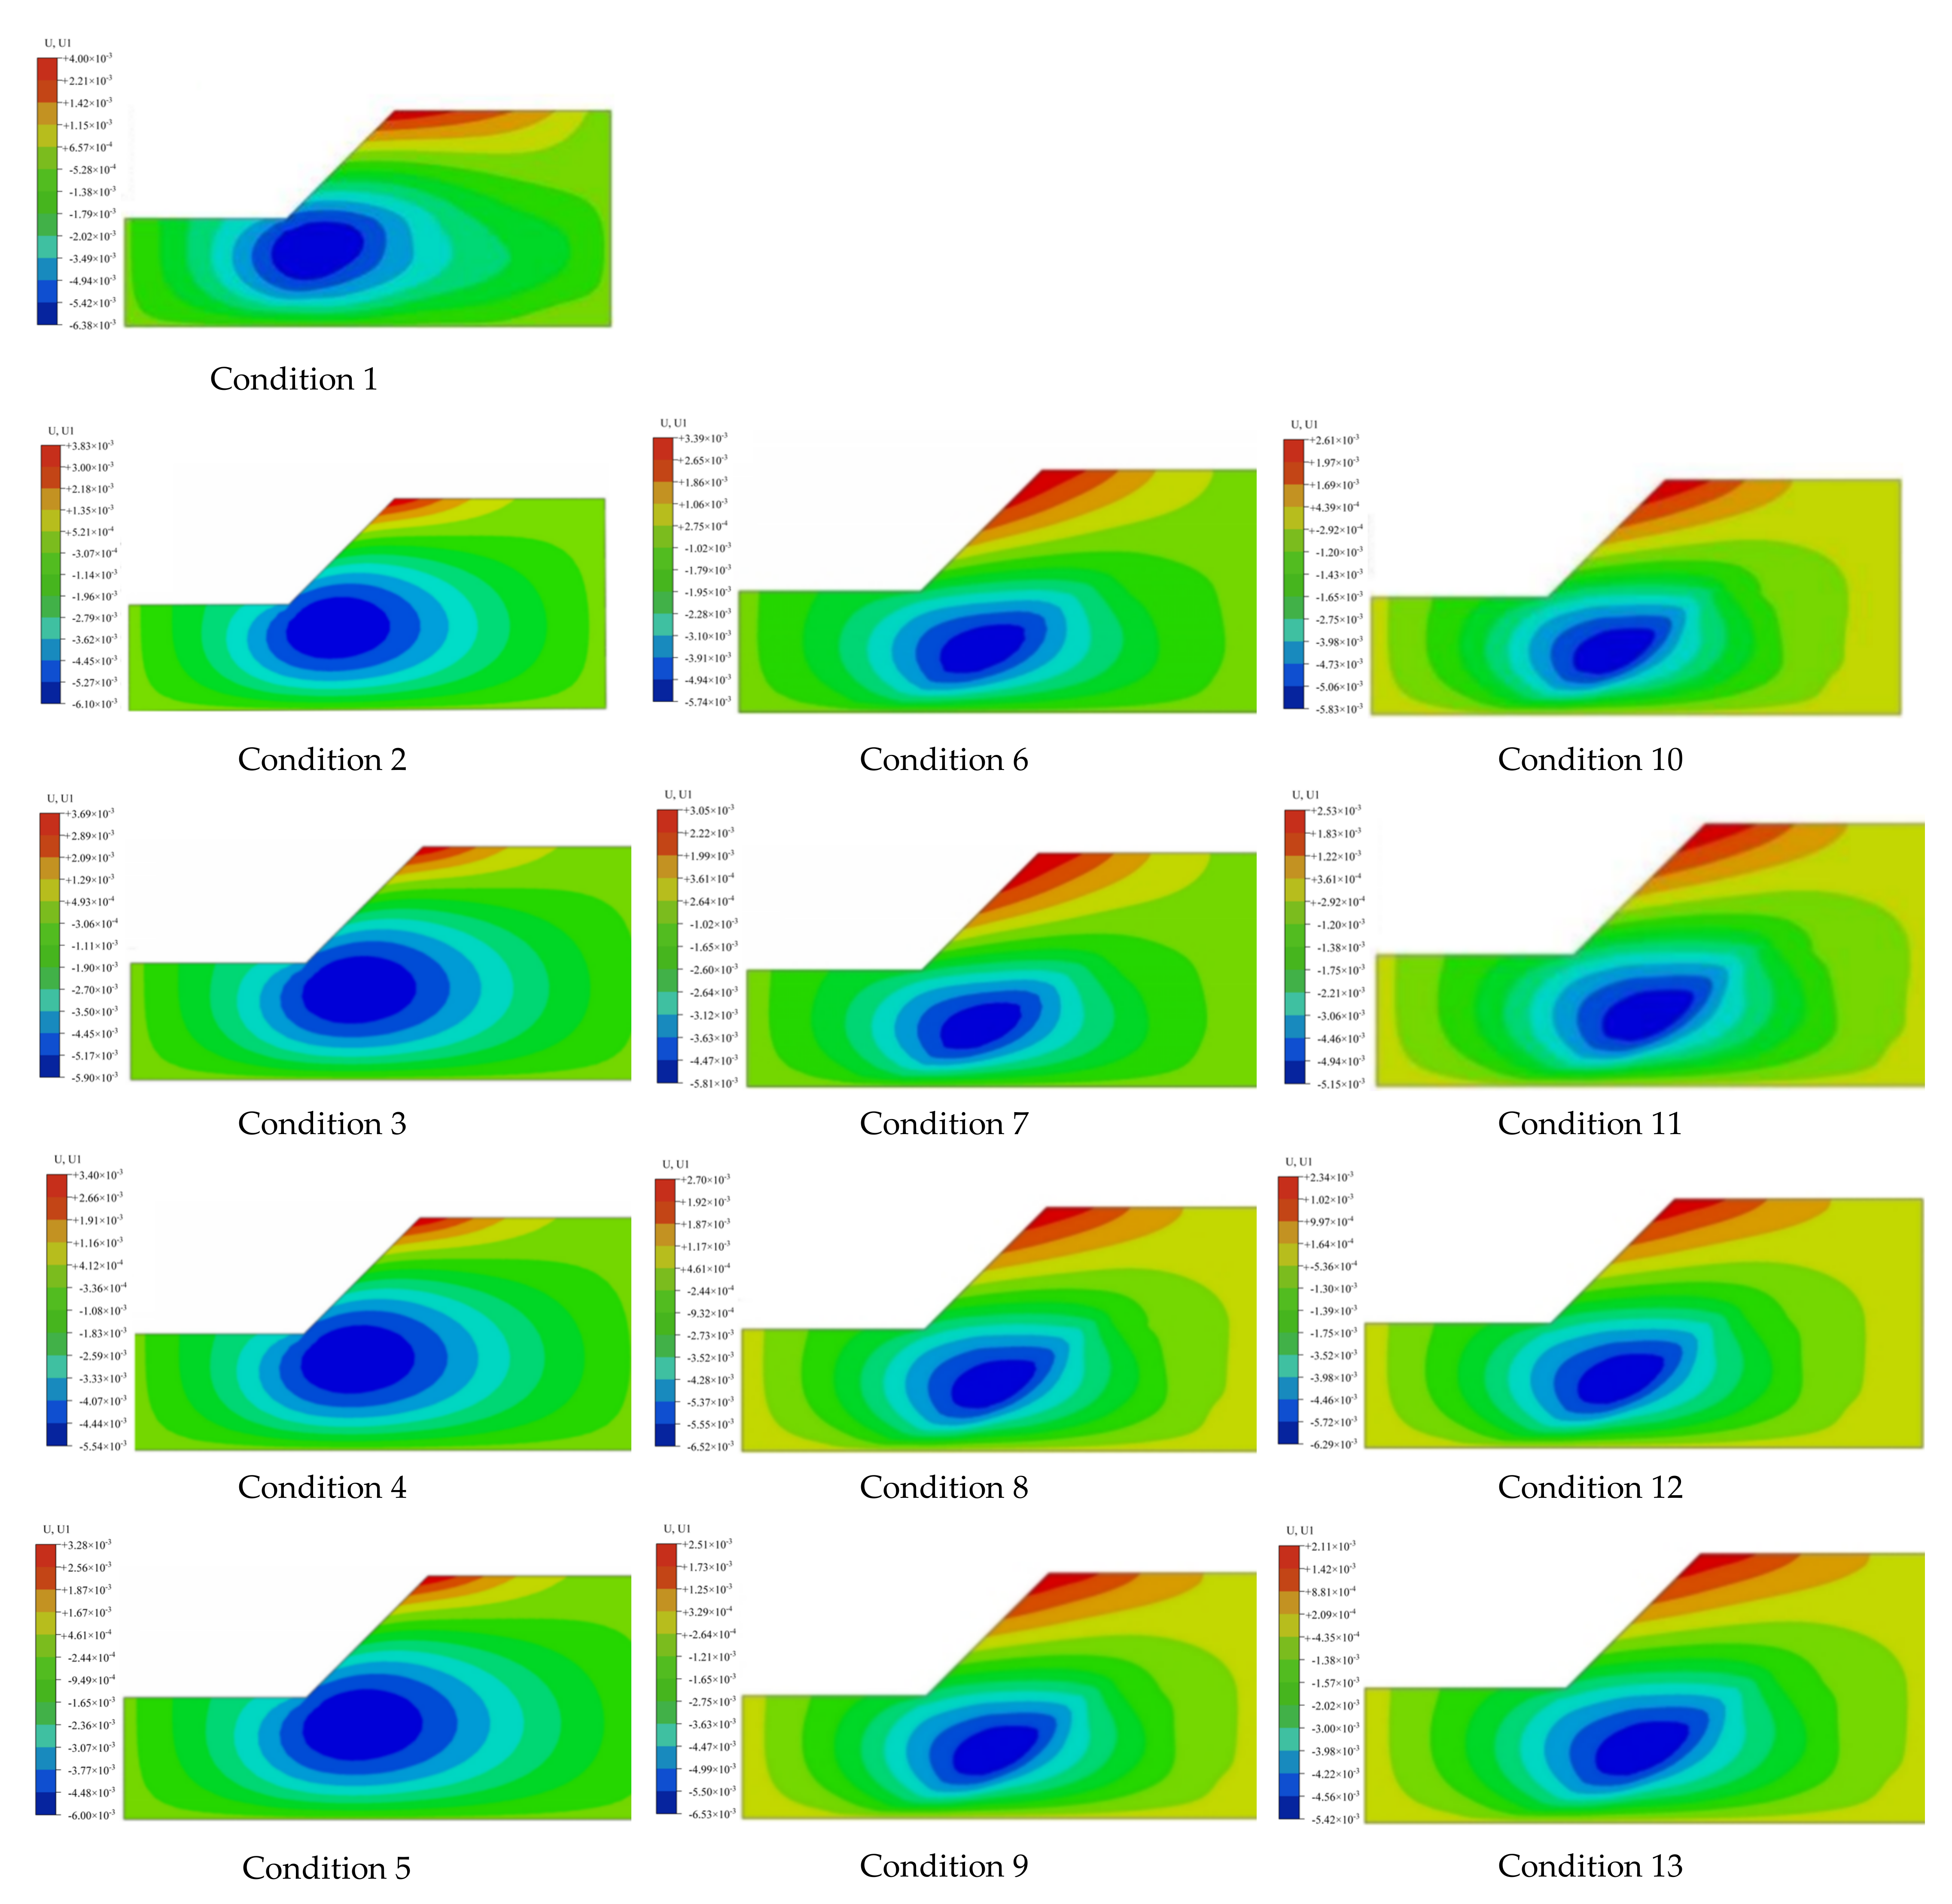
4.3.2. Displacement
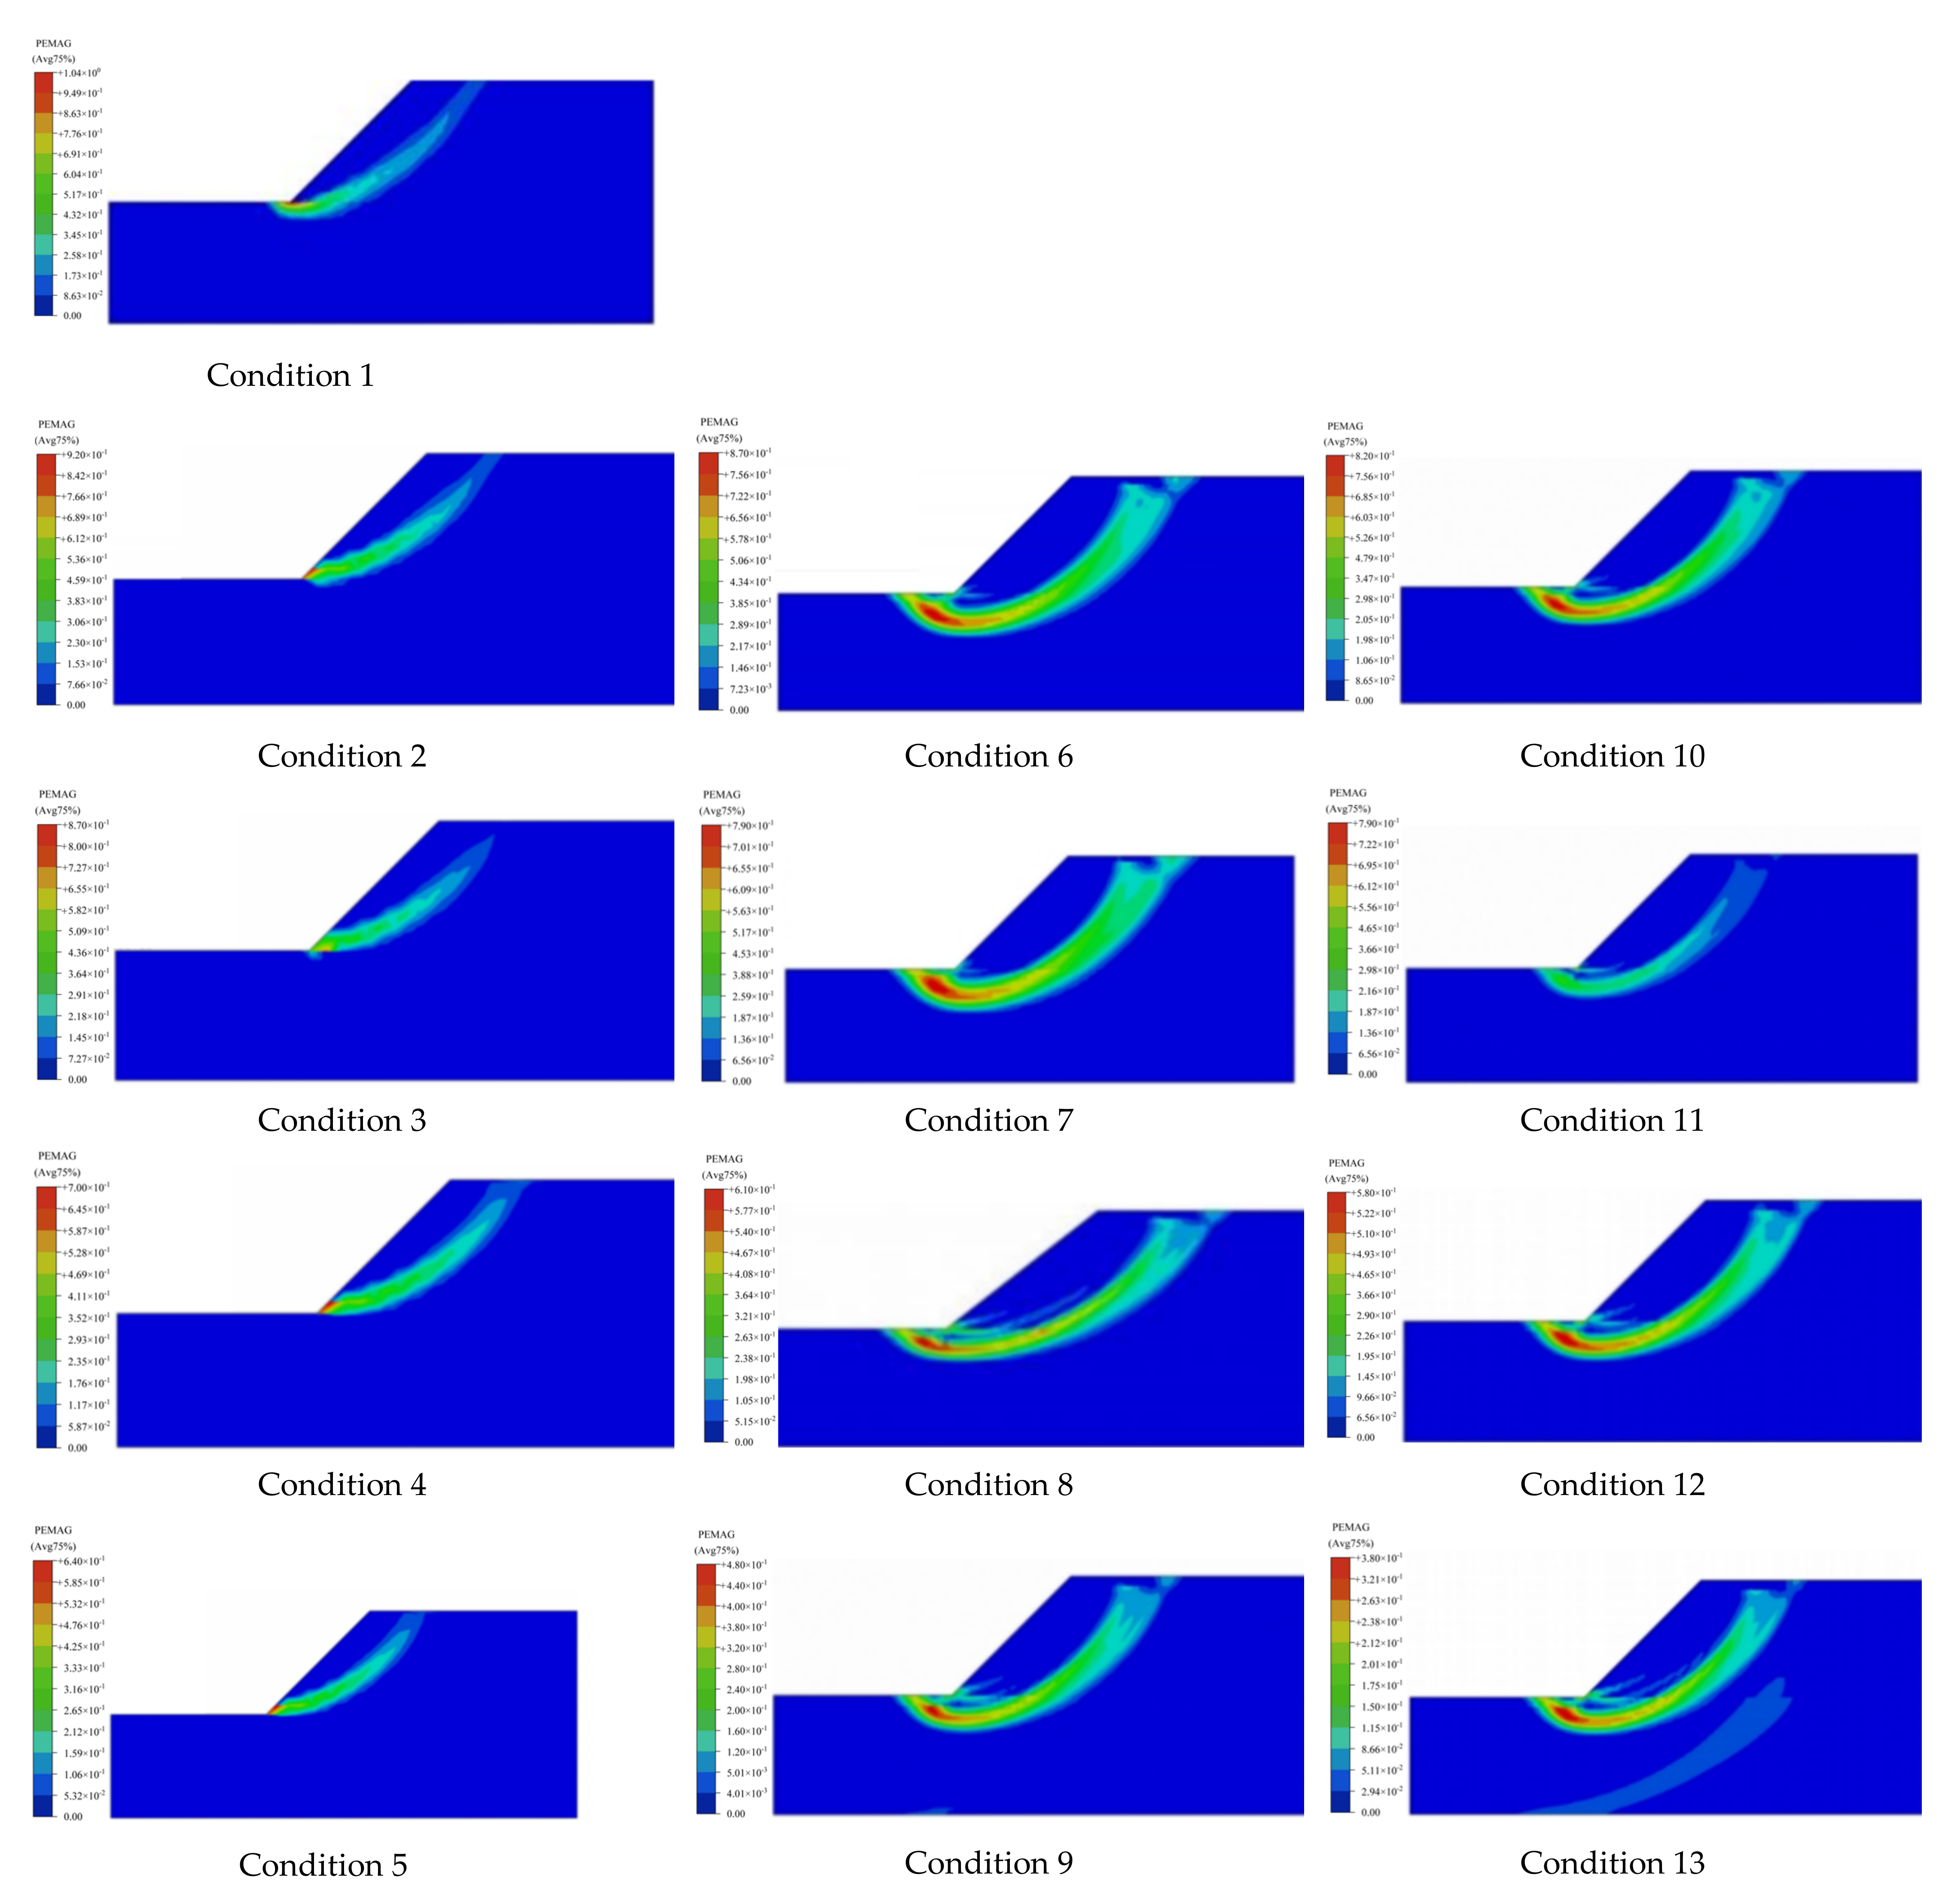
4.3.3. Plastic Strain
5. Conclusions
Author Contributions
Funding
Institutional Review Board Statement
Informed Consent Statement
Data Availability Statement
Conflicts of Interest
References
- Lian, B.; Peng, J.; Zhan, H.; Wang, X. Mechanical response of root-reinforced loess with various water contents. Soil Tillage Res. 2019, 193, 85–94. [Google Scholar] [CrossRef]
- Hess, D.M.; Leshchinsky, B.A.; Bunn, M.; Mason, H.B.; Olsen, M.J. A simplified three-dimensional shallow landslide susceptibility framework considering topography and seismicity. Landslides 2017, 14, 1677–1697. [Google Scholar] [CrossRef]
- Oorthuis, R.; Vaunat, J.; Hürlimann, M.; Lloret, A.; Moya, J.; Puig-Polo, C.; Fraccica, A. Slope orientation and vegetation effects on soil thermo-hydraulic behavior. An experimental study. Sustainability 2021, 13, 14. [Google Scholar] [CrossRef]
- Ji, J.; Kokutse, N.; Genet, M.; Fourcaud, T.; Zhang, Z. Effect of Spatial Variation of Tree Root Characteristics on Slope Stability. A Case Study on Black Locust (Robinia Pseudoacacia) and Arborvitae (Platycladus Orientalis) Stands on the Loess Plateau, China. Catena 2021, 92, 139–154. [Google Scholar] [CrossRef]
- Xu, Y.; Su, C.; Huang, Z.; Yang, C.; Yang, Y. Research on the Protection of Expansive Soil Slopes under Heavy Rainfall by Anchor-Reinforced Vegetation Systems. Geotext. Geomembr. 2022, 50, 1147–1158. [Google Scholar] [CrossRef]
- Ajedegba, J.O.; Choi, J.W.; Jones, K.D. Analytical modeling of coastal dune erosion at South Padre Island: A consideration of the effects of vegetation roots and shear strength. Ecol Eng. 2019, 127, 187–194. [Google Scholar] [CrossRef]
- Giadrossich, F.; Schwarz, M.; Cohen, D.; Preti, F.; Or, D. Mechanical Interactions between Neighbouring Roots during Pullout Tests. Plant Soil 2013, 367, 391–406. [Google Scholar] [CrossRef]
- Zhu, H.; Zhang, L.M.; Xiao, T.; Li, X.Y. Enhancement of Slope Stability by Vegetation Considering Uncertainties in Root Distribution. Comput. Geotech. 2017, 85, 84–89. [Google Scholar] [CrossRef]
- Chok, Y.H.; Jaksa, M.B.; Kaggwa, W.S.; Griffiths, D.V. Assessing the Influence of Root Reinforcement on Slope Stability by Finite Elements. Int. J. Geo-Eng. 2015, 6, 12. [Google Scholar] [CrossRef]
- Hongde, W.; Dongli, S.; Xiaoqin, S.; Shengqiang, T.; Yipeng, Z. Analysis of unsaturated shear strength and slope stability considering soil desalinization in a reclamation area in China. Catena 2021, 196, 104949. [Google Scholar] [CrossRef]
- Fan, C.C.; Tsai, M.H. Spatial distribution of plant root forces in root-permeated soils subject to shear. Soil Tillage Res. 2016, 156, 1–15. [Google Scholar] [CrossRef]
- Xing, S.; Zhang, G.; Zhu, P.; Wang, L.; Wang, Z.; Wang, C. Variation in shear strength of soil-root system under five typical land use types on the Loess Plateau of China. Catena 2023, 222, 106883. [Google Scholar] [CrossRef]
- Xiong, D.; Chen, F.; Lv, K.; Tan, X.; Huang, Y. The performance and temporal dynamics of vegetation concretes comprising three herbaceous species in soil stabilization and slope protection. Ecol. Eng. 2023, 188, 106873. [Google Scholar] [CrossRef]
- Taib, A.M.; Taha, M.R.; Abd Rahman, N.; Yazid, M.R.M.; Khoiry, M.A. The Effect of Soil-Root Interaction by Vetiver Grass on Slope Stability. J. Eng. Sci. Technol. 2020, 15, 46–57. [Google Scholar]
- Guo, P.; Xia, Z.; Liu, Q.; Xiao, H.; Gao, F.; Zhang, L.; Li, M.; Yang, Y.; Xu, W. The mechanism of the plant roots’ soil-reinforcement based on generalized equivalent confining pressure. PeerJ 2020, 8, e10064. [Google Scholar] [CrossRef]
- Emadi-Tafti, M.; Ataie-Ashtiani, B.; Hosseini, S.M. Integrated impacts of vegetation and soil type on slope stability: A case study of Kheyrud Forest. Iran. Ecol. Modell. 2021, 446, 109498. [Google Scholar] [CrossRef]
- Fattet, M.; Fu, Y.; Ghestem, M.; Ma, W.; Foulonneau, M.; Nespoulous, J.; Le Bissonnais, Y.; Stokes, A. Effects of vegetation type on soil resistance to erosion: Relationship between aggregate stability and shear strength. Catena 2011, 87, 60–69. [Google Scholar] [CrossRef]
- Xia, S.; Brierley, G.; Zhu, H.L.; Li, G.R.; Fu, J.T.; Mao, X.Q.; Yu, Q.Q.; Qiao, N. An Exploratory Analysis of Vegetation Strategies to Reduce Shallow Landslide Activity on Loess Hillslopes, Northeast Qinghai-Tibet Plateau, China. J. Mt. Sci. 2013, 10, 668–686. [Google Scholar] [CrossRef]
- Loades, K.W.; Bengough, A.G.; Bransby, M.F.; Hallett, P.D. Planting Density Influence on Fibrous Root Reinforcement of Soils. Ecol. Eng. 2010, 36, 276–284. [Google Scholar] [CrossRef]
- Huang, M.; Sun, S.; Feng, K.; Lin, M.; Shuai, F.; Zhang, Y.; Lin, J.; Ge, H.; Jiang, F.; Huang, Y. Effects of Neyraudia reynaudiana roots on the soil shear strength of collapsing wall in Benggang, southeast China. Catena 2022, 210, 105883. [Google Scholar] [CrossRef]
- Lin, H.D.; Wang, W.C.; Li, A.J. Investigation of dilatancy angle effects on slope stability using the 3D finite element method strength reduction technique. Comput. Geotech. 2020, 118, 103295. [Google Scholar] [CrossRef]
- Sun, G.; Lin, S.; Zheng, H.; Tan, Y.; Sui, T. The virtual element method strength reduction technique for the stability analysis of stony soil slopes. Comput Geotech. 2020, 119, 103349. [Google Scholar] [CrossRef]
- Zou, J.; Yang, F.; Yuan, W.; Liu, Y.; Liu, A.; Zhang, W. A kinetic energy-based failure criterion for defining slope stability by PFEM strength reduction. Eng. Fail. Anal. 2023, 145, 107040. [Google Scholar] [CrossRef]


| Maximum Dry Density | Relative Density | Optimum Moisture Content (%) | Plastic Limit (%) | Liquid Limit (%) | Plastic Index |
|---|---|---|---|---|---|
| 1.6. | 2.82 | 16.4 | 22.5 | 46.3 | 23.8 |
| Species | Regression Equations | R2 | c/kPa | φ/° |
|---|---|---|---|---|
| Bare soil | y = 0.44158x + 33.18 | 0.99 | 33.2 | 23.8 |
| C.d 30 d | y = 0.51340x + 34.13 | 0.96 | 34.1 | 27.2 |
| C.d 60 d | y = 0.67590x + 39.59 | 0.92 | 39.6 | 34.1 |
| C.d 90 d | y = 0.65382x + 82.83 | 0.99 | 82.8 | 33.2 |
| C.d 120 d | y = 0.45572x + 77.14 | 0.94 | 77.1 | 24.5 |
| M.m 30 d | y = 0.49388x + 49.50 | 0.89 | 49.5 | 26.3 |
| M.m 60 d | y = 0.43958x + 71.55 | 0.96 | 71.2 | 23.7 |
| M.m 90 d | y = 0.35808x + 72.90 | 0.87 | 72.9 | 19.7 |
| M.m 120d | y = 0.57580x + 55.95 | 0.85 | 56.0 | 29.9 |
| G.s 30 d | y = 0.76568x + 36.82 | 0.89 | 36.8 | 37.4 |
| G.s 60 d | y = 0.81404x + 38.02 | 0.81 | 38.0 | 39.1 |
| G.s 90 d | y = 0.58178x + 99.78 | 0.96 | 99.8 | 30.2 |
| G.s 120 d | y = 0.41246x + 86.61 | 0.96 | 86.6 | 22.4 |
| Simulated Condition | Plant Type | Root–Soil Composite |
|---|---|---|
| Condition 1 | Without vegetation | Bare |
| Condition 2 | C.d | 30 d |
| Condition 3 | 60 d | |
| Condition 4 | 90 d | |
| Condition 5 | 120 d | |
| Condition 6 | M.m | 30 d |
| Condition 7 | 60 d | |
| Condition 8 | 90 d | |
| Condition 9 | 120 d | |
| Condition 10 | G.s | 30 d |
| Condition 11 | 60 d | |
| Condition 12 | 90 d | |
| Condition 13 | 120 d |
| Indices | C1 | C2 | C3 | C4 | C5 | C6 | C7 | C8 | C9 | C10 | C11 | C12 | C13 |
|---|---|---|---|---|---|---|---|---|---|---|---|---|---|
| FS | 1.48 | 1.51 | 1.57 | 1.58 | 1.60 | 1.53 | 1.60 | 1.64 | 1.66 | 1.55 | 1.62 | 1.67 | 1.72 |
| Increase/% | 0 | 1.7 | 5.7 | 6.5 | 8.0 | 3.3 | 8.1 | 10.4 | 11.9 | 4.5 | 9.3 | 12.4 | 15.7 |
| Conditions | C1 | C2 | C3 | C4 | C5 | C6 | C7 | C8 | C9 | C10 | C11 | C12 | C13 |
|---|---|---|---|---|---|---|---|---|---|---|---|---|---|
| Maximum horizontal displacement/10−3 | 4.00 | 3.83 | 3.69 | 3.40 | 3.28 | 3.39 | 3.05 | 2.70 | 2.51 | 2.61 | 2.53 | 2.34 | 2.11 |
| Maximum horizontal displacement reduction/% | 4.3 | 7.8 | 15.0 | 18.0 | 15.3 | 23.8 | 32.5 | 37.3 | 34.8 | 36.8 | 41.5 | 47.3 | |
| Maximum vertical displacement/10−2 | 5.57 | 5.39 | 5.28 | 5.05 | 4.87 | 5.29 | 5.14 | 4.82 | 4.77 | 5.09 | 4.88 | 4.71 | 4.66 |
| Maximum vertical displacement reduction/% | 3.2 | 5.2 | 9.3 | 12.6 | 5.0 | 7.7 | 13.5 | 14.3 | 8.6 | 12.4 | 15.4 | 16.3 |
| Indices | C1 | C2 | C3 | C4 | C5 | C6 | C7 | C8 | C9 | C10 | C11 | C12 | C13 |
|---|---|---|---|---|---|---|---|---|---|---|---|---|---|
| Maximum equivalent plastic strain | 1.04 | 0.92 | 0.87 | 0.70 | 0.64 | 0.87 | 0.79 | 0.61 | 0.48 | 0.82 | 0.79 | 0.58 | 0.38 |
| Reduction by proportion/% | - | 11.5 | 16.3 | 32.7 | 38.5 | 16.3 | 24.0 | 41.3 | 53.8 | 21.2 | 24.0 | 44.2 | 63.5 |
Disclaimer/Publisher’s Note: The statements, opinions and data contained in all publications are solely those of the individual author(s) and contributor(s) and not of MDPI and/or the editor(s). MDPI and/or the editor(s) disclaim responsibility for any injury to people or property resulting from any ideas, methods, instructions or products referred to in the content. |
© 2023 by the authors. Licensee MDPI, Basel, Switzerland. This article is an open access article distributed under the terms and conditions of the Creative Commons Attribution (CC BY) license (https://creativecommons.org/licenses/by/4.0/).
Share and Cite
Zhou, X.; Fu, D.; Wan, J.; Xiao, H.; He, X.; Li, Z.; Deng, Q. The Shear Strength of Root–Soil Composites in Different Growth Periods and Their Effects on Slope Stability. Appl. Sci. 2023, 13, 11116. https://doi.org/10.3390/app131911116
Zhou X, Fu D, Wan J, Xiao H, He X, Li Z, Deng Q. The Shear Strength of Root–Soil Composites in Different Growth Periods and Their Effects on Slope Stability. Applied Sciences. 2023; 13(19):11116. https://doi.org/10.3390/app131911116
Chicago/Turabian StyleZhou, Xinlong, Dashun Fu, Juan Wan, Henglin Xiao, Xinyue He, Zhengxuan Li, and Qixiang Deng. 2023. "The Shear Strength of Root–Soil Composites in Different Growth Periods and Their Effects on Slope Stability" Applied Sciences 13, no. 19: 11116. https://doi.org/10.3390/app131911116
APA StyleZhou, X., Fu, D., Wan, J., Xiao, H., He, X., Li, Z., & Deng, Q. (2023). The Shear Strength of Root–Soil Composites in Different Growth Periods and Their Effects on Slope Stability. Applied Sciences, 13(19), 11116. https://doi.org/10.3390/app131911116