Article

Classifying Poor Postures of the Neck and Spine in Computer Work by Using Image and Skeleton Analysis

1
Department of Artificial Intelligence Convergence, Pukyong National University, 45, Yongso-ro, Nam-gu, Busan 48513, Republic of Korea
2
College of Business, Seoul National University, 1, Gwanak-ro, Gwanak-gu, Seoul 08826, Republic of Korea
*
Author to whom correspondence should be addressed.
Appl. Sci. 2023, 13(19), 10935; https://doi.org/10.3390/app131910935
Submission received: 1 June 2023 / Revised: 3 July 2023 / Accepted: 18 July 2023 / Published: 3 October 2023
(This article belongs to the Special Issue Innovative Methods in Biomechanics and Human Movement Analysis)

Abstract

:
When using a desktop computer, people tend to adopt postures that are detrimental to their bodies, such as text neck and the L-posture of leaning forward with their buttocks out and their shoulders against the backrest of the chair. These two postures cause chronic problems by bending the cervical and thoracic spines and can have detrimental effects on the body. While there have been many studies on text neck posture, there were limited studies on classifying these two postures together, and there are limitations to the accuracy of their classification. To address these limitations, we propose an algorithm for classifying good posture, text neck posture, and L-posture, the latter two of which may negatively affect the body when using a desktop computer. The proposed algorithm utilizes a skeleton algorithm to calculate angles from images of the user’s lateral posture, and then classifies the three postures based on the angle values. If there is sufficient space next to the computer, the method can be implemented anywhere, and classification can be performed at low cost. The experimental results showed a high accuracy rate of 97.06% and an F1-score of 95.23%; the L posture was classified with 100% accuracy.

1. Introduction

With the acceleration of digitalization, students and most office workers involved in desk work spend a significant amount of their day on completing computer work. When using a computer, it is important to maintain a good posture while performing tasks. Good posture refers to a position where the natural curves of the spine, including the forward, backward, and sideways curves, are maintained without any deviation as shown in Figure 1a [1]. However, prolonged computer use can cause the head’s center of gravity to gradually shift forward due to focusing on the computer monitor, resulting in a posture where the neck bends forward as shown in Figure 1b. Prolonged sitting in front of a desk while maintaining such a poor posture can cause pain in the back of the neck, shoulders, waist, and other areas. Furthermore, if this poor posture is continued, the arrangement of the vertebrae in the neck can become abnormally straightened, leading to text neck syndrome. This leads to the weight of the head being directly transmitted to the neck and shoulders, without being evenly distributed, which can cause problems such as neck disc, headaches, and numbness in the hands, as well as structural changes in the cervical and thoracic spine [2,3,4]. And as the distance between the head and the monitor decreases, eye fatigue increases, and vision can significantly deteriorate. When using a computer, people often assume the L-posture, where they sit with their buttocks positioned towards the front of the chair and lean their shoulders against the backrest as shown in Figure 1c. This posture puts pressure on the lower back and causes the neck to bend, as the buttocks and shoulders bear the weight of the upper body, and it has a negative impact on the neck and waist. In addition, the text neck posture and L-posture cause tension in the cervical and spinal areas, leading to discomfort and, in severe cases, can cause herniated discs in the neck or waist. Moreover, since this incorrect posture habit can have detrimental effects on body development, it is especially important to prevent adolescents during their growth years from adopting such postures [5]. However, until recently, most of the published studies have focused on theories and methodologies for preventing the text neck posture, and there have been few studies with high accuracy that classify both text neck and L-posture together [6,7,8,9,10,11,12,13,14,15,16,17,18,19,20,21,22,23,24,25]. Furthermore, since most sensor equipment is attached to the body or clothing, it can be heavy and uncomfortable, and there is the limitation of the cost of posture-correction chairs that are commercially available with attached sensors.
In this paper, we propose a study to classify good posture, text neck posture, and L-posture when working in front of a desktop computer, the latter two of which are common postures that have a negative impact on the cervical and lumbar spine. In this study, we classified postures including the L-posture and the text neck posture, which can have a negative impact on the cervical and spinal areas and are not often classified together in previous research. In addition, since the user’s side posture is captured with a camera and the angle of a specific part is measured to classify the posture, it can be measured anywhere as long as there is space available on the side. Furthermore, it has the advantage of being cost-effective as it can be utilized not only with CCD cameras, but also with images captured by smartphones. The structure of this paper is as follows. In Section 2, we introduce previous studies on posture correction. In Section 3, we describe the posture classification algorithm proposed in this paper, and in Section 4, we verify and analyze the experimental results of the proposed algorithm. Finally, we draw conclusions on this paper.

2. Related Works

When using a desktop computer, people initially adopt a good posture. However, over time, people tend to slump into comfortable postures such as the forward head posture of the text neck or the L-posture with the buttocks pushed forward and the neck bent. These postures can lead to conditions such as herniated discs, back pain, and vision problems, making it important to prevent these postures. To this end, various studies have been presented, such as those that measure posture by attaching sensor devices to the body or clothing [6,7,8,9,10,11,12,13,14,15,16,17,18,19,20], classify posture using chairs or cushions equipped with sensors [21,22,23], classify posture by measuring the distance with sensors [24], and judge posture using skeleton analysis [25,26]. Among them, there have been many studies on measuring posture by attaching sensor devices to the body or clothing. Recently, Han et al. presented the impact of forward head posture on human health and the sensor device for measuring it [6]. In the paper, a new wearable measurement device was proposed by combining a three-axis magnetometer and miniature permanent magnet to overcome technical issues with Flex sensors and accelerometers. An algorithm was proposed using machine learning to classify good posture and text neck posture based on accelerometer data obtained by tracking changes in magnet direction. The experimental results showed a classification accuracy of 95.6%. Similarly, Lee et al. presented a study on monitoring neck posture using the cervical flexion angle (CFA) obtained from sensors attached to wearable devices [7]. In the experiment, the correlation between the deflected cervical flexion angle (dCFA) and deflected caniovertebral angle (dCVA), which reflected the angles deviated from the good posture of each participant, was analyzed using the results of the CFA obtained from wearable devices and the caniovertebral angle (CVA) observed by a 3D motion camera. In the experimental result, the high correlation was 0.9. Tlili et al. presented a study on monitoring the degree of shoulder and back curvature [8]. The monitoring system is wearing a smart belt device equipped with inertial sensors to track trunk flexion and shoulder bending over time. If poor posture is detected, the user can receive real-time notifications through a smartphone application. In addition, various studies have been published on wearable devices attached to the body or clothing that can measure good posture [9,10,11,12,13,14,15,16,17,18,19]. However, when using wearable devices for measurement, it is necessary to attach measuring equipment to the body or clothing, making it heavy and uncomfortable; additionally, devices attached to the body can detach during measurement. Furthermore, the L-posture may be difficult to detect using wearable devices because the angle of the neck remains unchanged while the waist is bent.
Consistent studies have also been presented on posture classification using chairs or cushions with attached sensors. Kim et al. developed a cushion using conductive textile-based capacitive pressure sensors to measure a good sitting posture [20]. This method utilizes a pressure measurement circuit to classify the user’s posture, and then sends the results to a real-time mobile app through Bluetooth Low Energy (BLE) for the user to correct their posture. Hu et al. proposed a method for classifying postures ranging from good posture to leaning right, left, back, forward, and crossing legs using artificial neural networks (ANN) with sensor values attached to a chair [21]. When analyzing ANN, the input data were the values from six sensors attached to the chair, and the accuracy was 97.43% when the number of layers was two and the number of nodes was 28. As a similar study, Najafi et al. presented a smart chair sensor system [22]. This involves using a deep learning algorithm to classify sitting posture based on data from eight pressure sensors installed on the chair. However, the classification accuracy was 91.68%. Roh et al. proposed a Sitting Posture Monitoring System (SPMS) that measures six different sitting postures using a machine learning algorithm applied to weight ratios obtained from sensors attached to a chair [23]. The experiment was conducted with nine participants, and a support vector machine achieved an average accuracy of 97.2%. However, the sample size of the experiment is too small to generalize the results. Also, although chairs and cushions equipped with pressure sensors can classify the degree of body inclination, they may have lower accuracy in classifying the forward-head posture of the text neck where the back is rested on the chair and the neck is projected forward. In addition, sensor-equipped chairs are not cheap, making them difficult to use.
In studies that classify posture by measuring the distance with sensors, a recent study has proposed using an ultrasonic sensor attached to the desktop computer monitor to measure the distance between a person’s face and the monitor and classify whether they are in a good posture [24]. In that paper, they improved the accuracy by removing the noise that occurs during distance measurement and reducing error alerts. The proposed method has the advantage of being cost-effective and relatively convenient compared to other methods, as it can detect the distance between the computer monitor and the user’s face with ease. However, distance-measuring sensors have inherent limitations in accuracy due to the nature of the sensor, resulting in inaccurate measurements. Therefore, a calibration procedure is necessary and there is a disadvantage of not being able to detect various postures.
There have been studies proposed using a skeleton algorithm to determine posture from image data. Tokas proposed a study using a Microsoft Kinect sensor to obtain 3D skeleton coordinates for posture and classified good posture and text neck posture using machine learning techniques [25]. In the experiment, the random forest and support vector machine learning algorithms achieved an accuracy of 92.85%. Additionally, Lawanont et al. presented a system that classifies between text neck and normal posture by calculating the angle of the neck using sensors and images [26]. However, most of the studies published so far have focused on investigating the occurrence of text neck posture when using smartphones. It is not only text neck posture but also the L-posture that can have negative effects on the user’s body when using a desktop computer. Therefore, it is necessary to classify whether the user is in the L-posture when working on a desktop computer. However, there are relatively few studies on postures when using desktop computers, and there is a limitation that there are few studies with high accuracy that classify both the posture of the text neck and the L-posture, which are postures that have a negative impact on the neck and waist.

3. Proposed Algorithm

Many modern people spend long hours using desktop computers on a daily basis. During prolonged computer use, they tend to adopt poor postures that strain their necks, backs, and eyes. These postures can cause physical problems such as text neck syndrome or problems with the neck or spine. To prevent such problems, many studies have been published. However, devices attached to the body or clothing can cause discomfort to the user, and distance sensors and image analysis still have limitations in classification accuracy. To overcome these limitations, this paper proposes an algorithm for classifying good and bad postures using image data. In this section, we first describe the OpenPose algorithm used in the proposed algorithm and then explain the proposed algorithm.

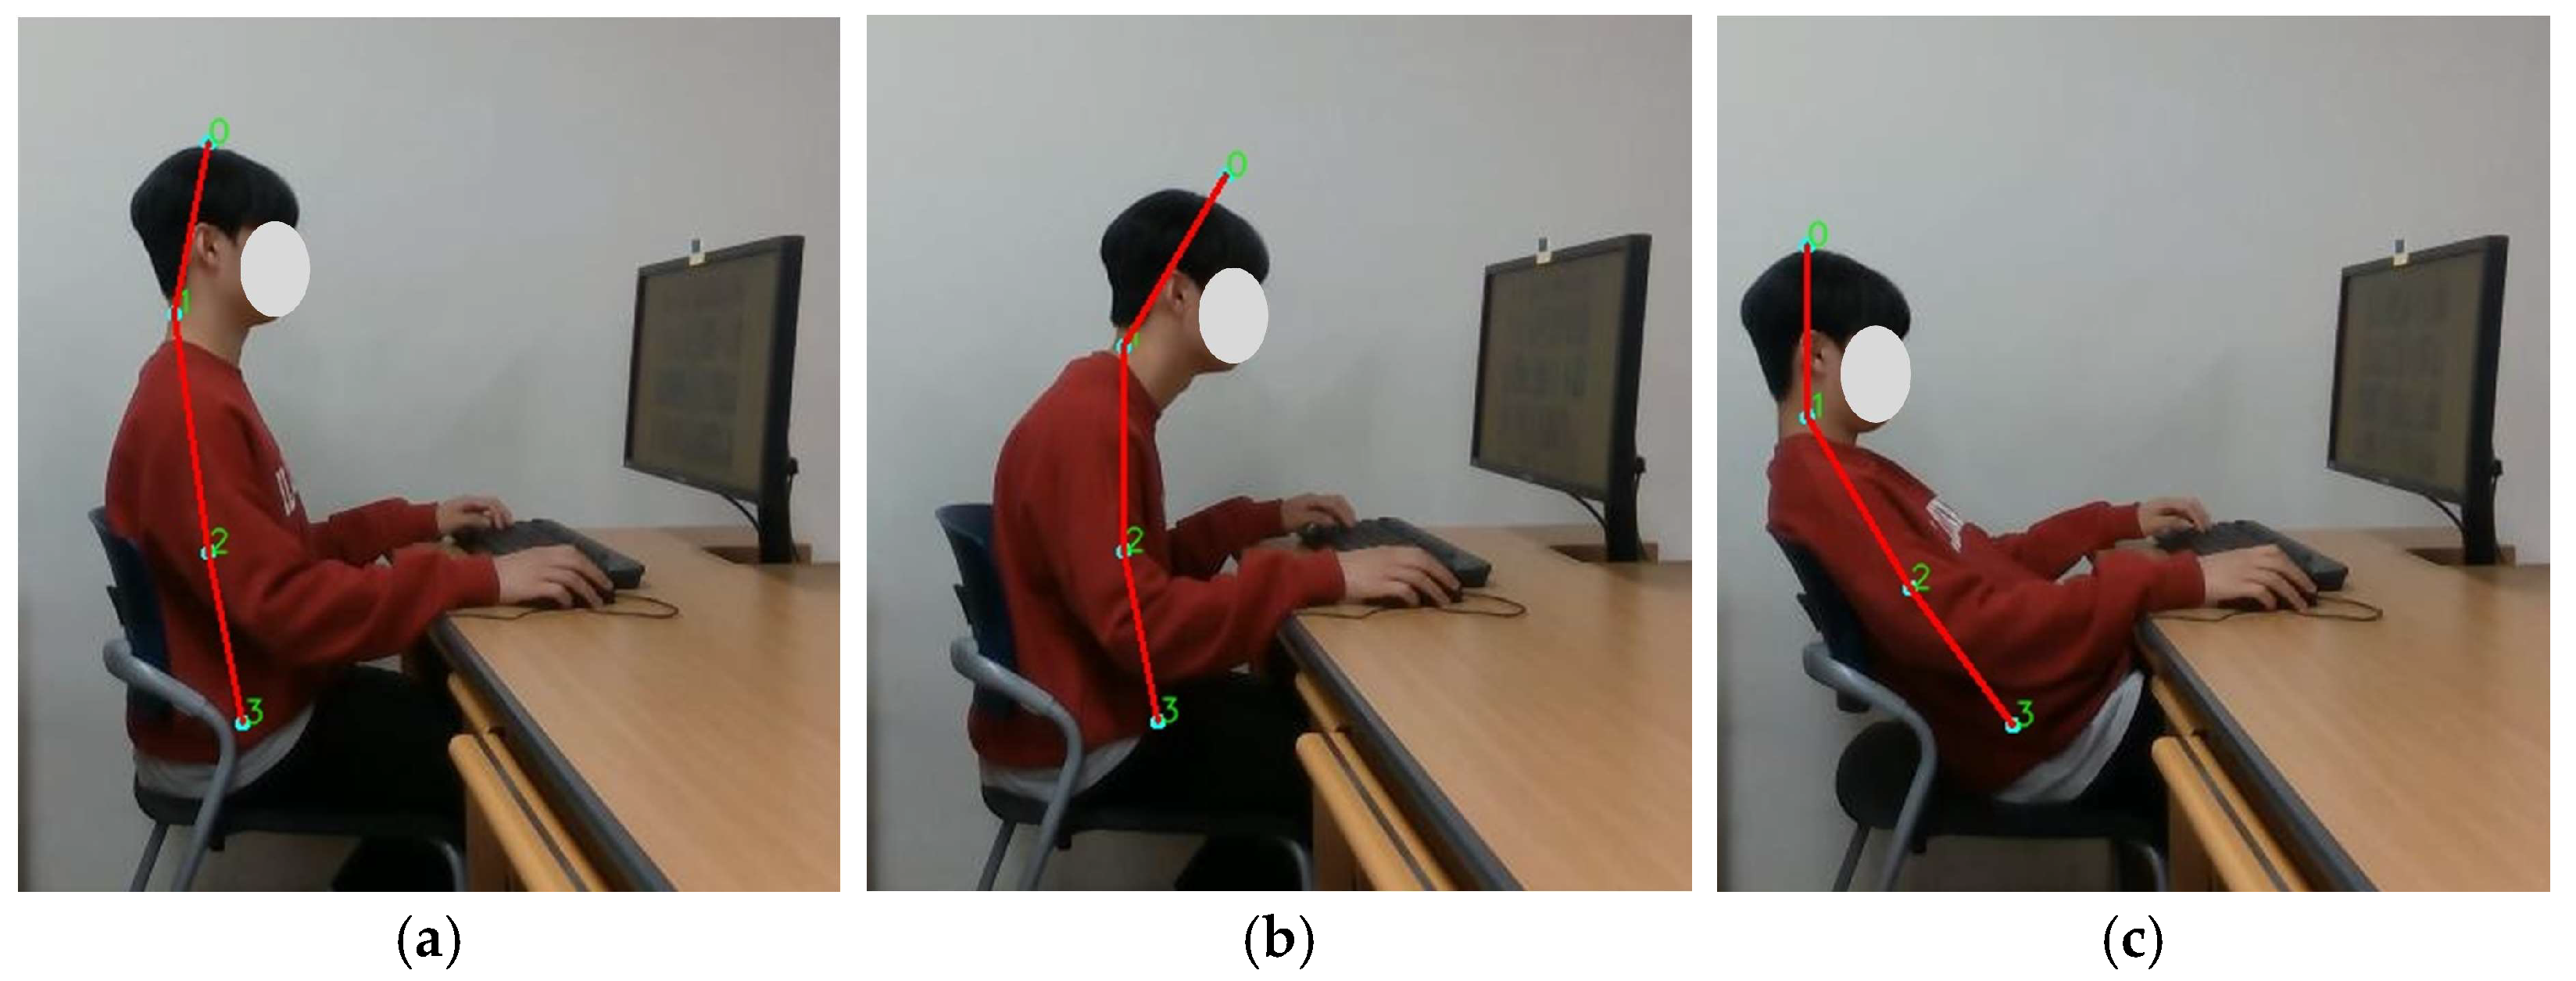
3.1. Skeleton Algorithm

In this paper, the OpenPose algorithm is used as a skeleton algorithm in the proposed algorithm. The OpenPose algorithm was first presented at the 2017 IEEE Conference on Computer Vision and Pattern Recognition (CVPR) and various studies using the OpenPose algorithm have been published [27,28,29]. The OpenPose algorithm is an algorithm that estimates the skeleton of a person in an image in real time, allowing for the estimation of the poses of multiple people. The algorithm can detect 25 key points of the human body, including the head, neck, shoulders, elbows, wrists, hips, knees, and ankles. It has high accuracy even in various poses, clothing, and lighting conditions, making it useful in a wide range of fields, including human action recognition, pose estimation, and emotion analysis.
S = ( S 1 , S 2 , , S I ) has I confidence maps, one per part, where S i = R w × h , i 1 , , I . L = ( L 1 , L 2 , , L C ) has C confidence maps, one per part, where L c = R w × h × 2 , c 1 , , C , and each image location in L c encodes a 2D vector. The S represents the confidence maps, which are Gaussian models centered on the key point. In addition, the L is the Part Affinity Fields (PAFs) that contain connection information, which is a tensor with direction and location information to determine the correlation between joints. In other words, Part Affinity Fields (PAFs) contain directional and positional information to determine the correlation between joints in order to predict whether the joints match the next joint. We generate individual confidence maps S i , n * for each person n . The value at location can be expressed as follows:
S i , n * ( p ) = e x p p x i , n 2 2 σ 2 ,
where p R 2 , x i , n R 2 is the ground truth position of body part i for person n in the image. The OpenPose algorithm automatically detects and extracts human body parts from RGB images. To do this, it first takes an image as input and uses VGG-19, which is based on the Convolutional Neural Network (CNN), to extract the positions of each body part. After that, joints are detected from the Part Confidence Maps (PCM), denoted as S i , n * , and the connection between joints is found using PAFs. Then, the Part Confidence Map (PCM) is used to refine the positions of each body part. PCM is a network that locates joints to track human posture and predicts the areas where there may be joints for each part, displaying them as a heat map.

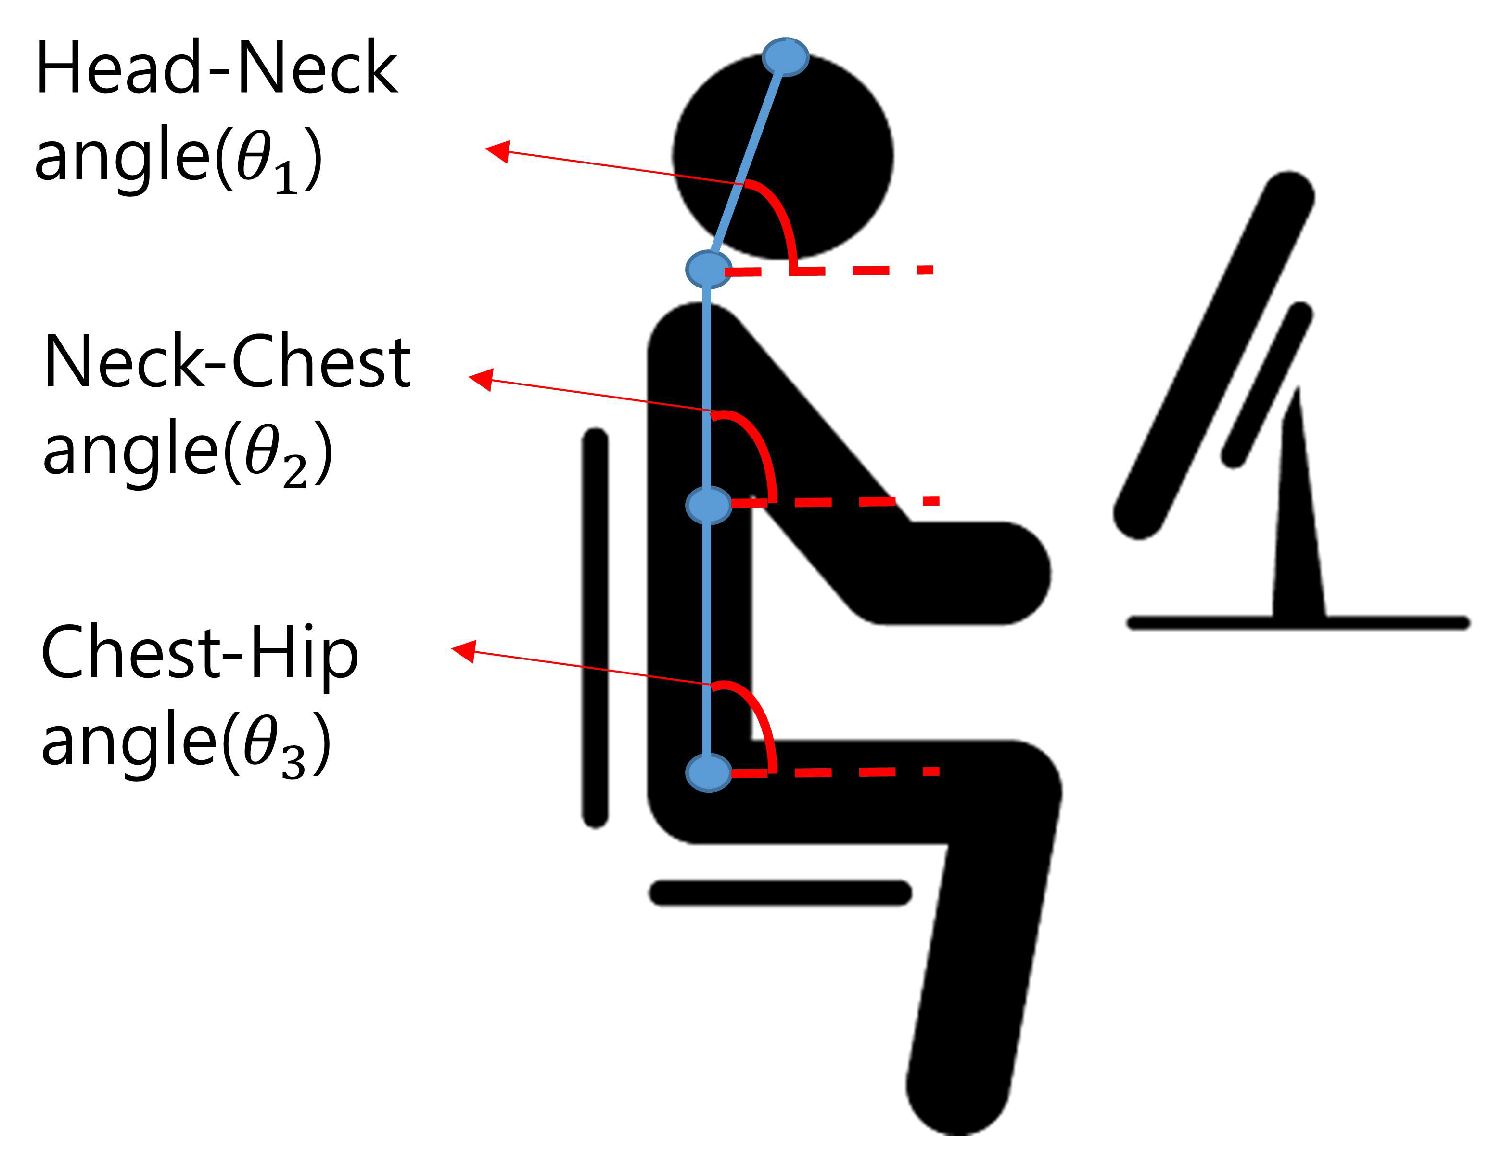
3.2. Classification of Good and Bad Postures in Front of a Computer

In the proposed algorithm, the OpenPose algorithm described earlier is used to detect the human skeleton in the side-view images, and based on this, the features of the angles for each body part are identified, and the postures are classified. The proposed algorithm is constructed to classify the three postures, and the algorithm process is shown in Figure 2. First, a side-view image of a user using a desktop computer is obtained, and the user’s skeleton is determined using the OpenPose algorithm. As shown in Figure 3, we can obtain the skeletons for each posture obtained using the OpenPose algorithm, where (a) represents the good posture, (b) represents the text neck posture, and (c) represents the L-posture. In Figure 3, the assigned numbers for each body part are as follows: head (0), neck (1), chest (2), and hip (3), and they are connected by lines representing ‘head–neck’, ‘neck–chest’, and ‘chest–hip’. Then, as shown in Figure 4, the angles of ‘head–neck’ ( θ 1 ), ‘neck–chest’ ( θ 2 ), and ‘chest–hip’ ( θ 3 ) are calculated. At this point, the angles of θ 1 , θ 2 , and θ 3 are calculated as shown in Figure 4 using Equation (2):
θ i = a r c t a n y 1 y 2 x 1 x 2 , i = 1,2 , 3 ,
where ( x 1 ,   y 1 ) represents the coordinate point of the first part, and ( x 2 , y 2 ) represents the coordinate point of the second part. For example, when calculating ‘head–neck’ ( θ 1 ), ( x 1 ,   y 1 ) represents the coordinate values of the head (0) within the image, and ( x 2 , y 2 ) represents the coordinate values of the neck (1). Therefore, theta_1 can be calculated using the values x 1 , y 1 , x 2 , and y 2 in Equation (2). And then, based on the characteristics of the three angles specific to each posture, the postures are classified. In Figure 3a, a good posture maintains a straightened back and shoulders while preserving the natural curves of the spine. Therefore, the values of these three angles are larger than those of the text neck posture. The L-posture is leaning against a chair with the hips pushed forward, so the angles for ‘neck–chest’ and ‘chest–hip’ are larger compared to the good posture and text neck posture. On the other hand, the text neck posture is a posture where the shoulders and waist are bent, and the neck is pulled forward, so the angle values for ‘head–neck’, ‘neck–chest’, and ‘chest–hip’ are relatively smaller compared to the good posture, and in particular, the ‘head–neck’ angle is much smaller. Therefore, a new variable θ 4 is defined by using the weight of each angle to better reflect these characteristics of the text neck posture, and the formula is as follows:
θ 4 = θ 1 × 0.6 + θ 2 × 0.2 + θ 3 × 0.2 ,
In Equation (3), the text neck posture is given a weight of 60% due to its characteristic of having a smaller angle between the head and neck compared to other postures, while the angle ratios of θ 2 and θ 3 are equally weighted at 20% each. Using the four angles obtained earlier, the three postures are classified. If both θ 2 and θ 3 are greater than the threshold values T h 1 and T h 2 , respectively, the posture is classified as L-posture. Then, if both θ 1 and θ 4 are smaller than the threshold values T h 3 and T h 4 , respectively, the posture is classified as text neck posture (T-posture), while if they are both greater, it is classified as a good posture (G-posture). Since there was no posture classification defined based on the exact angle values in previous studies, the four threshold values used in this study are defined based on the experimental data conducted in Section 4.

4. Experiment Results and Discussion

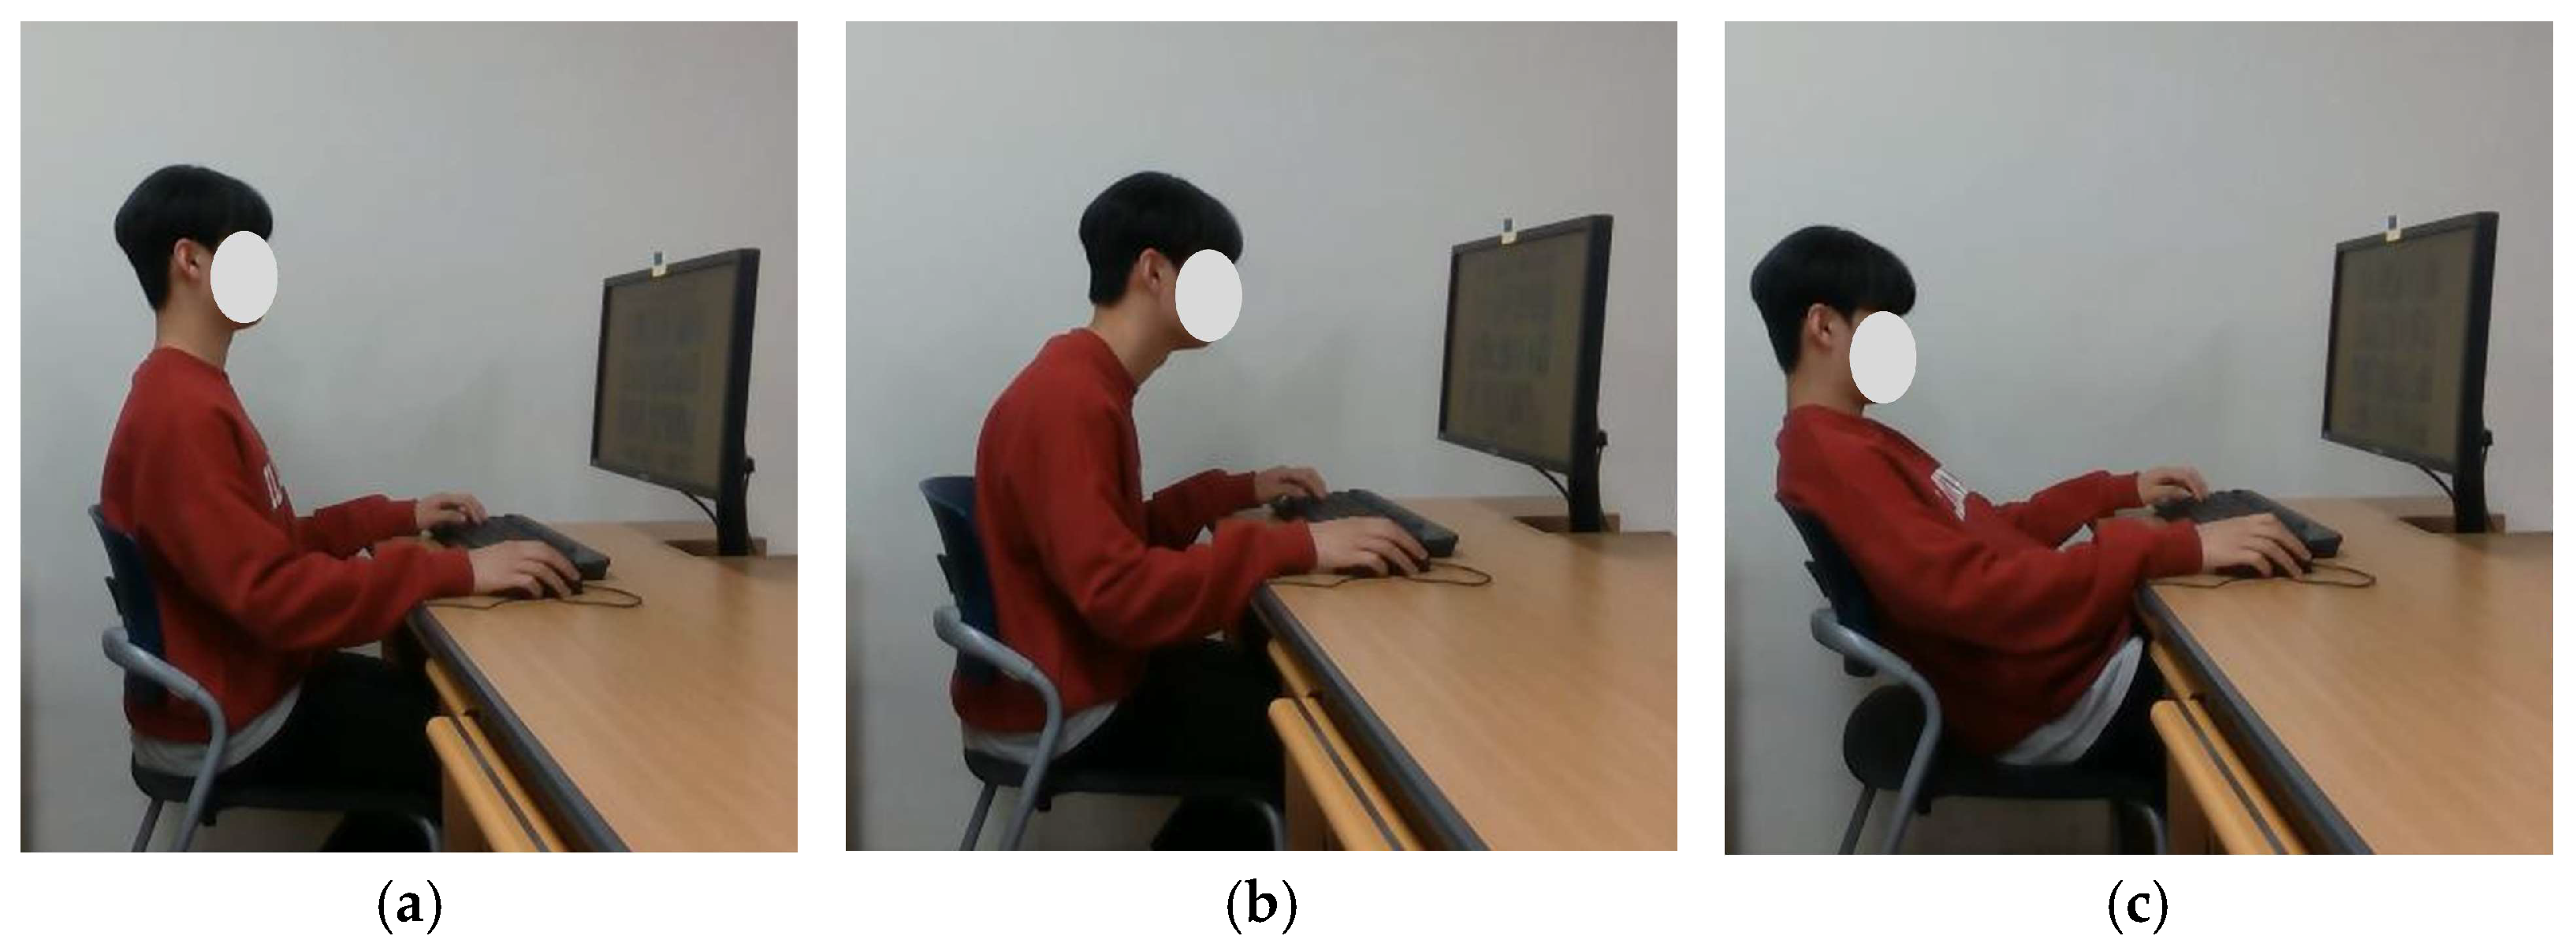
4.1. Experiment Setups

To evaluate the performance of the proposed algorithm in this study, we selected a total of 50 participants consisting of adult males and females aged 20 to 50. Among them, 35 were male and 15 were female, and they included university students as well as individuals engaged in office work. In the experiment, the subject’s side was captured using one CCD camera from a distance of 140 cm, as shown in Figure 5. Each participant was instructed to assume the good posture, the text neck posture, and the L-posture, and a total of 952 experiment image data (300 for good posture, 366 for text neck posture, and 286 for L-posture) were acquired. PC specifications are as follows: Windows 10 Pro, Intel® Core™ i7010700k, [email protected] GHz, and Python 3.6. Moreover, statistical tests were conducted using SPSS software package version 25.0 (IBM Corp., Armonk, NY, USA).

4.2. Evaluation Criteria for the Classification Algorithms

To evaluate the performance of the proposed algorithm, four evaluation metrics were used, namely, accuracy, precision, recall, and F1-score, which are commonly used evaluation metrics to assess the robustness and efficiency of the algorithm. True Positive (TP) refers to the case where both the actual class value and the predicted class value are 1. True Negative (TN) indicates that both the actual class value and the predicted class value are 0. False Negative (FN) is the case where the actual class value is 1 and the predicted class value is 0, while False Positive (FP) is the case where the actual class value is 0 and the predicted class value is 1. Accuracy is the proportion of correctly predicted observations among the total observations, while Recall is the proportion of actual class values that are classified as 1 among those that are actually 1. Precision refers to the proportion of predicted class values that are actually 1 among those classified as 1, while F1-score is the harmonic mean of Precision and Recall. F1-score is mainly used when the data are imbalanced. Accuracy, Recall, Precision and F1 score can be calculated by the following formulas:
Accuracy = ( T P + T N ) / T P + T N + F P + F N ,
R e c a l l = T P / T P + F N ,
P r e c i s i o n = T P / T P + F P ,
F 1 - score = 2 × P r e c i s i o n × R e c a l l / P r e c i s i o n + R e c a l l ,

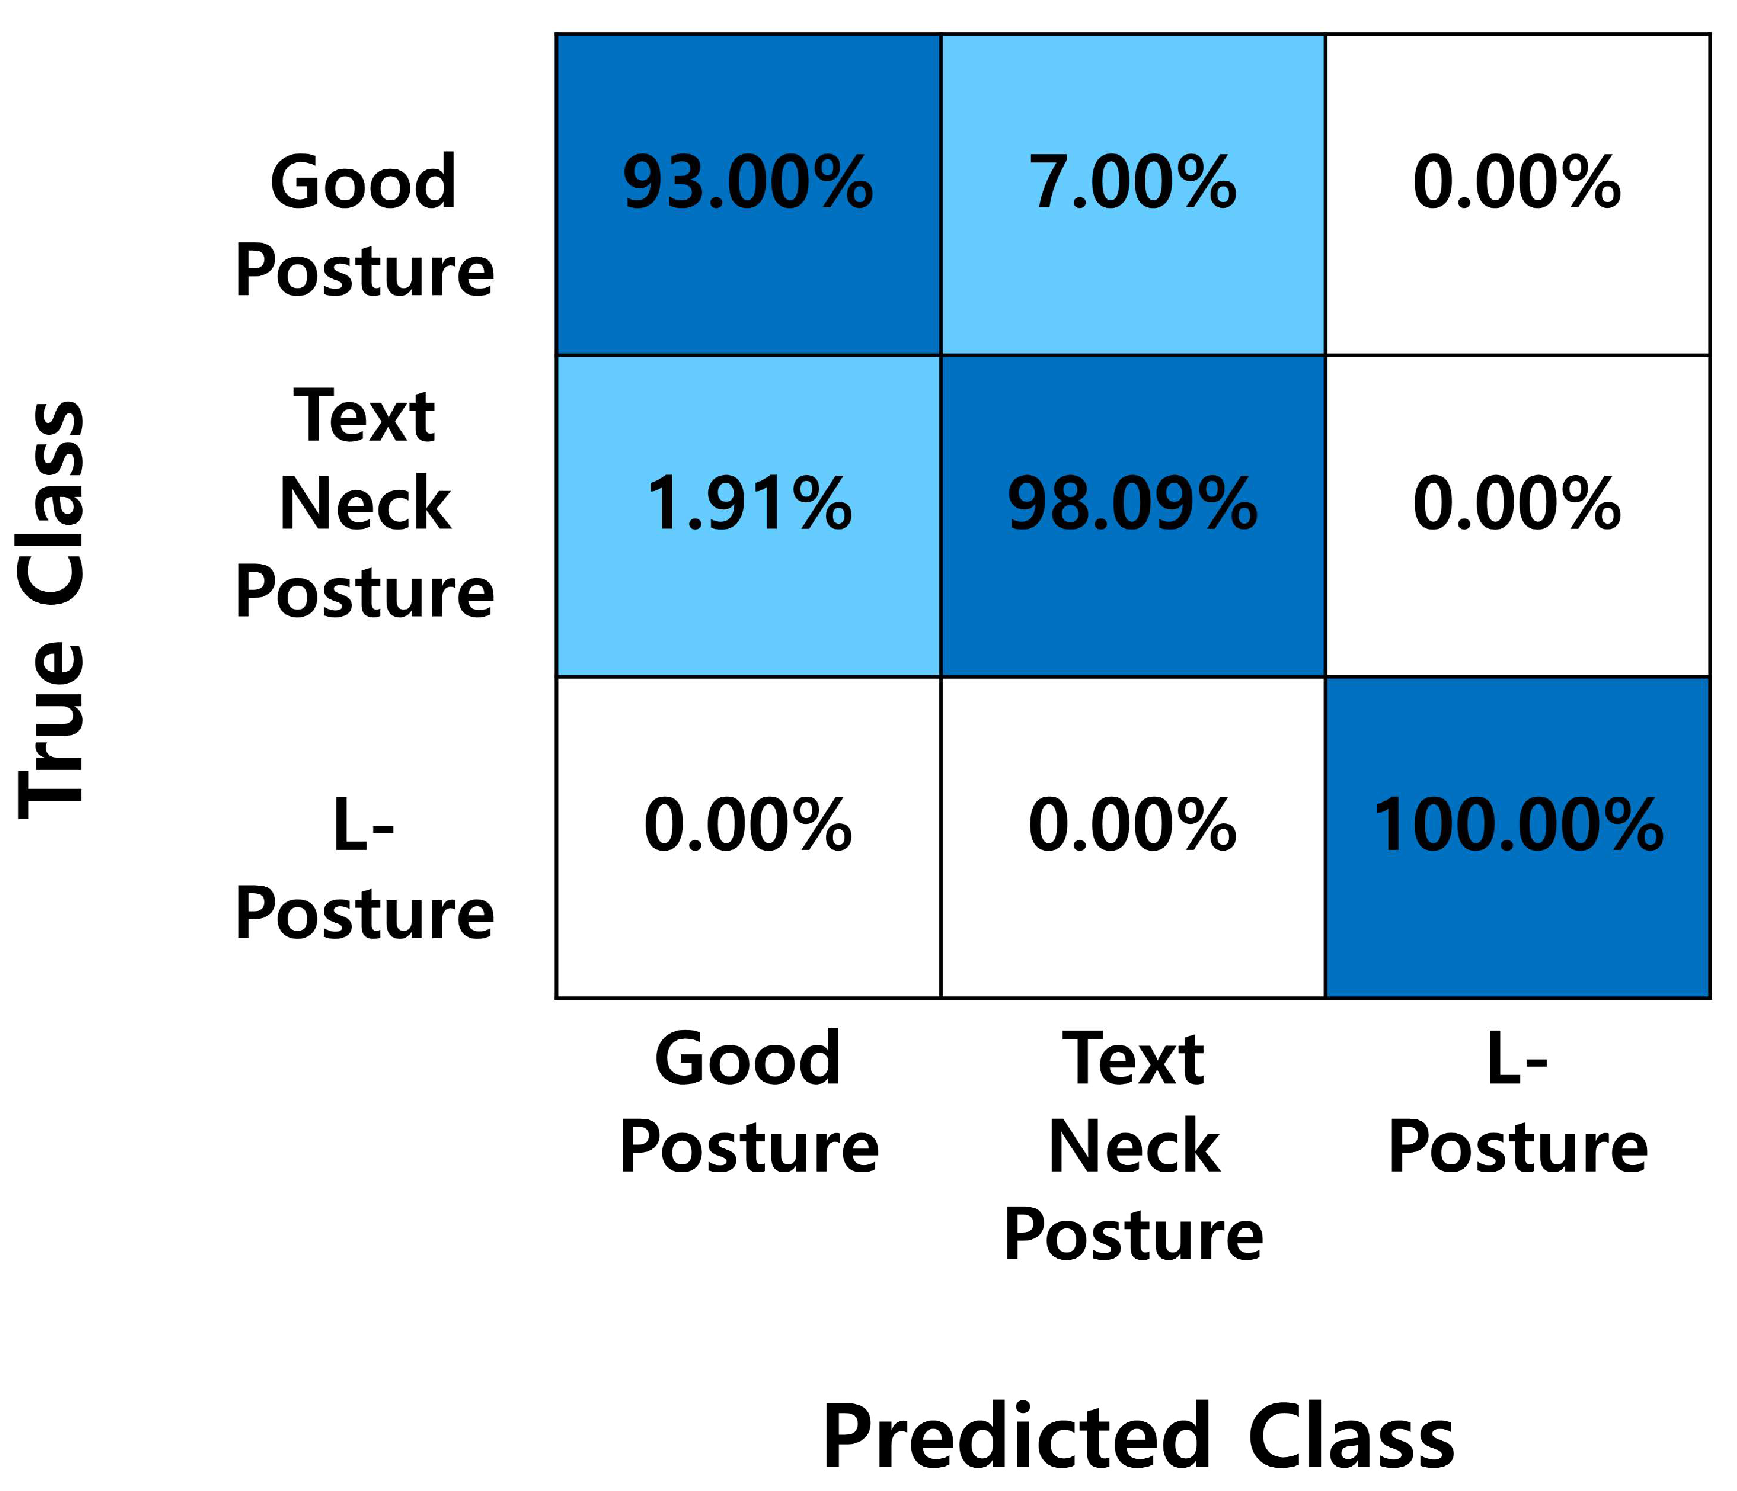
4.3. Experiment Results

First, we utilized a skeleton algorithm to detect the positions of the head, neck, chest, and hips in the participants’ image data. Then, based on the results, we measured θ 1 , θ 2 , θ 3 , and θ 4 for each posture and calculated them by using Equations (2) and (3). The results are shown in Table 1 and Figure 6. Table 1 presents the average, minimum, maximum, and standard deviation values of each angle for each posture, including good posture, text neck posture, and L-posture. Figure 6 shows box plots for the angles of each posture. In Table 1, the mean values of the angles θ 2 and θ 3 in the L-posture were 118.1552 and 126.6295, respectively. In contrast, for the good posture, the mean values were 95.6220 and 100.3043, respectively, and for the forward head posture, they were 79.4418 and 86.1497, respectively. Through this, it was found that the angle values in the L-posture were larger than those in other postures, and this difference was confirmed in Figure 6. Therefore, it was possible to determine whether the posture was an L-shaped posture by using the angle values between the neck and chest, and between the chest and hips. In addition, the average values of the θ 1 and θ 4 angles were 79.6379 and 86.9680, respectively, in the good posture, while they were 56.1264 and 66.7944 in the turtle-neck posture. Furthermore, the minimum and maximum values of θ 1 were 68.1986 and 90.0000, respectively, in the good posture, and the minimum and maximum values of θ 4 were 78.9390 and 97.2055, respect- tively. On the other hand, when in text neck posture, the minimum and maximum values of θ 1 were 30.9638 and 68.1986, respectively, while those of θ 4 were 46.5310 and 79.1811. This indicates that in the text neck posture, the upper body is tilted forward, and the neck protrudes forward more compared to the good posture, resulting in a difference in the angles of θ 1 and θ 4 . Based on the experimental results, we set the threshold values used in the proposed algorithm to T h 1 = 105, T h 2 = 110, T h 3 = 70, and T h 4 = 80, respectively.
Using the previously defined threshold values, we applied the proposed algorithm to classify the three postures. As a result, the classification accuracy of the proposed algorithm was 97.0588%, with an F1-score of 95.23%. Figure 7 shows the confusion matrix for the classification results of the three postures. As shown in Figure 7, all images of the L-posture were accurately classified, with a true value ratio of 100%. The good posture and text neck posture had accuracy rates of 93.00% and 98.09%, respectively. The percentage of misclassifying the actual class as a text neck posture when it was a good posture was 7.00%, and the percentage of misclassifying the actual class as a good posture when it was a text neck posture was 1.91%. Table 2 shows the precision and recall results for each posture. As can be seen in Table 2, all values for L-posture were 100%. When in a good posture, the precision and recall were 97.55% and 93.00%, respectively, while for a text neck posture, the precision and recall were 94.47% and 98.09%, respectively. On the other hand, all misclassification occurred because it could not distinguish between the good posture and the text neck posture. It was determined that misclassification occurred due to images that were not accurate in distinguishing between good and text neck postures, or students exhibiting text neck symptoms even when they were in the good posture, among the results that were misclassified as shown in Figure 8.
We conducted a comparative experiment to assess whether conventional research methods can classify and measure good posture, text neck posture, and L-posture. We conducted a comparative experimental study using a posture measurement method that uses three-axis sensors [6] and a posture measurement method that uses a sensor cushion [20] that were recently published. Additionally, we performed the experiment using equipment that has similar functionalities to the devices proposed in previous studies. In the posture measurement study [6] using three-axis sensors, research was conducted to classify good posture and text neck posture in conventional research. Therefore, we performed an experiment to investigate whether this method could also measure L-posture. As shown in Figure 9, three-axis accelerometer sensors were attached next to the ear and at the back of the neck. And then, the x-axis, y-axis, and z-axis measurements were taken using the sensors when in good posture and L-posture. According to the experimental results, as observed in Table 3, the average sensor measurements next to the ear were similar between good posture and L-posture. Furthermore, the average sensor measurements at the back of the neck were similar between good posture and L-posture, excluding the y-axis value. In conclusion, since there were no significant differences observed when measuring using three-axis accelerometer sensors, it was challenging to classify between good posture and L-posture. Next, we conducted an experiment utilizing a sensor cushion, as shown in Figure 10, to classify postures [20]. Since the conventional study focused on classifying good posture, tilted posture, L-posture, and crossed-leg posture, we conducted an experiment in this study to investigate whether this method could be used to classify text neck posture as well. Figure 10a represents a good posture, while Figure 10b shows the corresponding results obtained from the sensor cushion. Figure 10c shows a text neck posture, while Figure 10d illustrates the corresponding results obtained from the sensor cushion. In the sensor cushion results shown in Figure 10b, d, areas with higher pressure are represented in red color. As shown in Figure 10b, d, both results show that the highlighted areas of the sensor cushion, represented by the red color, are concentrated in the central region. This indicates that in both postures, pressure was predominantly applied to the central region of the cushion. This result indicates that the conventional research method faces challenges in classifying between good posture and text neck posture. Therefore, through the experiments, it was evident that both of the existing studies had limitations in classifying text neck posture and L-posture, which are incorrect postures of the neck and spine.

5. Conclusions

In this paper, we propose an algorithm for classifying sitting postures during desktop computer work into the categories of good posture, text neck posture, and L-posture. The proposed method in this paper uses the skeleton algorithm to obtain the ‘head–neck’, ‘neck–chest’, and ‘chest–hip’ angles from the lateral view image data of the user captured by a camera. Then, these angles are used to classify the three postures. The proposed method can judge postures from images freely as long as there is space for lateral shooting, and it can classify postures at a low cost since it can be applied not only to a CCD camera but also to images taken with a smartphone. Moreover, the proposed method has an advantage in that it can classify not only the text neck but also the L-posture, which is a posture that adversely affects the spine. Because of this reason, the research proposed in this paper can contribute to the study of classifying text neck posture and L-posture together, which has not been conducted before. The classification accuracy of the experimental results was 97.0588%, and in particular, the L-posture was classified with 100% accuracy. This is considered to be due to the fact that the proposed algorithm reflects the characteristics of each posture angle and was able to achieve high accuracy. However, there was about 3% misclassification, and some of them were images that were difficult to classify accurately between the good posture and the text neck posture. Furthermore, some of the subjects showed symptoms of text neck, which resulted in misclassification. In the comparison experiment, we assessed whether conventional research methods could classify and measure good posture, text neck posture, and L-posture. However, the method using three-axis accelerometer sensors failed to classify L-posture, while the method using a sensor cushion failed to classify text neck posture. Therefore, the experiments using conventional research methods demonstrated limitations in classifying text neck posture and L-posture, which are detrimental postures of the neck and spine.
In future studies, we plan to further refine the classification of the text neck posture to overcome the limitations of misclassification identified in this study. In addition, we plan to add more postures such as leaning to the side or crossing legs and develop a system for real-time posture correction based on the results. To reduce misclassification, we will incorporate an initial assessment to identify participants who exhibit text neck syndrome. In this study, the proposed method, as mentioned in Figure 8 of Section 4, classified participants as having a forward head posture despite their attempt to maintain a good posture, demonstrating the ability to classify individuals with text neck symptoms. We will utilize this approach to incorporate an initial assessment in the future development of a real-time posture correction system.

Author Contributions

Conceptualization, J.L., H.C., K.Y. and J.K.; methodology, J.L. H.C., K.Y. and J.K.; software, J.L., H.C. and J.K.; validation, J.L., H.C., K.Y. and J.K.; formal analysis, J.L., H.C. and J.K.; investigation, J.L., H.C. and J.K.; resources, J.L., H.C. and J.K.; data curation, J.L., H.C. and J.K.; writing—original draft preparation, J.L.; writing—review and editing, K.Y. and J.K.; visualization, J.L., H.C. and J.K.; supervision, J.K.; project administration, J.K.; funding acquisition, J.K. All authors have read and agreed to the published version of the manuscript.

Funding

This research was funded by National Research Foundation of Korea, grant number CD202112500001, Small and Medium Business Technology Innovation Development Project from TIPA, grant number 00220304 and Link 3.0 of PKNU, grant number 202310810001.

Institutional Review Board Statement

The study was conducted in accordance with the Declaration of Helsinki and approved by the Institutional Review Board of University of Dong-Eui Institutional Review Board (DIRB-202303-HR-E-42 and 6 March 2023).

Informed Consent Statement

Informed consent was obtained from all subjects involved in the study. Written informed consent has been obtained from the patient(s) to publish this paper.

Data Availability Statement

Not applicable.

Conflicts of Interest

The authors declare no conflict of interest.

References

  1. Jo, B.; Ryu, J.; Kim, J. The Effect of Forward and Backward Walking on Turtle Neck Syndrome in Elementary Students. Korean J. Sports Sci. 2020, 29, 1287–1298. [Google Scholar] [CrossRef]
  2. Chu, E.C.P. Preventing the progression of text neck in a young man: A case report. Radiol. Case Rep. 2022, 17, 978–982. [Google Scholar] [CrossRef] [PubMed]
  3. Shaghayeghfard, B.; Ahmadi, A.; Maroufi, N.; Sarrafzadeh, J. Evaluation of forward head posture in sitting and standing positions. Eur. Spine J. 2016, 25, 3577–3582. [Google Scholar] [CrossRef] [PubMed]
  4. Ferracini, G.N.; Chaves, T.C.; Dach, F.; Bevilaqua-Grossi, D.; Fernández-de-Las-Peñas, C.; Speciali, J.G. Relationship between active trigger points and head/neck posture in patients with migraine. Am. J. Phys. Med. Rehabil. 2016, 95, 831–839. [Google Scholar] [CrossRef]
  5. Kazeminasab, S.; Nejadghaderi, S.A.; Amiri, P.; Pourfathi, H.; Araj-Khodaei, M.; Sullman, M.J.; Kolahi, A.A.; Safiri, S. Neck pain: Global epidemiology, trends and risk factors. BMC Musculoskelet. Disord. 2022, 23, 26. [Google Scholar] [CrossRef]
  6. Han, H.; Jang, H.; Yoon, S.W. Novel wearable monitoring system of forward head posture assisted by magnet-magnetometer pair and machine learning. IEEE Sens. J. 2019, 20, 3838–3848. [Google Scholar] [CrossRef]
  7. Lee, J.; Chee, Y. The Estimation of Craniovertebral Angle using Wearable Sensor for Monitoring of Neck Posture in Real-Time. J. Biomed. Eng. Res. 2018, 39, 278–283. [Google Scholar]
  8. Tlili, F.; Haddad, R.; Bouallegue, R.; Shubair, R. Design and architecture of smart belt for real time posture monitoring. Internet Things 2022, 17, 100472. [Google Scholar] [CrossRef]
  9. Dobrea, D.M.; Dobrea, M.C. A warning wearable system used to identify poor body postures. In Proceedings of the 2018 Advances in Wireless and Optical Communications (RTUWO), Riga, Latvia, 15–16 November 2018. [Google Scholar]
  10. Bootsman, R.; Markopoulos, P.; Qi, Q.; Wang, Q.; Timmermans, A.A. Wearable technology for posture monitoring at the workplace. Int. J. Hum.-Comput. Stud. 2019, 132, 99–111. [Google Scholar] [CrossRef]
  11. Crane, A.B.; Doppalapudi, S.K.; O’Leary, J.; Ozarek, P.; Wagner, C.T. Wearable posture detection system. In Proceedings of the 40th Annual Northeast Bioengineering Conference (NEBEC), Boston, MA, USA, 25–27 April 2014. [Google Scholar]
  12. Chopra, S.; Kumar, M.; Sood, S. Wearable posture detection and alert system. In Proceedings of the International Conference System Modeling & Advancement in Research Trends (SMART), Moradabad, India, 25–27 November 2016. [Google Scholar]
  13. Matsumoto, M.; Takano, K. A posture detection system using consumer wearable sensors. In Proceedings of the 2016 10th International Conference on Complex, Intelligent, and Software Intensive Systems (CISIS), Fukuoka, Japan, 6–8 July 2016. [Google Scholar]
  14. Estrada, J.E.; Vea, L.A. Real-time human sitting posture detection using mobile devices. In Proceedings of the IEEE Region 10 Symposium (TENSYMP), Bali, Indonesia, 9–11 May 2016. [Google Scholar]
  15. Dobrea, D.M.; Dobrea, M.C. A neuronal model of the 3D head position based on a wearable system. In Proceedings of the International Conference and Exposition on Electrical and Power Engineering (EPE), Iasi, Romania, 18–19 October 2018. [Google Scholar]
  16. Sardini, E.; Serpelloni, M.; Ometto, M. Smart vest for posture monitoring in rehabilitation exercises. In Proceedings of the 2012 IEEE Sensors Applications Symposium Proceedings, Brescia, Italy, 9 February 2012. [Google Scholar]
  17. Chung, H.Y.; Chung, Y.L.; Liang, C.Y. Design and implementation of a novel system for correcting posture through the use of a wearable necklace sensor. JMIR Mhealth Uhealth 2019, 7, e12293. [Google Scholar] [CrossRef] [PubMed]
  18. Simpson, L.; Maharaj, M.M.; Mobbs, R.J. The role of wearables in spinal posture analysis: A systematic review. BMC Musculoskelet. Disord. 2019, 20, 55. [Google Scholar] [CrossRef] [PubMed]
  19. Gupta, R.; Gupta, S.H.; Agarwal, A.; Choudhary, P.; Bansal, N.; Sen, S. A wearable multisensor posture detection system. In Proceedings of the 4th International Conference on Intelligent Computing and Control Systems (ICICCS), Madurai, India, 13–15 May 2020. [Google Scholar]
  20. Kim, H.; Park, H.; Oh, J. Implementation of Real-time Sedentary Posture Correction Cushion Using Capacitive Pressure Sensor Based on Conductive Textile. J. Korea Soc. Comput. Inf. 2022, 27, 153–161. [Google Scholar]
  21. Hu, Q.; Tang, X.; Tang, W. A smart chair sitting posture recognition system using flex sensors and FPGA implemented artificial neural network. IEEE Sens. J. 2020, 20, 8007–8016. [Google Scholar] [CrossRef]
  22. Najafi, T.A.; Abramo, A.; Kyamakya, K.; Affanni, A. Development of a Smart Chair Sensors System and Classification of Sitting Postures with Deep Learning Algorithms. Sensors 2022, 22, 5585. [Google Scholar] [CrossRef] [PubMed]
  23. Roh, J.; Park, H.J.; Lee, K.J.; Hyeong, J.; Kim, S.; Lee, B. Sitting posture monitoring system based on a low-cost load cell using machine learning. Sensors 2018, 18, 208. [Google Scholar] [CrossRef] [PubMed]
  24. Lee, J.E.; Kim, J.N.; Kim, Y.B. A neck healthy warning algorithm for identifying text neck posture prevention. J. Korea Inst. Converg. Signal Process. 2022, 23, 115–122. [Google Scholar]
  25. Tokas, P. Machine learning based text neck syndrome detection using Microsoft Kinect sensor. Mater. Today Proc. 2021, 80, 3751–3756. [Google Scholar] [CrossRef]
  26. Lawanont, W.; Inoue, M.; Mongkolnam, P.; Nukoolkit, C. Neck posture monitoring system based on image detection and smartphone sensors using the prolonged usage classification concept. IEEJ Trans. Electr. Electron. Eng. 2018, 13, 1501–1510. [Google Scholar] [CrossRef]
  27. Cao, Z.; Simon, T.; Wei, S.E.; Sheikh, Y. Realtime multi-person 2d pose estimation using part affinity fields. In Proceedings of the IEEE Conference on Computer Vision and Pattern Recognition, Honolulu, HI, USA, 21–26 July 2017. [Google Scholar]
  28. Nakano, N.; Sakura, T.; Ueda, K.; Omura, L.; Kimura, A.; Iino, Y.; Yoshioka, S. Evaluation of 3D markerless motion capture accuracy using OpenPose with multiple video cameras. Front. Sports Act. Living 2020, 2, 50. [Google Scholar] [CrossRef] [PubMed]
  29. Chen, W.; Jiang, Z.; Guo, H.; Ni, X. Fall detection based on key points of human-skeleton using openpose. Symmetry 2020, 12, 744. [Google Scholar] [CrossRef]
Figure 1. The sitting postures in front of the computer: (a) good posture; (b) text neck posture; (c) L-posture.
Applsci 13 10935 g001
Figure 2. Overall flow of the proposed algorithm.
Applsci 13 10935 g002
Figure 3. Three examples of experimental posture for subjects: (a) good posture; (b) text neck posture; (c) L-posture.
Applsci 13 10935 g003
Figure 4. Three angles measured from images of a seated posture: Head-Neck angle ( θ 1 ); Neck-Chest angle ( θ 2 ); Chest-Hip angle ( θ 3 ).
Applsci 13 10935 g004
Figure 5. Experiment environment.
Applsci 13 10935 g005
Figure 6. Boxplot of angle values for each posture (Theta_1: θ 1 , Theta_2: θ 2 , Theta_3: θ 3 , Theta_4: θ 4 ): (a) good posture; (b) text neck posture; (c) L-posture.
Applsci 13 10935 g006
Figure 7. Confusion matrix for three postures.
Applsci 13 10935 g007
Figure 8. Examples of misclassified results: (a) result predicting good posture as text neck posture-1; (b) result predicting good posture as text neck posture-2.
Applsci 13 10935 g008
Figure 9. Sensor measurements behind the ear and at the back of the neck using three-axis accelerometer sensors [6]: (a) good posture; (b) L-posture.
Applsci 13 10935 g009
Figure 10. Measurements using a sensor cushion [20]: (a) good posture; (b) result of good posture; (c) text neck posture; (d) result of text neck posture.
Applsci 13 10935 g010
Table 1. Statistic of mean, minimum, maximum, and standard deviation for each posture.
PostureStatistic θ 1 θ 2 θ 3 θ 4
Good postureMean79.637995.6220100.304386.9680
Min68.198678.690178.690178.9390
Max90.0000111.8014123.690197.2055
Std *6.09455.46838.02313.9771
Text neck postureMean56.126479.441886.149766.7944
Min30.963859.036256.309946.5310
Max68.198699.4623111.801479.1811
Std *8.25357.14359.16176.2142
L-postureMean93.6963118.1552126.6295105.1747
Min68.1986105.9454111.801488.4249
Max111.8014135.0000143.1301119.0199
Std *8.71776.16268.25905.4857
* Standard deviation.
Table 2. Evaluation metric results for each posture.
Good PostureText Neck PostureL-Posture
Precision97.55%94.47%100.00%
Recall93.00%98.09%100.00%
Table 3. Average sensor measurements behind the ear and at the back of the neck using three-axis accelerometer sensors.
EarNeck
X-AxisY-AxisZ-AxisX-AxisY-AxisZ-Axis
Good posture22.83297.50167.64276.89308.16261.78
L-posture24.90289.52169.25242.59142.70291.56
Disclaimer/Publisher’s Note: The statements, opinions and data contained in all publications are solely those of the individual author(s) and contributor(s) and not of MDPI and/or the editor(s). MDPI and/or the editor(s) disclaim responsibility for any injury to people or property resulting from any ideas, methods, instructions or products referred to in the content.

