Abstract
The Double-Disk Straight Groove Lapping (DDSGL) technique, a novel approach to batch processing of bearing rollers, achieves high dimensional consistency by removing material through size comparison between multiple rollers in the processing area. To avoid collision between the rollers, the prevalent practice in DDSGL involves circulating the rollers in fixed linear sequences, an approach that impedes comprehensive size comparison throughout the entire batch of rollers. To counter this, we introduce a Dual-Channel Mixing Scheduling (DCMS) strategy that disrupts the roller sequence without triggering collisions. This strategy promotes extensive size comparison and enhances batch size consistency. To elucidate the operational principles of DCMS, we have developed a computational model grounded in DDSGL, designed simulation test plans under different mixing parameters, and summarized the number of direct comparisons, total comparisons, and differences in roller cycle times to determine the optimal combination of mixing parameters. Finally, structural modifications were made in the DDSGL system for validation studies under different mixing parameters. The test results show that the use of DCHS can reduce processing time by up to 50%, and the batch diameter change of the rollers can converge from 1.15 μm to as low as 0.76 μm. The industrial relevance of this research is significant; these improvements can lead to higher efficiency in the manufacturing process and improved quality of bearing rollers.
1. Introduction
As the weakest component in bearings, cylindrical rollers bear most of the bearing load. Over 30% of bearing failures are caused by fatigue damage to the rolling elements [1]. Traditional methods for large-scale precision processing of cylindrical rollers mainly include centerless grinding [2,3,4,5] and ultra-precision lapping [6,7]. During these processes, the lapping tools are in a constant state of wear, which can affect the size consistency of rollers produced in batches [4,8,9]. In contrast, the double-disk lapping method for bearing balls can achieve a size and consistency precision that is an order of magnitude higher than rollers [10,11,12,13,14,15]. Our research group has proposed a Double-Disk Straight Groove Lapping (DDSGL) method for the rolling surface processing of cylindrical rollers based on the batch lapping method for bearing balls. This processing, which shares a similar layout with the bearing ball processing, includes processing areas and external circulation devices and adopts a multi-cycle lapping processing method. Currently, the cylindrical rollers processed by DDSGL can achieve the highest grade G1 of ISO [16,17].
In recent years, many scholars have been dedicated to improving the size consistency of cylindrical rollers based on double-disk lapping, which is a key technical indicator affecting bearing life and performance. Yao et al. [18,19,20] explored the roller trajectories in a double-disk configuration. Through judicious parameter selection, they improved the accuracy of roller size and shape, ensuring nearly uniform processing across the roller surface. Ren et al. [16,17] utilized an elastic floating mechanism, similar to that used in bearing ball processing, to load cylindrical rollers. This enabled simultaneous processing of multiple rollers in the disk, leading to a significant improvement in size consistency. Deng et al. [21] investigated the self-rotation principle of rollers in DDSGL, facilitating improved roller motion during processing. Liu et al. [22] conducted an in-depth study of the roller forming mechanism in DDSGL, obtaining the stability conditions for the forming process in DDSGL. A review of these studies reveals that current researchers primarily focus on the processing areas in the field of double-disk lapping of cylindrical rollers. There is a lack of research on control strategies related to external circulation devices, which are more often designed as auxiliary mechanisms. However, external circulation devices play a crucial role in DDSGL. The number of rollers processed within the double disk is limited, and a large number of rollers need to be temporarily stored in the external circulation devices. Meanwhile, the size convergence results from the size comparative processing of rollers within the grinder can be spread to the entire batch of rollers through circulation, achieving collective size consistency convergence for the entire batch of rollers.
In the well-established bearing ball lapping process system, a relatively complete external circulation device exists (as shown in Figure 1), which mainly includes a distributor, ball collector, ball flow groove, ball return groove, and vertical ball mixer. Most of these mechanisms serve to ensure the stable entry and exit of bearing balls from the processing area, a function similar to that of the DDSGL external circulation device. However, the vertical ball mixer in the bearing ball circulation device provides a mixing function that the DDSGL circulation system lacks. The primary function of the vertical ball mixer is to stir and forcibly disrupt the order of the bearing balls throughout the entire circulation process, thereby allowing balls located far apart in the cycle to have the opportunity to enter the processing area simultaneously for size comparison processing. If the size consistency convergence of bearing ball processing is compared to the optimization process of the optimization algorithm, the algorithm is easy to fall into the local optimal solution before adding the mixed strategy; that is, the convergence speed of the roller size is slow and the convergence stagnates after reaching a certain accuracy level. The mixed strategy provides a ‘jump-out mechanism’ for the algorithm, which can find a better local optimal solution or even a global optimal solution faster than the current one and obtain a better convergence speed and level of roller size consistency.
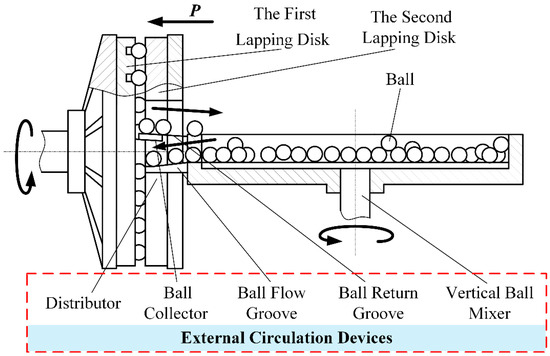
Figure 1.
Bearing ball circulation device.
Bearing balls have an innate advantage in shape, as they are not prone to collision damage during processing and can enter the processing area from any angle in the circulation system. Therefore, setting up a simple stirring ball mixer in the circulation system is feasible. However, cylindrical rollers have edges and corners, and using a stirring method would increase the collision between rollers, causing severe surface collision damage. This is the primary reason why researchers pay less attention to external circulation devices. Therefore, the mixing step is often abandoned in actual production, allowing the rollers to circulate through the processing area in a simple linear arrangement, meaning most rollers in a batch do not have the chance to enter the processing area for size comparison. This practice sacrifices some of the convergence speed and precision level of roller batch diameter change. This paper takes a different approach, aiming to propose a controlled mixing strategy for the external circulation devices of cylindrical rollers in DDSGL from a unique perspective. This strategy, while avoiding roller collision damage, implements controlled mixing of cylindrical rollers by making simple mechanical modifications to the already established DDSGL system. On this basis, we establish a controlled mixing strategy model and investigate the effects of the proposed mixing strategy on the convergence results of cylindrical roller batch diameter variation through model simulation and lapping tests.
2. Basic Principles
2.1. Processing Principle of DDSGL
The processing areas and external circulation systems of DDSGL are shown in Figure 2. The circulation system mainly includes demagnetization mechanisms, cleaning and drying mechanisms, material sorting mechanism, and feeding mechanisms, etc. The double-disk structure includes an upper disk supported by a spring-elastic support, with its processing surface featuring a spiral groove; and a lower disk with rigid support, with its processing surface featuring evenly distributed radial straight-line grooves. The cylindrical roller is located at the intersection of the upper disk’s spiral groove and the lower disk’s straight groove. The motion of the upper and lower disks is as follows: the lower disk rotates around the main shaft, and the upper disk can move up and down. As the upper disk uses elastic support, it provides floating loading to the roller.
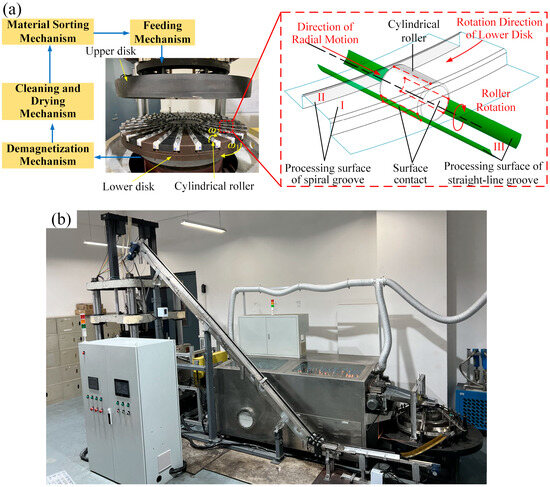
Figure 2.
DDSGL method, (a) Processing principle, (b) Equipment picture.
The state of the cylindrical roller at the intersection of the spiral groove and the straight groove is shown in Figure 2a. The processing surface I of the upper disk’s spiral groove contacts the cylindrical surface of the roller, and processing surface II contacts the end surface of the roller. The processing surface III of the lower disk’s straight groove contacts the cylindrical surface of the roller. The forming movement of the roller mainly includes the following aspects:
- (1)
- When the lower disk rotates, the double disks generate a driving torque on the roller through the joint action of processing surfaces I and III, causing the roller to rotate around itself. To ensure stable self-rotation of the roller in the processing area, the upper disk is designed as an electromagnetic disk. Electromagnetic force is added between the roller and processing surface I, thereby increasing the frictional driving torque of processing surface I on the roller.
- (2)
- The roller’s radial movement is realized by pushing the end surface of the roller through processing surface II of the upper disk’s spiral groove. This causes the roller to move radially from the center of the lower disk to outside the processing area, cooperating with the external circulation system to achieve a closed loop for the entire circulation process.
The operation mode of the roller in the DDSGL system is shown in Figure 3. The lapping system includes a lapping processing area and an external circulation system. During the processing, the position of the roller is in the space formed at the intersection of the spiral groove and the straight groove (as shown in Figure 2), and these spaces in the processing area are defined as processing space A. Although the external circulation system includes multiple functional mechanisms and the operating characteristics of the roller inside the circulation system are single-line and serially arranged, the circulation system can be characterized as a series of external spaces B. Taking the example of a single-batch processing 500 rollers, the circulation movement path of the single roller in the system is: A1—A8—B1—B492—A1.
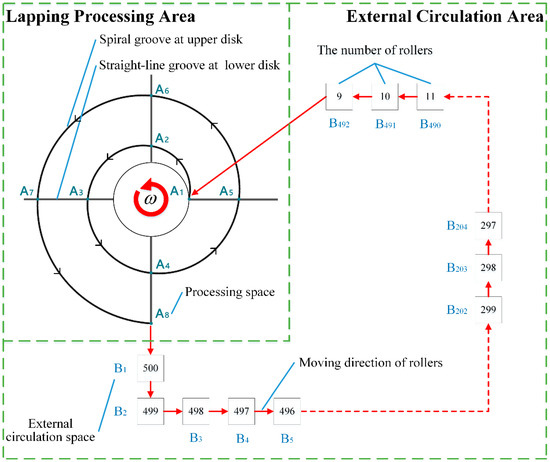
Figure 3.
Operation mode of cylindrical roller in DDSGL system.
2.2. Principle of Controlled Mixing Strategy
In order to achieve the effect of roller mixing while avoiding as much collision damage as possible, this paper proposes a Dual-Channel Mixing Scheduling Strategy (DCMS) in combination with the existing DDSGL circulation system. The schematic diagram of the DCMS principle is shown in Figure 4a,b. The original external circulation system had single-line operation for rollers in the cleaning and drying mechanisms. This is changed to a dual-channel operation mode with two conveyor belts. The rollers are distributed proportionally on two equal-length conveyor belts. The two conveyor belts transport the rollers at different speeds and merge the rollers on the two belts into single-line operation at the outlet of the conveyor belts.
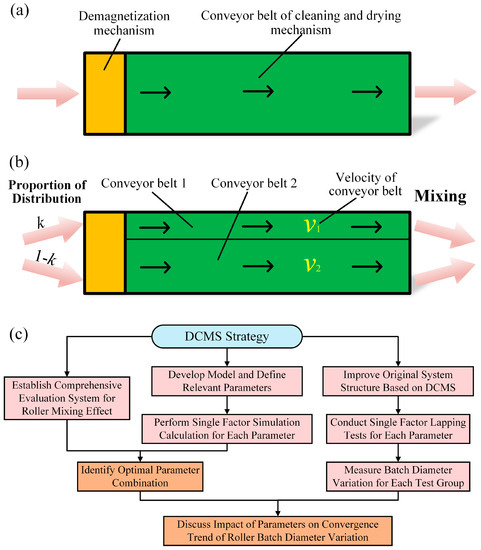
Figure 4.
Dual-channel mixing scheduling strategy diagram, (a) Single-line operation mode before improvement, (b) Dual-channel operation mode after improvement, (c) The flowchart of the study on DCMS.
The flowchart of the study on DCMS is shown in Figure 4c. Firstly, the DCMS model is established and relevant parameters are defined, followed by a single-factor simulation calculation of the parameters in the model. Subsequently, a comprehensive evaluation system for roller mixing is established, with statistical analysis of the simulation calculation results and determination of the optimal combination of parameters. Finally, the structure of the DDSGL system is improved based on DCMS, and a single-factor lapping test of parameters is conducted in the improved system. During the experiment, the batch diameter variation of the roller is measured, and discussions are made in combination with the optimal combination of simulation calculation parameters. The main purposes of the grinding test include: (1) verifying whether DCMS can improve the convergence efficiency and precision of the batch diameter variation of rollers in the DDSGL process; and (2) verifying whether the DDSGL experimental group corresponding to the optimal combination of parameters determined by the established DCMS model and the comprehensive evaluation system of roller mixing is the best performing group in terms of the convergence trend of the batch diameter variation of rollers.
3. DCMS Model
3.1. Establishment of the DCMS Model
The real intention of proposing DCMS in the circulation system is to disrupt the inherent order of the rollers without collision, to allow rollers that are far apart to enter the processing area for lapping at the same time, and to achieve size comparison. This facilitates a full-size comparison between the entire batch of rollers, thereby achieving rapid convergence of the batch diameter variation. However, in the actual application of DCMS, it is necessary to consider the impact of roller distribution probability (k) and conveyor belt speed (v1, v2) on the convergence speed of batch diameter variation.
The existing DDSGL physical system can be improved to carry out the experimental study of DCMS. However, a single experiment can only simply determine the relationship between the controlled mixing parameters and the convergence speed of the roller size accuracy. It cannot explore how DCMS promotes full comparison between rollers and consequently improves roller size consistency. Therefore, this study aims to establish a high-fidelity DCMS model based on the DDSGL system, select the optimal DCMS parameters through the evaluation system established by the calculation results of the DCMS model, and verify the accuracy of the optimal results in the actual processing process through lapping experiments, ultimately achieving the purpose of the DCMS model guiding the DDSGL system to achieve high-precision and efficient production.
The operation mode of the roller after adding DCMS is shown in Figure 5. The yellow area represents the area where DCMS is embedded. The leap probability k and the leap space Sn are two important input parameters of the DCMS model. The operating rule is to select a space node (space B3) in the external circulation space. When the roller passes through this space node, there are two possible paths in the next processing step, which are the possibility of leaping Sn spaces with a probability of k and the possibility of moving forward into the next space with a probability of 1-k. In physical space (Figure 4), the DCMS parameters controlled by the system are the dwell time of the swing channel outlet at the entrances of the two conveyor belts and the speeds of the two conveyor belts. The relationship between these parameters and the leap probability k and the number of leap spaces Sn in the model is:
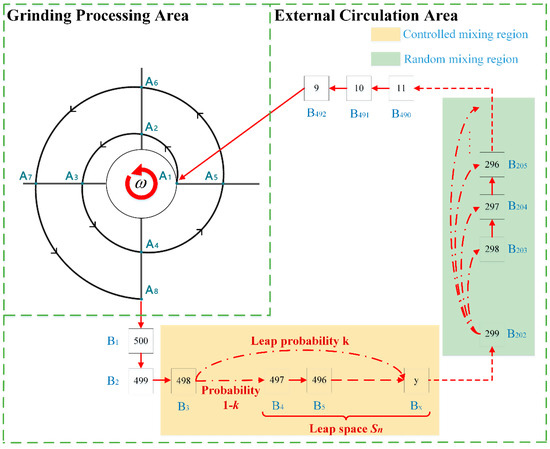
Figure 5.
DDSGL roller operation mode after adding DCMS.
In the formula, t1 represents the dwell time of the swing channel outlet at conveyor belt 1, t2 represents the dwell time of the swing channel outlet at conveyor belt 2, L represents the length of conveyor belts 1 and 2, and Q represents the roller flow rate of the swing channel. v1 and v2 represent the running speeds of conveyor belts 1 and 2.
Due to the inclusion of DCMS, some interfaces between mechanisms will experience local random swaps of rollers. This phenomenon changes the order of rollers within a small range, and these areas are defined as small-scale random mixing. To represent this phenomenon in the model, we can adopt the mapping rules in the green area in Figure 5. One external space node is selected in the circulation system of the model (such as the external space B202 in Figure 5). After the roller passes through this external space, it will randomly leap forward a certain number of spaces with a random probability.
The operational principle of the DCMS model is as follows: Prior to operation, each roller is assigned a number, and the entire batch of rollers is distributed in the processing space A of the processing area and the external space B of the external circulation system. There is only one roller in each space. After the processing starts, the rollers in each space move in a single-line series to the next space in the direction of the arrow. The process of a roller entering the next space from one space is defined as a processing step. Here, n represents the total number of batch-processed rollers, and running n processing steps is defined as a processing cycle. In each processing step, when the rollers move to the DCMS area and the small-scale random mixing area, the positions of rollers with different numbers need to be adjusted according to the corresponding rules.
3.2. DCMS Evaluation System
In the established DCMS model, the movement of the entire batch of rollers within the DDSGL system in actual processing scenarios can be simulated. It is necessary to extract related data during the operation of the model, establish a DCMS evaluation system, and explore whether DCMS can enable the entire batch of rollers to fully compare sizes in the processing area.
In the DCMS model, the positions and numbers of all rollers in the processing area at each processing step can be recorded. The number of times Cd that two rollers with different numbers directly participate in processing in the processing area can be counted. The data counting method is shown in Figure 6. A n × n table is established based on the processing batch of rollers as n. Both the title row and title column are roller numbers, and each position in the table matrix is used to record the number of direct comparisons when rollers with the row and column title numbers participate in processing together. In each processing step, each pair of rollers in all processing spaces A are directly compared once, and the number at the position corresponding to the two roller numbers in the statistics table is increased by 1. For example, in processing step 1 in Figure 6, rollers numbered 1–8 all participate in comparison processing once, so the number in the yellow area of the statistics table for processing step 1 is increased by 1. In processing step 2, according to the roller operation rule shown in Figure 5, roller number 1 moves out of the processing area, and roller number 9 moves into the processing area, so the data record in the new yellow area in the statistics table is increased by 1, and so on. It should be noted that, before the inclusion of DCMS, the rollers entered the processing area in sequence according to the order of the numbers in the model. After DCMS is included, the order of roller numbers will be disrupted, as shown in processing step 3 in Figure 6. When roller number 11 enters the processing area, the yellow area where data is updated in the statistics table will also be split according to the roller number.
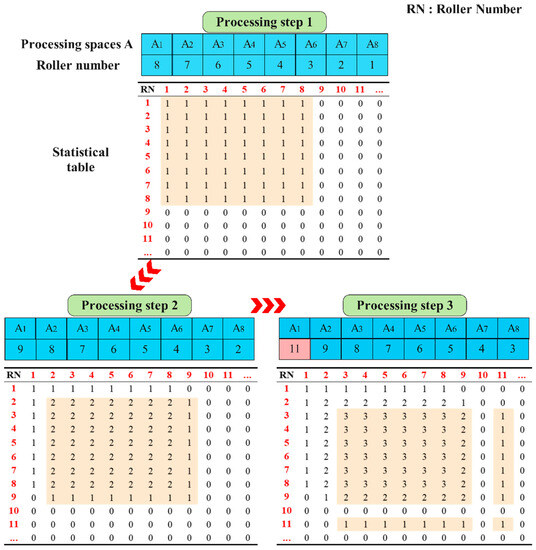
Figure 6.
Data statistics of direct comparison times of rollers in processing area (taking the first three steps as an example).
In the DDSGL experiments without the inclusion of the DCMS, a large number of rollers did not undergo direct size comparison in the processing region. Nevertheless, the batch diameter change of the rollers was still convergent, indicating that two rollers that have not directly participated in processing can achieve indirect size comparison through other rollers, thereby achieving the effect of size convergence for the entire batch of rollers. Therefore, the introduction of the indirect comparison factor, based on direct comparison, will be closer to the actual processing process.
Direct and indirect comparisons between rollers are akin to close and secondary contacts in epidemiological research. For example, Roller 1 and Roller 2 directly compare sizes as they both participate in processing, and Roller 2 and Roller 3 ensure the same. In this case, Roller 1 and Roller 3 are defined as being indirectly compared, with Roller 2 serving as the mediator for this indirect comparison between Rollers 1 and 3. It should be noted that this chapter only accounts for one level of indirect comparison (secondary close contact level), and multiple levels of indirect comparison are not considered.
To facilitate data collection, appropriate calculation rules need to be established between direct and indirect comparisons. For example, an indirect comparison between Roller 1 and Roller 3 mediated by Roller 2 could be equivalent to a certain number of direct comparisons between Roller 1 and Roller 3. According to the processing principle of DDSGL, the final diameter size of Roller 2 is the result of its initial diameter size and the diameter sizes of other rollers. One could calculate the proportion of the number of direct comparisons between Roller 1 and Roller 2 (C12) to the total number of direct comparisons between Roller 2 and all rollers (C2). This ratio is regarded as the participation weight of Roller 1 in the diameter change of Roller 2. Multiply this participation weight by the number of direct comparisons between Roller 2 and Roller 3 (C23) to obtain the equivalent number of direct comparisons. Therefore, the formula for calculating the equivalent number of direct comparisons for the indirect comparison between Roller 1 and Roller 3 mediated by Roller 2 () can be expressed as:
Rollers 1 and 3 can achieve indirect comparison through any roller in the batch serving as a mediator. Therefore, according to Formula (3), the total equivalent number of direct comparisons for the indirect comparison between Rollers 1 and 3 () can be calculated as follows:
where represents the total equivalent number of direct comparisons for the indirect comparison between Rollers 1 and 3, is the equivalent number of direct comparisons for the indirect comparison between Rollers 1 and 3 mediated by Roller i, and n is the total number of rollers in the batch.
The total number of comparisons for the Rollers 1 and 3 pairs is the sum of the number of direct comparisons and the total equivalent number of direct comparisons. The expression for the total number of comparisons is:
where represents the total number of comparisons between Rollers 1 and 3, and C13 is the number of direct comparisons between Rollers 1 and 3.
In this way, the total number of comparisons for each roller pair in the statistical table can be calculated. This allows us to examine whether the entire batch of rollers undergoes uniform comparison processing throughout the entire cycle lapping process. Because the simulation calculation of the model generates the number of direct comparisons between the rollers and the amount of data is large (n × n), according to Formulas (3)–(5), a VBA program is designed to process the table data and calculate the total number of comparisons for each roller pair in the table.
3.3. DCMS Model Simulation Calculation Plan
In the DDSGL tests, the total number of cylindrical roller batch processes is 500, with 150 rollers being processed simultaneously in the processing area, and the cycle period is 90 cycles. The simulation calculation of the DCMS model should set input parameters based on the actual DDSGL processing; the specific input parameters are shown in Table 1. The small-range random mixing interval value is determined by DDSGL tests.

Table 1.
Input parameters of the DCMS model.
Based on the DCMS design, a single-factor test of the leap probability k and the leap space Sn was conducted. The experimental scheme is shown in Table 2. Due to the use of a dual-channel mixing format, when the sum of two sets of different leap probability values k equals 1, the effect of the two sets of k values on the experiment is the same. That is, the leap probability values k = 0.1 and k = 0.9 are equivalent in the experimental process, so the experimental scheme is designed with five levels of 0, 0.1, 0.2, 0.3, and 0.4. The increase in the leap space number Sn can better disrupt the inherent order of the rollers, but a larger value is not necessarily better. Too large a leap space number Sn can lead to differences in the number of times some rollers enter the processing area, making the processing time for the entire batch of rollers uneven and affecting the batch diameter change of the rollers. Therefore, the leap space Sn in the experimental scheme is designed with five levels: 0, 10, 20, 30, and 40.
Table 2.
Controlled mixing strategy single-factor experiment.
3.4. DCMS Model Simulation Calculation Results and Discussion
3.4.1. Direct Comparison Results Statistics
In the model, the number of direct comparisons for unmixed and mixed groups 1–7 was calculated and counted. Figure 7 and Figure 8 show the number of roller groups that did not participate in the processing together throughout the entire calculation process. The coordinates of the black points in the figures represent these two numbered rollers that have never appeared in the processing area together and thus have not undergone a direct size comparison. The white points in the white area represent roller groups that have undergone direct size comparison. Each simulation has 250,000 roller groups (500 × 500). Figure 7 is a statistical graph of the number of roller groups that did not participate in the processing together under different leap probability k conditions (Sn = 30). Figure 8 is a statistical graph of the number of roller groups that did not participate in the processing together under different leap space Sn conditions (k = 0.3).
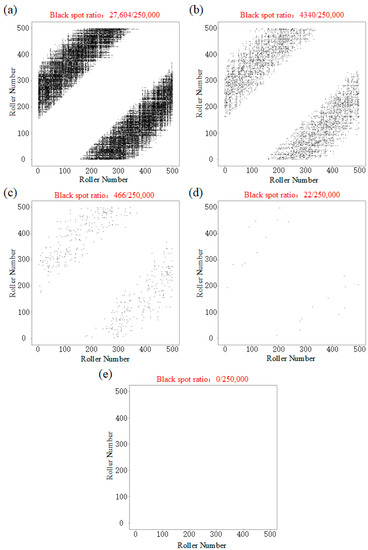
Figure 7.
Statistics of number of roller groups that did not participate in processing together under different leap probability k conditions (leap space Sn = 30), (a) k = 0, (b) k = 0.1, (c) k = 0.2, (d) k = 0.3, (e) k = 0.4.
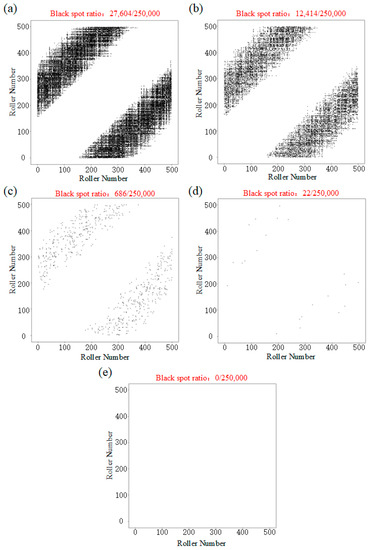
Figure 8.
Statistics of number of roller groups that did not participate in processing together under different leap space Sn conditions (leap probability k = 0.3), (a) Sn = 0, (b) Sn = 10, (c) Sn = 20, (d) Sn = 30, (e) Sn = 40.
Due to the presence of small-scale random mixing in the cycle system, there are some white areas distributed in the black area in Figure 7a and Figure 8a. From the position and quantity of the black points in Figure 7a and Figure 8a, it can be seen that relying solely on small-scale random mixing cannot achieve sufficient comparison between rollers. The roller numbers of the abscissa and ordinate of the black points will have a larger difference, indicating that the two rollers in these roller groups are far apart at the beginning of processing. Subsequent, large-scale roller-sequence scrambling can effectively reduce the area of the black region.
As the leap probability k and the leap space Sn continue to increase, the number of roller groups that have not directly participated in the processing together significantly decreases, and eventually all the roller groups in the batch can undergo direct size comparison.
3.4.2. Total Comparison Times Results Statistics
According to the evaluation system established in Section 3.2, the total comparison times of the roller groups for the unmixed group and mix groups 1–7 are calculated (two decimal places were retained). The statistical results for the total comparison times of each group are shown in Table 3.
Table 3.
Partial results of total comparison times for unmixed group.
Based on the total comparison time data, the distribution of total comparison times for each group is computed. All total comparison times in the table are extracted and normalized, and the distribution of the number of roller groups in different total encounter time intervals is counted. Figure 9 depicts the distribution of total comparison times for each roller group under different leap probability k conditions. Figure 10 illustrates the distribution of total comparison times for each roller group under different leap space Sn conditions. The horizontal axis represents the total comparison times between the rollers after normalization, and the vertical axis represents the number of roller groups within that total comparison time interval.
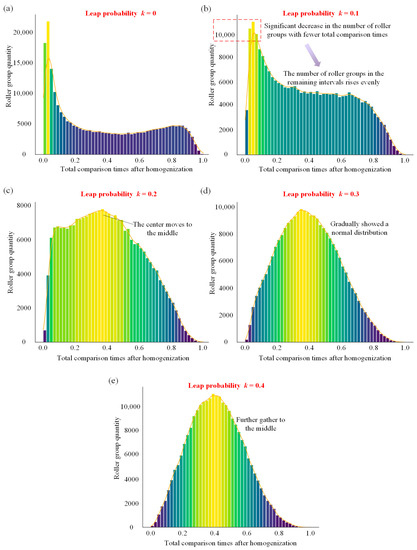
Figure 9.
Distribution of total comparison times of roller groups under different leap probability k conditions (leap space Sn = 30), (a) k = 0, (b) k = 0.1, (c) k = 0.2, (d) k = 0.3, (e) k = 0.4.
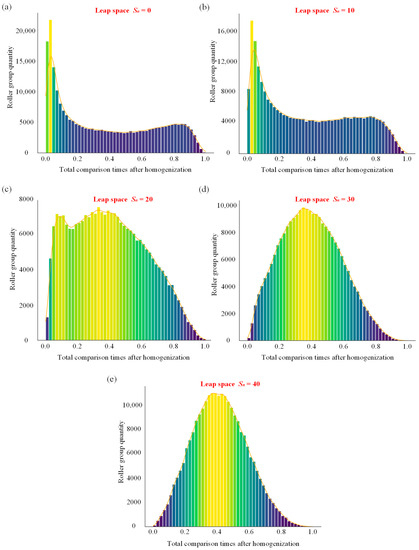
Figure 10.
Distribution of total comparison times of roller groups under different leap space Sn conditions (leap probability k = 0.3), (a) Sn = 0, (b) Sn = 10, (c) Sn = 20, (d) Sn = 30, (e) Sn = 40.
Based on Figure 9a and Figure 10a, we can identify two main issues with DDSGL that have not been implemented DCMS: (1) A large number of roller groups are distributed in intervals with fewer total comparison times, indicating insufficient size comparisons among some rollers in the entire batch; (2) There is a certain number of total comparison times in each interval from 0.2 to 1, suggesting significant differences in the total comparison times among different roller groups, leading to uneven size comparisons.
The first stage (from (a) to (b) in Figure 9 and Figure 10): The main change is a sharp drop in the number of roller groups in the smaller total comparison times interval (0–0.1) (from the level of 20,000 groups to 10,000 groups), with a uniform increase in the number of roller groups in other intervals. This phase indicates that using the controlled mixing strategy allows for more thorough size comparisons among the entire batch of rollers. However, due to the smaller leap probability k or leap space Sn, the distribution of total comparison times remains scattered, and the number of size comparisons among the entire batch of rollers is still uneven.
The second stage (from (b) to (c) in Figure 9 and Figure 10): The distribution of the number of roller groups is no longer concentrated in the smaller total comparison time interval (0–0.1) and begins to converge towards the middle interval (0.4).
The third stage (from (c) to (d,e) in Figure 9 and Figure 10): The roller group with a total number of comparisons of 0 basically disappeared. The number of roller groups in the total comparison time interval of 0–0.2 and 0.8–1.0 decreases, while those in the interval of 0.2–0.6 increase, overall showing a normal distribution. Under these controlled mixing conditions, the total comparison times for most roller groups are similar (0.2–0.6). In this stage, the proposed controlled mixing strategy has significantly improved the insufficiency and unevenness of the size comparisons among the entire batch of rollers.
3.4.3. Roller Cycle Time Range Statistics
As can be inferred from Figure 9 and Figure 10d,e, with a further increase in the leap probability k or leap space Sn, a more intense shuffling of the roller sequence order results in a higher peak in the distribution, achieving better size comparison results among rollers. This raises the question of whether a higher intensity of shuffling the roller sequence order is always better and what the impact of a larger leap probability k or leap space Sn is on the entire lapping process.
The lapping experiment consists of a total of 90 cycles. This is the mean number of cycle processing times for the entire batch of rollers, but the processing cycle times for individual rollers will vary, resulting in a range value between the rollers with the most and least cycle times in the entire batch. For rollers in the batch with fewer processing cycle times, the amount of material removed is relatively less, resulting in a larger overall size compared to rollers with more processing cycle times. In the DDSGL lapping experiment, the average diameter removal of the roller in each lapping cycle is about 0.08 μm. Therefore, an increase of 1 in the range will result in an estimated batch diameter variation error of 0–0.08 μm. Thus, the size of the range of roller cycle processing times will affect the precision level of the batch diameter variation.
Calculating the range of roller cycle times for each group of experiments in Table 2, the range of cycle times for the entire batch of 500 rollers under different controlled mixing parameter conditions is shown in Figure 11. It should be noted that the entire processing area has 150 processing spaces. A roller is considered to have completed one full cycle when it has undergone 150 processing steps in the processing area. If the number of steps completed is less than 150, two decimal places are retained, so the cycle time range can appear in decimal form.
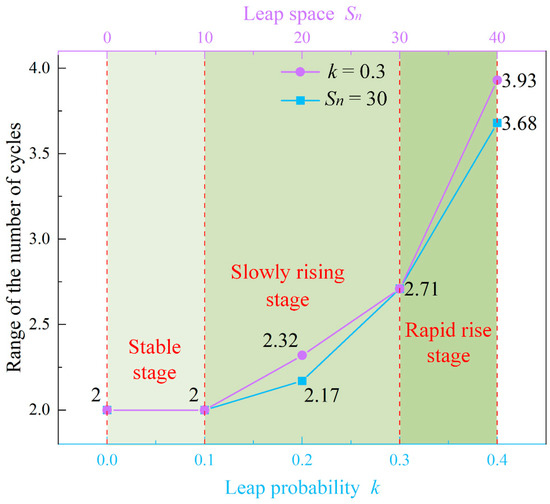
Figure 11.
Extreme difference in cycle times of entire batch of rollers under different controlled mixing parameter conditions.
When the leap probability k or leap space Sn is 0, the system has not implemented the controlled mixing strategy, and the rollers rely solely on local random mixing to change their sequence order. At this point, the minimum cycle times are 89, the maximum cycle times are 91, and the batch range of cycle times for all the rollers is 2. When the leap probability k = 0.1 or leap space Sn = 10, the intensity of disrupting the order of rollers is still small, and the batch range of cycle times for the entire batch of rollers remains at 2.
When 0.1 < k < 0.3 or 10 < Sn < 30, the intensity of shuffling the roller sequence order gradually increases, and the batch range of cycle times for all the rollers begins to slowly rise from 2 to 2.71 times. This may increase the batch diameter variation error by up to 0–0.057 μm. As the leap probability k or leap space Sn continues to increase, the rate of increase in the batch range of cycle times for all the rollers becomes larger, which will cause a greater error effect on the batch diameter variation.
In summary, a larger leap probability k and leap space Sn will increase the intensity of mixing the roller sequence order, making the total comparison time distribution of roller groups more concentrated and the size comparisons among the rollers more thorough and uniform. However, a larger leap probability k and leap space Sn will also cause a rapid increase in the cycle time range, which brings about a greater impact on the batch diameter variation error. Therefore, the leap probability k and leap space Sn need to be considered in combination with the cycle time range, and it is not the case that higher is always better. Under the current conditions, when the leap probability k = 0.3 and the leap space Sn = 30, the total comparison time distribution is normal, and the cycle time range has only increased by 0.71 times compared to the unmixed group, which is a better parameter combination.
4. DDSGL Experiment Based on DCMS
4.1. DDSGL Experiment Scheme Based on DCMS
The purpose of this paper is to improve the precision and convergence speed of roller size consistency in DDSGL through the proposed DCMS. The leap probability k and leap space Sn for achieving adequate roller size comparison have been confirmed through the DCMS model. Subsequent tasks involve improving the DDSGL system and conducting relevant lapping verification experiments.
To implement DCMS in DDSGL, it is necessary to make corresponding structural changes to the existing system, including the roller distribution mechanism and the double-channel conveyor belt. As shown in Figure 12b, rollers exit from the main lapping machine outlet and enter the roller distribution mechanism through a spring hose. The roller distribution mechanism mainly includes: a servo motor, a traction rope, a swing head, and a slide rail. The servo motor pulls the traction rope, which in turn moves the swing head along the slide rail. One end of the spring hose is installed at the position of the swing head. The movement of the servo motor is controlled to regulate the distribution ratio of rollers between the two channels. The structure of the dual-channel is shown in Figure 12c. The conveyor belt of the cleaning and drying mechanism is changed to two independent motor-driven conveyor belts. Rollers on both conveyor belts pass through the cleaning and drying mechanisms at a set speed, and finally, rollers on both conveyor belts enter the material handling mechanisms at the exit of the cleaning and drying mechanism, merging back into a single line. This operating mode forcibly disrupts the inherent sequence of rollers, achieving roller mixing while avoiding collisions as much as possible.
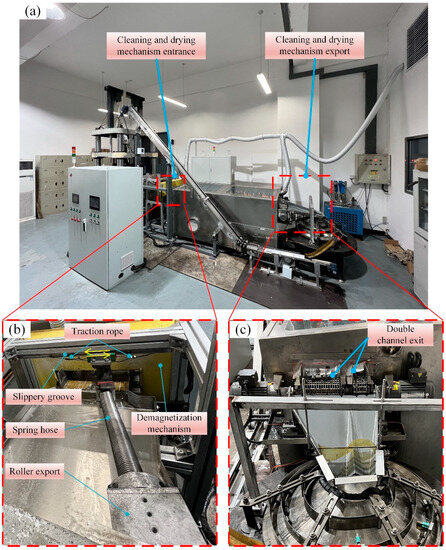
Figure 12.
Structural modifications based on DCMS, (a) DDSGL system, (b) Distribution mechanism, (c) Dual-channel outlet.
Lapping experiments were conducted on the unmixed group and mix groups 1–7 in Table 2. The speed of the two conveyor belts and the motion mode of the distribution mechanism in each group experiment were determined based on the leap probability k, leap space Sn, and Formulas (1) and (2). All other test parameters were kept consistent with Table 1. During processing, the lower lapping disc speed was 4 r/min. Each 500 steps (the total batch quantity) was considered a lapping cycle, lasting approximately 4 min. The total processing time of the lapping experiment was 6 h, with 90 cycles of processing. Every 15 cycles, 10 rollers were randomly collected to test the change in roller diameter over time.
The batch diameter variation of the rollers was calculated according to the ISO 12297-2021 standard [23]. It represents the difference between the maximum diameter in a single plane of the roller having the largest such diameter and that of the roller having the smallest such diameter in a roller diameter gauge lot. The diameter of the cylindrical rollers was measured using the TRIMOS™ Lab Concept 300 length measuring instrument. A cylindrical roller-specific measurement fixture was designed based on the length measuring instrument and roller shape. Ten rollers were collected every fifteen cycles, and the cylindrical rollers were cleaned with an ultrasonic cleaner before the rollers were measured. The roller surface was then wiped clean and dried to prevent rust. During the measurement, the temperature in the test room was kept constant. The rollers were placed in the test room and left to stand for an hour to minimize diameter measurement errors caused by thermal expansion and contraction due to temperature differences. In the measurement process, the diameter is measured at the three sections of each roller, and the maximum diameter of the three sections of each roller is recorded as the diameter of the roller. Finally, the range of 10 roller diameters is calculated as the batch diameter variation collected this time.
4.2. Experiment Results and Discussion
The experimental results are shown in Figure 13. Comparing the uncombined group, mix group 1, and mix group 5 in Figure 13, it is clear that when the leap probability k and leap space Sn are small, the effect of DCMS on improving the convergence speed and precision level of roller size in DDSGL is not significant.
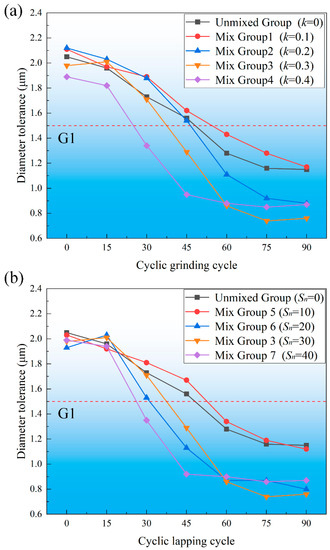
Figure 13.
Evolution process of batch diameter variation of rollers, (a) Leap interval Sn = 30, (b) Leap probability k = 0.3.
As the leap probability k and leap space Sn continue to increase, the convergence speed of the batch diameter variation of the rollers significantly accelerates. Specifically, mix groups 4 and 7 with the fastest convergence speed reach G1 precision about 30 lapping cycles earlier than the unmixed group. The processing time can be shortened by about 50%. Simultaneously, due to more thorough and even comparison among rollers, the precision level of the batch diameter variation of the rollers at this stage is also improved. The batch diameter variation of the roller was increased from 1.15 μm in the unmixed group to about 0.8 μm in the mix group.
Upon examining the experimental results, it can be observed that the mix groups 4 (0.87 μm) and 8 (0.86 μm), which have the fastest convergence speed, do not exhibit the optimum final precision level for batch diameter variation. The smallest batch diameter variation among the eight experimental groups is achieved by mix group 3, at 0.76 μm. This finding validates the discussion in Section 3 about the impact of the range of roller cycle counts on the batch diameter variation of rollers. Specifically, when the leap probability k = 0.3 and the leap space Sn = 30, the batch of rollers can converge to better size consistency and precision at a relatively faster speed.
In summary, when the leap probability k and leap space Sn reach certain values, CHMS contributes to a faster size convergence speed and a higher precision level of batch diameter variation in the process. In actual production, adjustments can be made according to the production goals. If the aim is to achieve production efficiency at G1 precision, it would be appropriate to increase the leap probability k and leap space Sn. If a higher precision level of batch diameter variation is sought, the leap probability k and leap space Sn should be selected within a range where the extreme difference in roller cycle counts does not significantly increase.
5. Conclusions
In conclusion, this paper presents a novel controlled mixing strategy, the Dual-Channel Mixing Scheduling (DCMS) Strategy, for the external circulation devices of cylindrical rollers in the Double-Disk Straight Groove Lapping (DDSGL) process. This strategy successfully achieves roller mixing while minimizing collision damage, enabling full size comparison among the entire batch of rollers, and achieving rapid convergence of the batch diameter variation.
The model simulation results indicate that a higher leap probability and leap space lead to a more thorough and uniform size comparison among rollers. However, an excessive increase in these parameters can cause a rapid rise in the range of cycle times, which may negatively impact the batch diameter variation. Therefore, based on the simulation results, it is recommended to maintain moderate values for both jump probability and jump space.
Experimental results corroborate the simulation findings, confirming that the DDSGL method combined with the controlled mixing strategy can significantly enhance the efficiency and precision of roller production. A larger leap probability and leap space accelerate the convergence speed of roller size consistency. However, the parameter values suggested by the model simulation allow convergence to the best accuracy at a relatively fast speed. The industrial relevance of this research is significant, as it can reduce processing time by up to 50%, and the batch diameter change of the rollers can converge from 1.15 μm to as low as 0.76 μm. These improvements can lead to higher efficiency in the manufacturing process and improved quality of bearing rollers.
Future research could further fine-tune the parameters of the DCMS to optimize the DDSGL process for different production scenarios. The proposed approach provides a fresh perspective and solution for improving the size consistency of cylindrical rollers in batch roller production. This has potential implications for the bearing industry and other related fields.
Author Contributions
Conceptualization, W.L. and C.R.; methodology, W.L.; validation, W.L. and C.R.; formal analysis, W.L.; writing—original draft preparation, W.L.; writing—review and editing, W.L.; funding acquisition, C.R. All authors have read and agreed to the published version of the manuscript.
Funding
This work was funded by the National Natural Science Foundation of China under Grant No. 51935008. The authors would like to acknowledge the support from the foundation of Xinchang Research Institute of Zhejiang University of Technology (Grant number: 2021GKF-0316).
Institutional Review Board Statement
Not applicable.
Informed Consent Statement
Not applicable.
Data Availability Statement
Not applicable.
Conflicts of Interest
The authors declare no conflict of interest.
References
- Wang, L.; Snidle, R.W.; Gu, L. Rolling contact silicon nitride bearing technology: A review of recent research. Wear 2000, 246, 159–173. [Google Scholar] [CrossRef]
- Dall, A.H. Rounding Effect in Centerless Grinding. Mech. Eng. 2021, 4, 325–329. [Google Scholar]
- Rowe, W.B. Rounding and stability in centreless grinding. Int. J. Mach. Tools Manuf. 2014, 82–83, 1–10. [Google Scholar] [CrossRef]
- Hashimoto, F.; Gallego, I.; Oliveira, J.F.G.; Barrenetxea, D.; Takahashi, M.; Sakakibara, K.; Stålfelt, H.-O.; Staadt, G.; Ogawa, K. Advances in centerless grinding technology. CIRP Ann. 2012, 61, 747–770. [Google Scholar] [CrossRef]
- Gurney, J.P. An Analysis of Centerless Grinding. J. Eng. Ind. 1964, 86, 163–174. [Google Scholar] [CrossRef]
- Zakharov, O.V. Principles for the adjustment of centerless superfinishing machines. Russ. Eng. Res. 2011, 31, 465–468. [Google Scholar] [CrossRef]
- Zakharov, O.V.; Datskovskaya, E.A. Setup of centerless superfinishing machine tools. Russ. Eng. Res. 2010, 30, 1263–1267. [Google Scholar] [CrossRef]
- Daito, M.; Hasebe, T.; Kanai, A.; Miyasita, M. Study on the Development of Centerless Profile Grinding Machine for Chatter Free Crinding. Trans. Jpn. Soc. Mech. Eng. Ser. C 2003, 69, 1131–1138. [Google Scholar] [CrossRef]
- Hashimoto, F.; Kanai, A. High Precision Trueing Method of Regulating Wheel and Effect on Grinding Accuracy. CIRP Ann. 1983, 32, 237–239. [Google Scholar] [CrossRef]
- Itoigawa, F.; Nakamura, T.; Funabashi, K. Steel Ball Lapping by Lap with V-shape Groove. Trans. Jpn. Soc. Mech. Eng. 1993, 59, 1906–1912. [Google Scholar] [CrossRef]
- Zhang, B.; Nakajima, A. Spherical surface generation mechanism in the grinding of balls for ultraprecision ball bearings. Proc. Inst. Mech. Eng. Part J J. Eng. Tribol. 2000, 214, 351–357. [Google Scholar] [CrossRef]
- Kang, J.; Hadfield, M. The polishing process of advanced ceramic balls using a novel eccentric lapping machine. Proc. Inst. Mech. Eng. Part B J. Eng. Manuf. 2005, 219, 493–503. [Google Scholar] [CrossRef]
- Lee, R.-T.; Hwang, Y.-C.; Chiou, Y.-C. Lapping of ultra-precision ball surfaces. Part II. Eccentric V-groove lapping system. Int. J. Mach. Tools Manuf. 2006, 46, 1157–1169. [Google Scholar] [CrossRef]
- Liu, X.Y.; Guo, B.; Peng, H.; Tao, Z.; Chengzu, U. Eccentric circular groove lapping technique for ceramic balls. China Mech. Eng. 1996, 9, 1. [Google Scholar]
- Yuan, J.L.; Chen, L.N.; Zhao, P.; Chang, M.; Xing, T.; Lv, B.H. Study on Sphere Shaping Mechanism of Ceramic Ball for Lapping Process. Key Eng. Mater. 2003, 259, 195–200. [Google Scholar] [CrossRef]
- Chengzu, R.E.N.; Xiaofan, D.; Yinglun, H.E.; Chen, G.; Xinmin, J.I.N. Cylindrical-Component Grinding Device, and Workpiece Advancing Apparatus and Grinding Method Thereof. U.S. Patent 9,855,635, 2 January 2018. [Google Scholar]
- Chengzu, R.E.N.; Xiaofan, D.; Yinglun, H.E.; Chen, G.; Xinmin, J.I.N. Double-Disc Straight Groove Cylindrical-Component Surface Grinding Disc. U.S. Patent 9,839,987, 12 December 2017. [Google Scholar]
- Yao, W.; Yuan, J.; Zhou, F.; Chen, Z.; Zhao, T.; Zhong, M. Trajectory analysis and experiments of both-sides cylindrical lapping in eccentric rotation. Int. J. Adv. Manuf. Technol. 2017, 88, 2849–2859. [Google Scholar] [CrossRef]
- Jiang, L.; Yao, W.; He, Y.; Cheng, Z.; Yuan, J.; Luo, J. An experimental investigation of double-side processing of cylindrical rollers using chemical mechanical polishing technique. Int. J. Adv. Manuf. Technol. 2015, 82, 523–534. [Google Scholar] [CrossRef]
- Yuan, J.; Yao, W.; Zhao, P.; Lyu, B.; Chen, Z.; Zhong, M. Kinematics and trajectory of both-sides cylindrical lapping process in planetary motion type. Int. J. Mach. Tools Manuf. 2015, 92, 60–71. [Google Scholar] [CrossRef]
- Xiaofan, D.; Guang, C.; Chunlei, H.; Rencheng, Z.; Zhijie, C.; Zhiqiang, W.; Xinmin, J.; Yang, C. Properties of grinding tool material for double-disc straight-groove grinding method based on friction and wear experiment. Int. J. Adv. Manuf. Technol. 2021, 114, 2243–2259. [Google Scholar] [CrossRef]
- Liu, W.; Ren, C.; Chen, G.; Zhang, J.; Hao, Y.; He, C. Rounding mechanism of a novel double-disc arc-contact lapping for high-precision rollers. Int. J. Adv. Manuf. Technol. 2023, 125, 5571–5589. [Google Scholar] [CrossRef]
- BS ISO 12297-1-2021; BSI Standards Limited 2021. BSI: London, UK, 2021.
Disclaimer/Publisher’s Note: The statements, opinions and data contained in all publications are solely those of the individual author(s) and contributor(s) and not of MDPI and/or the editor(s). MDPI and/or the editor(s) disclaim responsibility for any injury to people or property resulting from any ideas, methods, instructions or products referred to in the content. |
© 2023 by the authors. Licensee MDPI, Basel, Switzerland. This article is an open access article distributed under the terms and conditions of the Creative Commons Attribution (CC BY) license (https://creativecommons.org/licenses/by/4.0/).