1. Introduction
Heart failure (HF) signifies a clinical and pathophysiological condition explained by the impairment of the heart’s pump function and represents a syndrome that leads to the inability of the heart to ensure the flow necessary for the tissue’s metabolic needs [
1].
According to the definition proposed in the European Guidelines for the diagnosis and treatment of HF in 2021, HF is a clinical syndrome that includes symptoms (e.g., dyspnea, fatigue) and signs (e.g., pulmonary congestion and or systemic congestion), and that is the consequence of a structural and/or functional cardiac abnormality which causes increased intracardiac filling pressures and or inadequate cardiac output at rest or during exercise [
2]. Depending on the value of the left ventricular ejection fraction (LVEF), HF is subdivided into three categories [
2]: HF with reduced LVEF (≤40%), HF with medium-reduced LVEF (41–49%), and HF with preserved LVEF (≥50%), additionally requiring the certification of structural and or functional abnormalities compatible with LV diastolic dysfunction, increased intracardiac filling pressures, or increased natriuretic peptides. From a clinical point of view, HF is subdivided into four functional classes according to the New York Heart Association, which are the functional classes I-IV NYHA [
3].
Despite the many medical problems and medical discoveries, heart failure (HF) remains one of the most important and frequently occurring public health problems, with continued very high mortality and morbidity and high hospitalization rates, especially for elderly patients. Among the cardiovascular diseases, it remains the condition with the highest degree of disability in terms of quality of life.
Although the methods of diagnosis and treatment are increasingly complex, the mortality and hospitalization rates remain very high, which implies the large consumption of financial resources.
Identifying an indicator with a prognostic role in patients with HF could represent a salutary solution in the future, as it could identify patients with a negative prognosis, represented by recurrent decompensation, frequent hospitalization, or increased mortality. Alongside the classic prognostic factors reported in the medical literature (e.g., reduced LVEF, hyponatremia, renal dysfunction, anemia, increased levels of NT-pro BNP), a new parameter of interest that has not been greatly studied in terms of its prognostic relationship with incidence of HF, makes its entrance, namely, the mean platelet volume (MPV). Thus, our study focused on MPV as a possible prognostic factor in patients with HF.
MPV is an indicator that expresses the volume of platelets, having a normal value of 7.2–11.7 fl, being a variable that accurately reflects the size of platelets [
4].
Data from the medical literature reveal that platelets with a high platelet volume have a greater enzymatic and metabolic potential than those with a lower platelet volume, thus presenting an intense procoagulant status [
5,
6]. Therefore, MPV has been found to be predictive of cardiovascular disease [
7], to be a possible indicator of platelet reactivity, and to be a predictor of many other diseases [
8].
The prognostic correlation between MPV and HF is poorly understood, and the mechanisms underpinning it are unclear. There are limited studies showing that platelet activity increases in patients with acute HF [
9].
Regarding the current state of knowledge represented in the medical literature regarding MPV as a possible negative prognostic factor in HF patients, studies are limited, but five studies have been reported, including a study conducted by Budak Yasemine [
10], a study conducted by Hakki Kaya [
11], a study conducted by Hayati Kandis [
12], a study conducted by Nassiba Menghoum [
13], and a study conducted by Bianca Dahlen et al. [
14].
The study conducted by Budak Yasemine et al. [
10] suggested that MPV could be an indicator of disease progression and clinical status in patients with acute HF. The study included 190 patients with acute HF and 129 without acute HF. The aim of the study was to identify a correlation between the MPV value and BNP concentration, the latter being a parameter suggestive of decompensation in HF. The results from this study showed a positive correlation between the MPV value and the BNP value, and through it, demonstrated that MPV could be an indicator of HF severity and clinical status [
10].
The study conducted by Hakki Kaya et al. [
11] concluded that MPV could be a possible independent predictor of hospitalization [
11]. The study was carried out in a retrospective manner on a group of 197 patients with stable chronic HF (NYHA class I-III HF) in sinus rhythm and with reduced left ventricle ejection fraction. Patients were classified into two categories according to MPV value (group I with an MPV value under 9.1 fl, and group 2 with an MPV value over 9.1 fl). The results showed that patients with an MPV value over 9.1 fl were at an increased risk of HF-related hospitalization [
11].
The study conducted by Hayati Kandis et al. [
12] found that the MPV value was much higher in patients with decompensated HF compared to those with stable HF and indicated that an increased MPV at admission could be a possible predictor of in-hospital and 6-month mortality in patients with decompensated HF [
12]. The study was carried out in a prospective manner on a population of 207 patients with HF, of which 136 had decompensated HF and 71 had stable HF. Patients were followed for a period of 18 ± 12 months. The results, based on a receiver operating characteristic analysis, revealed that MPV value on admission was a predictor for in-hospital mortality and 6-month mortality [
12].
The study conducted by Nassiba M. et al. [
13] focused on HF patients with preserved left ventricle ejection fraction (preserved LVEF) and the prognostic impact of MPV in this population. The study was conducted in a prospective manner on 228 patients with HF and preserved LVEF and 38 control patients, who were followed over a period of 26 months. The prognostic impact of MPV was obtained using Cox hazard models. The results from this study revealed that increased MPV values were encountered in the group of patients with HF versus the control groups, and that patients with increased levels of MPV were hospitalized or died. Thus, based on the above results, the study concluded that increased levels of MPV predicted a poor prognosis in HF patients with preserved LVEF [
13].
The study conducted by Bianca Dahlen et al. [
14] was an epidemiological, prospective cohort study which focused on the relationship between platelet indices (MPV and platelet-to-leukocyte ratio) and clinical outcome in HF patients. The study was carried out on 3289 participants, of which 294 were the control group, and revealed that a lower platelet-to-leukocyte ratio was associated with worsening of HF and high MPV values were associated with worse outcomes, defined by cardiac death and hospitalization due to worsening of HF [
14].
The main objective of our research was to introduce new thinking to the current medical research regarding MPV as a prognostic parameter in HF.
Knowing that a simple parameter such as MPV (which is found in the components of any hemogram) could provide information regarding the prognosis of patients with HF was an important consideration because through it we could potentially identify HF patients at risk of having a poor outcome, and, therefore, treat them in advance to prevent negative events.
2. Materials and Methods
2.1. Study Design and Study Population
Our research is a type of correlational study. It was conducted in a retrospective manner on 260 patients from the Cardiology Department of the Emergency Clinical Hospital Bagdasar-Arseni. The target population was patients with chronic heart failure (HF), stable or decompensated, but the population of interest was patients with chronic decompensated HF. The parameter of interest in the research was MPV.
The definition of decompensated chronic HF followed the indications of the 2021 ESC Guidelines for HF [
2]: sudden or progressive deterioration in chronic HF, patients with chronic HF being those who have a diagnosis of HF in their personal history, characterized by typical symptoms with or without signs of congestion, systolic dysfunction, echocardiographic evidence of cardiac structural and functional abnormalities, objective evidence of increased filling pressures, and increased NT-pro BNP values.
Regarding patients with stable chronic HF, the defining criteria are patients with a personal history of HF and who are included in functional classes II NYHA [
2].
We analyzed all the patients with HF admitted between January 2017 and January 2019 to the Cardiology Department of the Emergency Clinical Hospital Bagdasar-Arseni, of which we selected 260 patients who met the inclusion criteria. Of the 260 patients retained, 116 patients had class IV NYHA HF, 65 patients had APE, 40 patients had class III NYHA HF, and 39 patients had class II NYHA HF.
The inclusion criteria were:
- −
patients with decompensated chronic HF—defined by class III/IV NYHA HF or acute pulmonary edema (APE), regardless of left ventricular ejection fraction.
- −
patients with stable chronic HF—defined by class II NYHA HF, regardless of left ventricular ejection fraction.
- −
patients for whom the MPV value was available.
- −
patients for whom data regarding 3-month, 6-month rehospitalization and 1-year death were available.
The exclusion criteria were:
- −
patients without defining criteria for chronic HF.
- −
patients for whom the MPV value was not available.
- −
diseases with a survival time of less than one year.
- −
neoplasms.
- −
chronic kidney disease.
- −
acute coronary syndrome.
- −
acute stroke.
- −
acute pulmonary thromboembolism or deep vein thrombosis.
- −
autoimmune diseases.
- −
thrombocytopenia.
2.2. Data Collection
Data regarding the MPV value, and the type of HF (class II/III/IV NYHA, APE) were collected using the Hippocrates System Database of the Emergency Clinical Hospital Bagdasar-Arseni, as well as through the medical sheets. Data regarding 3-month, and 6-month rehospitalization, 1-year death, and number of days in hospital were obtained by telephone contact or using the Hippocrates System Database of the Emergency Clinical Hospital Bagdasar-Arseni.
Data collection regarding the above-mentioned variables was undertaken with the approval of the Medical and Health Services Manager of the Emergency Clinical Hospital Bagdasar-Arseni. Throughout our study, we did not risk causing emotional or physical harm to the patients since our research only entailed data collection and data analysis from the medical sheets and from the hospital’s system database. Because this was a retrospective study that only entailed data collection, and a waiver of informed consent would not have adversely affected the rights and welfare of the subjects, written informed consent from the patients was waived, as all data were fully anonymized and summarized in aggregate.
2.3. Statistical Analysis
The database was designed using the Excel 2003 program. The collected data was processed in Python 3.10 and Pandas Library 1.5.2. The statistical results were obtained by applying logistic and linear regression models, and the estimation of the regression models was performed using the statsmodels 0.15.5 library.
The graphic representations of the statistical results used are boxplot-type, histograms, and distribution-type representations.
Regarding the statistical significance of the regression model, the p-value threshold below which the model was considered statistically significant was 0.05.
Based on the regression model analysis, we conceived a mathematical formula represented by the following model: Score (of event happening) = estimated coefficient for the event + estimated coefficient for MPV × MPV value (Yi = β0 + β1Xi + εi).
To convert the value of the score into probabilities, we applied an equation represented by: .
3. Results
Starting from the hypothesis that mean platelet volume (MPV) could represent a possible predictor factor in the study population represented by heart failure (HF) patients, the statistical analysis examined whether there was a plausible relationship between the MPV value and certain target variables, based on the regression model analysis. The present study focused on the possible relationship between MPV and the following variables of interest: type of HF—class II, III, IV NYHA HF or acute pulmonary edema (APE), duration of hospitalization, readmission at 3 months and 6 months, 1-year mortality, and in-hospital death.
Using the regression model analysis, we estimated the impact of MPV on certain events (i.e., duration of hospitalization, 3-month, and 6-month rehospitalization, 1-year mortality, in-hospital death) and the probabilities of these events happening depending on the MPV value.
The statistical results regarding the relationship between the MPV value and the above-mentioned variables of interest were diverse and promising and are described in detail in the following paragraphs.
3.1. Class IV NYHA HF–MPV Relationship
Based on the logistic regression model, the estimated coefficients for which are presented in
Table 1, we can predict the probability of a patient having class IV NYHA HF given the MPV value. This model aims to show how MPV predicts class IV NYHA HF in terms of the probability or chance that this event would happen.
The pseudo R-square (in this case 0.054), adapted from the classic R-square from linear regression, refers to how much of the variability of an event, represented in this case by class IV NYHA HF, is explained by the independent variable—MPV, here indicating that 5.4% of the event variability represented by NYHA class IV HF was influenced by MPV variability.
The model is: score (of class IV NYHA HF happening) = −7.1912 + 0.779 × MPV.
Starting from this model, let us assume that we have a patient 1 who has an MPV of 7 fl and a patient 2 who has an MPV of 9 fl. By applying the above-mentioned mathematical formula, the results are: the score for patient 1 = −7.1912 + 0.779 × 7 = −1.73, and the score for patient 2 = −7.1912 + 0.779 × 9 = −0.1802
Because the values of −1.73 and −0.1802 do not give us much information in terms of interpretability, we can convert the score into probabilities, applying the following equation: . So, the probability for patient 1 is 0.15, which means a 15% chance of having class IV NYHA HF, versus patient 2 whose probability is 0.45, which means a 45% chance of having class IV NYHA HF.
The coefficient for MPV is 0.779 and reflects how much or to what extent it affects patients with class IV NYHA HF. The p-value associated with this coefficient is 0.000; therefore, it can be deduced that the mathematical model described and applied above is significant because it is below the 0.05 p-value threshold. Thus, we have evidence to believe that the impact of MPV is only true for our sample data, but applies to all the population.
Starting from the arguments above, it can be said that, depending on the MPV value, we can predict the probability of having class IV NYHA HF, and that a patient with a higher MPV value has a higher probability of having class IV NYHA HF.
These data are shown more clearly in
Figure 1, in which three graphs are shown, as well as in
Figure 2.
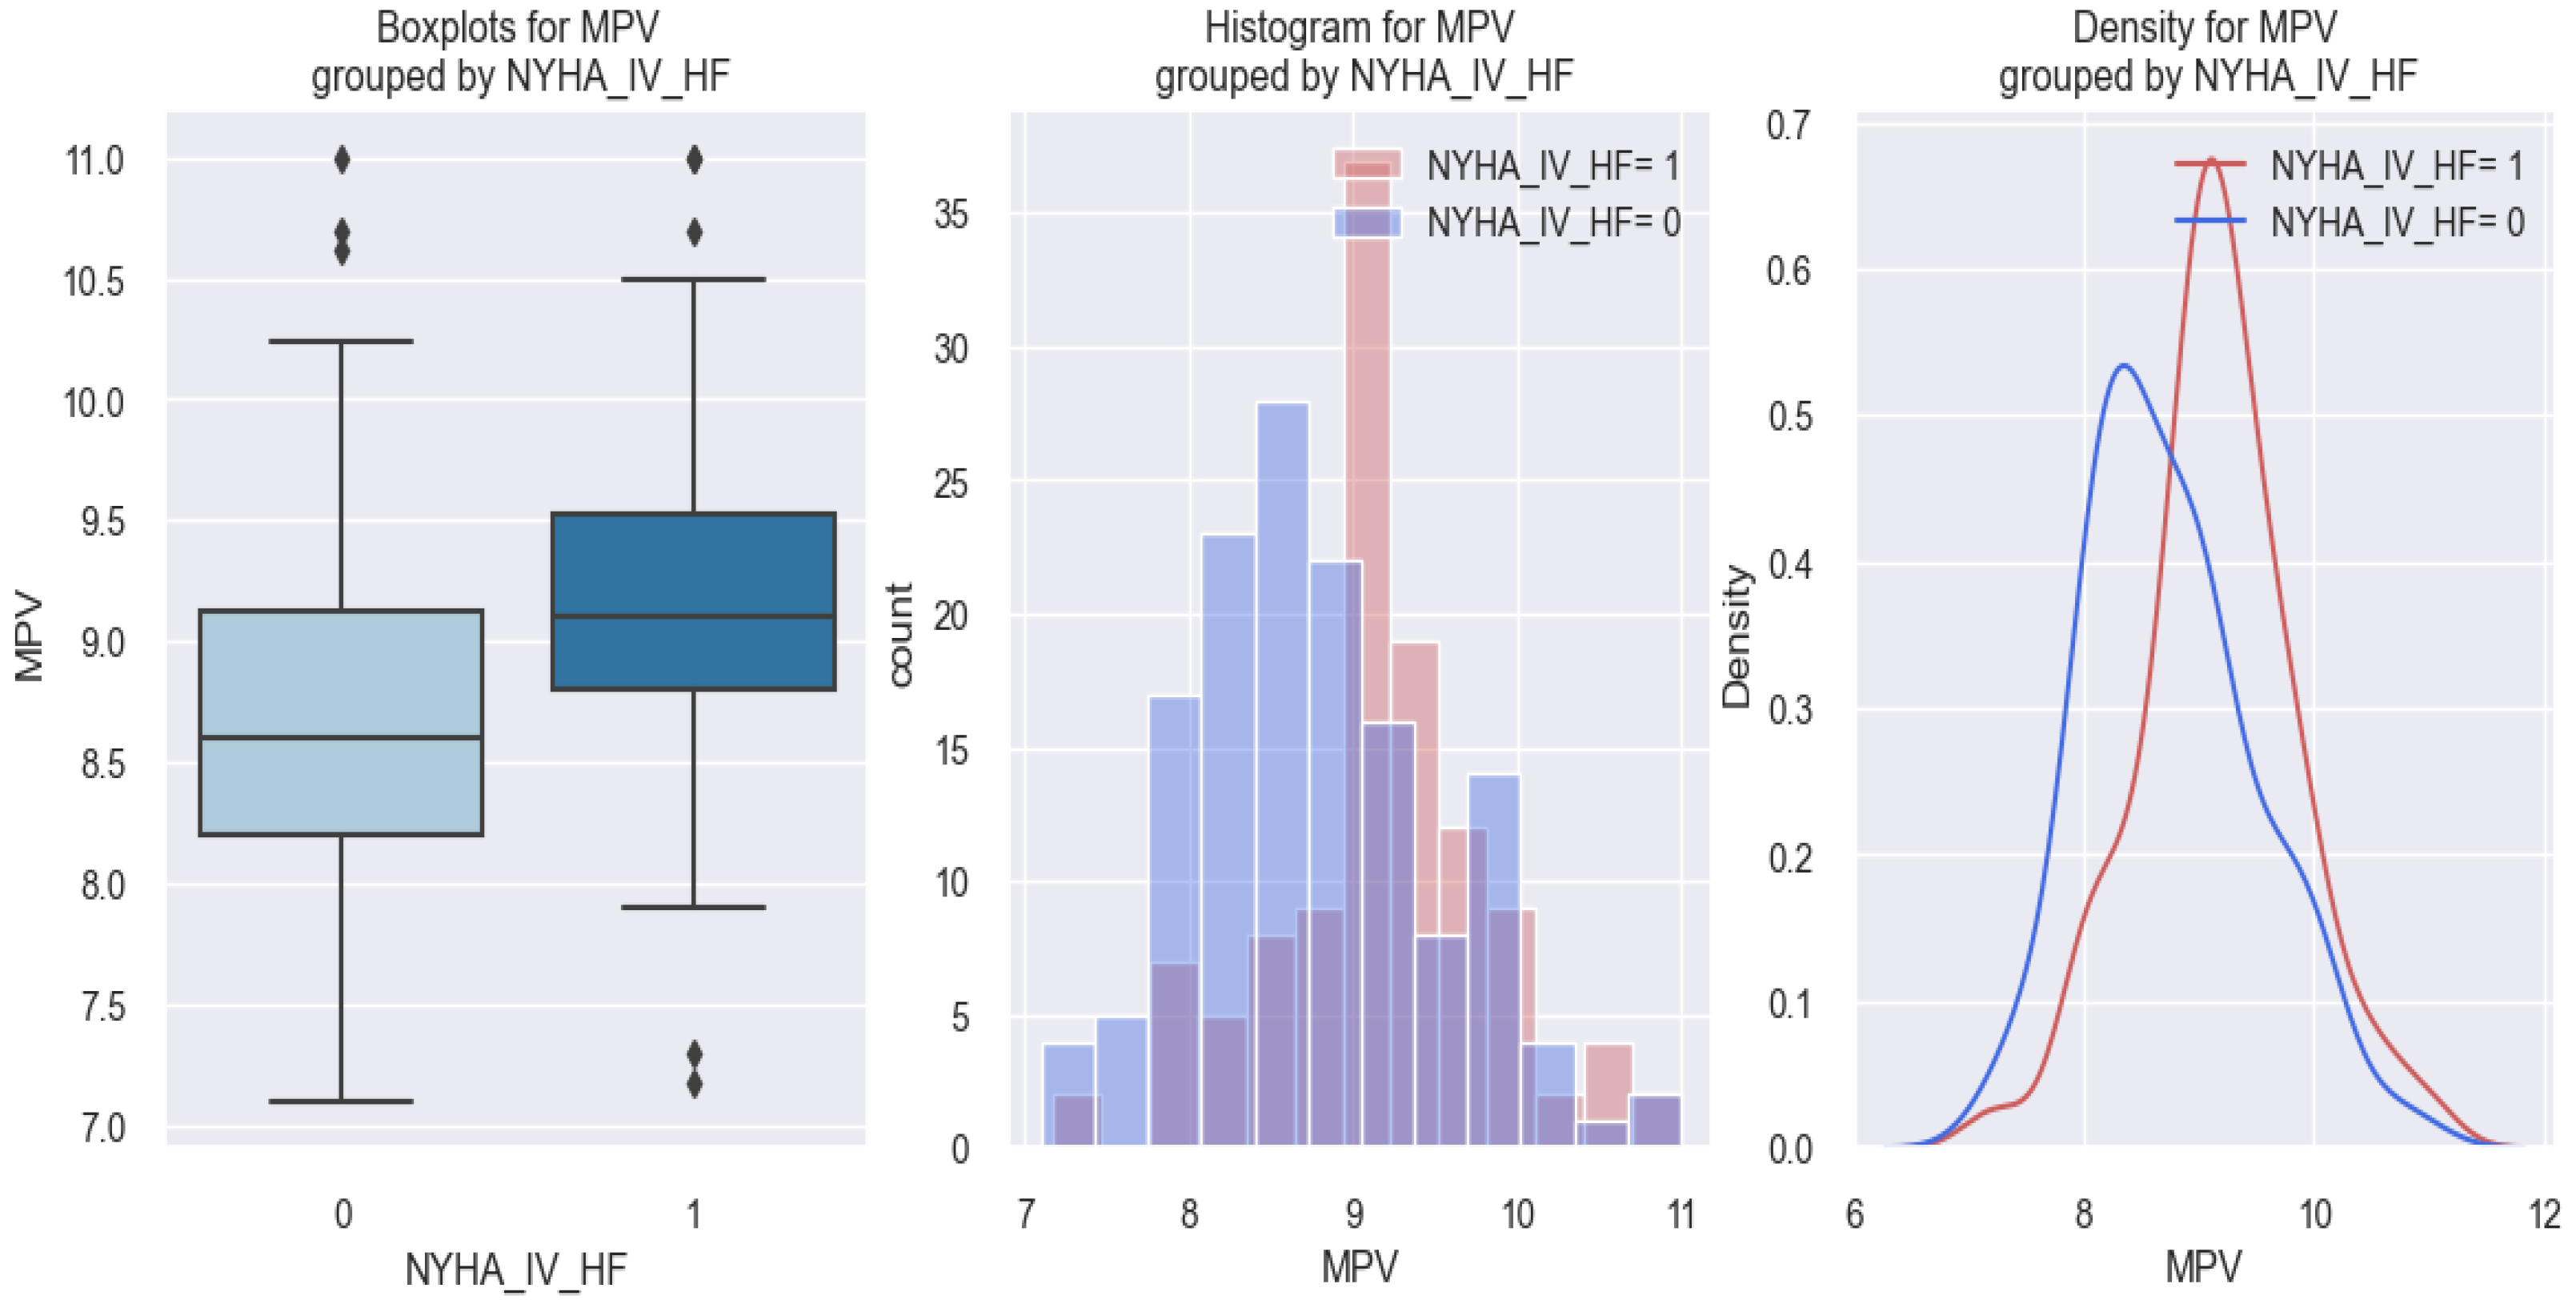
In all three graphic representations of
Figure 1, it can be observed that patients with class IV NYHA HF (1) tended to have a higher MPV value (over 9 fl) compared to those without class IV NYHA HF (0) who had MPV values below 9 fl.
Figure 2, which represents the probability of having class IV NYHA HF based on the MPV value by applying the logistic regression model, shows that as the MPV value increased, the probability of patients having class IV NYHA HF also increased. For instance, patients with an MPV of 9 fl had a 45% probability of having class IV NYHA HF, whereas patients with an MPV of 7 fl had a 15% probability of having class IV NYHA HF.
3.2. APE and MPV Relationship
Similar results as observed for patients with class IV NYHA HF were also observed in patients with acute pulmonary edema (APE). Based on the logistic regression model, the estimated coefficients for which are represented in
Table 2, we can explain the probability that a patient had APE based on the MPV value.
The applied model is the following: score (of APE happening) = −7.9128 + 0.7543 × MPV.
Starting from this model, let us assume that we have a patient with an MPV of 8 fl; applying the above mathematical formula results in a score of −1.91. To be able to interpret this result as a probability, we apply the following equation:
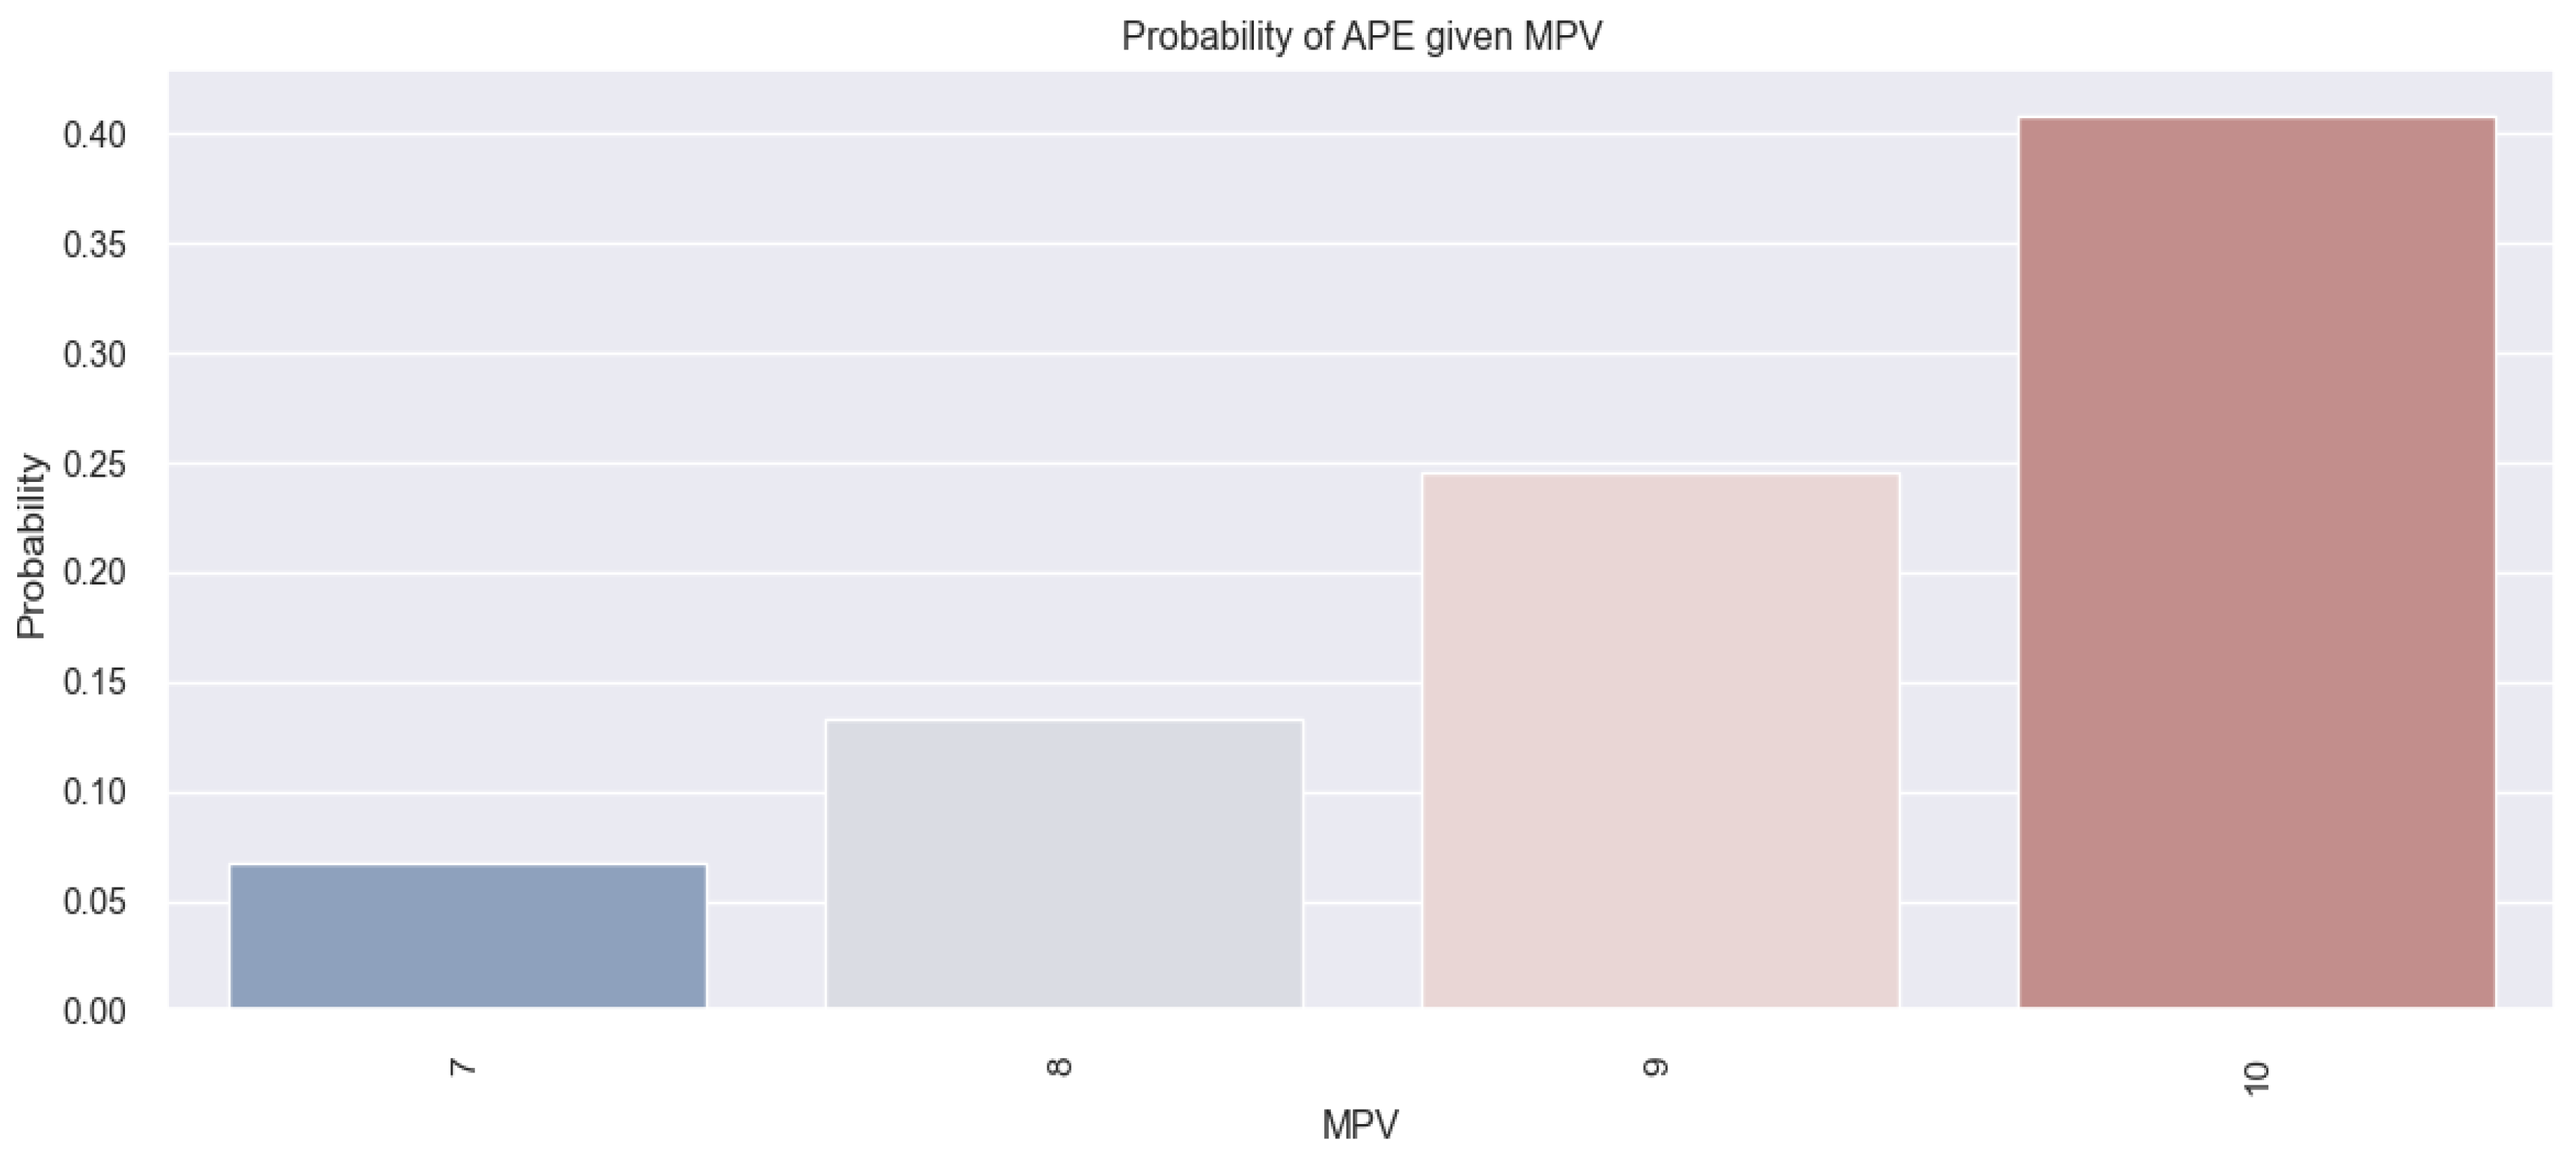
. So the probability of the patient with an MPV of 8 fl is 0.14, representing a 14% chance of having APE. The results obtained by applying the above-mentioned mathematical formula are clearly illustrated in the figure below (
Figure 3), which shows that there was a tendency for the probability of having APE to increase as the MPV value increased (41% probability for an MPV value of 10 fl versus 14% for an MPV value of 8 fl).
The mathematical model applied above to patients with APE is statistically significant because the p-value associated with the coefficient for MPV (0.75) is 0.000.
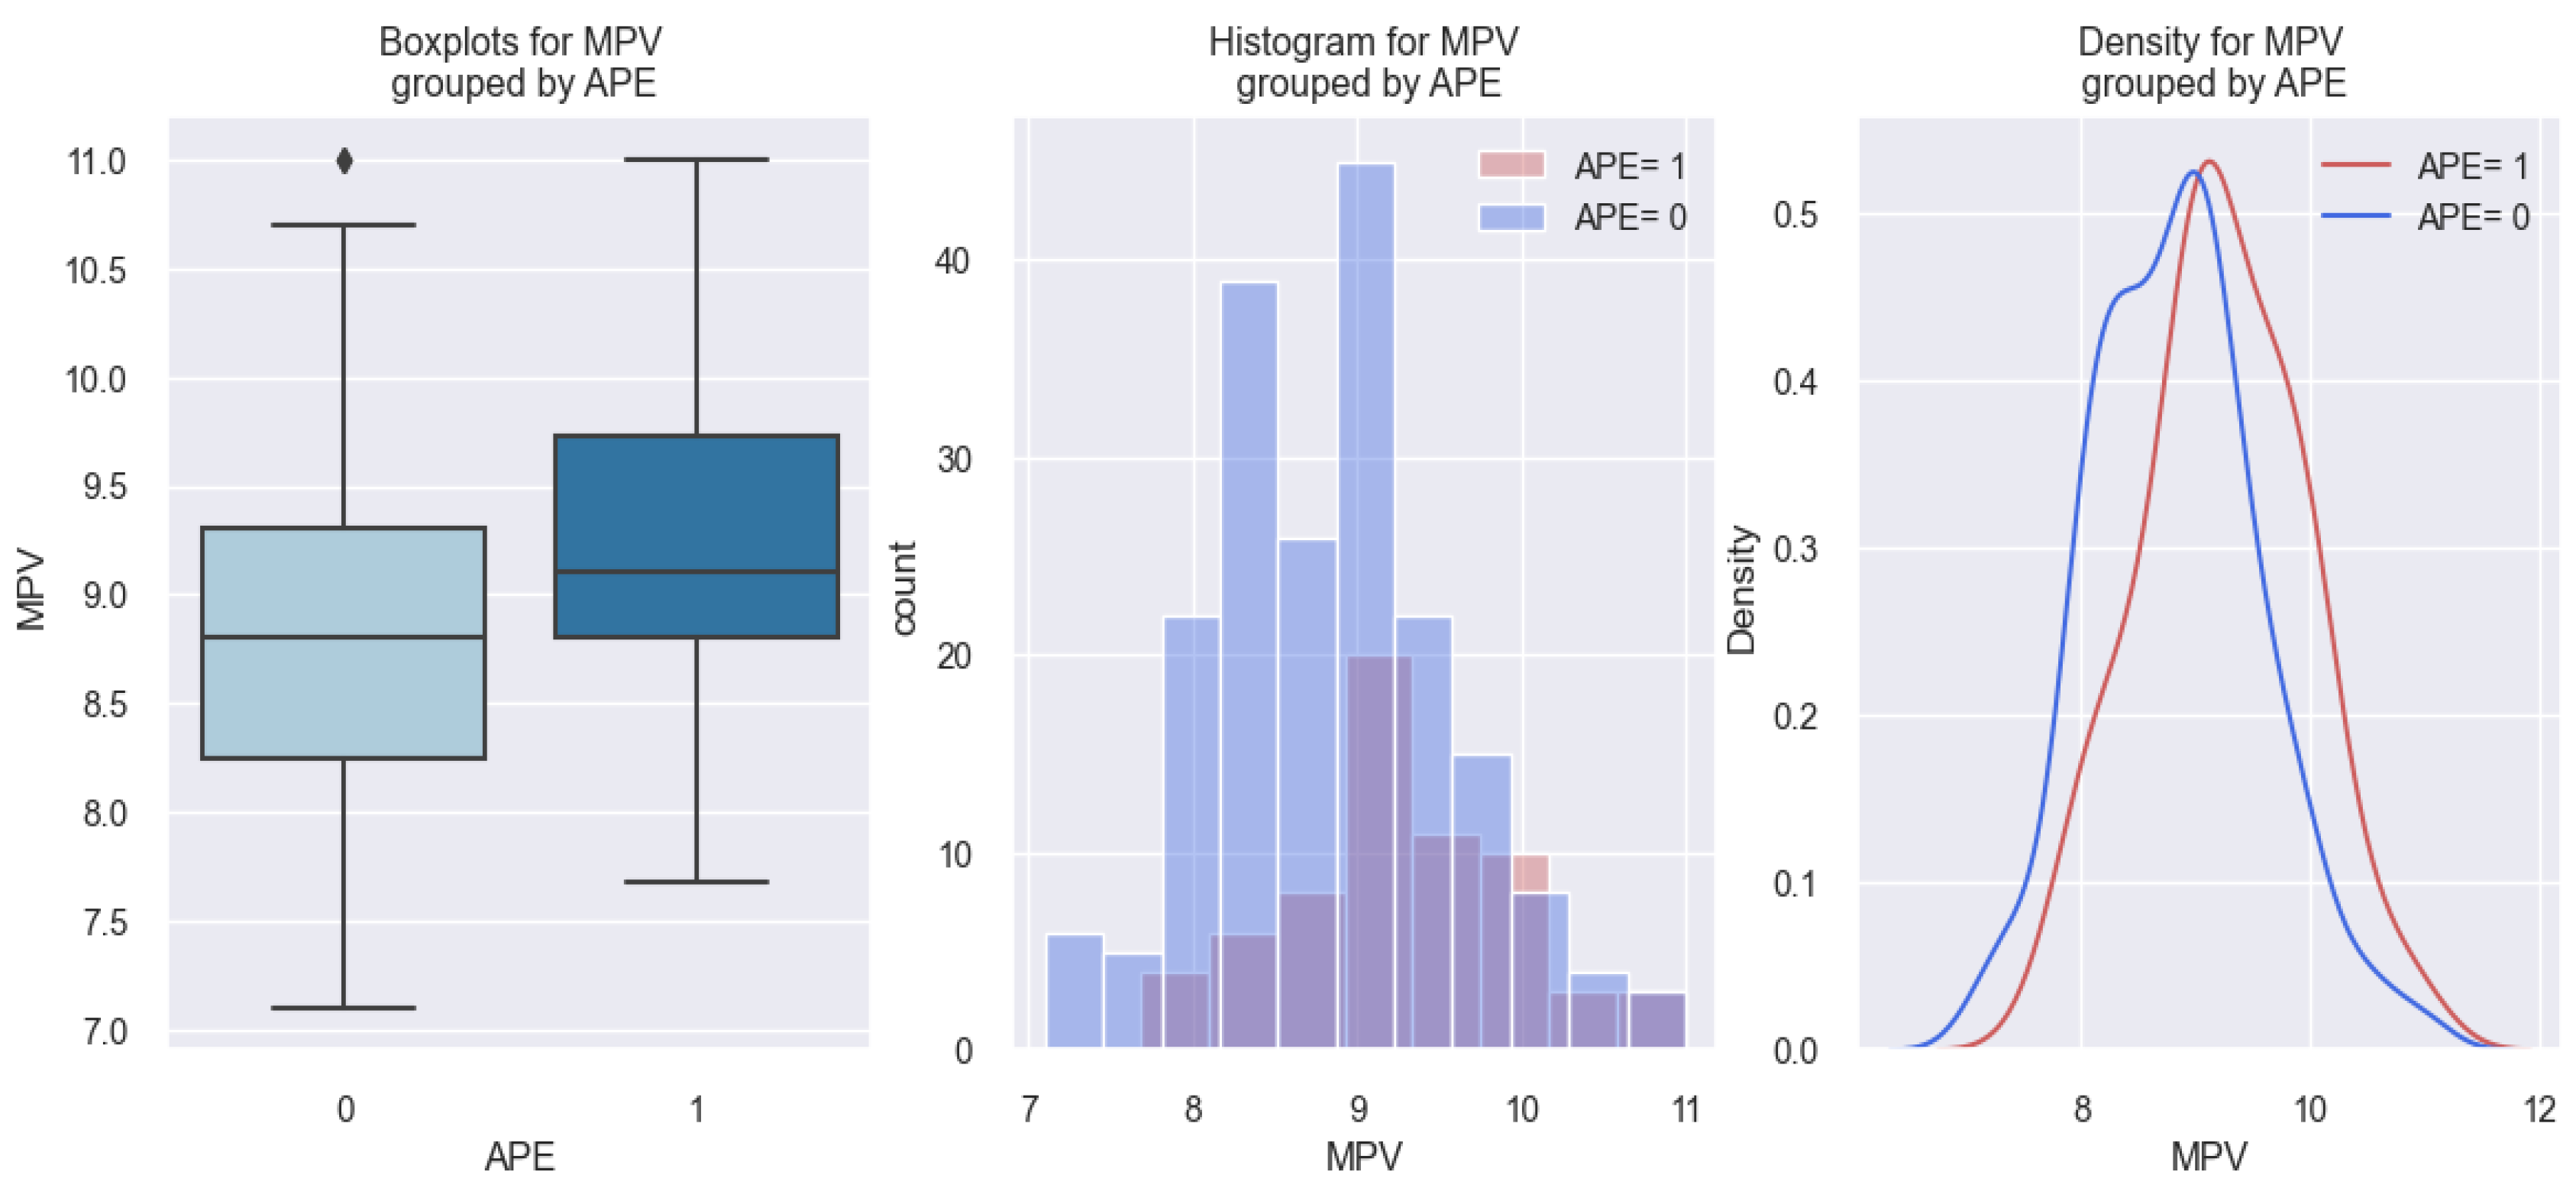
Thus, starting from the arguments above, it can be said that, based on the MPV value, we can predict the probability of having APE, and that the higher the value of MPV, the greater the probability that patients have APE. This finding is represented graphically in the figure below, in which three graphs are displayed (
Figure 4). All three graphs reveal that patients with APE (1) tended to have a higher MPV value (above 9 fl) compared to those without APE (0).
3.3. Class II NYHA and Class III NYHA HF–MPV Relationship
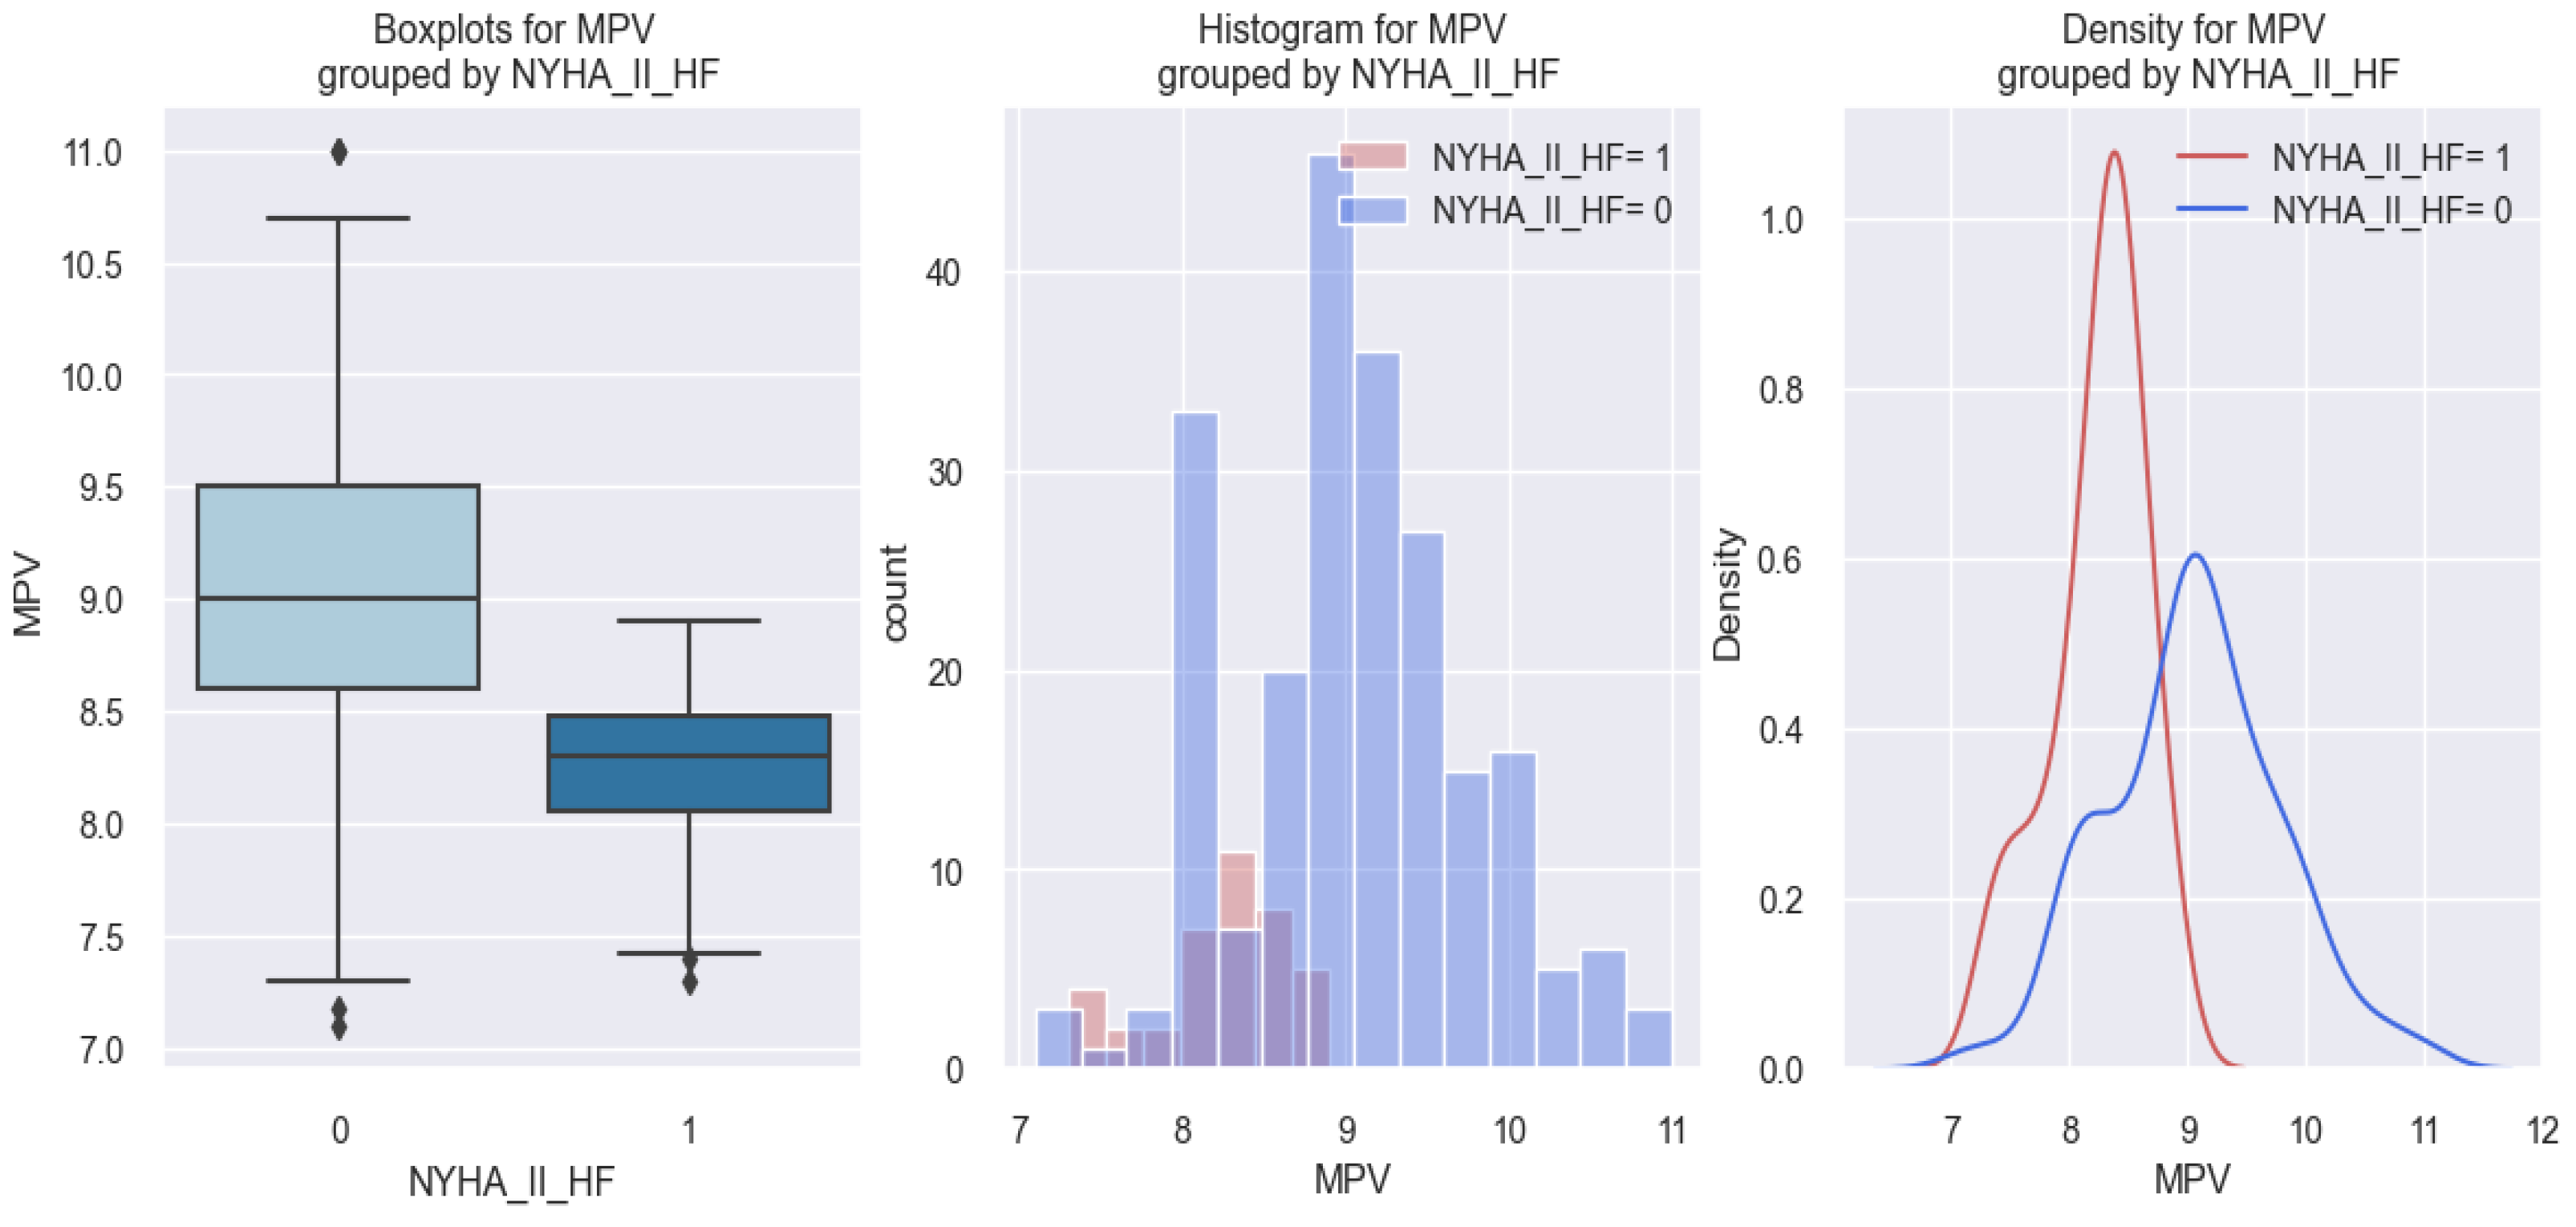
Compared to patients with class IV NYHA HF or acute pulmonary edema, in patients with class II NYHA HF, the data results were on the opposite side. Patients with class II NYHA HF (1) had a lower MPV value compared to those without class II NYHA HF (0). These data are presented in
Figure 5, in which we can observe that patients with class II NYHA HF (1) tended to have a lower MPV value (below 9 fl) compared to those without class II NYHA HF (0).
By applying the logistic regression model, the estimated coefficients for which are shown in
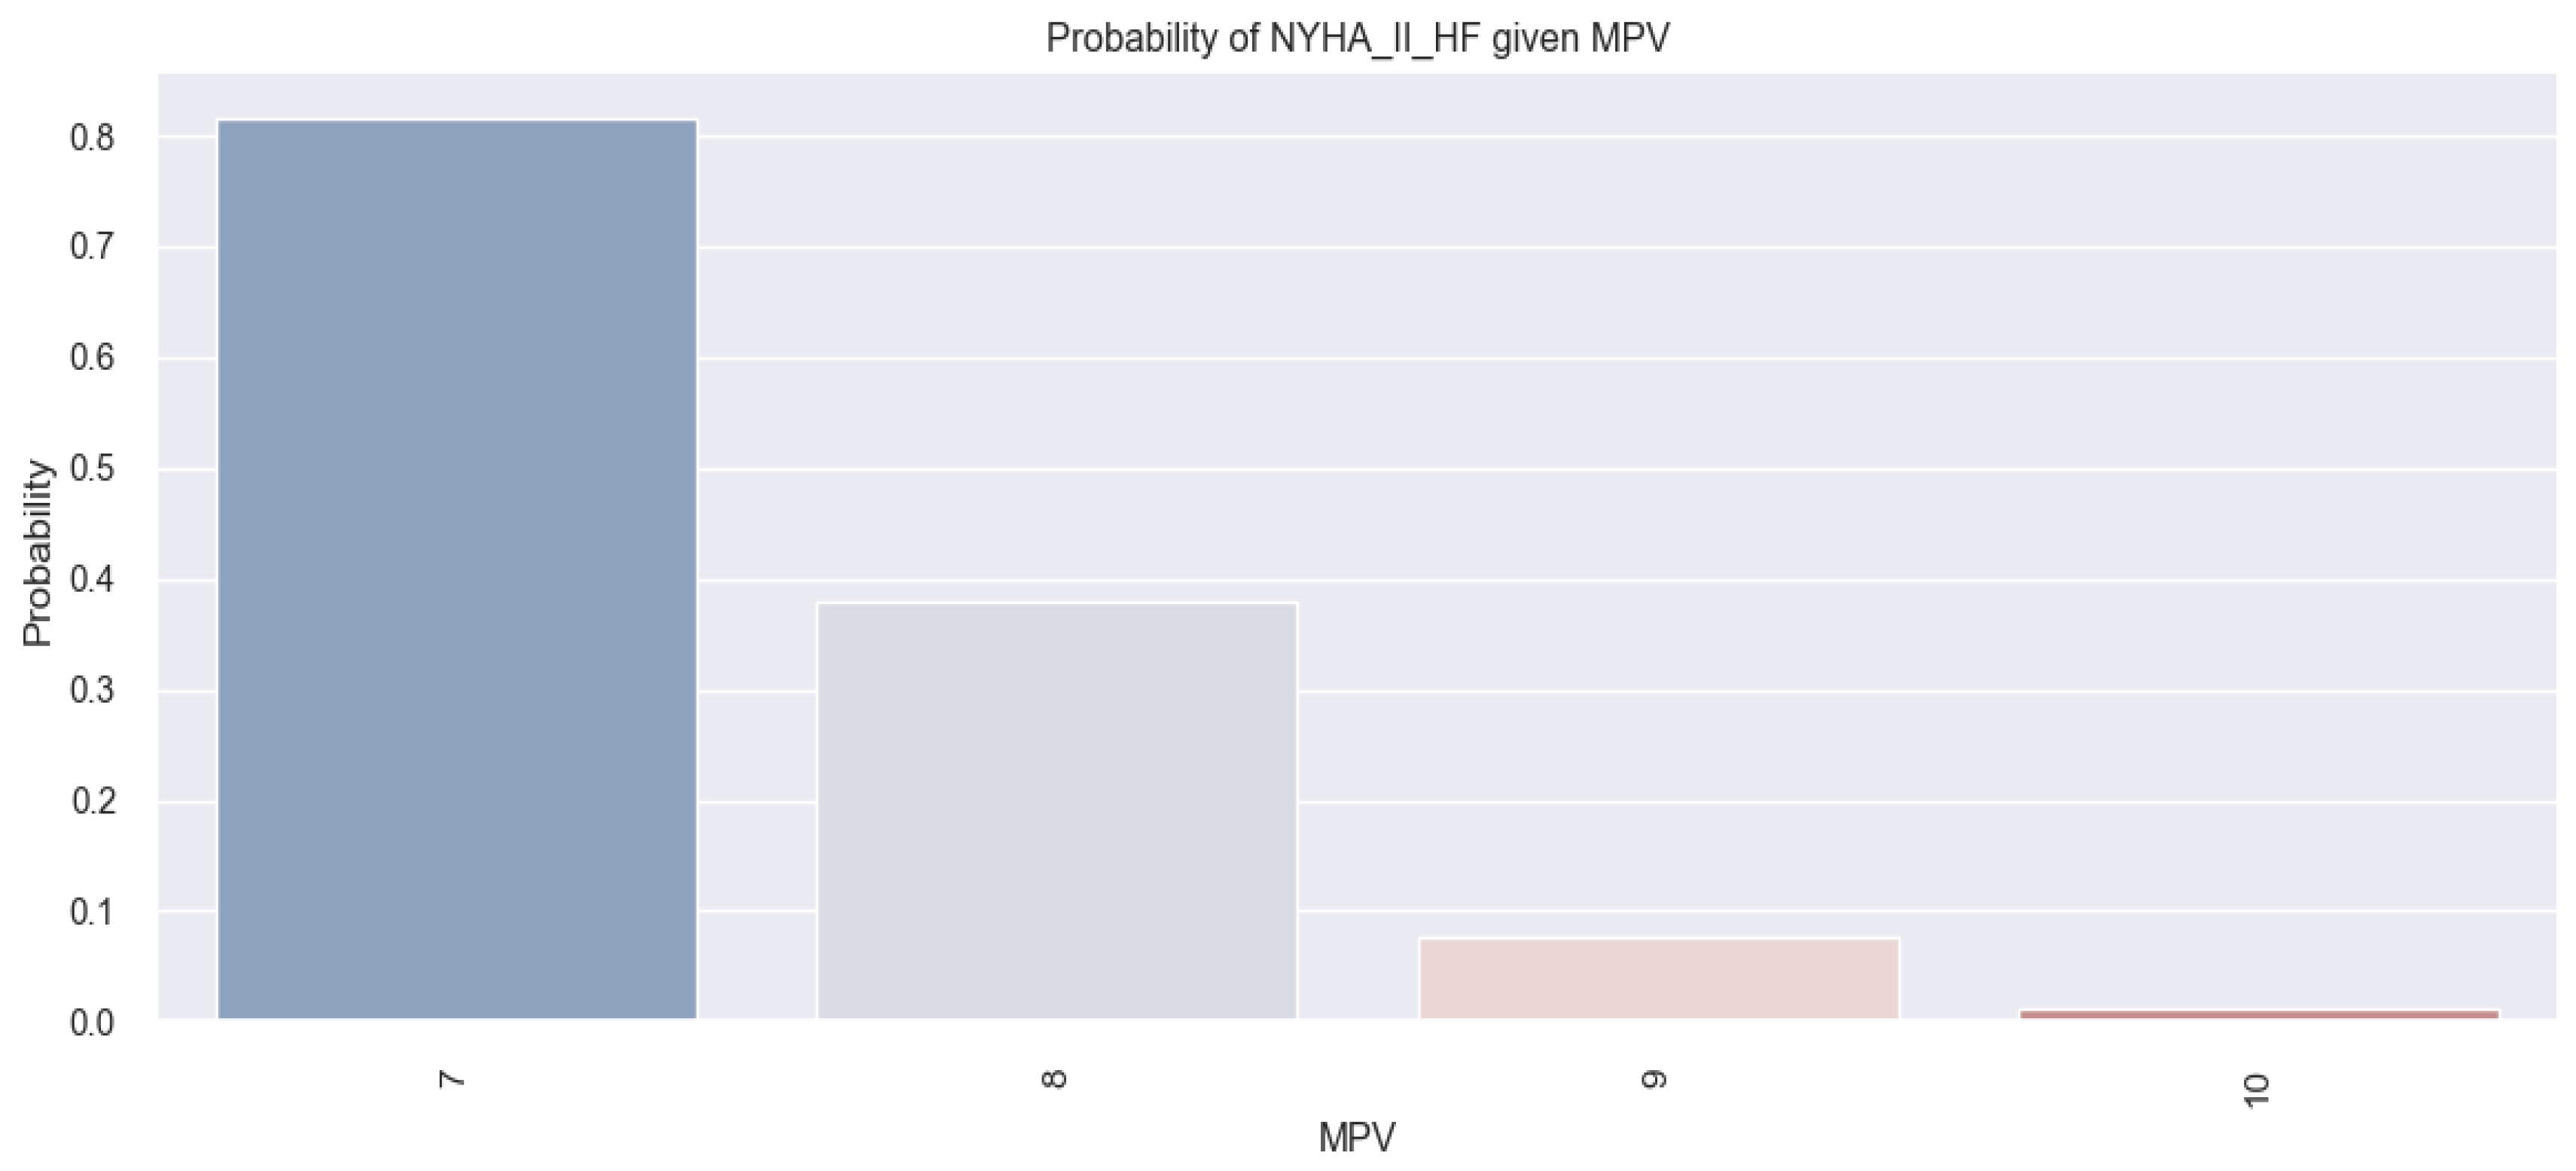
Table 3, we were able to predict the probability of a patient having class II NYHA HF based on the MPV value.
The model applied in this case was the following: score (of having class II NYHA HF) = 15.3987 − 1.9868 × MPV. Starting from this model, let us assume that we have a patient with an MPV of 7 fl; applying the above-mentioned mathematical formula the score obtained for this patient is 1.4911 (=15.3987 − 1.9868 × 7). To be able to interpret this result as a probability, we apply the following equation: . Thus, the probability of a patient with an MPV of 7 fl is 0.81, representing an 81% chance of having class II NYHA HF.
The results obtained based on the above-mentioned mathematical formula are illustrated graphically in the figure below (
Figure 6), in which we can observe that patients with a low MPV had a higher probability of having class II NYHA HF.
The mathematical model applied to patients with class II NYHA HF in the study sample is statistically significant because the p-value associated with the coefficient for MPV (−1.9868) is 0.000. Thus, starting from the arguments above, it can be said that, based on the MPV value, we can predict the probability of having class II NYHA HF, and that the lower the value of MPV, the higher the chance that patients have class II NYHA HF.
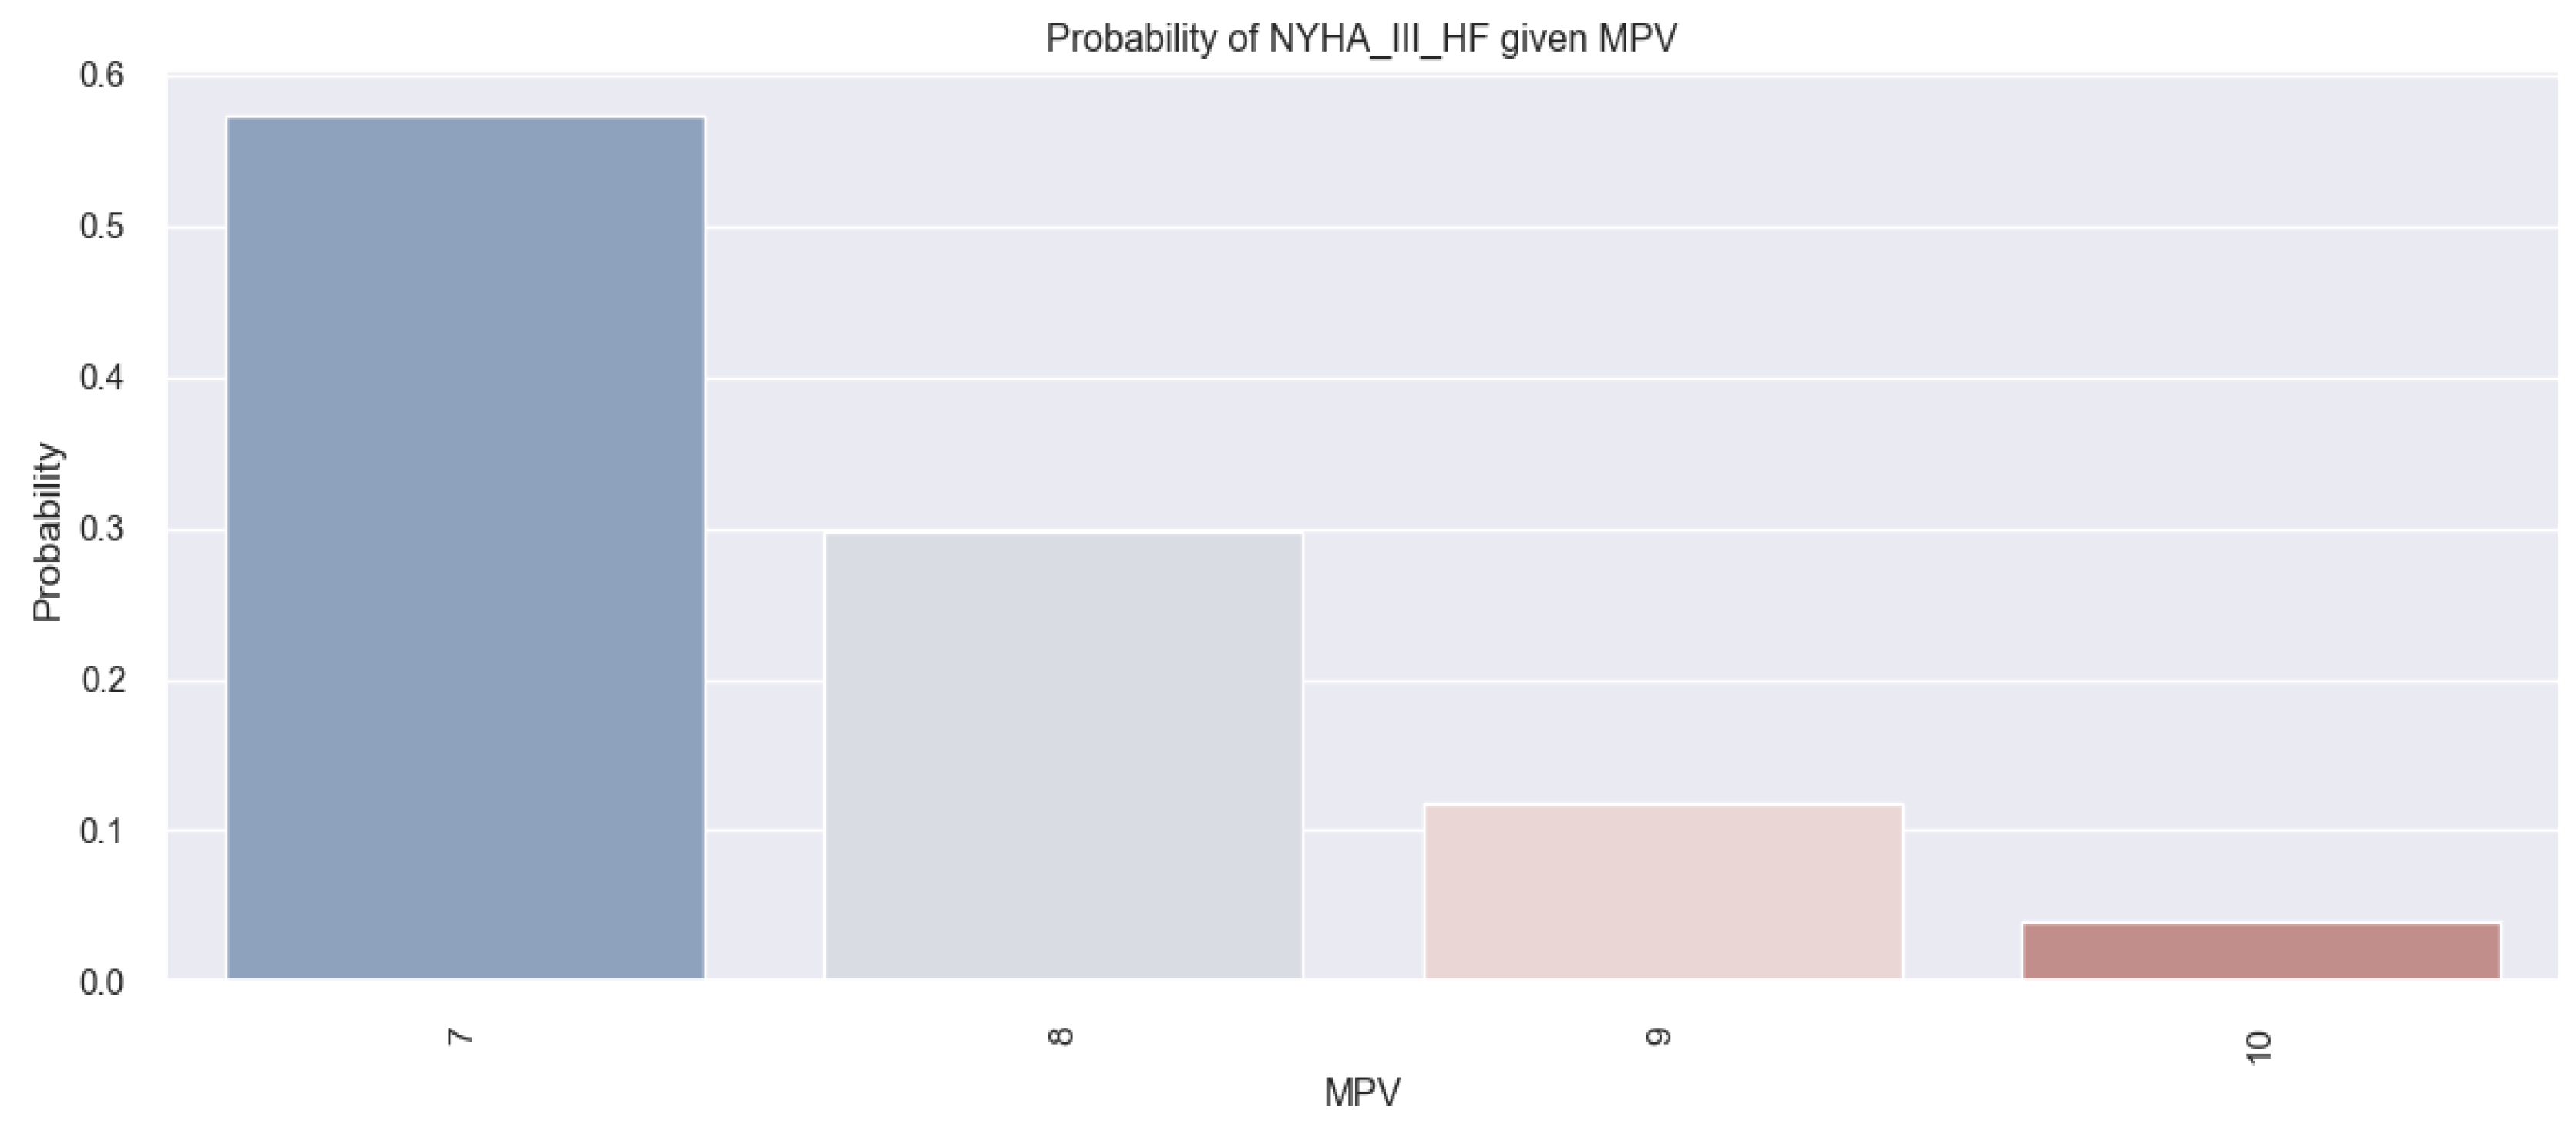
Similar results compared to patients with class II NYHA HF were also obtained in patients with class III NYHA HF who had lower MPV values compared to those without class III NYHA HF. These data are represented graphically in the figures below (
Figure 7 and
Figure 8). For example, in all three graphical representations from
Figure 7, we can observe that patients with class III NYHA HF (1) had MPV values below 9 fl compared to those without class III NYHA HF (0).
By applying the logistic regression model,
Figure 8 illustrates the probabilities of patients having class III NYHA HF based on the MPV value, showing that there was a tendency for the probability of patients having class III NYHA HF to increase as the MPV value decreased (patients with an MPV value of 7 fl had a 58% probability of having class III NYHA HF versus patients with an MPV value of 9 fl who had a probability of about 11%).
3.4. Number of Days in Hospital and MPV Relationship
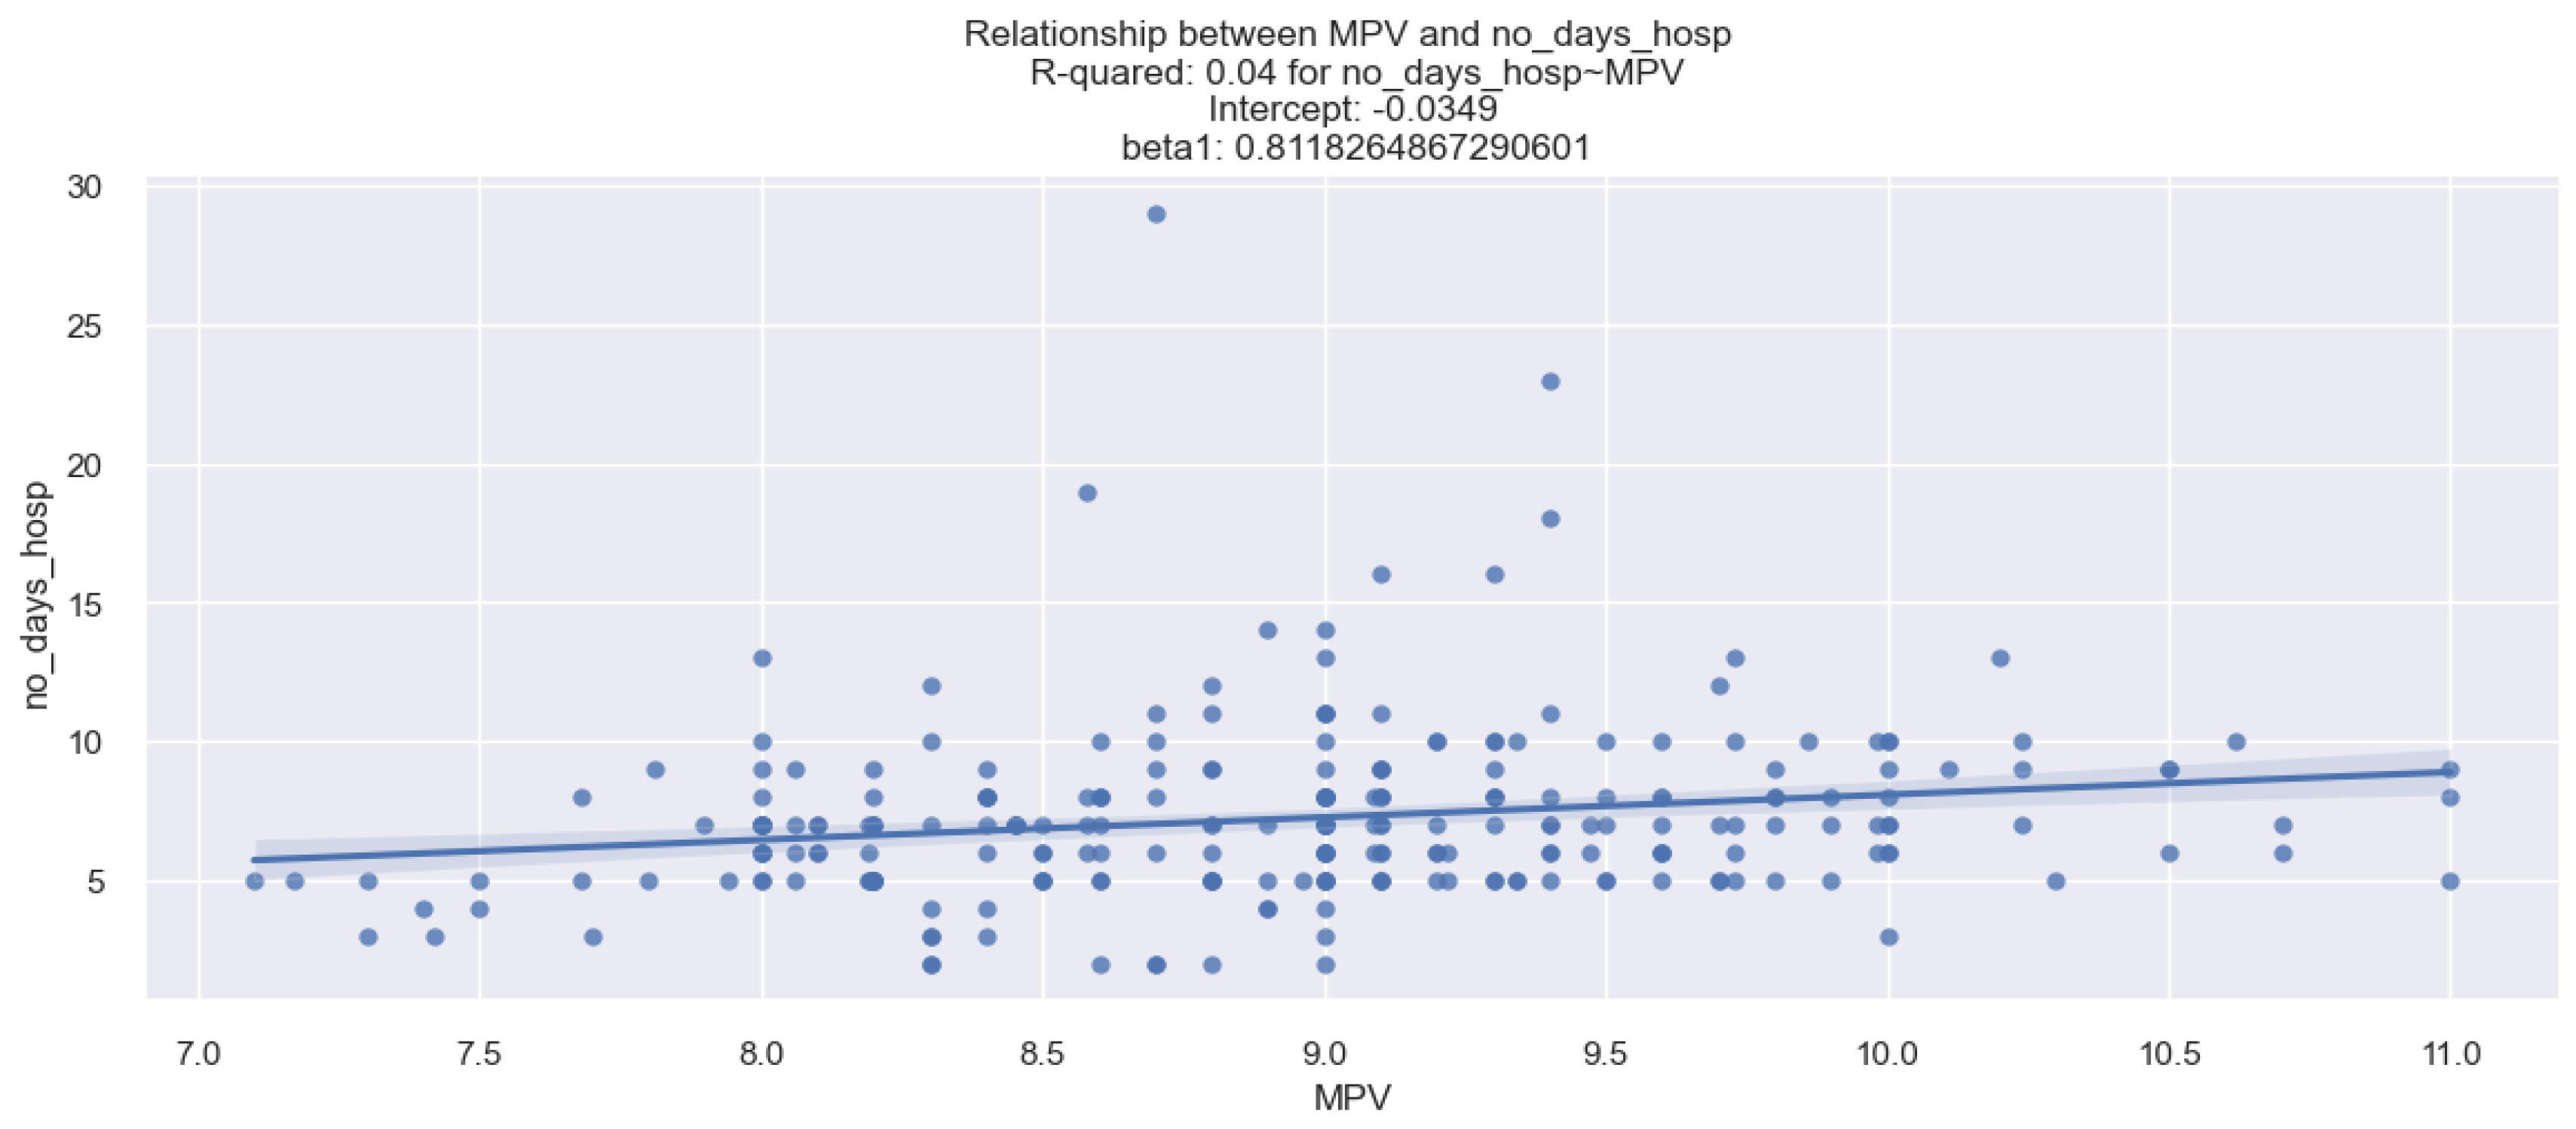
Regarding the relationship between MPV and the number of days of hospitalization in HF patients, in our study, the results showed that a higher MPV was associated with a higher number of days of hospitalization. This phenomenon was demonstrated by applying the linear regression model, the estimated coefficients for which can be found in the table below (
Table 4).
From the data in the table above, we observe the following: (1) an R-square of 0.038 means that 3.8% of the variation in hospitalization days is explained by variation in the MPV value; (2) the coefficient for MPV is 0.8118, which means that when MPV increases by one unit, the number of days of hospitalization increases, on average, by 0.81 days; (3) the fact that the
p-value associated with the coefficient for MPV is 0.002 means that we are not wrong when we say that an increased value of MPV is associated with a higher number of days of hospitalization. This phenomenon is also exemplified in the figure below in which the linear relationship between MPV and the number of days of hospitalization is represented, where a dot represents a patient described by the MPV value and the number of days of hospitalization. From the graphic representation (
Figure 9), we can observe that there was a slight tendency for the number of days of hospitalization to increase as the MPV value increased.
3.5. 3-Month Rehospitalization and MPV Relationship
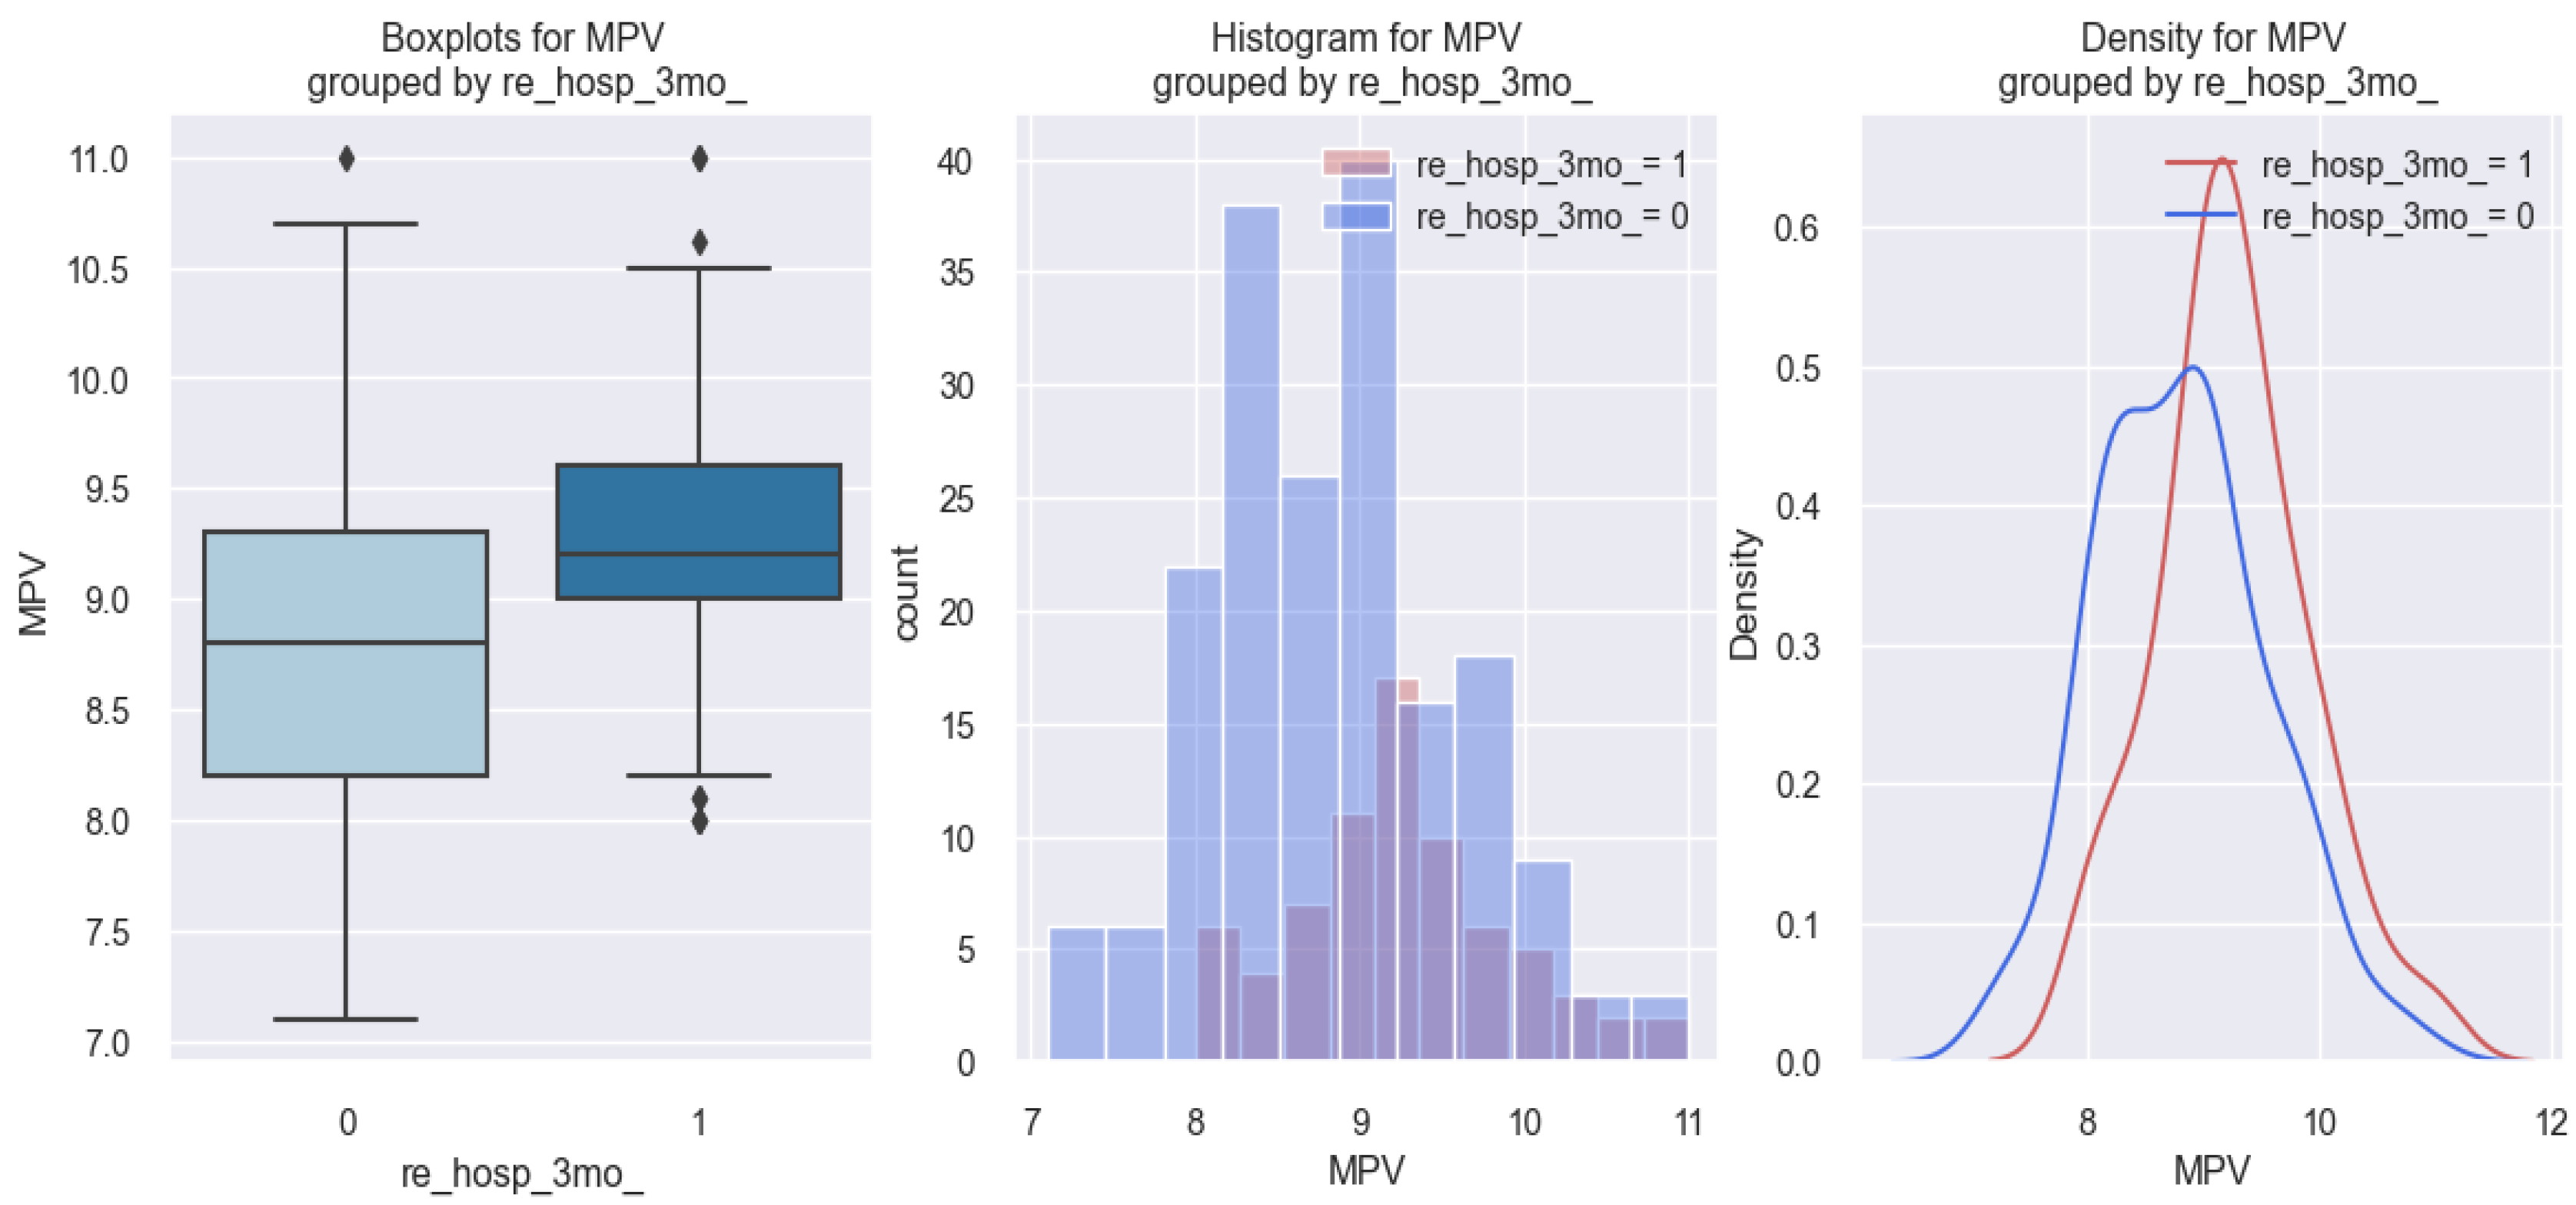
Regarding the relationship between MPV and 3-month rehospitalization studied in the sample of patients with HF in our study, it was found that patients who were rehospitalized at 3 months had a higher MPV value compared to those who were not rehospitalized at 3 months. These data are graphically represented in the figure below (
Figure 10), in which it can be observed that patients with HF rehospitalized at 3 months (1) had a higher MPV value (over 9 fl) compared to those who were not rehospitalized at 3 months (0).
The explanations of the above phenomenon are better conveyed by applying the logistic regression model, the estimated coefficients for which are shown in
Table 5, a model by which we were able to predict the probability that a patient with HF will be rehospitalized at 3 months based on the MPV value.
The model applied in this case is the following: score (event occurrence = 3-month rehospitalization) = −8.4881 + 0.8359 × MPV. Starting from this model, let us assume that we have a patient with an MPV of 9 fl. From here, applying the above-mentioned mathematical formula, the score for this patient is −0.96. To be able to interpret this result in terms of probability, we apply the following equation: . So, the probability of a patient with an MPV of 9 fl is 0.29, representing a 29% chance to be rehospitalized at 3 months.
The mathematical model described above and applied to HF patients rehospitalized at 3 months is statistically significant because the p-value associated with the coefficient for MPV (0.8359) is 0.000.
The results obtained following the applied mathematical formula referred to above, are exemplified graphically in the figure below (
Figure 11), in which we observe that patients with an MPV value of 7 fl had a probability of under 10% to be rehospitalized at 3 months versus patients with an MPV value of 9 fl who had a probability of over 20% to be rehospitalized at 3 months.
Thus, starting from the arguments above, it can be said that, depending on the MPV value, we can predict the probability that a patient with HF will be rehospitalized at 3 months, and that patients with a higher MPV value have a greater probability to be rehospitalized at 3 months compared to patients with a lower MPV value.
3.6. 6-Month Rehospitalization and MPV Relationship
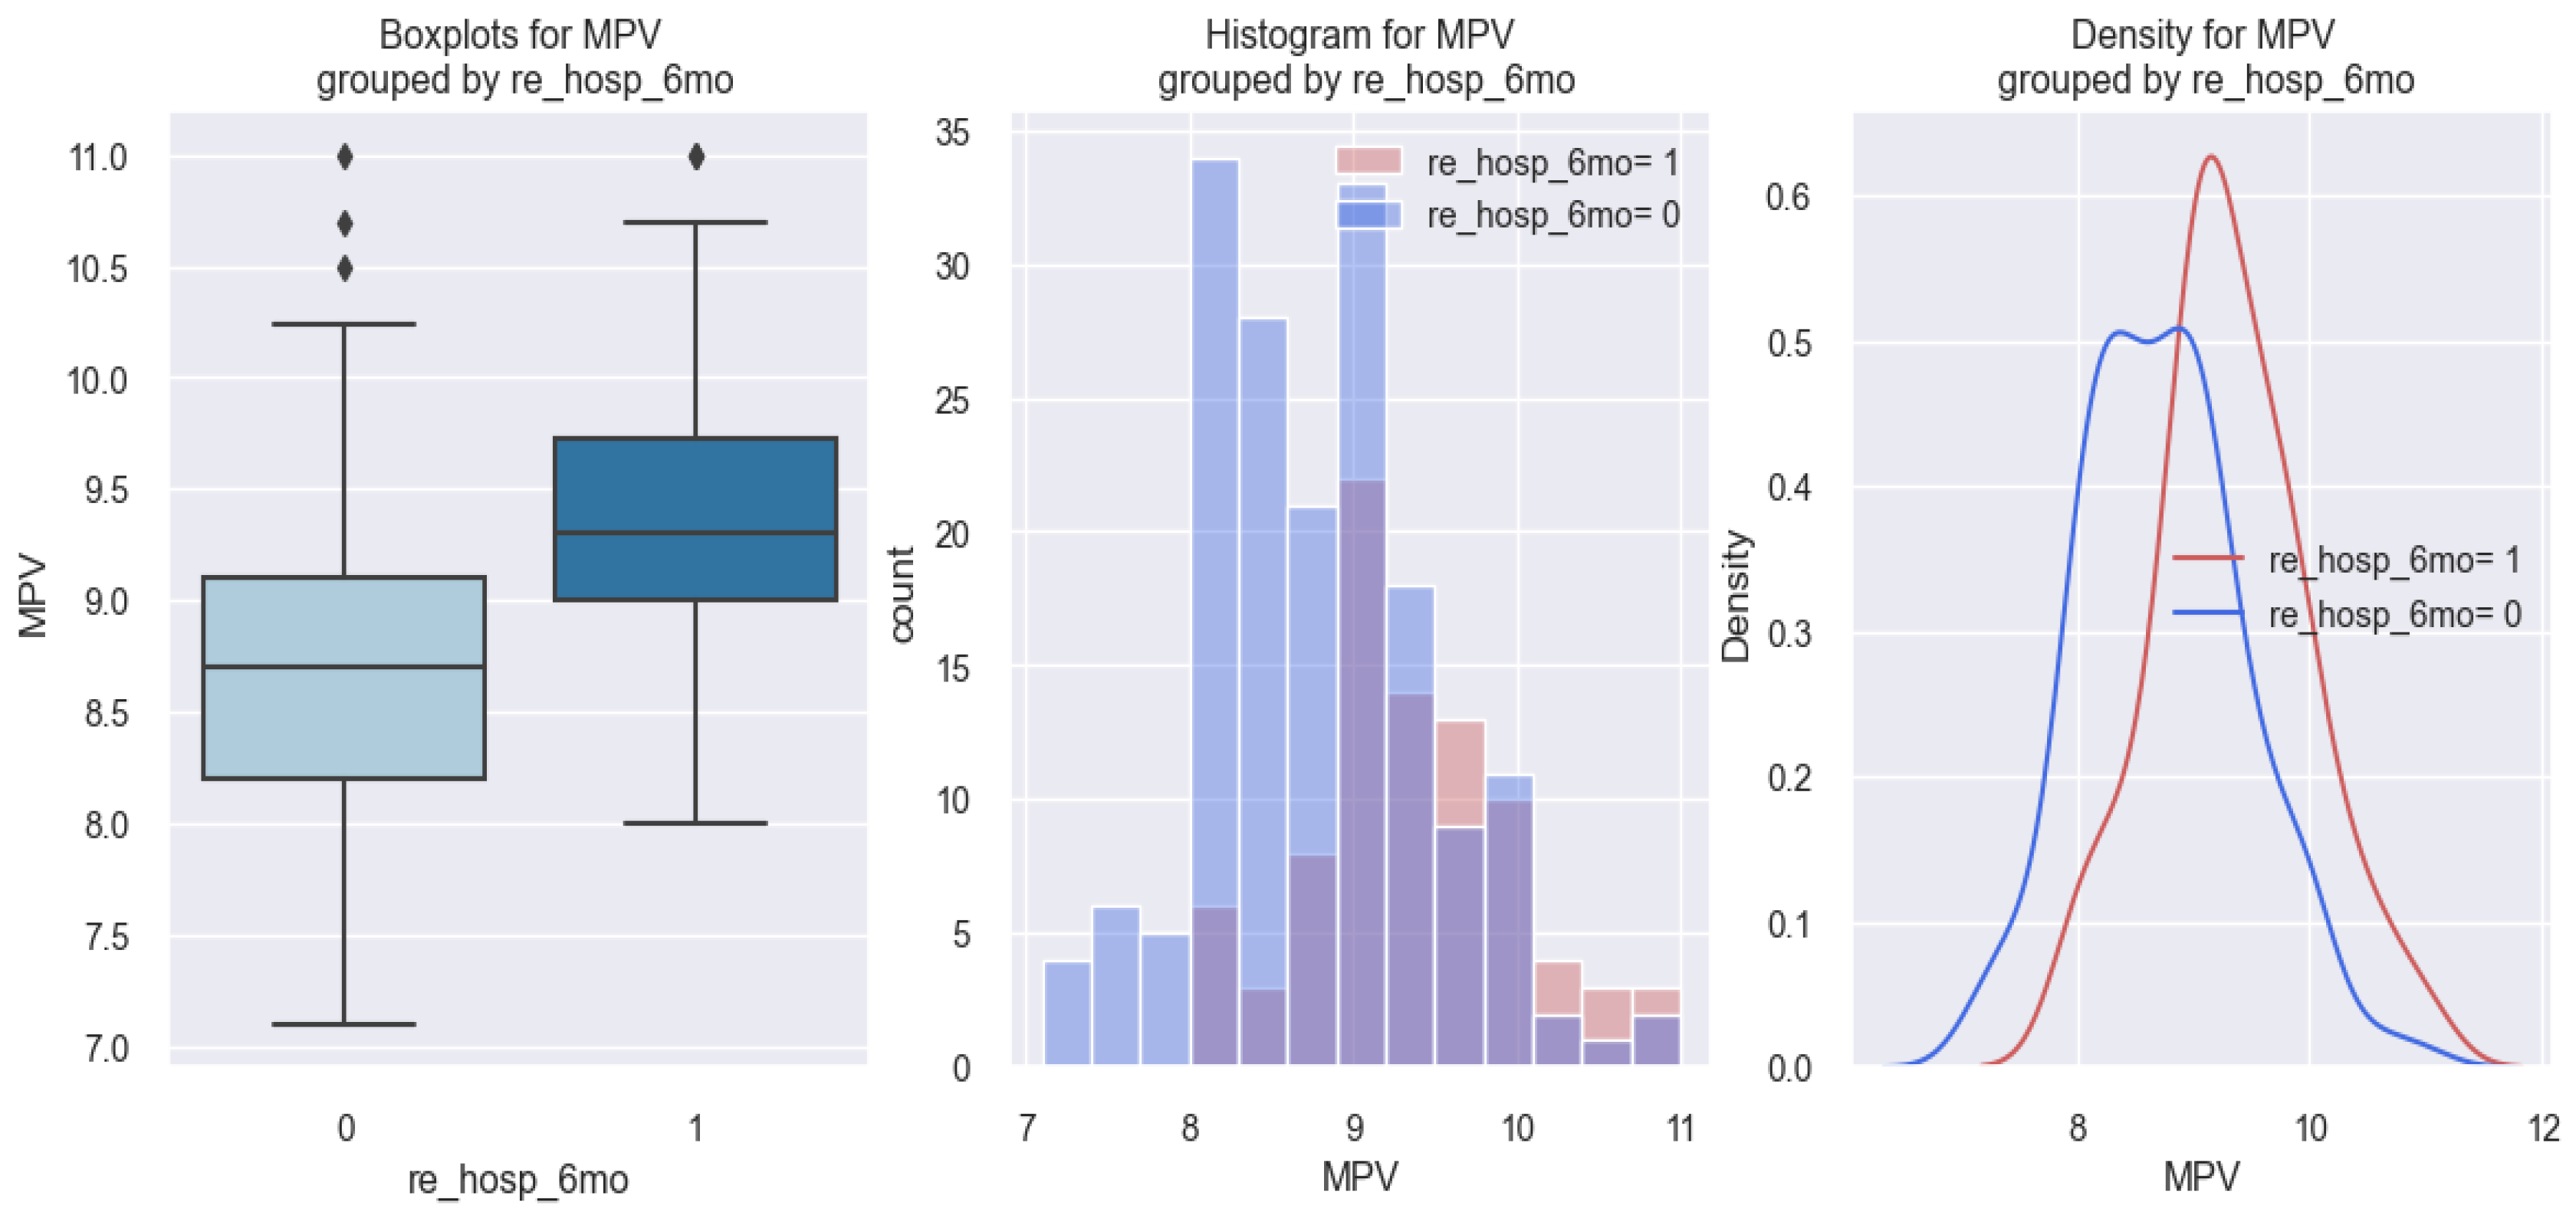
As shown by the statistical results regarding the relationship between MPV and 3-month rehospitalization, significant results were also found regarding the relationship between the MPV value and 6-month rehospitalization, revealing the fact that patients with HF who were rehospitalized at 6 months had a higher MPV value compared to those who were not rehospitalized at 6 months. These results are better illustrated graphically in the figure below (
Figure 12), in which it can be observed in all three graphs that patients with HF rehospitalized at 6 months (1) had a higher MPV value (over 9 fl) compared to those who were not rehospitalized at 6 months (0) and who had MPV values below 9 fl.
The explanations of the above phenomena are better argued by applying the logistic regression model, the estimated coefficients for which are shown in
Table 6, a model by which we were able to predict the probability that a patient with HF will be rehospitalized at 6 months based on MPV value.
The model applied in this case is the following: score (event occurrence = 6-month rehospitalization) = −11.3908 + 1.1836 × MPV. Starting from this model, let us assume that we have a patient with an MPV value of 10 fl. From here, applying the above-mentioned mathematical formula, it turns out that the score for this patient is 0.44. Applying the following equation: , we obtain that the probability of the patient with an MPV of 10 fl is 0.61, representing a 61% chance to be rehospitalized at 6 months.
The above mathematical model applied to HF patients rehospitalized at 6 months is statistically significant because the
p-value associated with the coefficient for MPV (1.1836) is 0.000. The results obtained following the application of the above-mentioned mathematical formula are illustrated graphically in the figure below (
Figure 13), in which it can be seen that, as the MPV value increases, the probability that a patient with HF will be rehospitalized at 6 months also increases.
Thus, starting from the arguments above, it can be said that, depending on the MPV value, we can predict the probability that a patient with HF will be rehospitalized at 6 months, and that patients with a higher MPV value have a greater probability of being rehospitalized at 6 months compared to patients with a lower MPV value.
3.7. 1-Year Mortality and MPV Value Relationship
As for the results regarding the relationship between MPV and rehospitalization at 3 and 6 months, based on the value of MPV, we applied the logistic regression model to identify a statistical link between the MPV value and 1-year mortality in patients with HF. The statistical results regarding this hypothesis were revealing, indicating that patients with HF who died 1 year after the previous discharge versus patients who did not die after 1 year had a higher MPV value. The data obtained are shown numerically in
Table 7 and graphically in
Figure 14.
By applying the logistic regression model, the estimated coefficients for which are shown in
Table 7, we were able to predict the probability of a patient with HF dying at 1 year based on the MPV value.
The model applied in this case is the following: score (event occurrence = mortality at 1 year) = −8.6367 + 0.7459 × MPV. To be able to interpret the results as probabilities, we apply the following equation: .
The mathematical model described and applied above to HF patients who died at 1 year is statistically significant because the
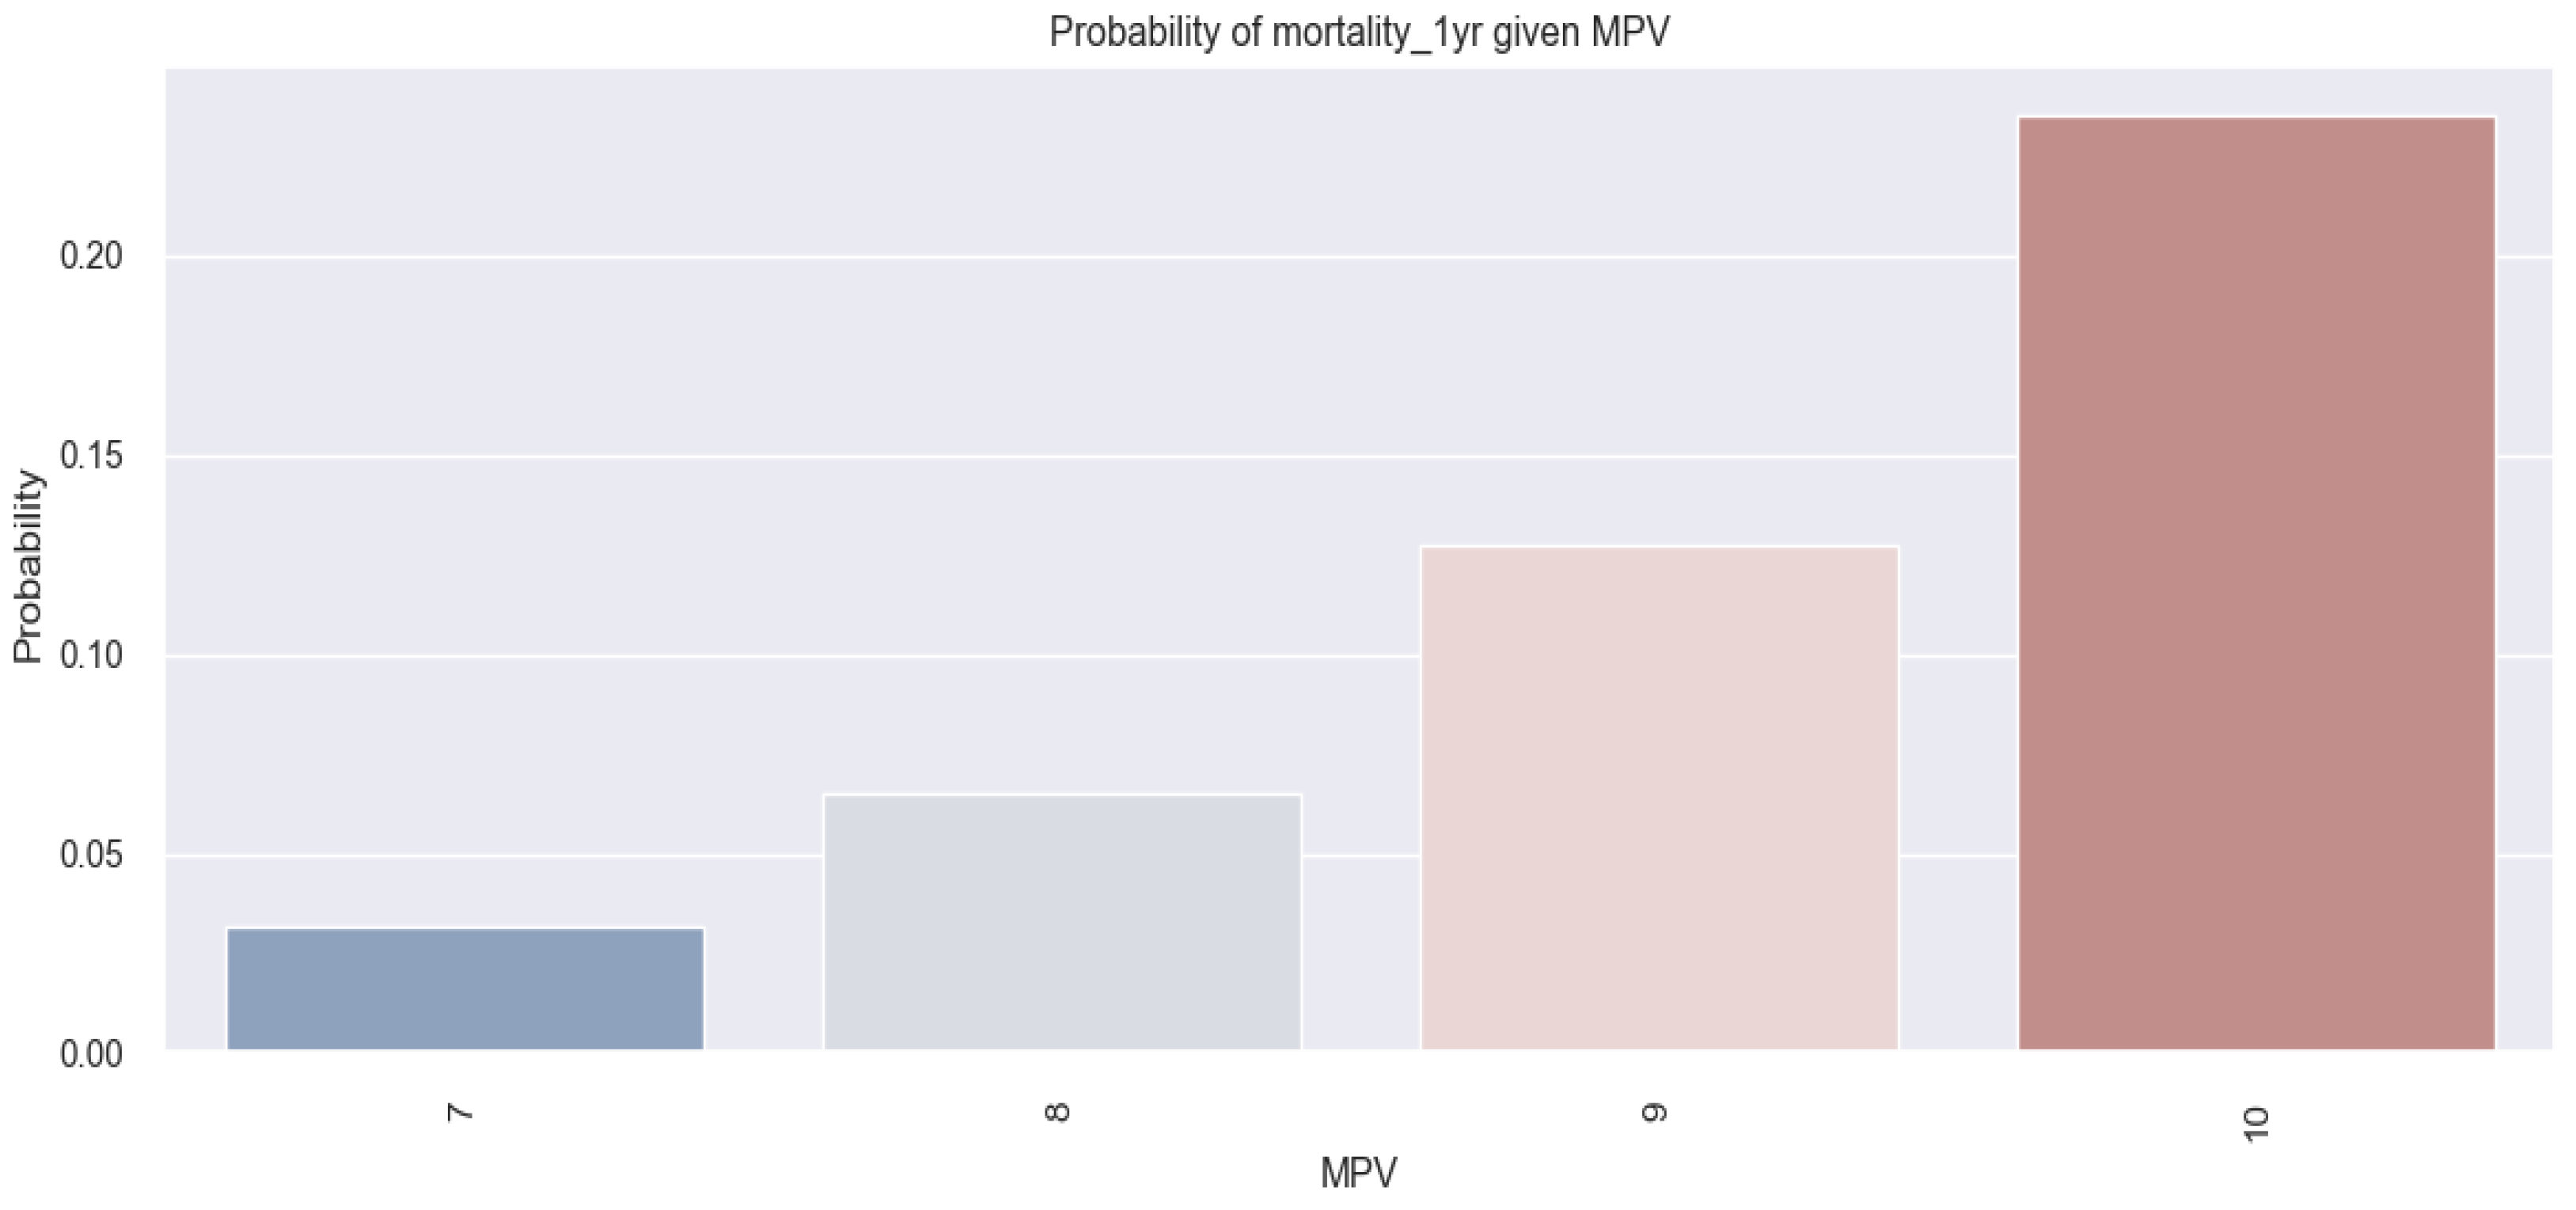
p-value associated with the coefficient for MPV (0.7459) is 0.003. The results obtained following the application of the above-mentioned mathematical formula are illustrated graphically in the figure below (
Figure 14), in which it can be seen that, as the MPV value increases, the probability that an HF patient will die at 1 year also increases (patients with an MPV value of 7 fl had a probability below 5% to die at 1 year versus patients with an MPV value of 9 fl who had a probability of over 10%). Thus, we can predict the probability that a patient with HF will die at 1 year based on the MPV value, and state that the probability of this event increases as the value of the MPV increases.
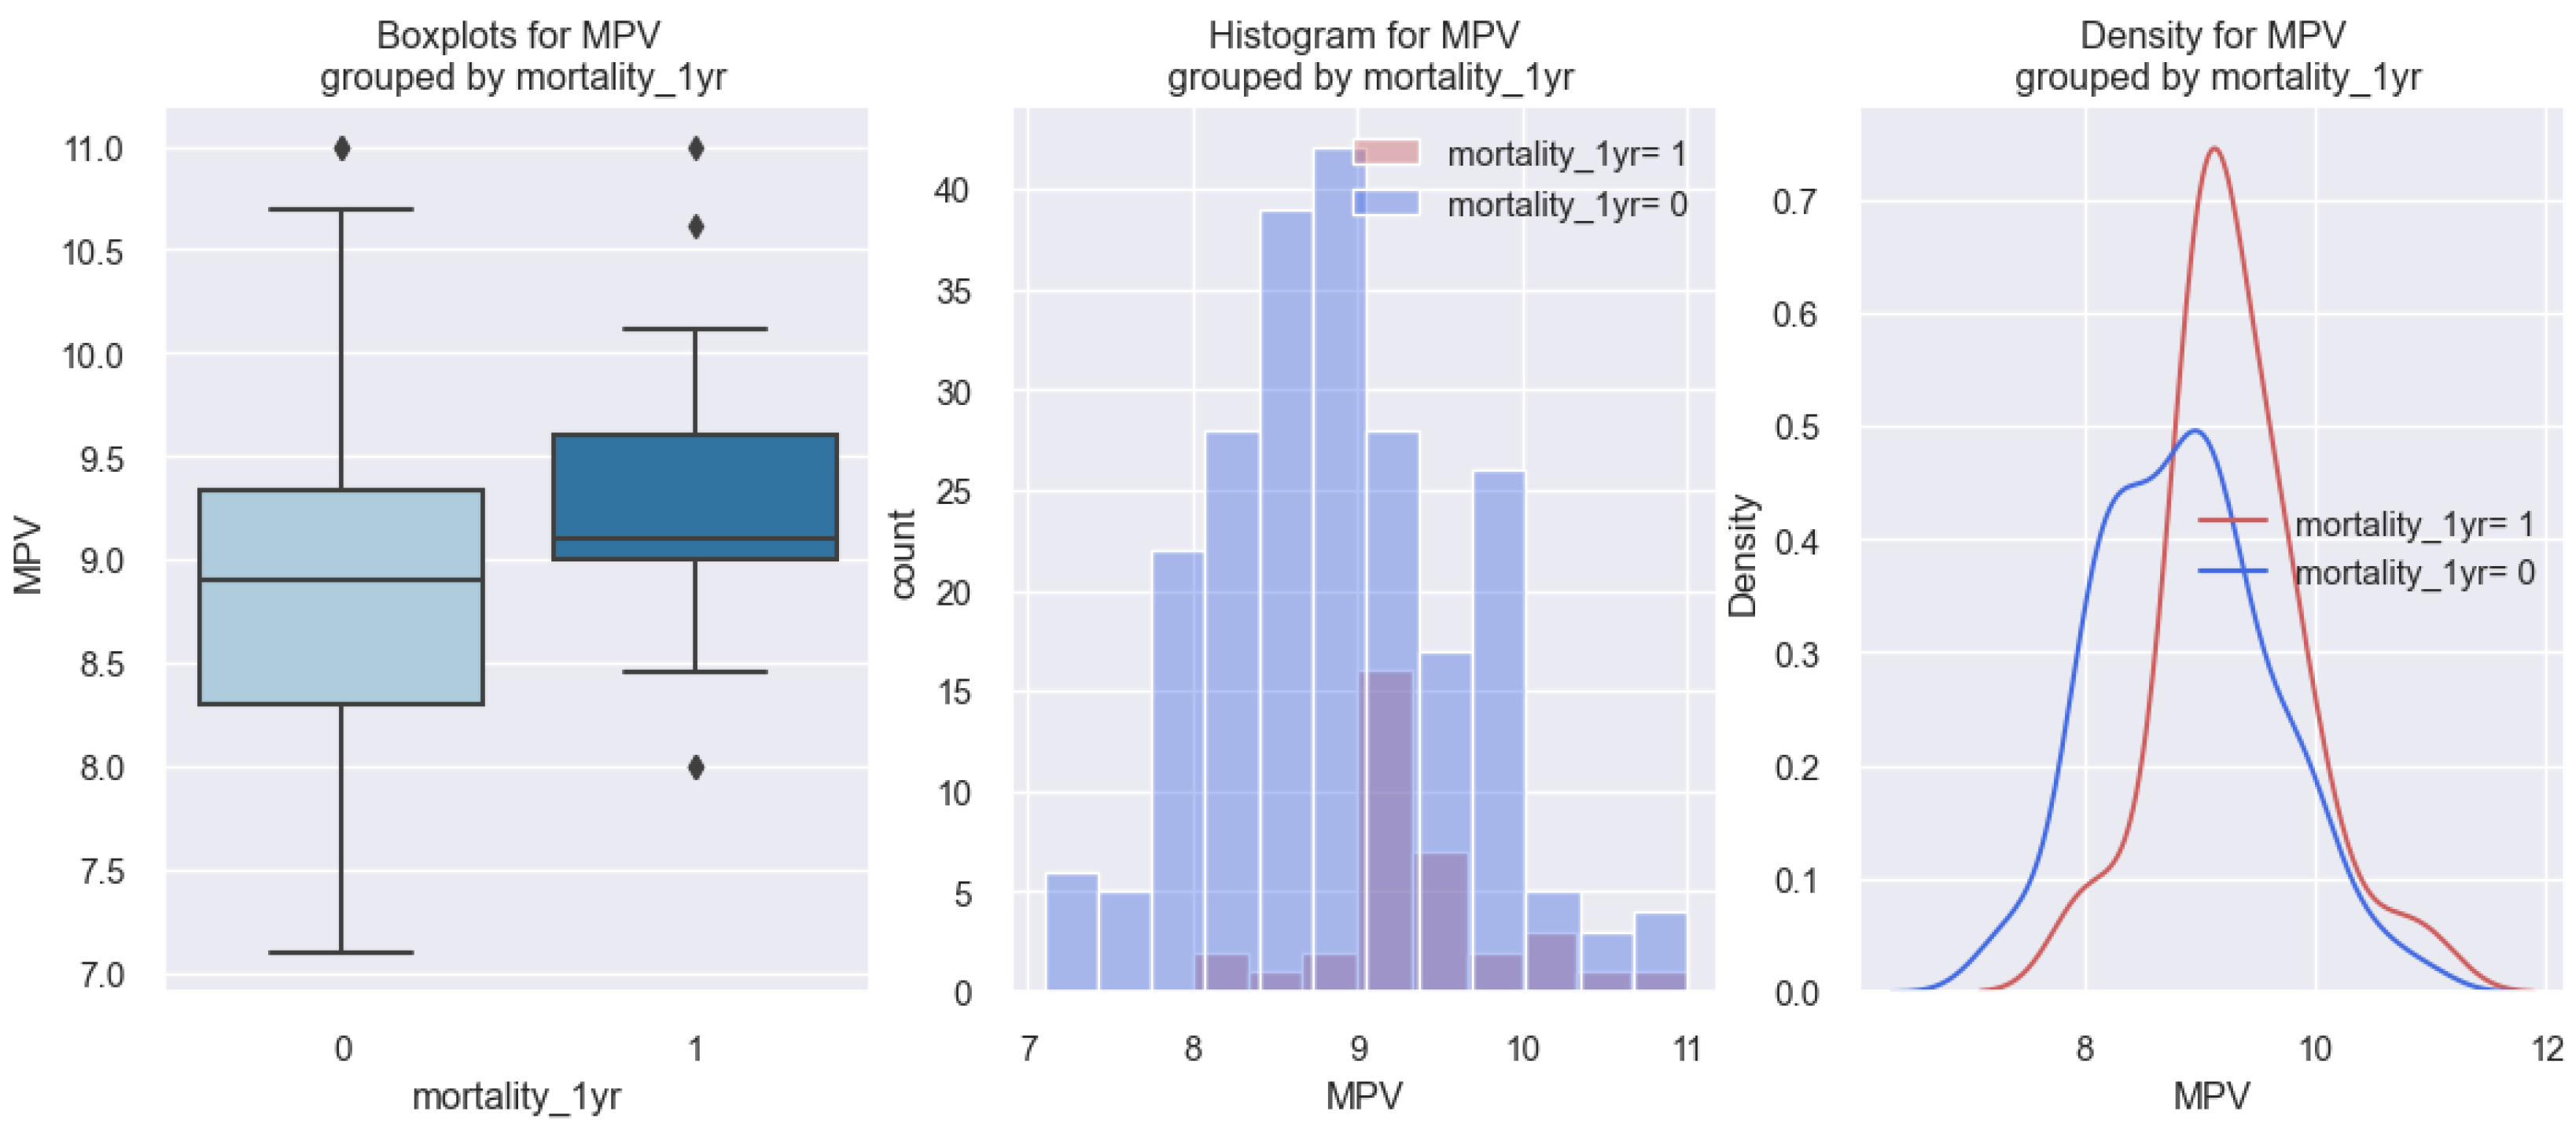
At the same time, this phenomenon is illustrated in the graphs represented in
Figure 15, in which it can be observed that patients with HF who died at 1 year (1) had a higher MPV value (over 9 fl) compared to those who did not die at 1 year (0).
3.8. In-Hospital Death and MPV Relationship
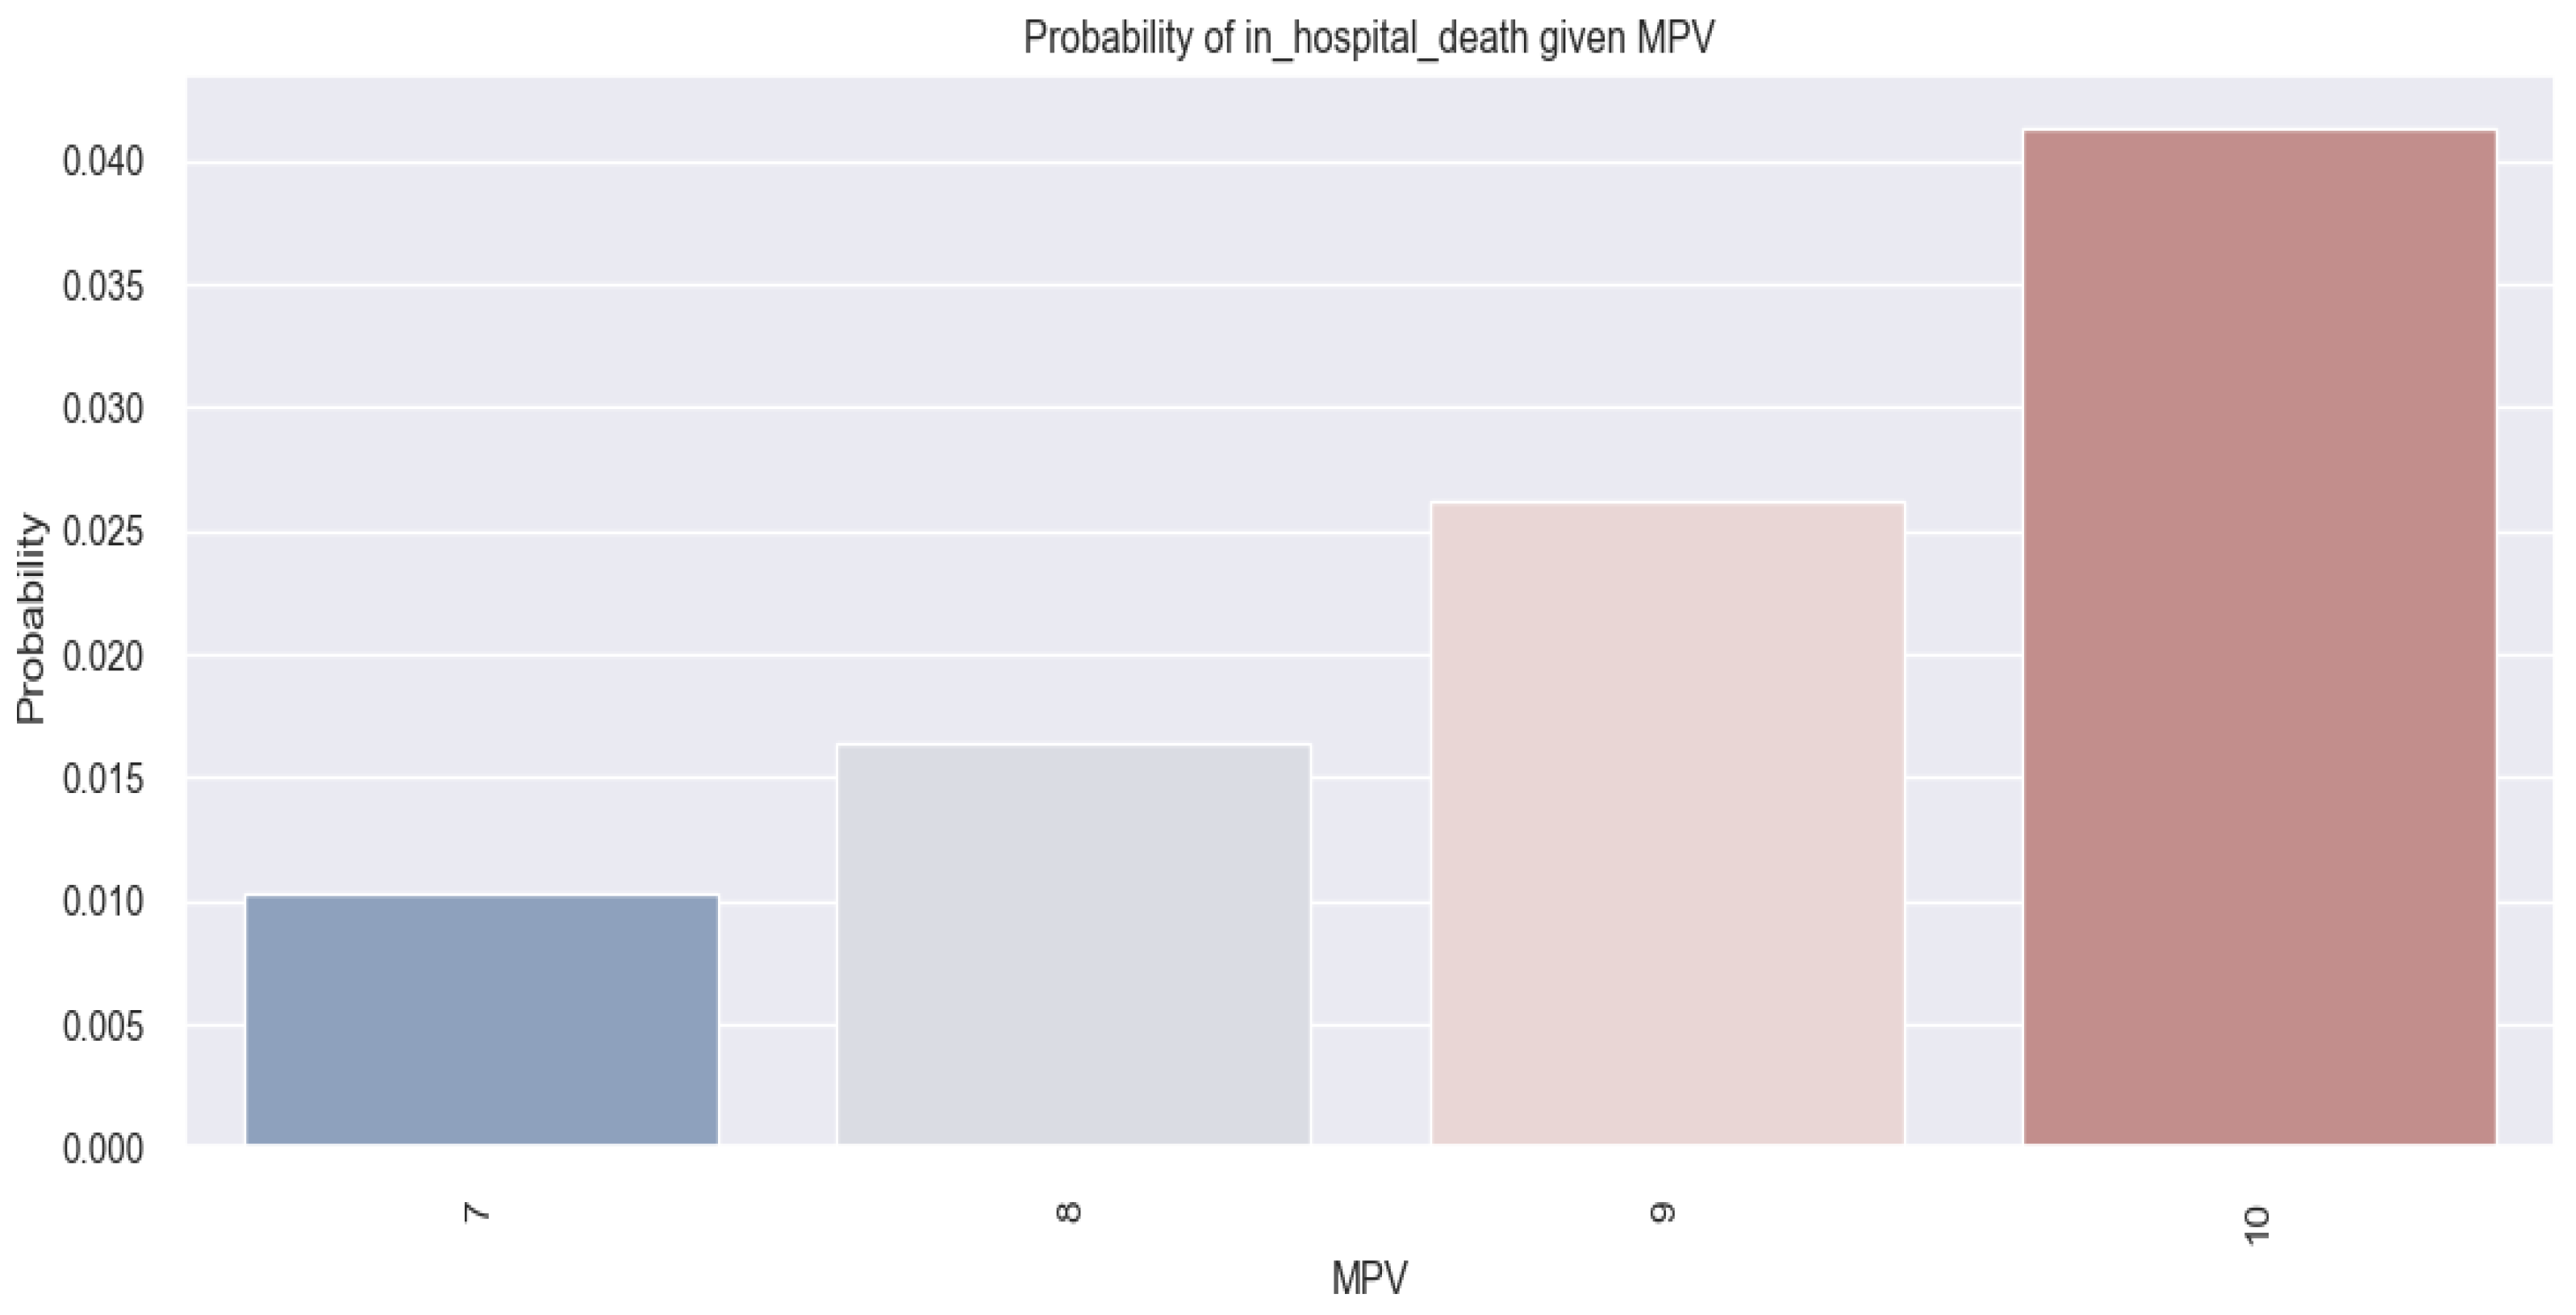
In contrast to the statistical results obtained for HF patients who died at 1 year based on the MPV value, regarding the hypothesis that HF patients who died in hospital would have a higher MPV value, the statistical results are not promising.
By applying the logistic regression model, the estimated coefficients for which are shown in the table below (
Table 8), the results did not show that there was a link between the value of MPV and in-hospital death in patients with HF, since the
p-value associated with the coefficient for MPV (0.4739) is 0.344 and, therefore, statistically insignificant.
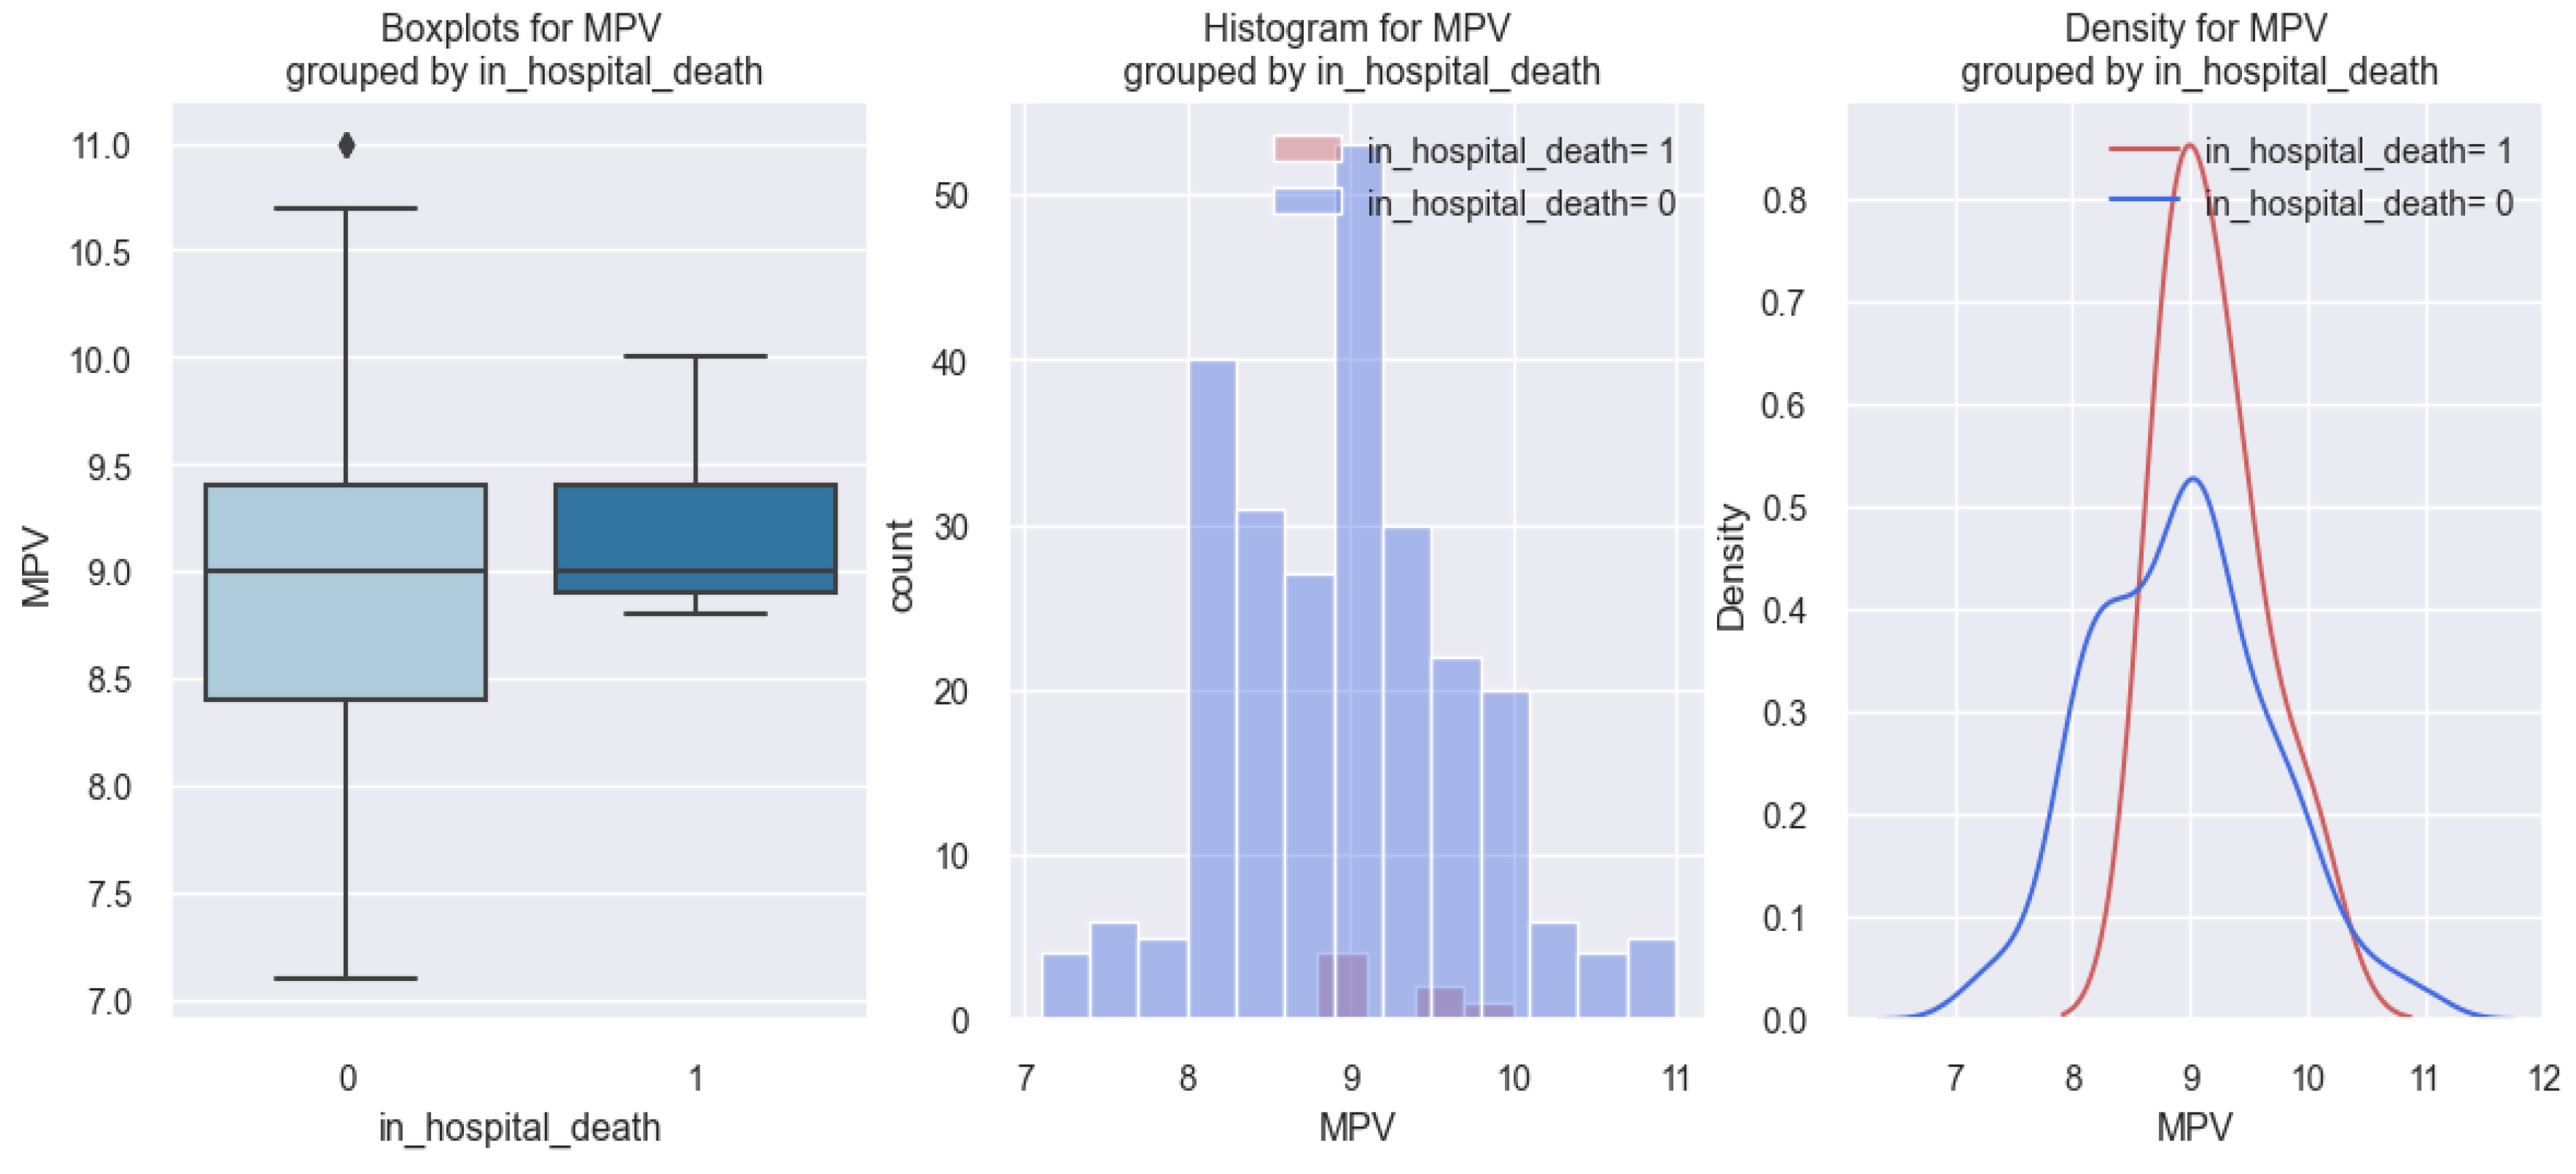
The above-mentioned results are illustrated in all three graphs represented in the figure below (
Figure 16), which imply the same conclusion, according to which there is no clear relationship between HF patients who died in hospital and MPV value. In the first graph of the figure, we observe that there was no significant difference in the MPV value between HF patients who died in the hospital compared to those who did not die in the hospital. The same information can be deduced from the second and third graphs.
Although the above results do not indicate that there was a very clear relationship between MPV and in-hospital death in HF patients, it can be seen in
Figure 17 that, as the MPV value increases, there is a minimal increase in the probability of the HF patients dying in hospital (10% probability for patients with an MPV value of 7 fl versus 41% probability for patients with an MPV value of 10 fl).
4. Discussion
Our study was focused only on mean platelet volume (MPV) in the population of patients with heart failure (HF). In the current medical literature, there are few related studies cited, including the study conducted by Hakki Kaya et al. [
11], the study conducted by Kandis Hayati et al. [
12], and the one conducted by Bianca Dahlen et al. [
14], all of which demonstrated that MPV could be a prognostic parameter in HF patients.
The main objective of our research was to introduce new thinking to the current medical research regarding MPV as a prognostic parameter in HF. Knowing that a simple parameter such as MPV could provide us with information regarding the prognosis of HF patients is of importance because through it we could identify HF patients at risk and, therefore, treat them in advance to prevent negative events.
Our statistical results, which revealed that patients with decompensated chronic HF (class IV NYHA HF and APE) had higher MPV values compared to patients with stable chronic HF (class II NYHA), support the results from the study conducted by Hayati Kandis et al. [
12], which showed that patients with decompensated HF had higher values than patients with stable HF. However, the novelty of our study compared to the one conducted by Hayati Kandis was the use of regression model analysis by which we were able to determine the probability of an HF patient having decompensated or stable HF based on the MPV value.
Regarding the negative event in HF represented by mortality, compared to the results from the study conducted by Hayati Kandis et al. [
12], which showed that HF patients who died at 6 months or died in hospital had higher MPV values, the results from our study revealed that patients with HF who died at 1 year had higher MPV values compared to those who did not die at 1 year, but, regarding in-hospital death, our results were not promising. A possible explanation for this phenomenon, according to which we could not demonstrate a clear relationship between the MPV value and in-hospital death, is that the patients in our study sample who died in-hospital were of a lower number compared to those who did not die in-hospital, as can be seen in
Figure 16, which shows very clearly that patients who died in hospital were of a very small number. Hence, compared to the study conducted by Hayati Kandis et al., the novel contribution of our study is represented by the identification of a significant relationship between an increased value of MPV and 3-month and 6-month hospitalization, 1-year mortality, and increased length of in-hospital stay. These findings were determined using regression model analysis through which we were able to estimate the probability of an HF patient having a negative prognosis (rehospitalization or 1-year mortality) based on the MPV value.
Another study cited in the medical literature regarding the prognostic impact of MPV in HF patients was the one conducted by Hakki Kaya et al. [
11], which focused on patients with stable HF in sinus rhythm and revealed that patients who had frequent hospitalizations had MPV values above 9.1 fl. Our study showed that HF patients who were rehospitalized at 3 or 6 months had MPV values above 9 fl, and, therefore, support the results obtained in the study conducted by Hakki Kaia. In contrast to Hakki Kaya’s study, the novel aspects of our study are represented by the following: (1) our study included, in addition, patients with decompensated HF; (2) our study revealed that patients with decompensated HF had higher MPV values compared to those with stable HF; (3) our study data demonstrated a statistically significant relationship between an increased MPV value and the probability of 3-month or 6-month rehospitalization, 1-year mortality and the probability of prolonged length of in-hospital stay.
Furthermore, with regard to the relationship between MPV and negative outcomes in HF patients, the results from our research support those obtained in the study conducted by Bianca Dahlen et al. [
14], which showed that increased levels of MPV were associated with worse outcomes in patients with HF, defined by cardiac death and hospitalization. In comparison to the latter study, which was a study conducted prospectively on 3289 patients, the limitations of our study are represented by our study design (retrospective study), and by the number of patients (260 patients) included in our study. Even though our research has the limitations highlighted, our results support the findings obtained in the study conducted by Bianca D. et al. [
14], since our study demonstrated that increased levels of MPV were encountered in patients with HF who were rehospitalized at 3 months, 6 months, or who died at 1 year.
According to the medical literature, patients with classes III NYHA HF, IV NYHA HF, or acute pulmonary edema (APE), are included in the category of decompensated HF [
2]. Regarding the relationship between MPV value and the type of HF, our study revealed that, from the category of patients with decompensated HF, only patients with class IV NYHA HF and APE had higher MPV values (over 9 fl) compared to patients with class III NYHA HF, who had similar results to patients with class II NYHA HF (MPV values below 9 fl). These results are not exactly contradictory since, compared to patients with class IV NYHA HF or APE whose clinical presentation is severe, the clinical presentation of patients with class III NYHA HF is relatively similar to the clinical presentation of patients with class II NYHA HF who have minimal signs and symptoms.
The strength of our study in comparison to the cited studies mentioned above is provided by the regression model analysis through which we could estimate the probability of a negative event happening (i.e., 3-month and 6-month rehospitalization, 1-year mortality, prolonged in-hospital stay), and also the probability of a patient having decompensated heart failure, based on the MPV value. Considering these results, we can state that, based on MPV value, we may be able to identify HF patients at risk of having a poor outcome, and, therefore, apply an aggressive management approach.
There are several limitations to our study as follows: (1) the study was conducted in a retrospective manner, which involved data collection from the hospital’s system database, and, therefore, there is the possibility of bias with respect to the selection of patients; (2) certain values of MPV could be influenced by the collection and processing of blood samples performed retrospectively, and, therefore, by human error.
We intend in our future research to eliminate these limitations by conducting the research in a prospective manner and, therefore, to achieve better control of blood sample collection, and to improve the statistical strength by increasing the number of patients and studying other platelet indices as possible prognostic factors in HF patients.


