
What Indicators Are Shaping China’s National World-Class High-Tech Zones? Constructing a Feature Indicator System Based on Machine Learning


Abstract
:1. Introduction
2. Literature Review
2.1. Theoretical Research on China’s National High-Tech Zones
2.2. Research on the Evaluation of High-Tech Zones
3. Evaluation Data and Related Algorithms
3.1. Data Sources
3.2. Data Standardization Processing
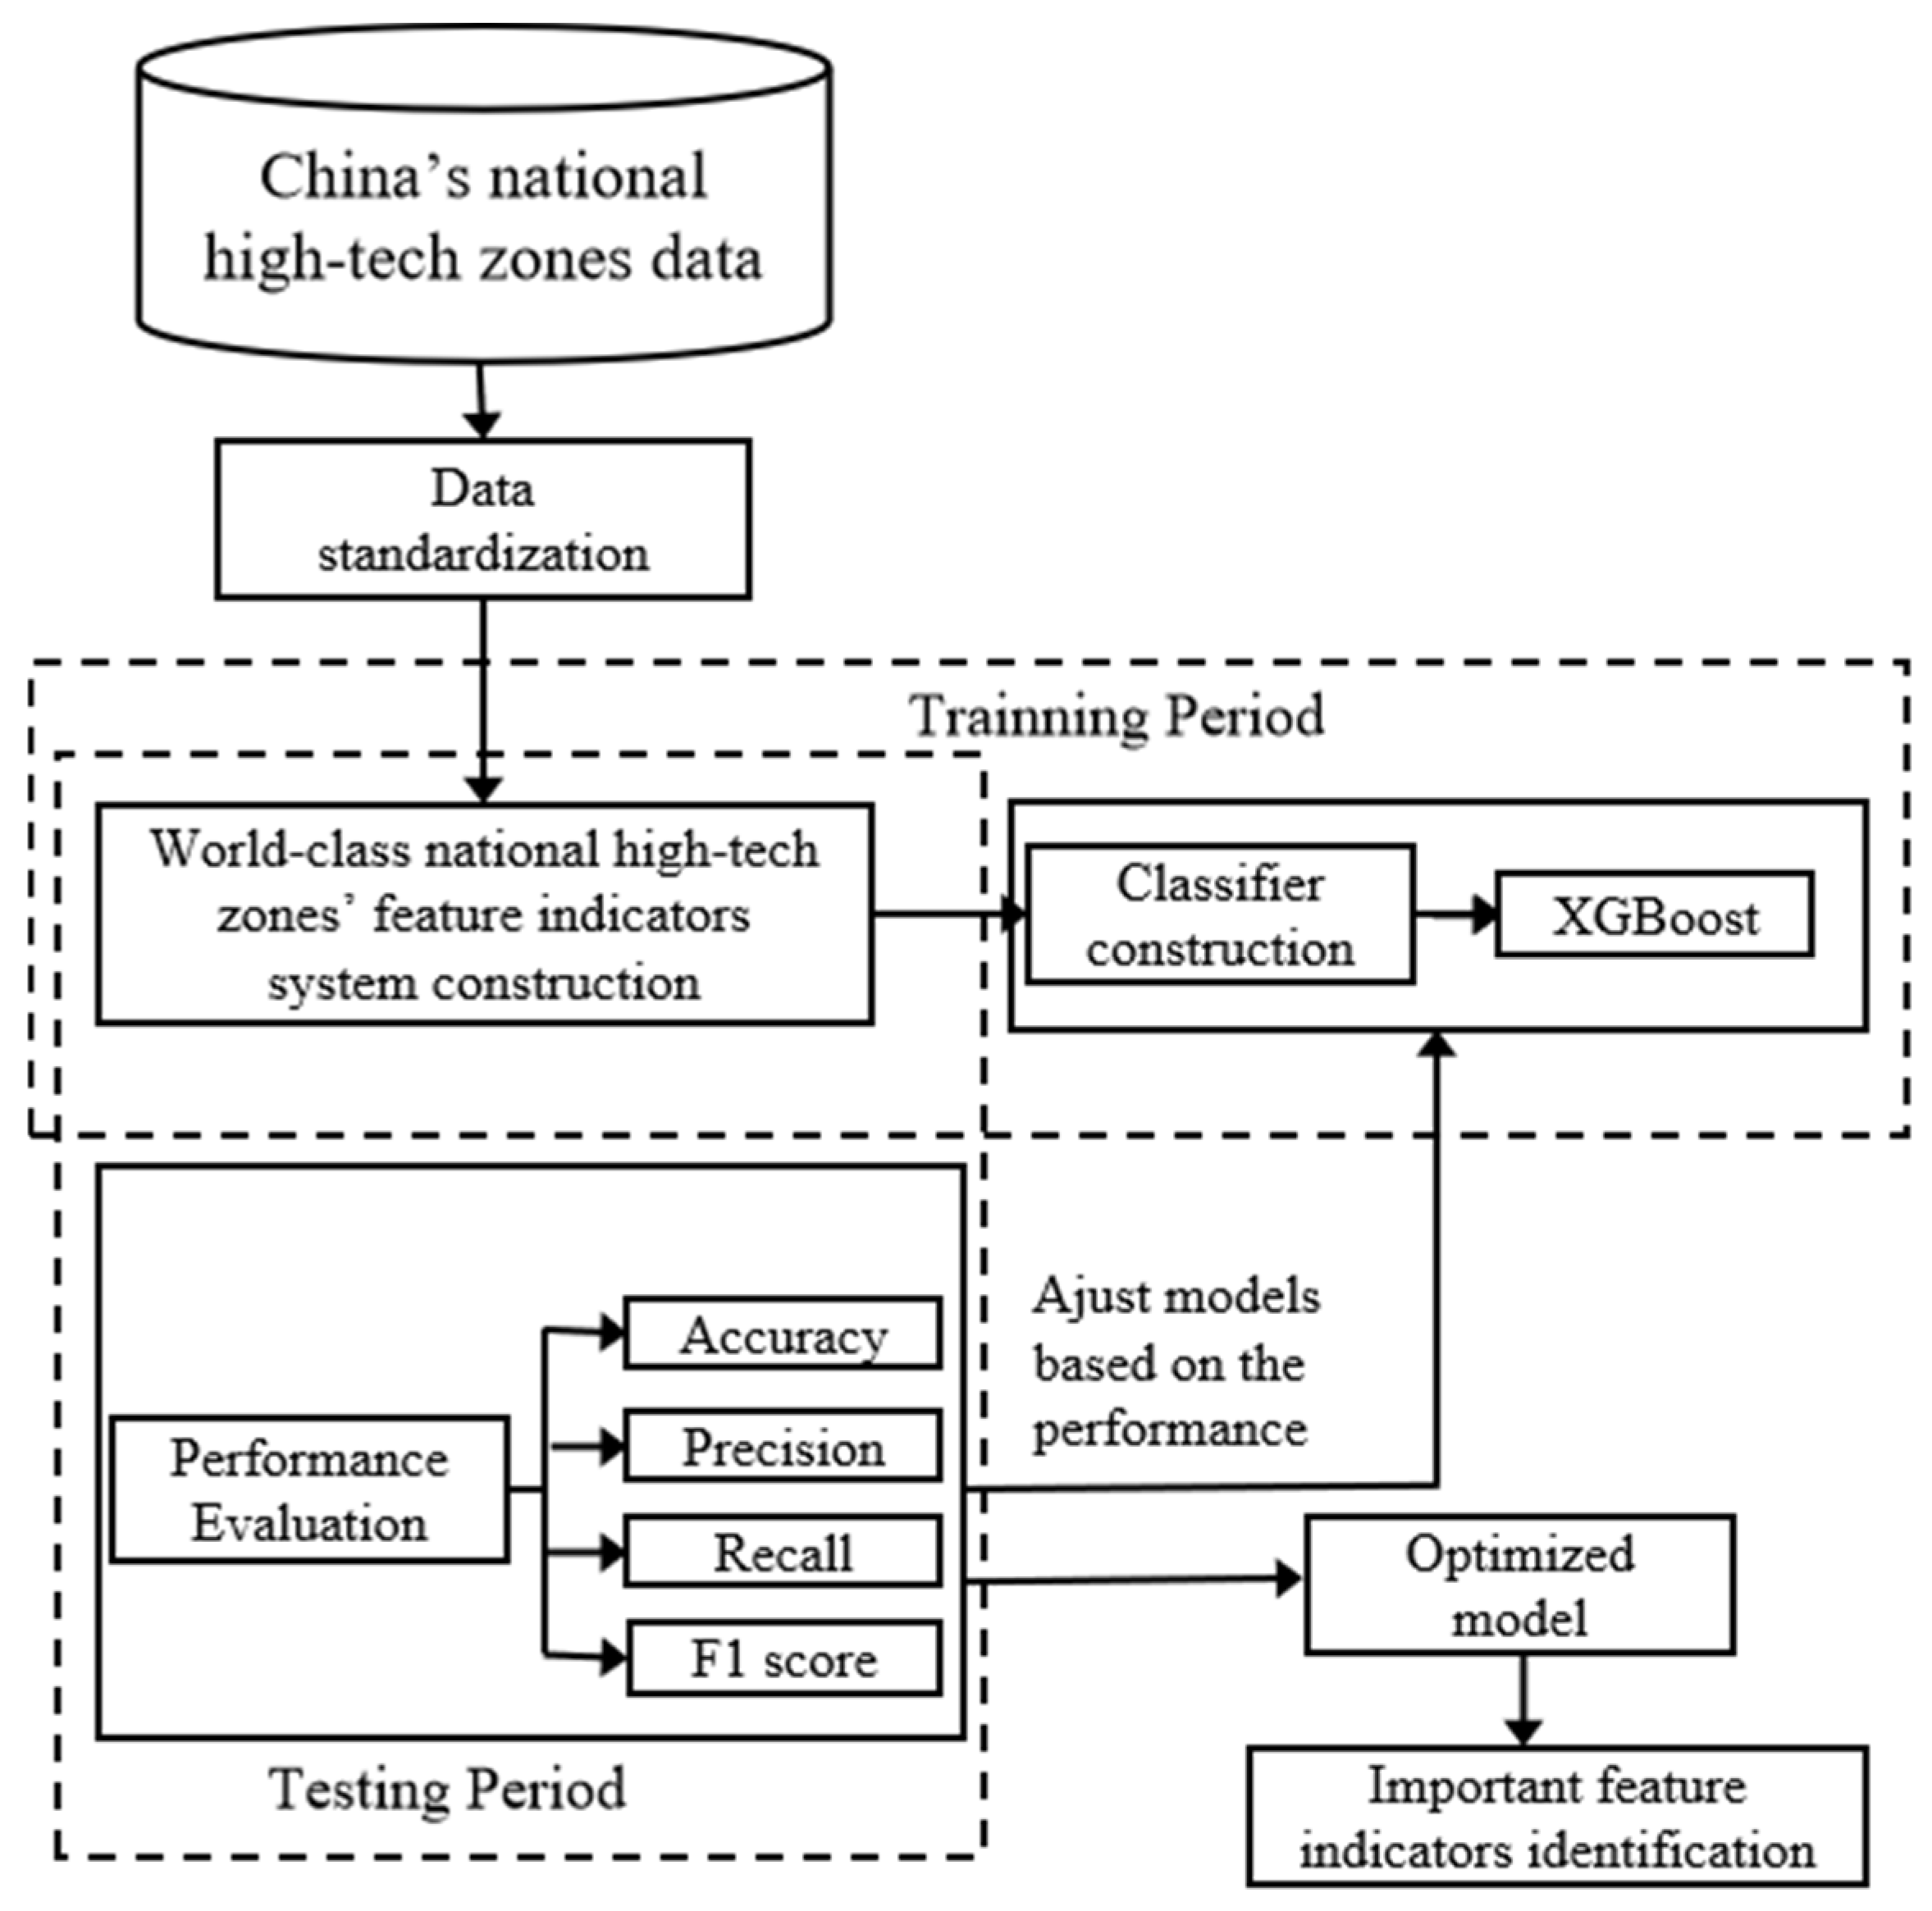
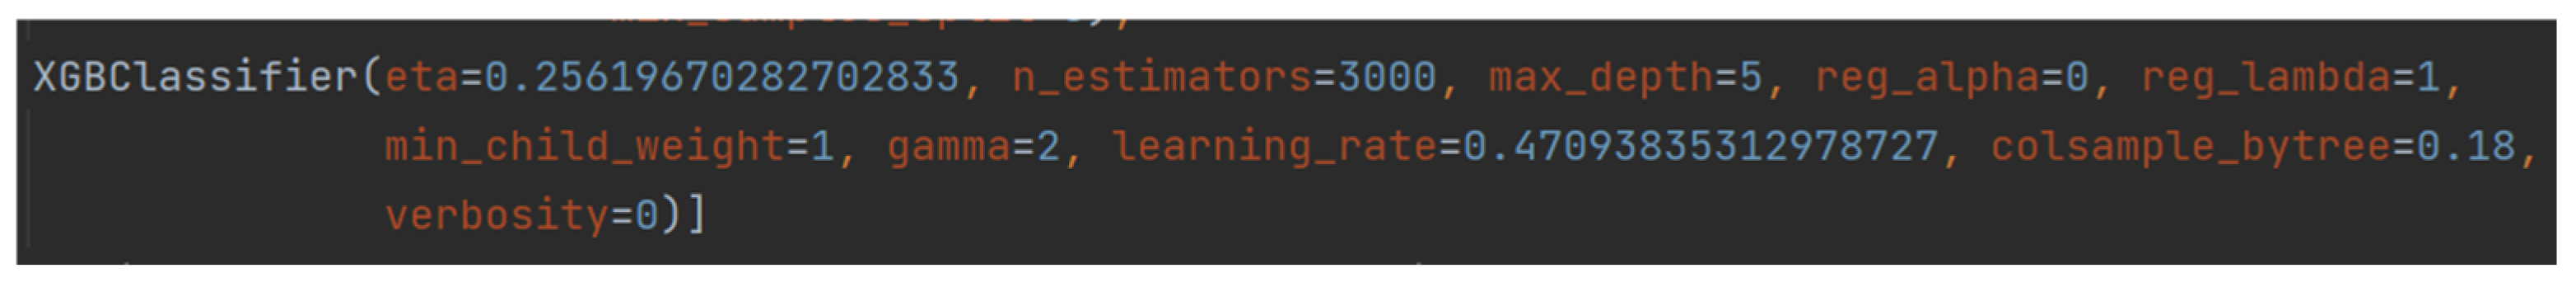
3.3. XGBoost Algorithm and Application
4. Results
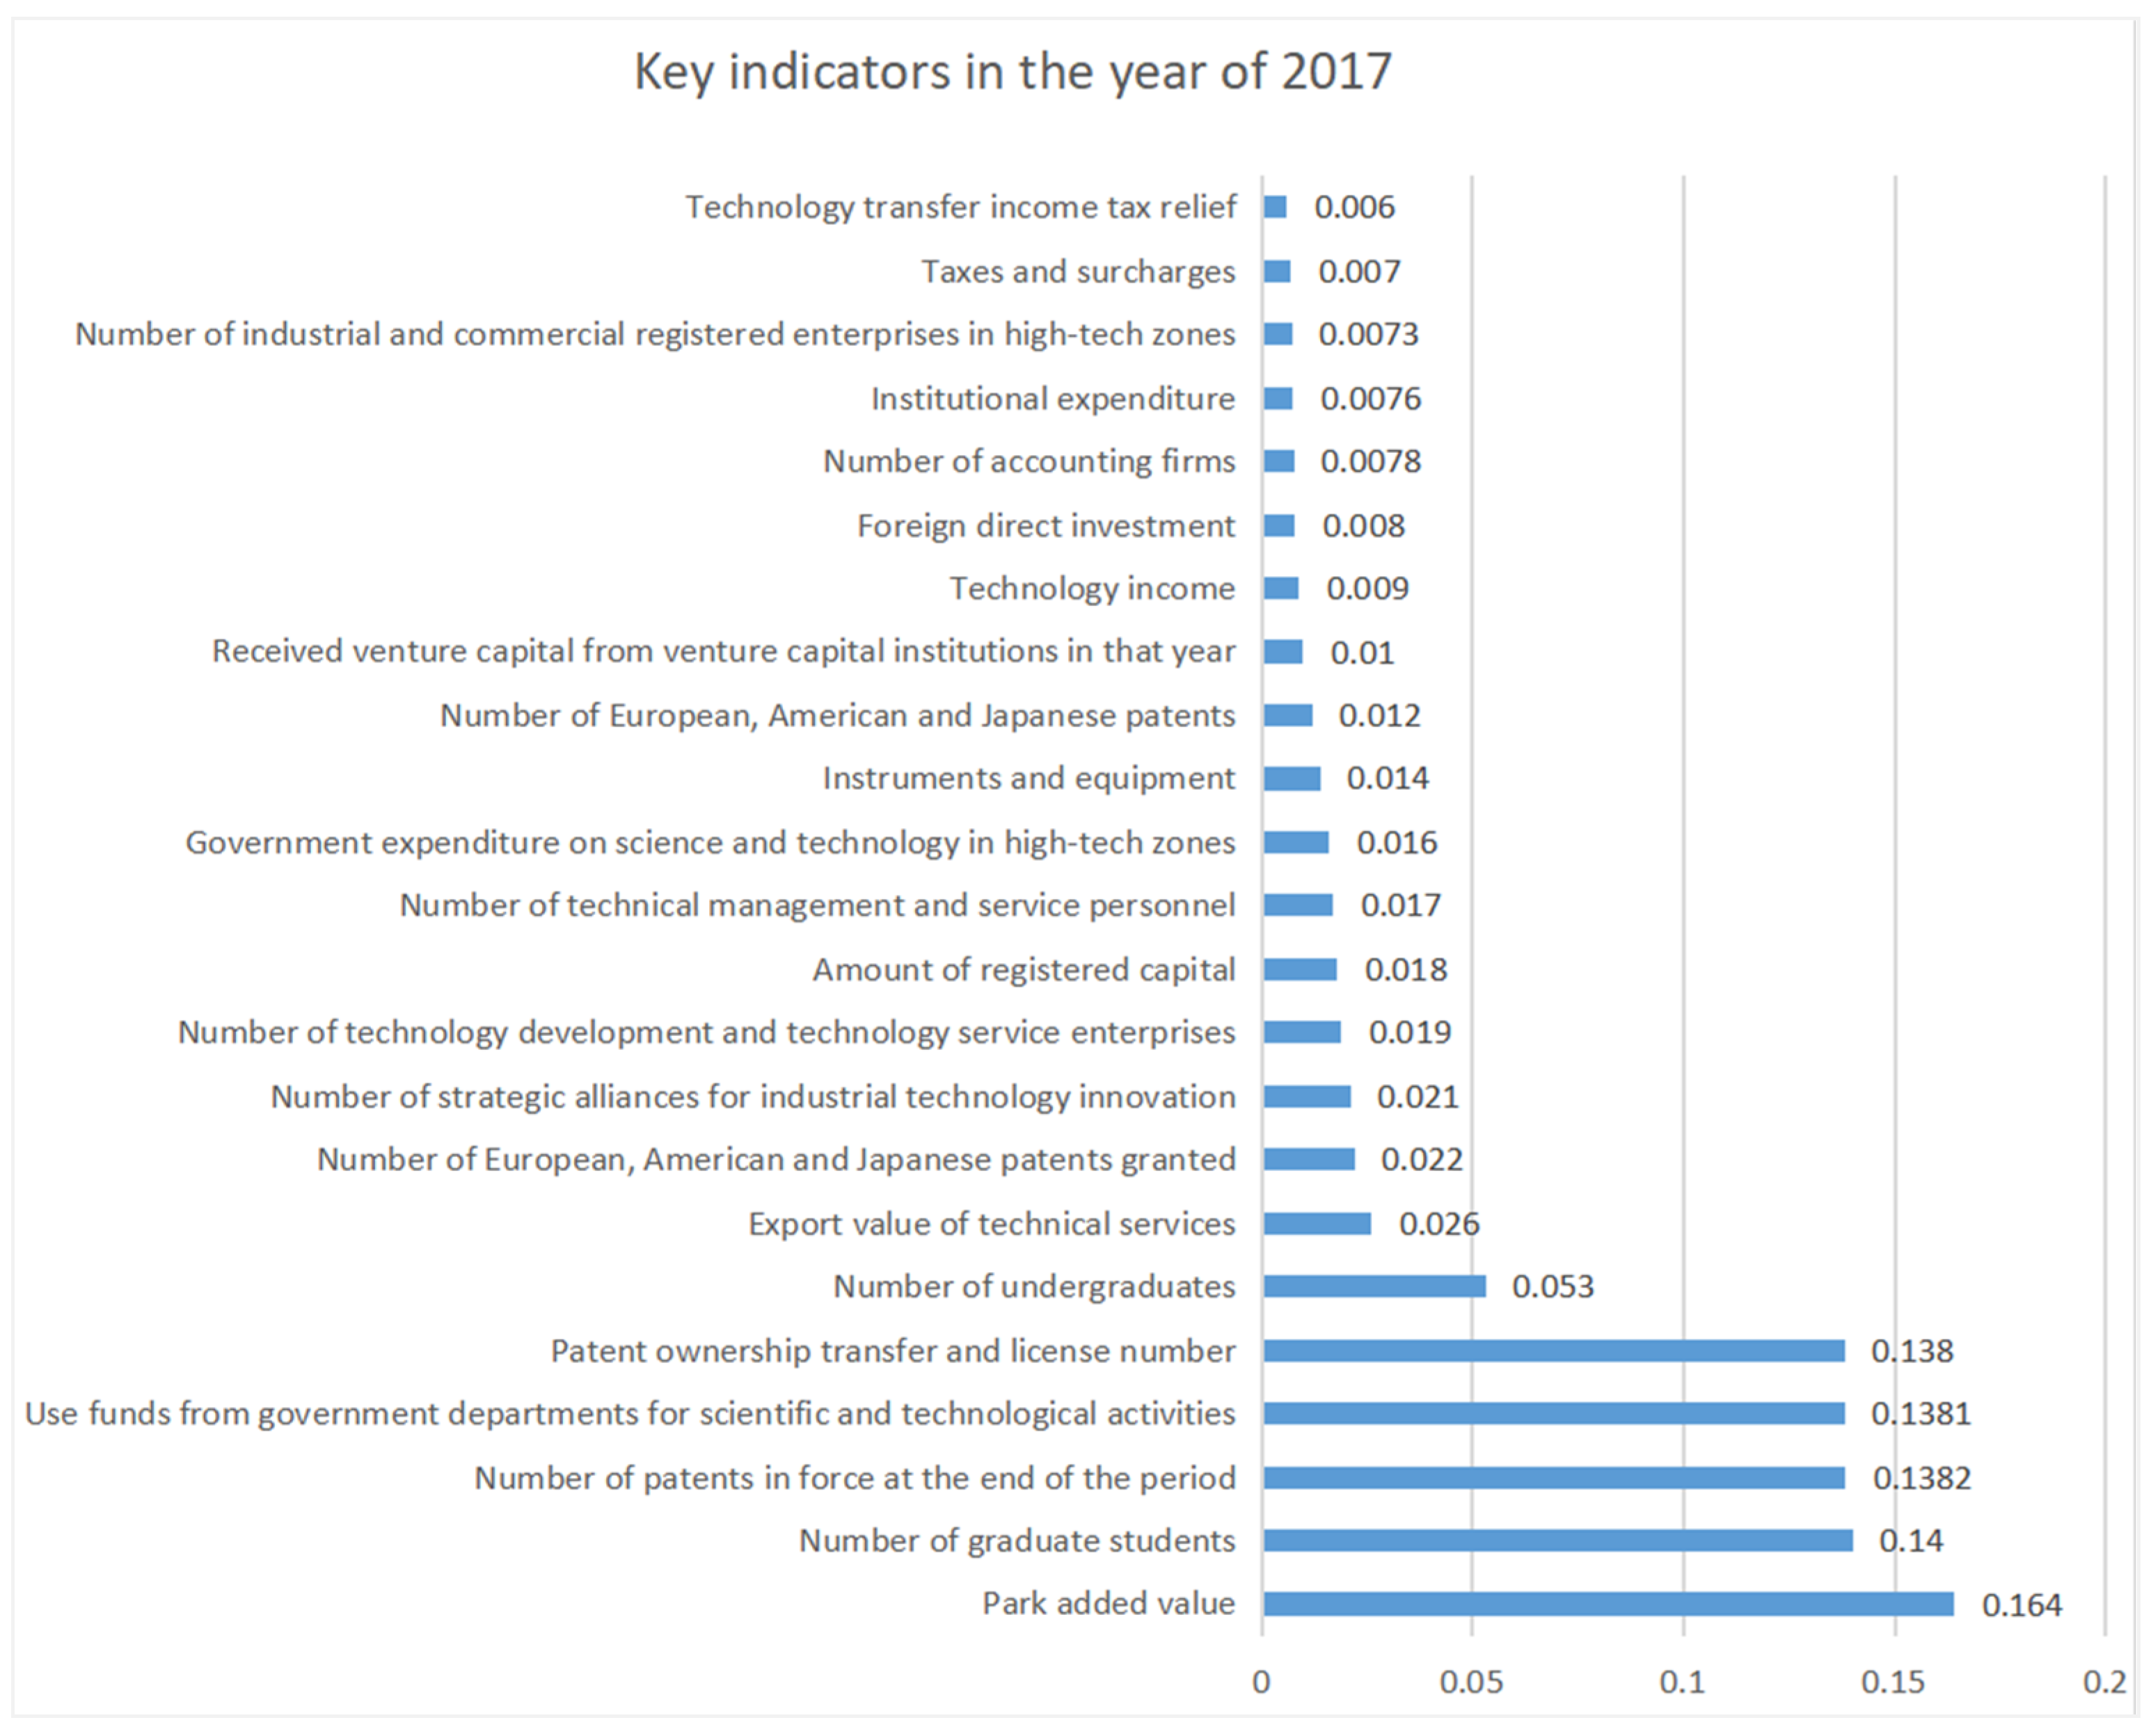
4.1. Selection of Feature Indicators
4.2. The Feature Indicator System of Wolrd-Class National High-Tech Zones
5. Conclusions
Author Contributions
Funding
Institutional Review Board Statement
Informed Consent Statement
Data Availability Statement
Conflicts of Interest
References
- Wang, S.G.; Zhu, C.H. 30 years’ construction of china national hi-tech industrial development zones and their development in new era. Bull. Chin. Acad. Sci. 2018, 33, 693–706. (In Chinese) [Google Scholar]
- Yang, S.Y.; Liu, W.; Zhang, Z. The dynamic value of China’s high-tech zones: Direct and indirect influence on urban ecological innovation. Land 2022, 11, 59. [Google Scholar] [CrossRef]
- Wang, J.; Ding, F.; Zhao, Y.; Heydari, M. Study on the heterogeneity of the influence path of high-tech industrial park policies on innovation efficiency. Asian J. Technol. Innov. 2023. [Google Scholar] [CrossRef]
- Kong, Q.; Li, R.; Fang, W.; Wong, Z. High-technology development zones and innovation in knowledge-intensive service firms: Evidence from Chinese A-share listed firms. Int. Rev. Financ. Anal. 2018, 78, 101883. [Google Scholar] [CrossRef]
- Kang, L.; Ma, L. Expansion of Industrial Parks in the Beijing-Tianjin-Hebei Urban Agglomeration: A Spatial Analysis. Land 2021, 10, 1118. [Google Scholar] [CrossRef]
- Huang, S.J.; Chen, G.H.; Wu, C.H.; Yuan, Q.J. Construction of evaluation index model of scientific research project database based on improved ahp-bp neural network. Inf. Sci. 2020, 38, 140–146. (In Chinese) [Google Scholar]
- Tang, X.G.; Li, Y. Analysis of personal credit evaluation method—Based on integration learning algorithm angle of view. Econ. Probl. 2011, 12, 66–68. (In Chinese) [Google Scholar]
- Zhang, R. Assessment of Innovation and Indexprediction of High-Tech Development Zones in Inner Mongolia by Machine Learning. Ph.D. Thesis, Tianjin University, Tianjin, China, 2013. (In Chinese). [Google Scholar]
- Li, X.N. Risk Assessment in Real Estate Project Based on Random Forests. Ph.D. Thesis, Tianjin University, Tianjin, China, 2017. (In Chinese). [Google Scholar]
- Li, X.; Tang, J.; Huang, J. Place-based policy upgrading, business environment, and urban innovation: Evidence from high-tech zones in China. Int. Rev. Financ. Anal. 2023, 86, 102545. [Google Scholar] [CrossRef]
- Jiang, C.L.; Cao, J.; Liu, W.S. Study on efficiency change and influencing factors of China’s high-tech zones: Based on panel data (1997–2012) stochastic frontier analysis. Reform Econ. Syst. 2014, 6, 52–56. (In Chinese) [Google Scholar]
- Zhang, S.; Hu, B.; Zhang, X. Have FDI quantity and quality promoted the low-carbon development of science and technology parks (STPs)? The threshold effect of knowledge accumulation. PLoS ONE 2021, 16, e0245891. [Google Scholar] [CrossRef]
- Wang, Q.X.; Ren, J.; Yan, S.M.; Cao, Z.; Chen, Y. Do the High-Tech Industrial Development Zones Foster Urban Innovation? A Case Study of China. Land 2023, 12, 830. [Google Scholar] [CrossRef]
- Sun, P.; Wang, X.Y. Investigation, analysis, and improvement strategies for the innovation system of high-tech industrial clusters in technological development zones. Sci. Technol. Prog. Policy 2009, 26, 65–68. (In Chinese) [Google Scholar]
- Cai, S.S.; Ou, G.J.; Zhao, L.L.; Bian, Y.N. Ecological evaluation of the innovation system’s quality in high tech zones—A case study of high tech zones in Hubei. Sci. Res. Manag. 2018, 39, 87–94. (In Chinese) [Google Scholar]
- Hu, B.B.; Wang, S.G.; Zhang, X.F. Scale increase effect of knowledge production in the innovation economy: An empirical test based on China’s national high-tech industrial development zone (NHIDZ). Sci. Res. Manag. 2017, 38, 52–58. (In Chinese) [Google Scholar]
- Zeng, W.J.; Li, Q.H.; Cai, C.G. Research on Innovation efficiency and influencing factors of high-tech industry development zones in China. Soft Sci. 2020, 34, 6–11. (In Chinese) [Google Scholar]
- Yang, C.; Zeng, J.; Zhou, Z.D. Growth or innovation? The impacts analysis of FDI on performance of China’s high-tech zones. J. Asia. Pac. Econ. 2023, 28, 972–985. [Google Scholar] [CrossRef]
- Hu, L.Y.; Nie, J. Research on the formation mechanism and countermeasures of high-tech industrial clusters in China’s technological parks. Forum Sci. Technol. China 2002, 4, 49–52. (In Chinese) [Google Scholar]
- Liu, Y.J.; Luo, F.Y. A Research to the behavioural ecology of the innovative clustering behaviors of enterprises-a proposal and conception to the analysis framework. China Soft Sci. 2004, 1, 68–72. (In Chinese) [Google Scholar] [CrossRef]
- Ferretti, M.; Guerini, M.; Panetti, E.; Parmentola, A. The partner next door? The effect of micro-geographical proximity on intra-cluster inter-organizational relationships. Technovation 2022, 111, 102390. [Google Scholar] [CrossRef]
- Markusen, J.R.; Venables, A.J. Foreign direct investment as a catalyst for industrial development. Eur. Econ. Rev. 1999, 43, 335–356. [Google Scholar] [CrossRef]
- Alessandro, K. Promotion of innovation activity in Russia through the creation of science parks: The case of St. Petersburg (1992–1998). Technovation 2003, 23, 65–76. [Google Scholar]
- Bigliardi, B.; Dormio, A.I.; Nosella, A.; Petroni, G. Assessing science parks’ performances: Directions from selected Italian case studies. Technovation 2006, 26, 489–505. [Google Scholar] [CrossRef]
- Nosratabadi, H.E.; Pourdarab, S.; Abbasian, M. Evaluation of science and technology parks by using fuzzy expert system. J. Mat. Com. 2011, 2, 594–606. [Google Scholar] [CrossRef]
- Albahari, A.; Catalano, G.; Landoni, P. Evaluation of national science park systems: A theoretical framework and its application to the Italian and Spanish systems. Technol. Anal. Strateg. 2013, 25, 599–614. [Google Scholar] [CrossRef]
- Guo, L.; Zhang, X.J.; Xu, J. Analysis of competitiveness of high-tech industrial parks based on neural network expert systems. Sci. Sci. Manag. S. T. 2004, 4, 111–113. (In Chinese) [Google Scholar]
- Fan, B.N. Evaluation on the technology innovation capability of h-i tech development zones in China. Stud. Sci. Sci. 2003, 6, 667–671. (In Chinese) [Google Scholar]
- Chen, S.; Wang, J.L. Measurement of the overall level of innovation transformation in development zones. Urban Probl. 2021, 42, 66–80. [Google Scholar]
- Liu, H.W.; Zhao, Z.X.; Ma, J.Q. Comprehensive evaluation measure and trend convergence test for high-quality development of national high-tech zones. Sci. Sci. Manag. S. T. 2021, 42, 66–80. (In Chinese) [Google Scholar]
- Hu, Z.X. The evaluation of VC supply and demand ability in six exemplary NHTIDZs. Sci. Technol. Prog. Policy 2016, 33, 33–39. (In Chinese) [Google Scholar]
- Wu, Q. Assessing Research on Comprehensive Development of the World-Class High-Tech Zone Based on Balanced Scorecard-a Case Study on Suzhou Industrial Park. Ph.D. thesis, Suzhou University, Suzhou, China, 2009. (In Chinese). [Google Scholar]
- Li, H.F.; Li, C.G. Note on deep architecture and deep learning algorithms. J. Hebei Univ. 2012, 32, 538–544. (In Chinese) [Google Scholar]
- Xia, Y.; Liu, C.; Li, Y.Y.; Liu, Y. A boosted decision tree approach using Bayesian hyper-parameter optimization for credit scoring. Expert Syst. Appl. 2017, 78, 225–241. [Google Scholar] [CrossRef]
- Forman, G. An extensive empirical study of feature selection metrics for text classification. J. Mach. Learn. Res. 2003, 3, 1289–1305. [Google Scholar]
- Xu, L.Y. The Evolution of China’s foreign talent policy: The case study of Beijing. Chin. Political Sci. Rev. 2023. (In Chinese) [Google Scholar] [CrossRef]
- Li, C.; Wang, X.F. High-Tech Enterprise Cluster’s Innovation and Isomorphism: A Case Study of Zhongguancun Software Park Identity Struggle. In Proceedings of the 2009 IEEE 16th International Conference on Industrial Engineering and Engineering Management, Beijing, China, 21–23 October 2009; Volume 1–2, pp. 646–650. [Google Scholar]
- Sly, M.J.H. Suzhou industrial park and its role in the belt and road initiative: The great stone industrial park in Belarus. Rege-Rev. Gest. 2021, 28, 316–334. [Google Scholar]

| Enterprise Indicators | Park Indicators | |||||||
|---|---|---|---|---|---|---|---|---|
| Number of Enterprise | Full-Time Equivalent Number of R&D Personnel | Gross Industrial Output Value (Thousand Yuan) | Number of Employees | Total Fiscal Revenue (Thousand Yuan) | Number of Universities | New Industrial Technology R&D Institutions | Number of Patent Applications in 2017 | |
| Max | 22,013 | 182,450.2334 | 1,108,438,915 | 2,620,437 | 75,380,980 | 47 | 136 | 74,368 |
| Min | 23 | 7.083333333 | 3,214,506.7 | 5017 | 0 | 0 | 0 | 17 |
| Mean | 11,018 | 10,500 | 131,833,827.6 | 125,410.18 | 84,344,747.92 | 5.53 | 7.7 | 37,192.5 |
| Standard Variance | 1883.18 | 21,446.31455 | 168,250,294.4 | 238,861.6828 | 131,858,59.58 | 7.98 | 16.46 | 8679.91 |
| Year | Number of National High Tech Zones | Statistical Indicators |
|---|---|---|
| 2013 | 115 | 246 |
| 2014 | 116 | 232 |
| 2015 | 147 | 232 |
| 2016 | 147 | 244 |
| 2017 | 157 | 350 |
| National High-Tech Zones | Number of Enterprises | R&D Personnel Full-Time Equivalent | Internal Expenditure on R&D Funds | Park Added Value | Industrial Added Value | Operating Revenue |
|---|---|---|---|---|---|---|
| Zhongguancun | 1.000 | 1.000 | 1.000 | 1.000 | 0.959 | 1.000 |
| Shenzhen | 0.094 | 0.465 | 0.521 | 0.195 | 0.228 | 0.137 |
| Hangzhou | 0.091 | 0.290 | 0.315 | 0.147 | 0.258 | 0.103 |
| Zhangjiang | 0.242 | 0.498 | 0.615 | 0.518 | 1.000 | 0.363 |
| Wuhan | 0.138 | 0.455 | 0.401 | 0.251 | 0.418 | 0.226 |
| Suzhou industrial park | 0.115 | 0.320 | 0.234 | 0.140 | 0.358 | 0.093 |
| Chengdu | 0.086 | 0.201 | 0.154 | 0.147 | 0.331 | 0.111 |
| Hefei | 0.058 | 0.184 | 0.185 | 0.159 | 0.350 | 0.086 |
| Guangzhou | 0.173 | 0.450 | 0.341 | 0.159 | 0.310 | 0.134 |
| Xi’an | 0.180 | 0.315 | 0.363 | 0.296 | 0.632 | 0.211 |
| Rank of Indicator | 2013 | 2014 | 2015 | 2016 | 2017 |
|---|---|---|---|---|---|
| 1 | Number of high-tech enterprises | Valid patent | Authorized domestic invention patents | Authorized domestic invention patents | Park added value |
| 2 | Software copyright | High tech enterprises | R&D personnel | Income tax | Graduate practitioner |
| 3 | Total personnel of R&D institutions | Total agency personnel | Technical service export | R&D personnel | Number of patents in force at the end of the period |
| 4 | R&D personnel | Master’s degree or above returnee | Overseas students start businesses | Institutional expenditure | Use funds for scientific and technological activities of government departments |
| 5 | Master’s degree or above returnee | Income tax | Total amount of taxes and fees actually paid | Trademark registered in that year | Patent ownership transfer and licensing |
| 6 | People who have returned from studying abroad | Technical service export | High level | Number of listed enterprises | Undergraduate practitioners |
| 7 | Technical consulting and service income | Operating profit | Apply for domestic invention patents | Overseas students start businesses | Technical service export |
| 8 | Number of overseas marketing agencies established by enterprises | Number of overseas marketing service agencies established by enterprises | Receiving commissioned research and development income | Non-operating income | Authorizes European, American and Japanese patents |
| 9 | Total volume of technical contract transactions | Value-added tax | Park added value | Invention patent | Industrial technology innovation strategic alliance |
| 10 | The software copyright was obtained in that year | Have a registered trademark | Paid-in capital (equity) | Ending mechanism number | Technology development and technology service enterprises |
| 11 | Number of listed enterprises | Overseas students start businesses | Full-time science and technology activity staff | Technical service export | Registered capital |
| 12 | Number of overseas technology research and development institutions established by enterprises | Funds for scientific and technological activities of government departments shall be used for internal scientific and technological activities of enterprises | Year-end owner’s equity | Authorized invention patent | Science and technology management and service personnel |
| 13 | Number of mechanisms | Thousand Talents Plan | Subsidy income | Park added value | Government expenditure on science and technology in high-tech zones |
| 14 | Research and development plus deduction for income tax | Research and development plus deduction for income tax | Income from technology transfer | Doctoral practitioner | Expenditure on instruments and equipment for scientific and technological activities |
| 15 | Form international standards | Technology transfer mechanism | Funds for scientific and technological activities of government departments shall be used for internal scientific and technological activities of enterprises | Asset impairment loss | It has European, American and Japanese patents |
| 16 | Employees with master’s degree | That year received venture capital | Number of overseas marketing service agencies | Foreign direct investment | That year received venture capital |
| 17 | Funds for scientific and technological activities of government departments shall be used for internal scientific and technological activities of enterprises | Park added value | Number of enterprises | Expenditures for scientific and technological activities entrusted to foreign entities | Technology income |
| 18 | Total export | Patent ownership transfer and licensing | Expenditures for scientific and technological activities carried out by entrusted units | Government expenditure on science and technology in high-tech zones | Foreign direct investment |
| 19 | Trademark registered in that year | Industrial and commercial registered enterprise | That year received venture capital | Provincial and above technology transfer demonstration institutions | Accounting firm |
| 20 | National qualified product inspection and testing institutions | Apply for domestic invention patents | Apply for European, American and Japanese patents | Introduce foreign experts | Institutional expenditure |
| One-Leve Indicator (Weight) | Category | Characteristic Indicator | Weight |
|---|---|---|---|
| Innovation and development (0.431) | Resource | R&D personnel full-time equivalent | 0.047 |
| Number of employees with a bachelor’s degree or above | 0.013 | ||
| Number of institutions at the end of the period | 0.013 | ||
| Investment amount from venture capital firms obtained during the year | 0.010 | ||
| Input | Use of funds for scientific activities from government departments | 0.049 | |
| Technological expenditure by high-tech zones | 0.043 | ||
| Expenditure on technology activities entrusted to external units | 0.039 | ||
| Income tax reduction for R&D additional deductions | 0.011 | ||
| Achievement | Number of valid patents at the end of the period | 0.117 | |
| Number of patent ownership transfers and licenses | 0.038 | ||
| Software copyrights | 0.017 | ||
| Number of domestic invention patent applications | 0.014 | ||
| Total amount of technology contract transactions | 0.010 | ||
| Obtained software copyrights during the year | 0.010 | ||
| Business development (0.214) | Scale | Number of high-tech enterprises | 0.121 |
| Number of listed companies | 0.017 | ||
| Registered trademarks during the year | 0.037 | ||
| Economic indicators | Expenditure on institutional funds | 0.018 | |
| Actual amount of taxes paid | 0.015 | ||
| Equity at the end of the year | 0.007 | ||
| Internationalization development (0.198) | Go global | Number of overseas technology research and development institutions established by enterprises | 0.032 |
| Amount of direct overseas investment | 0.048 | ||
| Technology service exports | 0.040 | ||
| Number of overseas marketing service institutions | 0.024 | ||
| Introduce | Enterprises founded by overseas students | 0.029 | |
| Returned overseas students | 0.024 | ||
| Economic development (0.157) | Park | Park value-added | 0.061 |
| Enterprise | Non-operating income | 0.044 | |
| Paid-in capital | 0.043 | ||
| Operating profit | 0.010 |
Disclaimer/Publisher’s Note: The statements, opinions and data contained in all publications are solely those of the individual author(s) and contributor(s) and not of MDPI and/or the editor(s). MDPI and/or the editor(s) disclaim responsibility for any injury to people or property resulting from any ideas, methods, instructions or products referred to in the content. |
© 2023 by the authors. Licensee MDPI, Basel, Switzerland. This article is an open access article distributed under the terms and conditions of the Creative Commons Attribution (CC BY) license (https://creativecommons.org/licenses/by/4.0/).
Share and Cite
Feng, S.; Park, H.; Han, F. What Indicators Are Shaping China’s National World-Class High-Tech Zones? Constructing a Feature Indicator System Based on Machine Learning. Appl. Sci. 2023, 13, 10690. https://doi.org/10.3390/app131910690
Feng S, Park H, Han F. What Indicators Are Shaping China’s National World-Class High-Tech Zones? Constructing a Feature Indicator System Based on Machine Learning. Applied Sciences. 2023; 13(19):10690. https://doi.org/10.3390/app131910690
Chicago/Turabian StyleFeng, Sida, Hyunseok Park, and Fang Han. 2023. "What Indicators Are Shaping China’s National World-Class High-Tech Zones? Constructing a Feature Indicator System Based on Machine Learning" Applied Sciences 13, no. 19: 10690. https://doi.org/10.3390/app131910690
APA StyleFeng, S., Park, H., & Han, F. (2023). What Indicators Are Shaping China’s National World-Class High-Tech Zones? Constructing a Feature Indicator System Based on Machine Learning. Applied Sciences, 13(19), 10690. https://doi.org/10.3390/app131910690