
Creep and Hardening Characteristics of Anthracite under Graded Static–Dynamic Coupled Loading

 ,
,
Abstract
:1. Introduction
2. Methodology
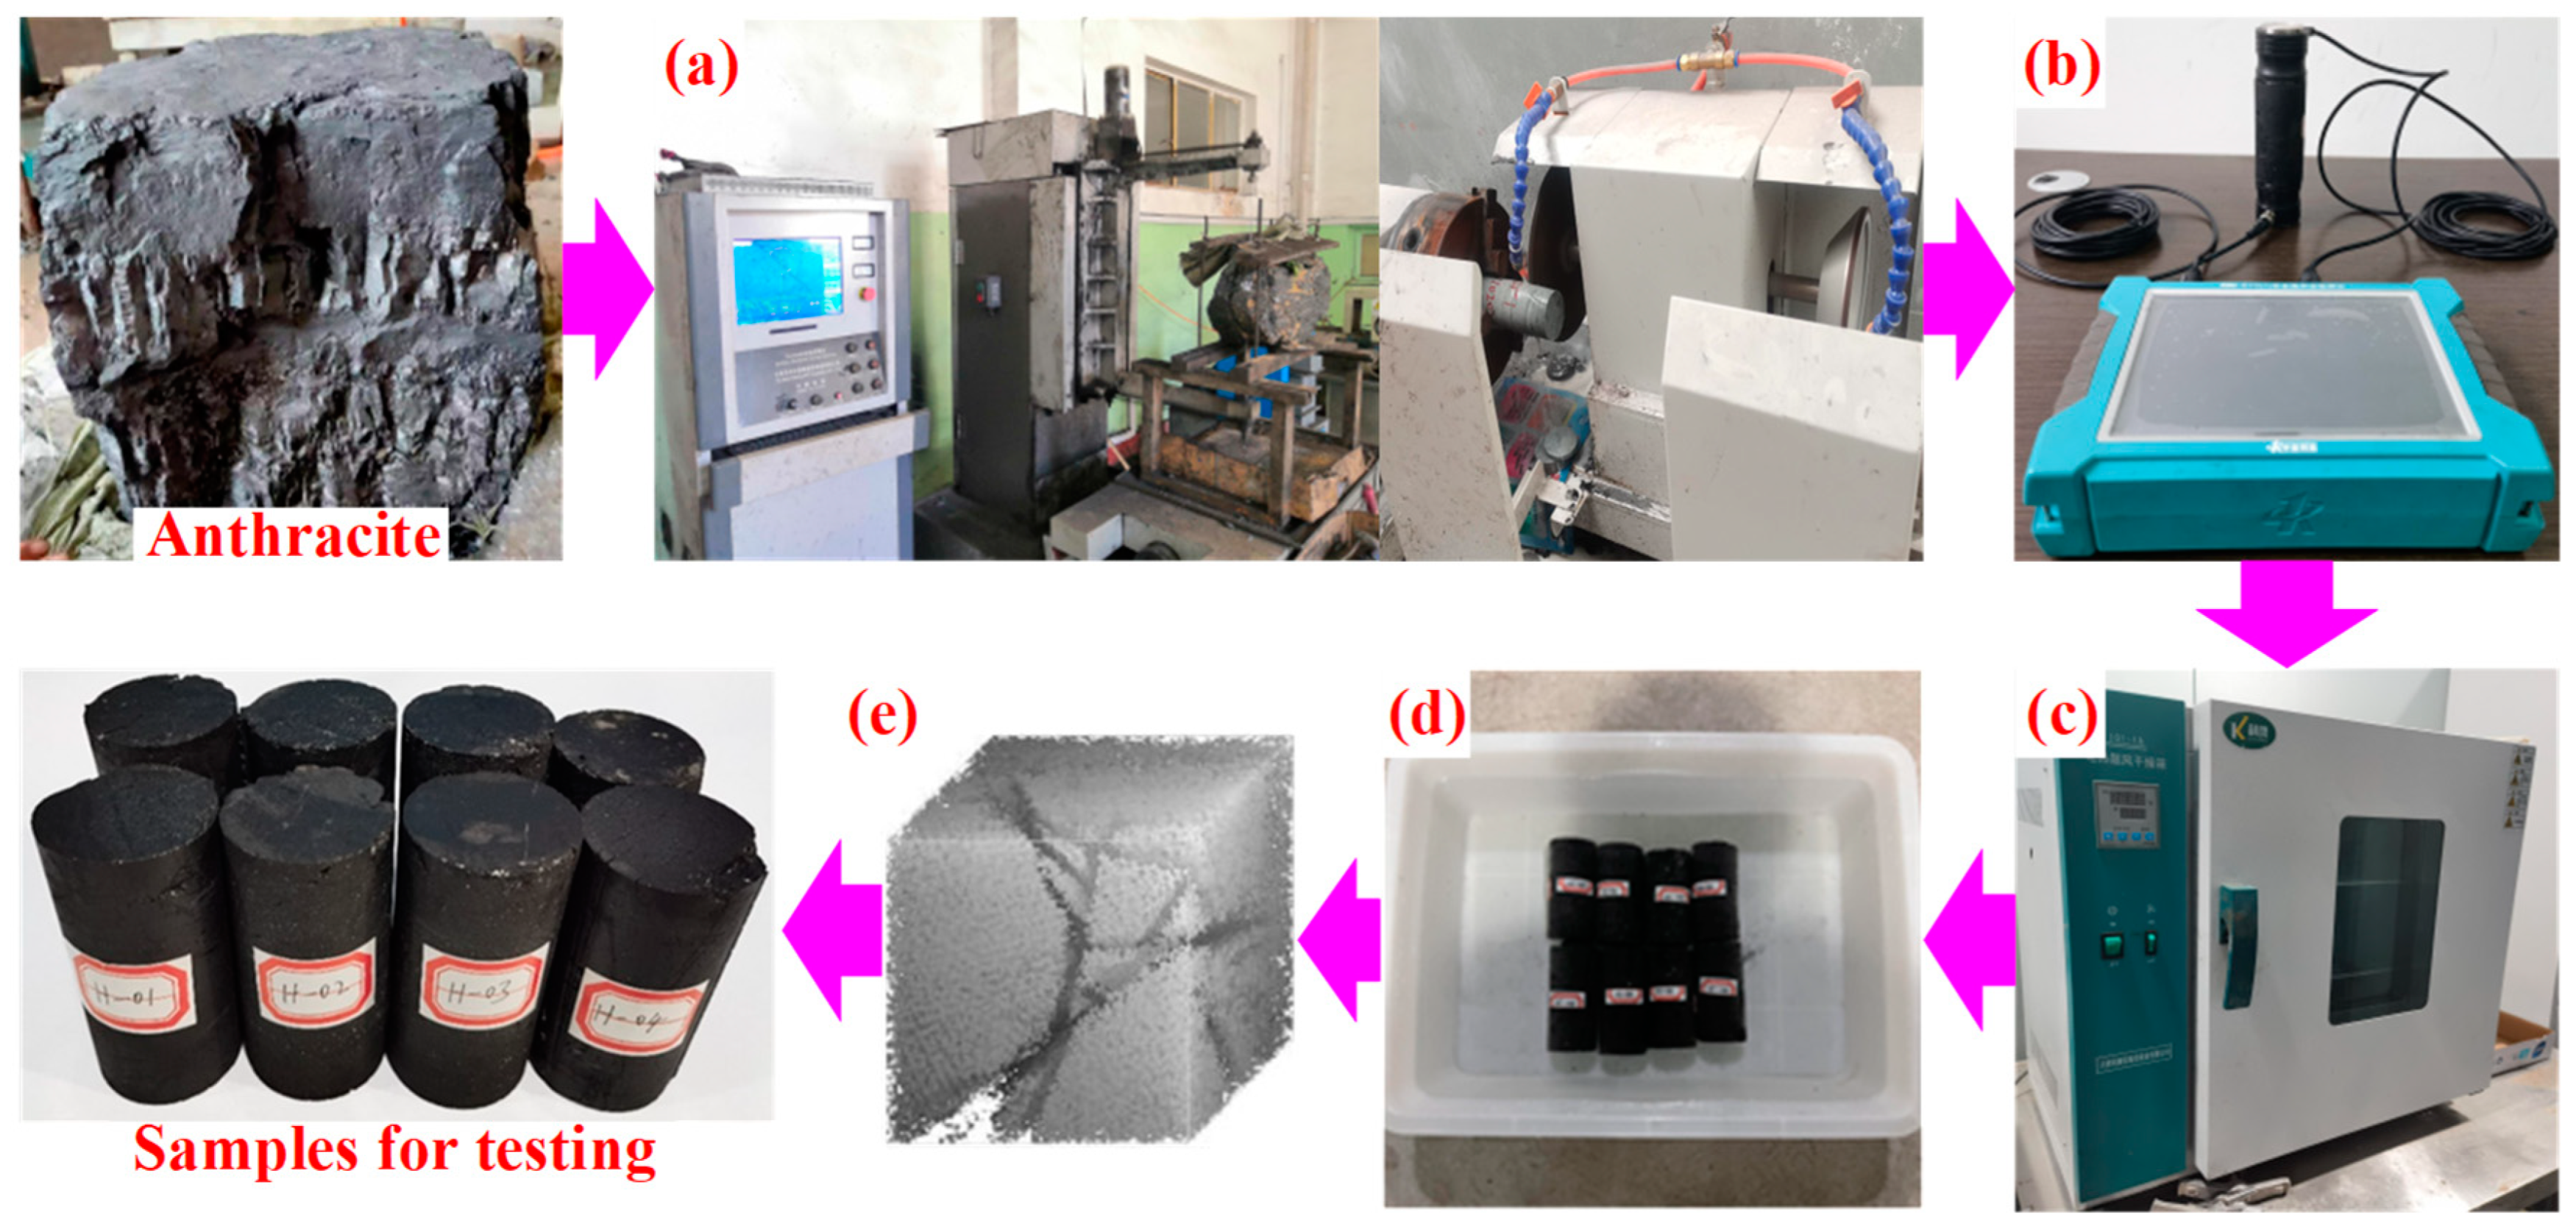
2.1. Preparation and Treatment of Coal Samples
- (1)
- Firstly, cylindrical coal samples with a size of ϕ50 mm × 100 mm were prepared with non-parallelism of less than 0.05 mm (Figure 1a), in accordance with the standards in the InternationaCreep Principle and Hardening Mechanism(IRSM).
- (2)
- Then, to minimize the influence of the discreteness of the macro-mechanical properties of the samples on the test results, eight coal samples with similar density and longitudinal wave velocity (error less than 5%) were selected as the research objects in this test (Figure 1b).
- (3)
- Following this, the samples were dried in an oven at a constant temperature (60 °C) until the weight of the samples did not decrease according to GB/T23561.6-2009 (Figure 1c). Afterwards, the dry density of the samples was measured.
- (4)
- Thereafter, the samples were completely immersed in water for seven days until the weight of the samples did not increase and all the samples were saturated with water (Figure 1d). The wet density and water content of the water-saturated samples were measured.
- (5)
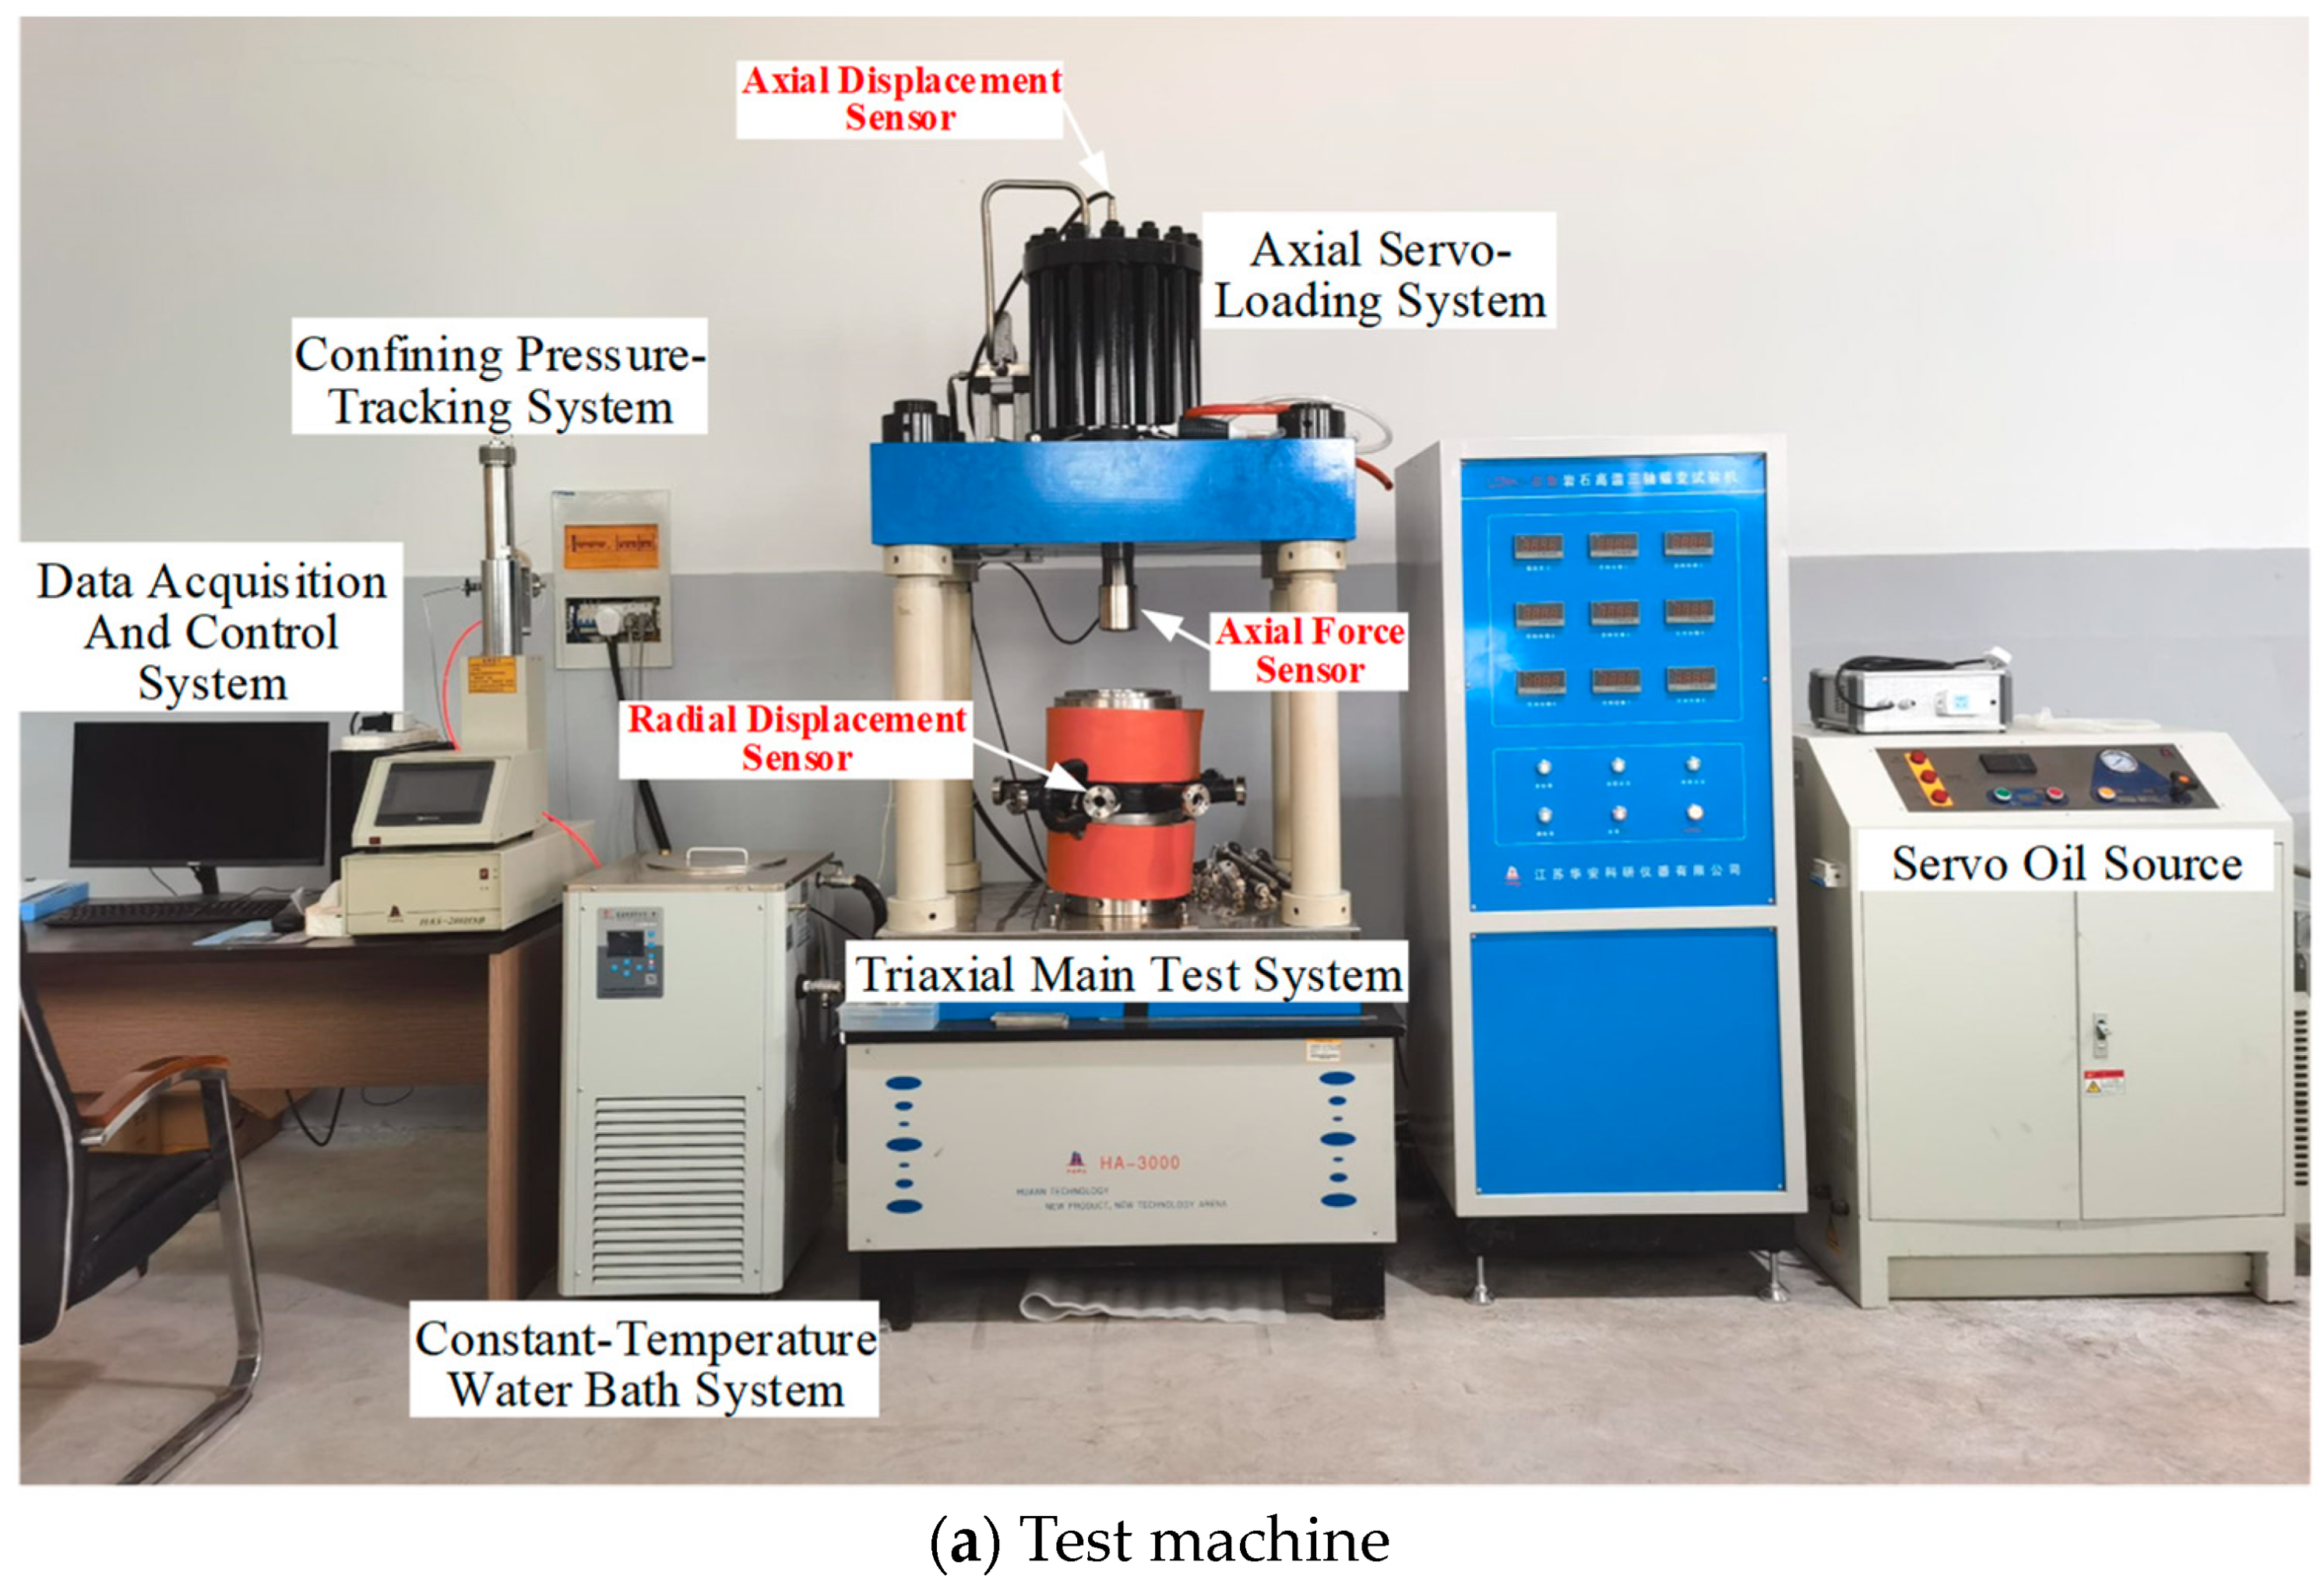
2.2. Test Equipment
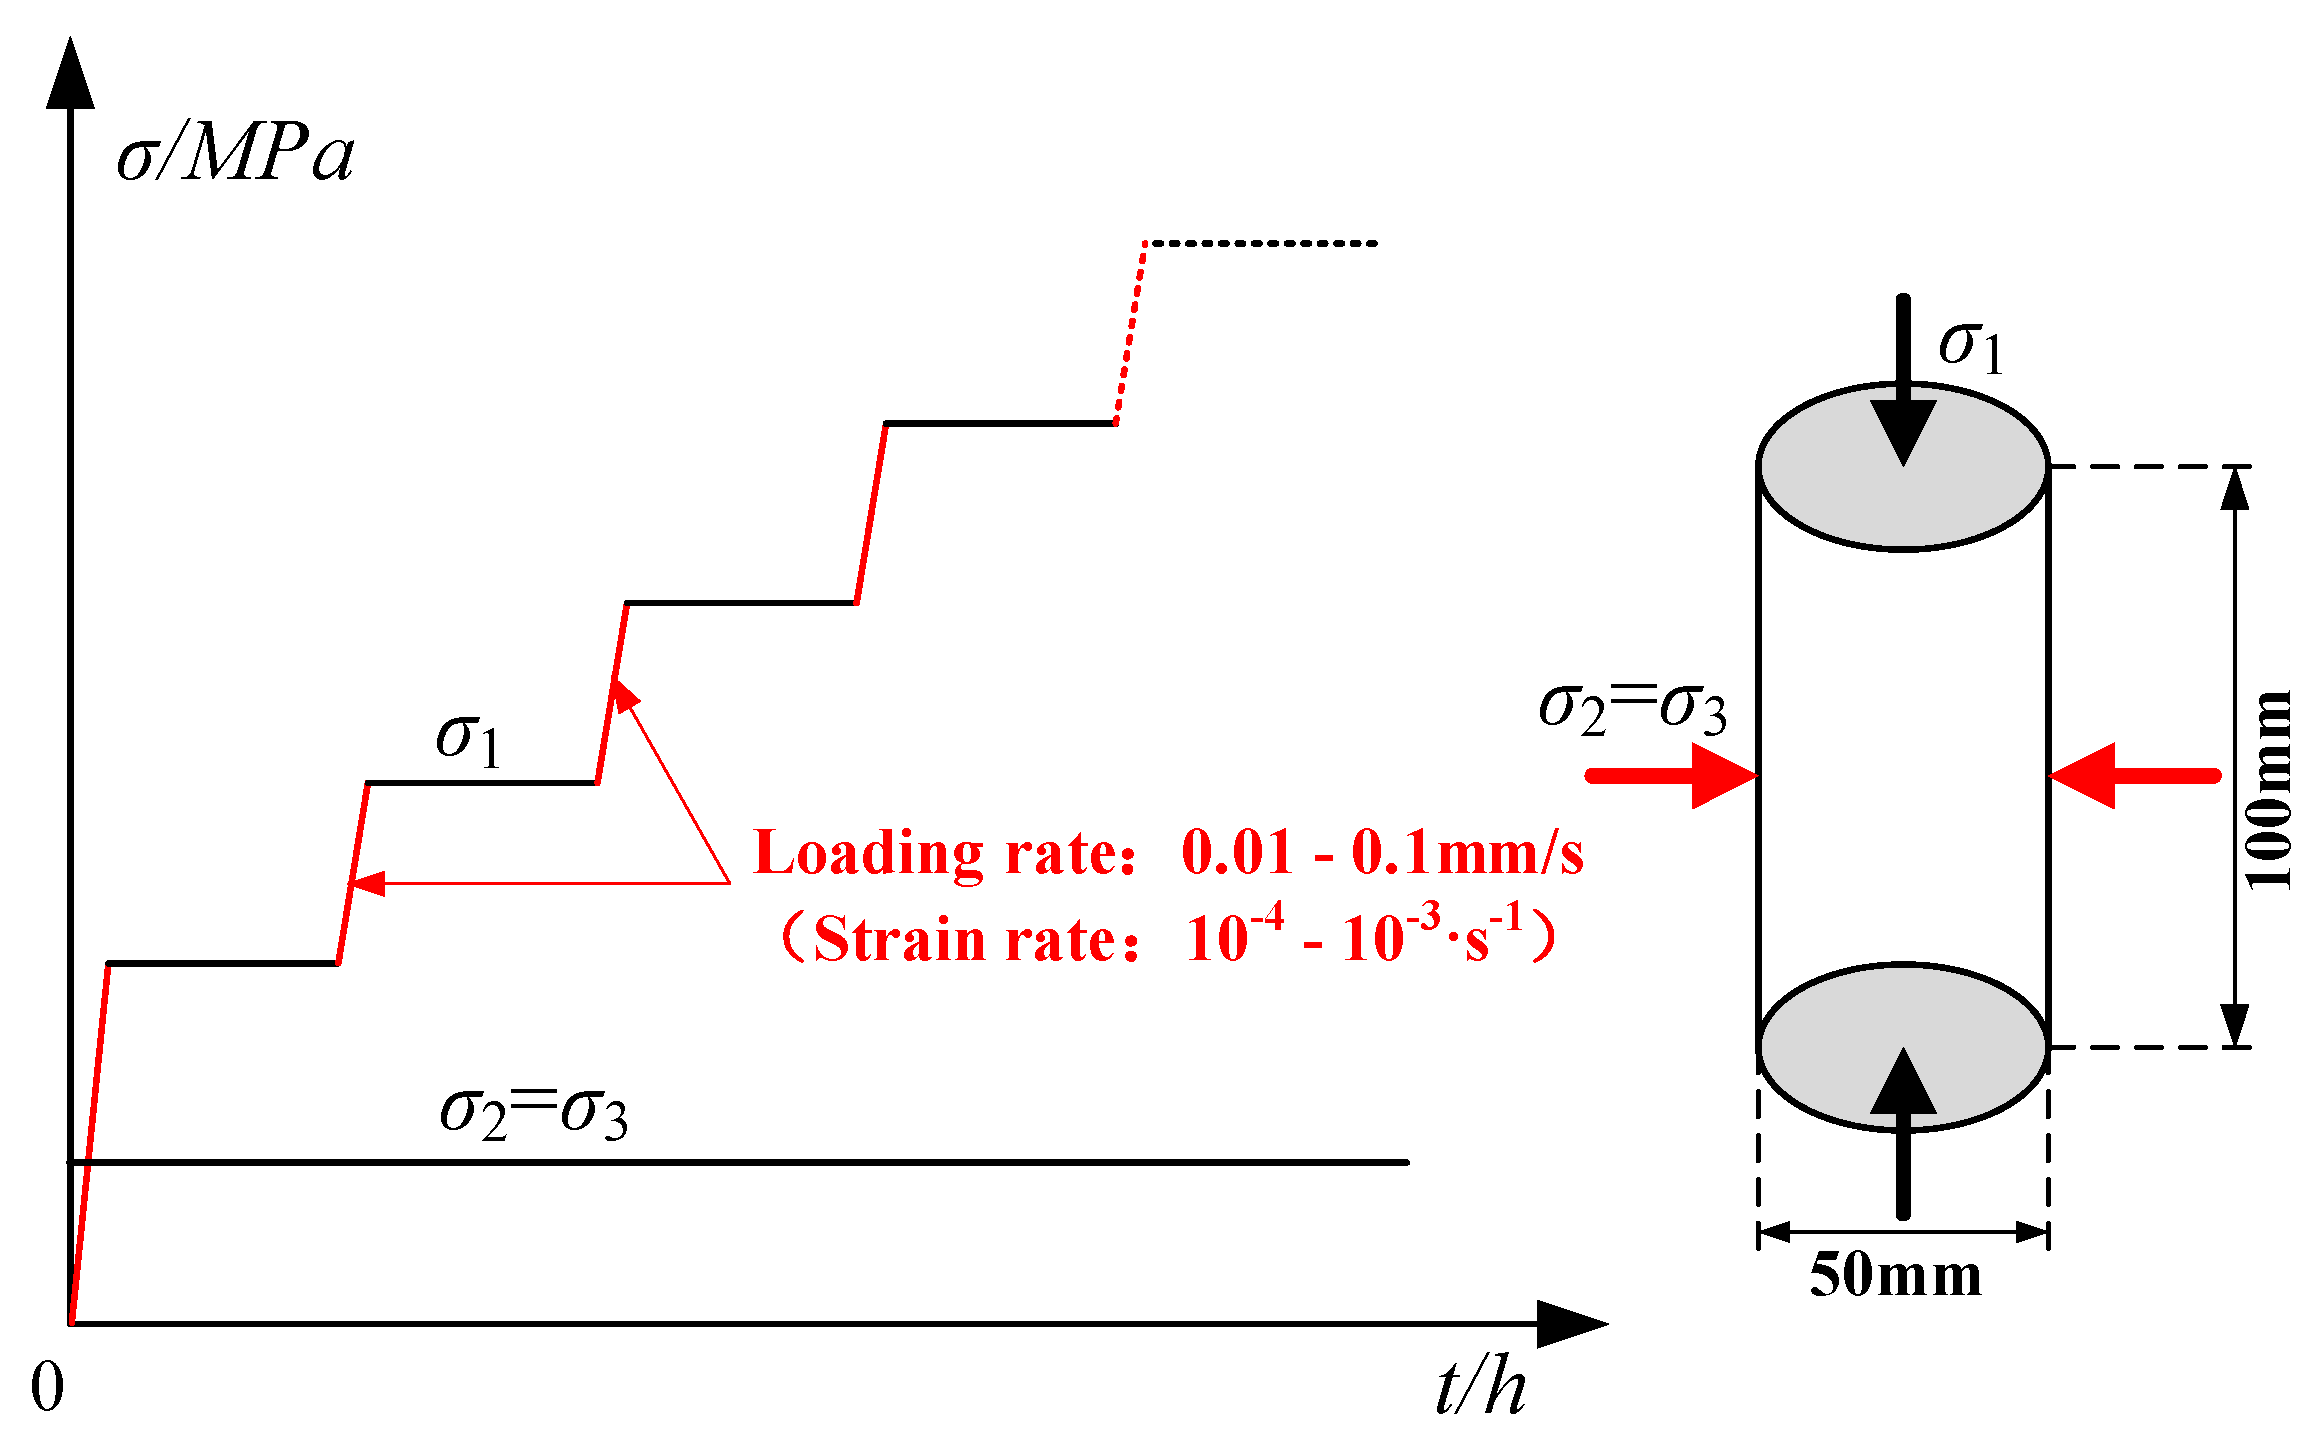
2.3. Test Scheme and Steps
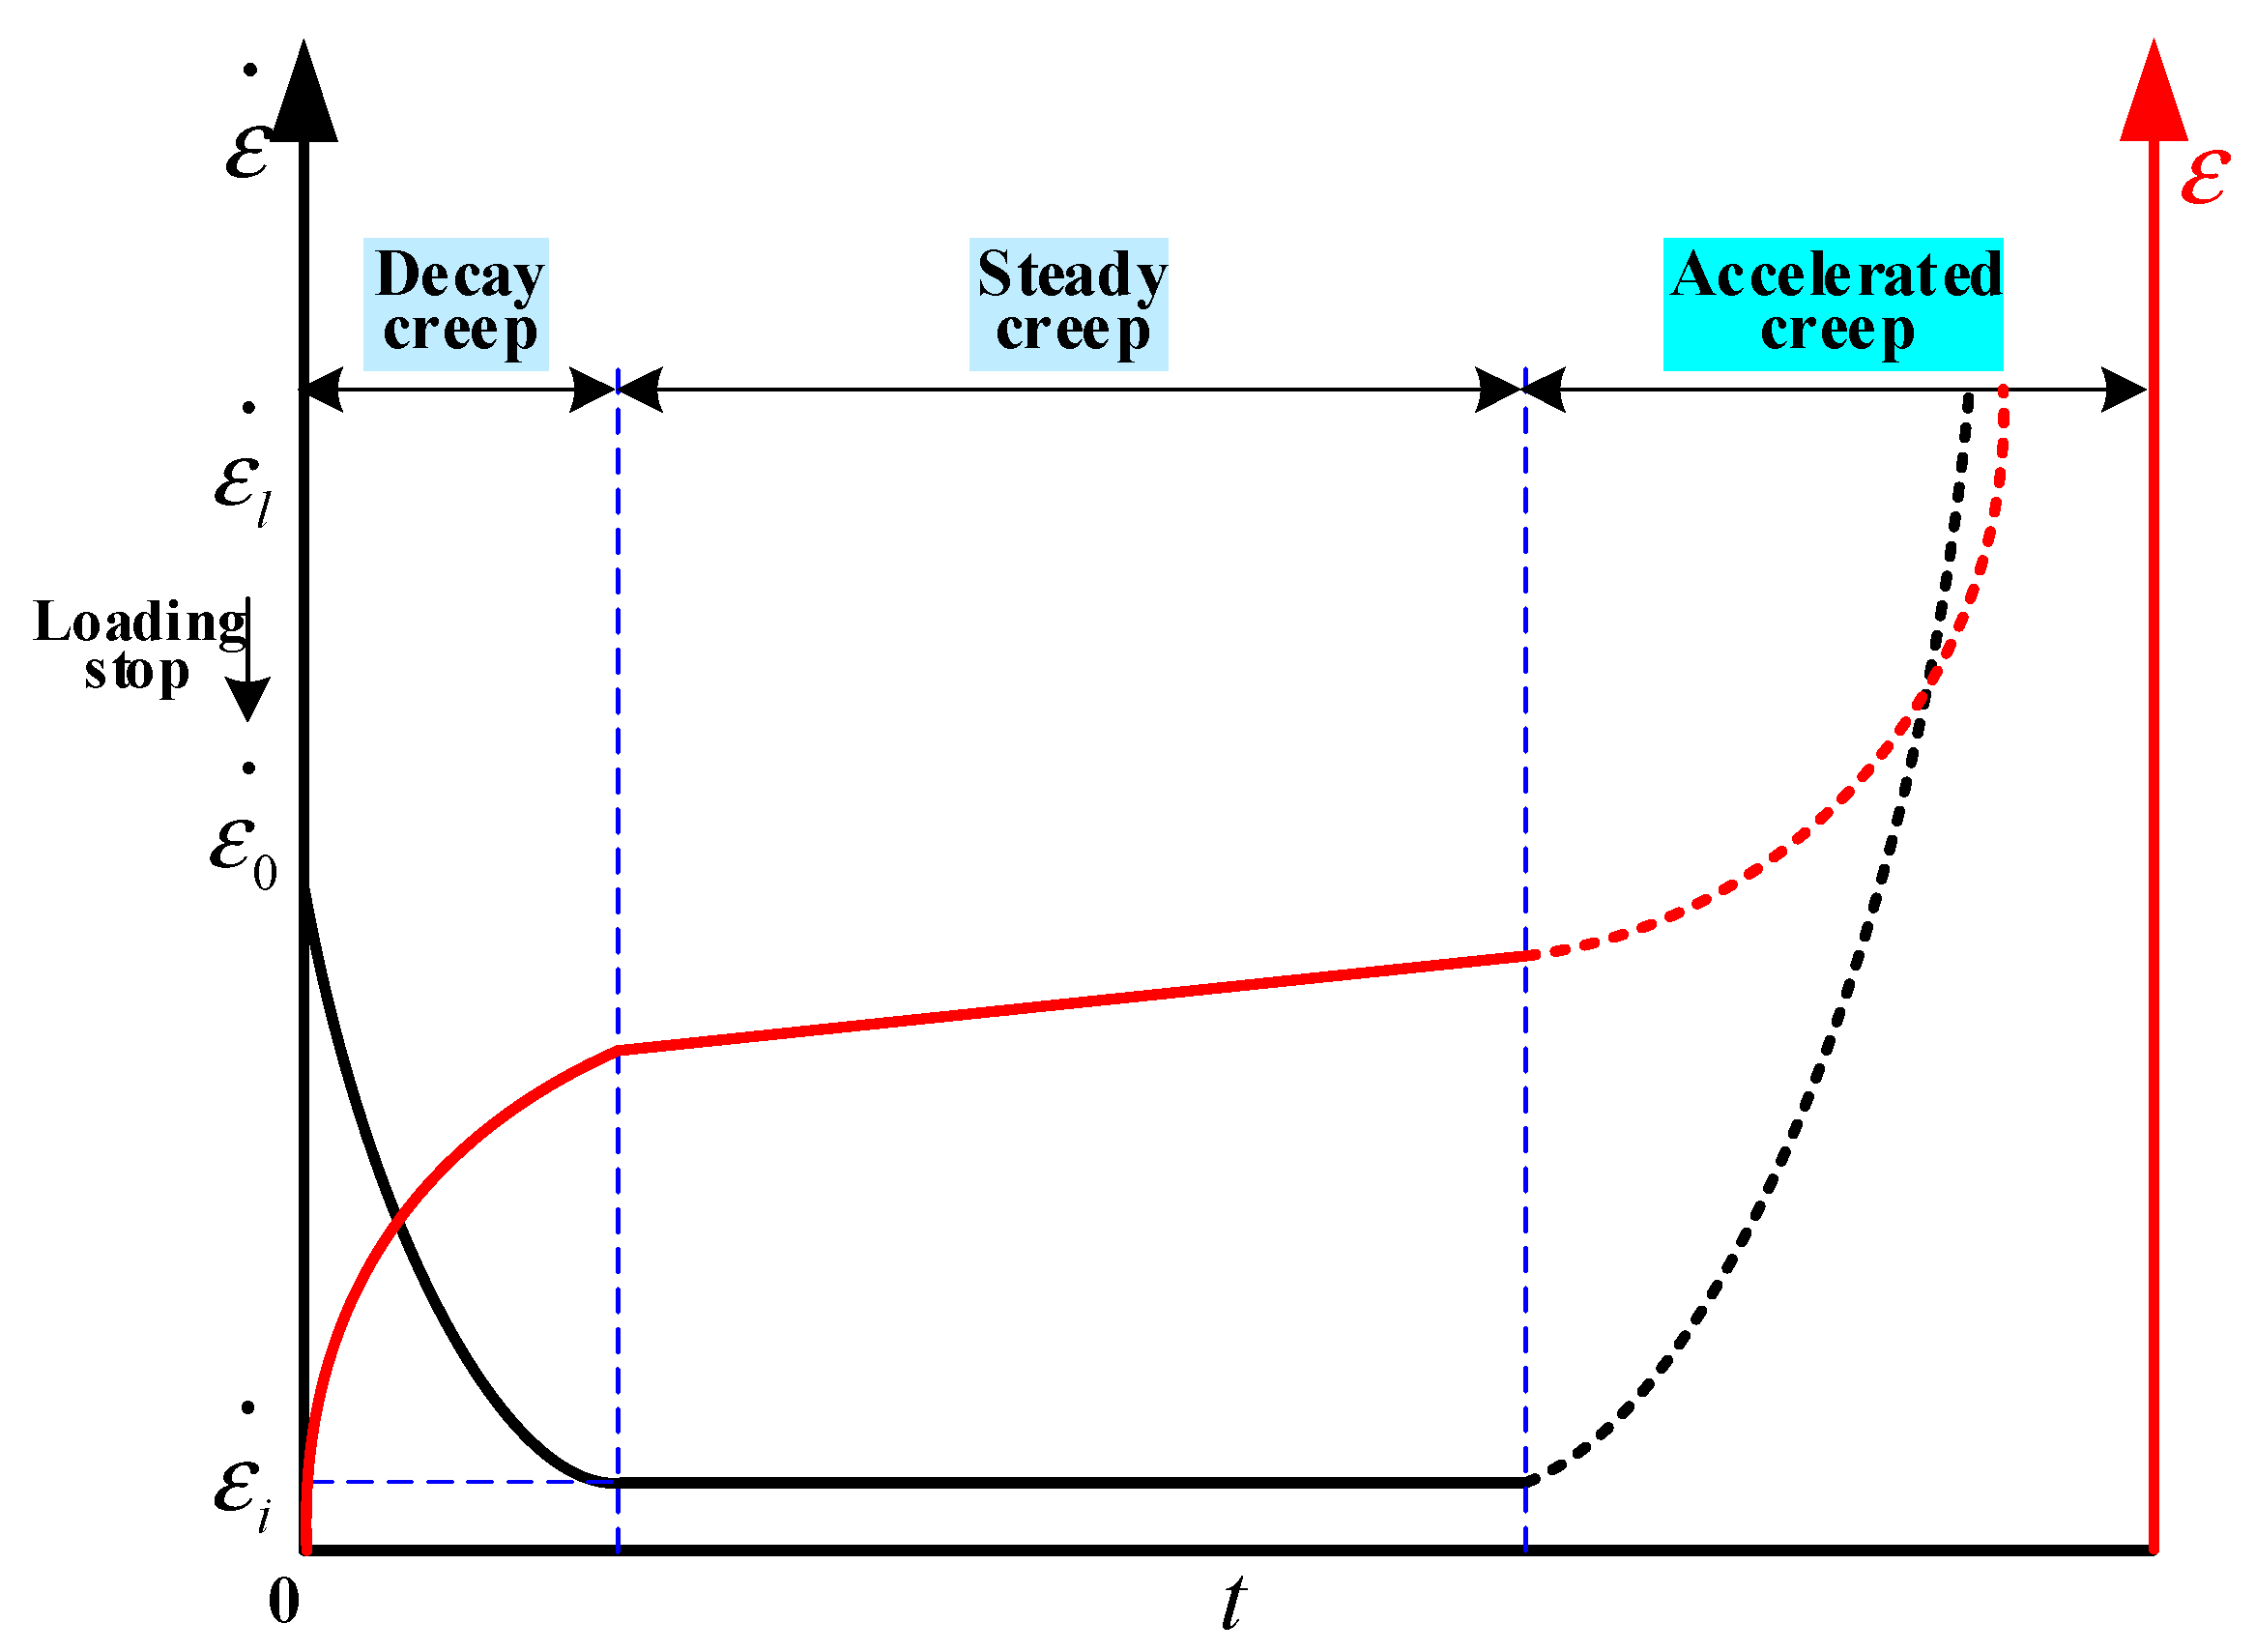
2.4. Creep Principle and Hardening Mechanism
3. Results
3.1. Conventional Compression Test Results
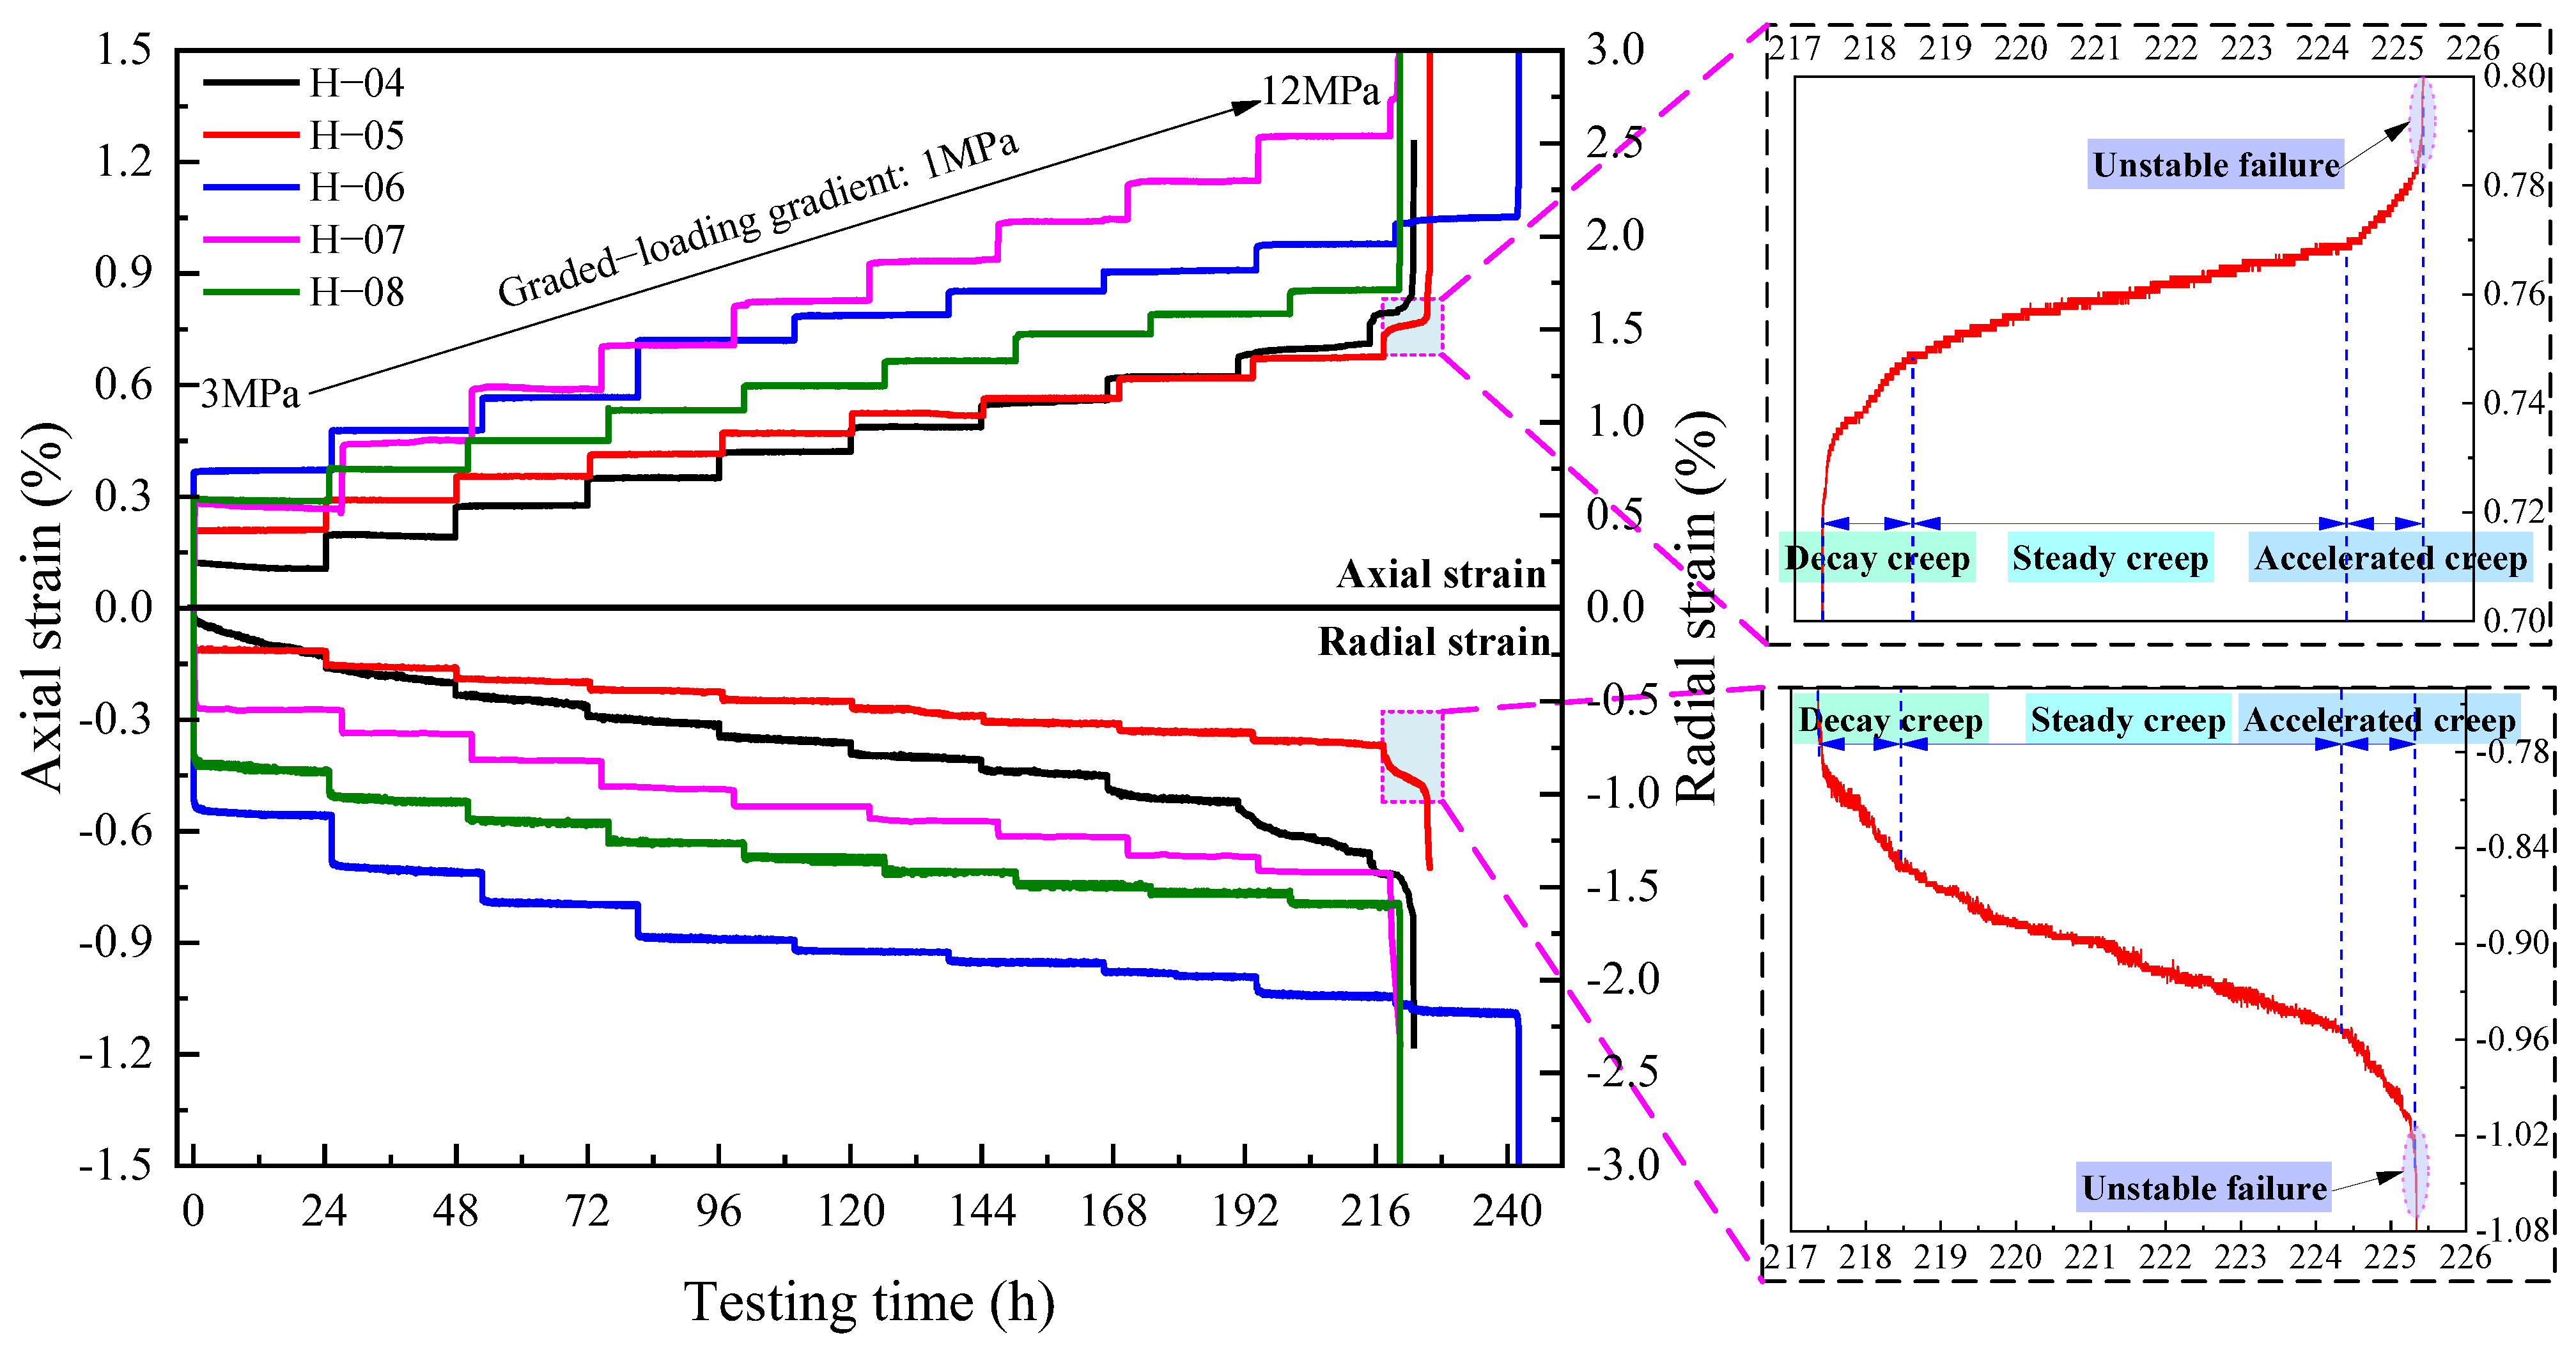
3.2. Graded Loading Creep Test Results
4. Discussion
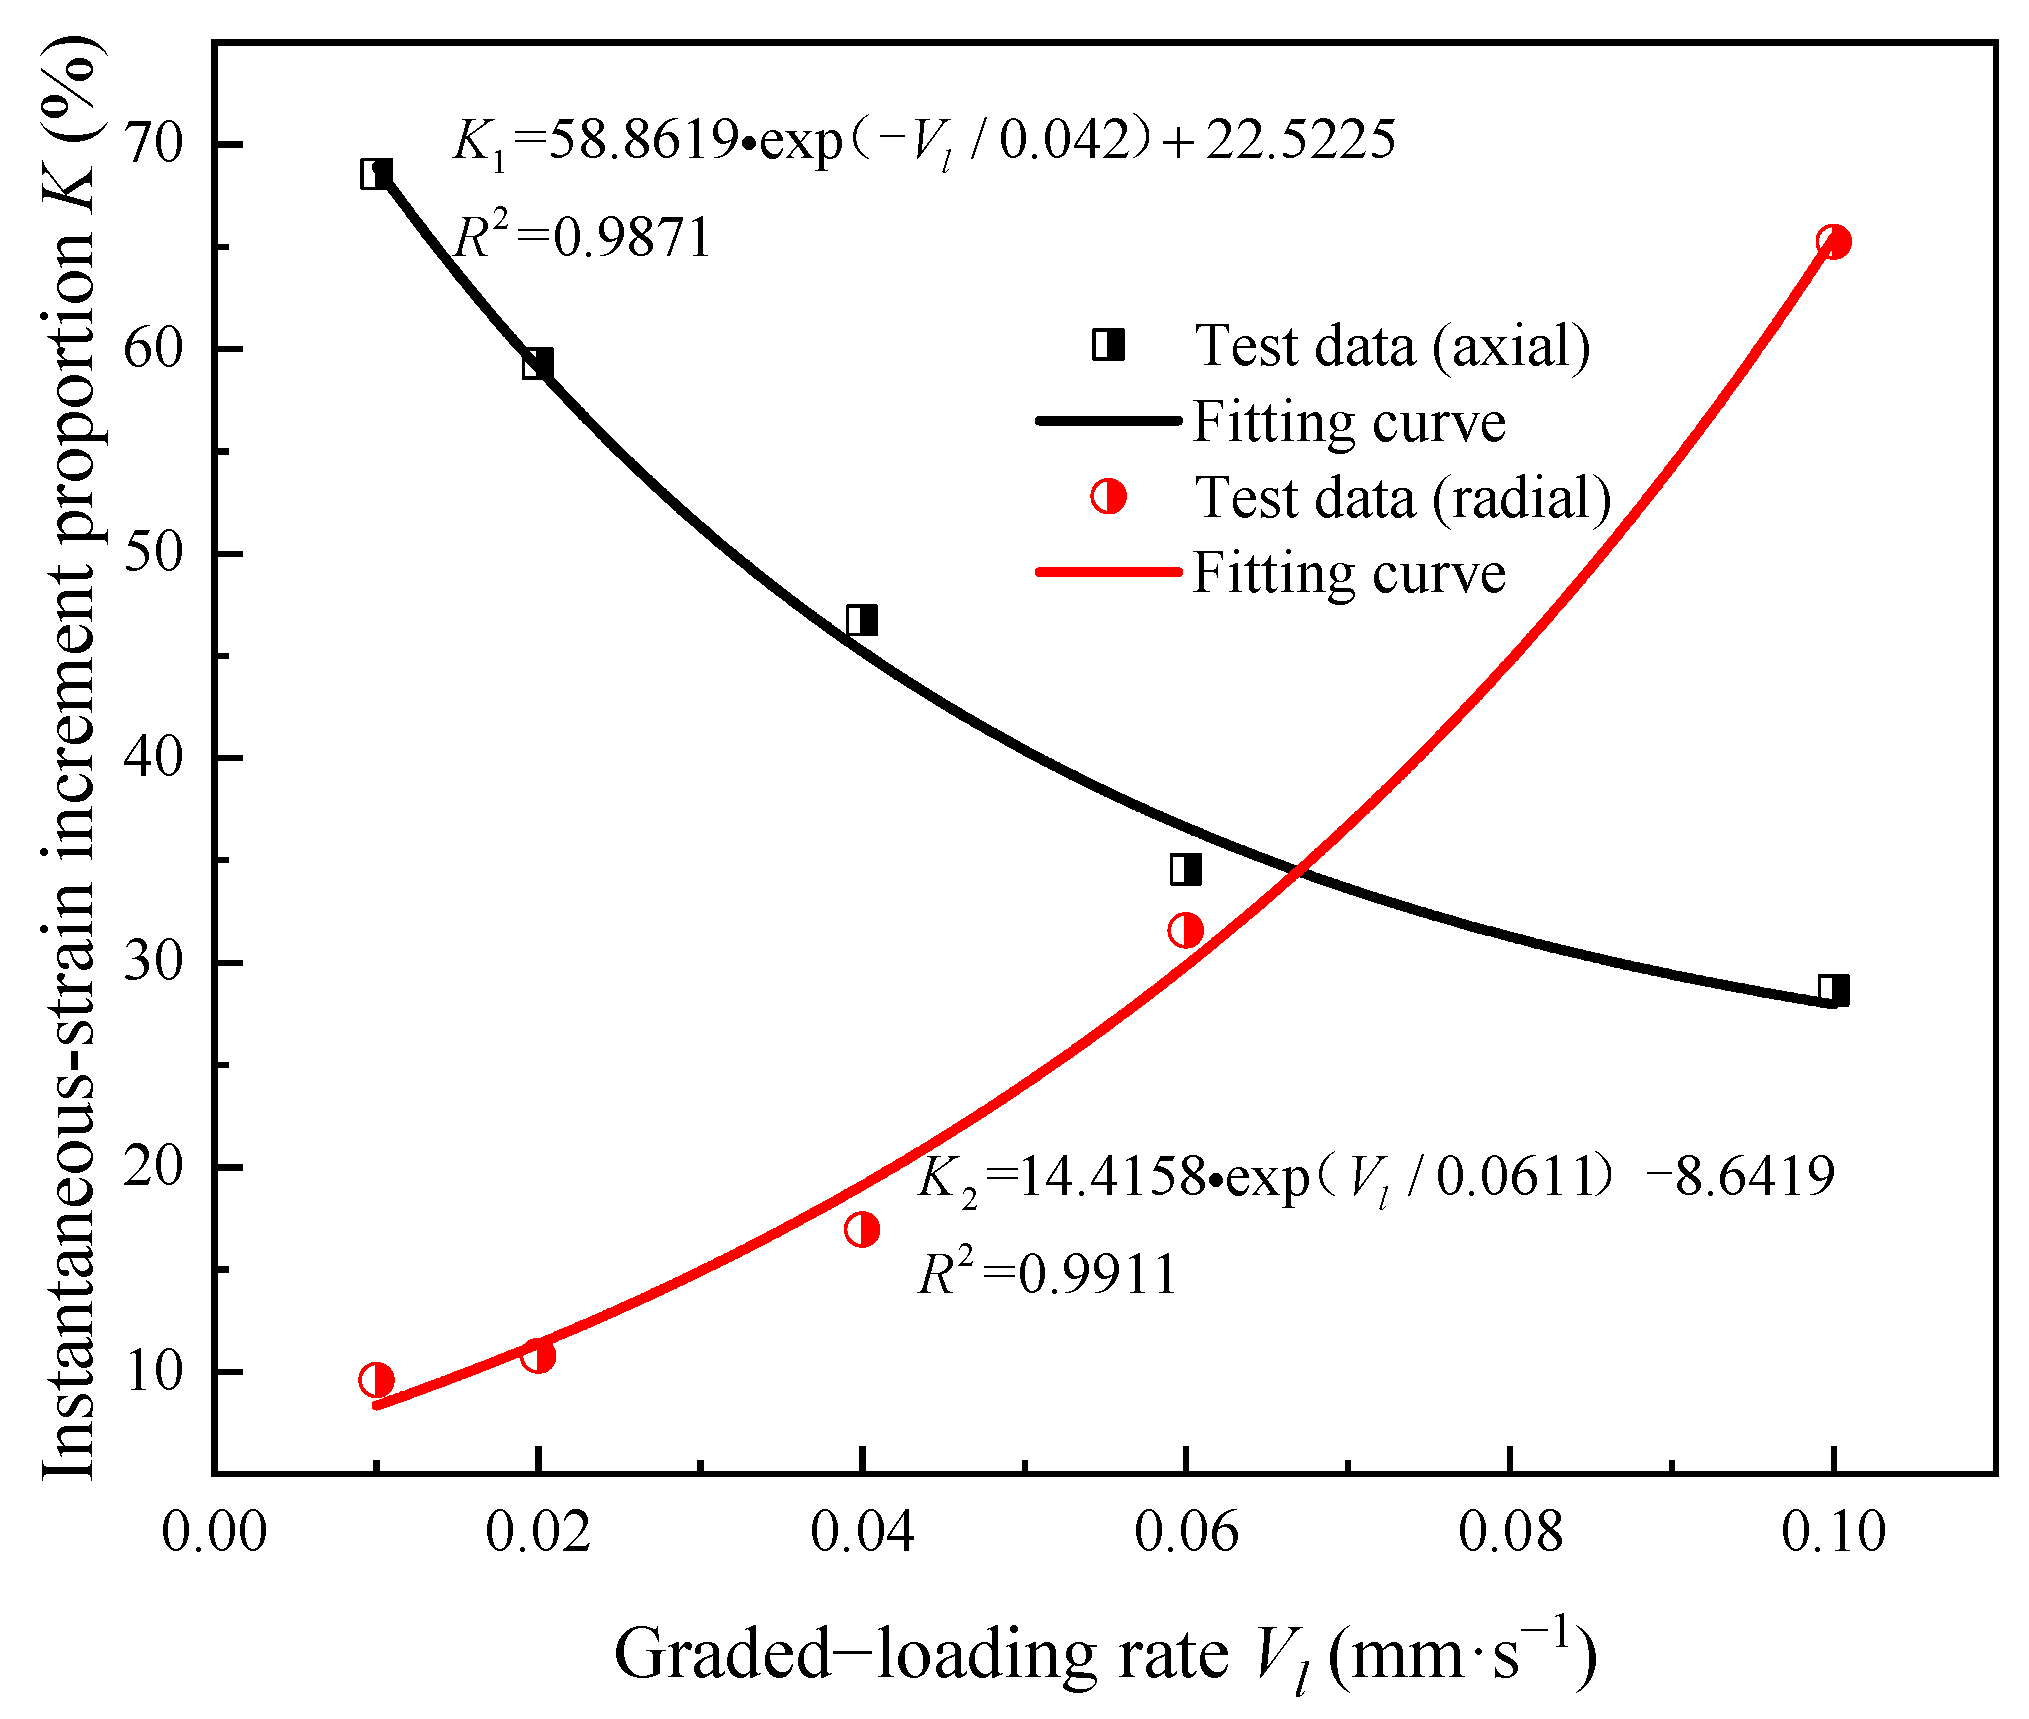
4.1. Relation between the Strain Increment at Each Stress Level and Graded Loading Rate
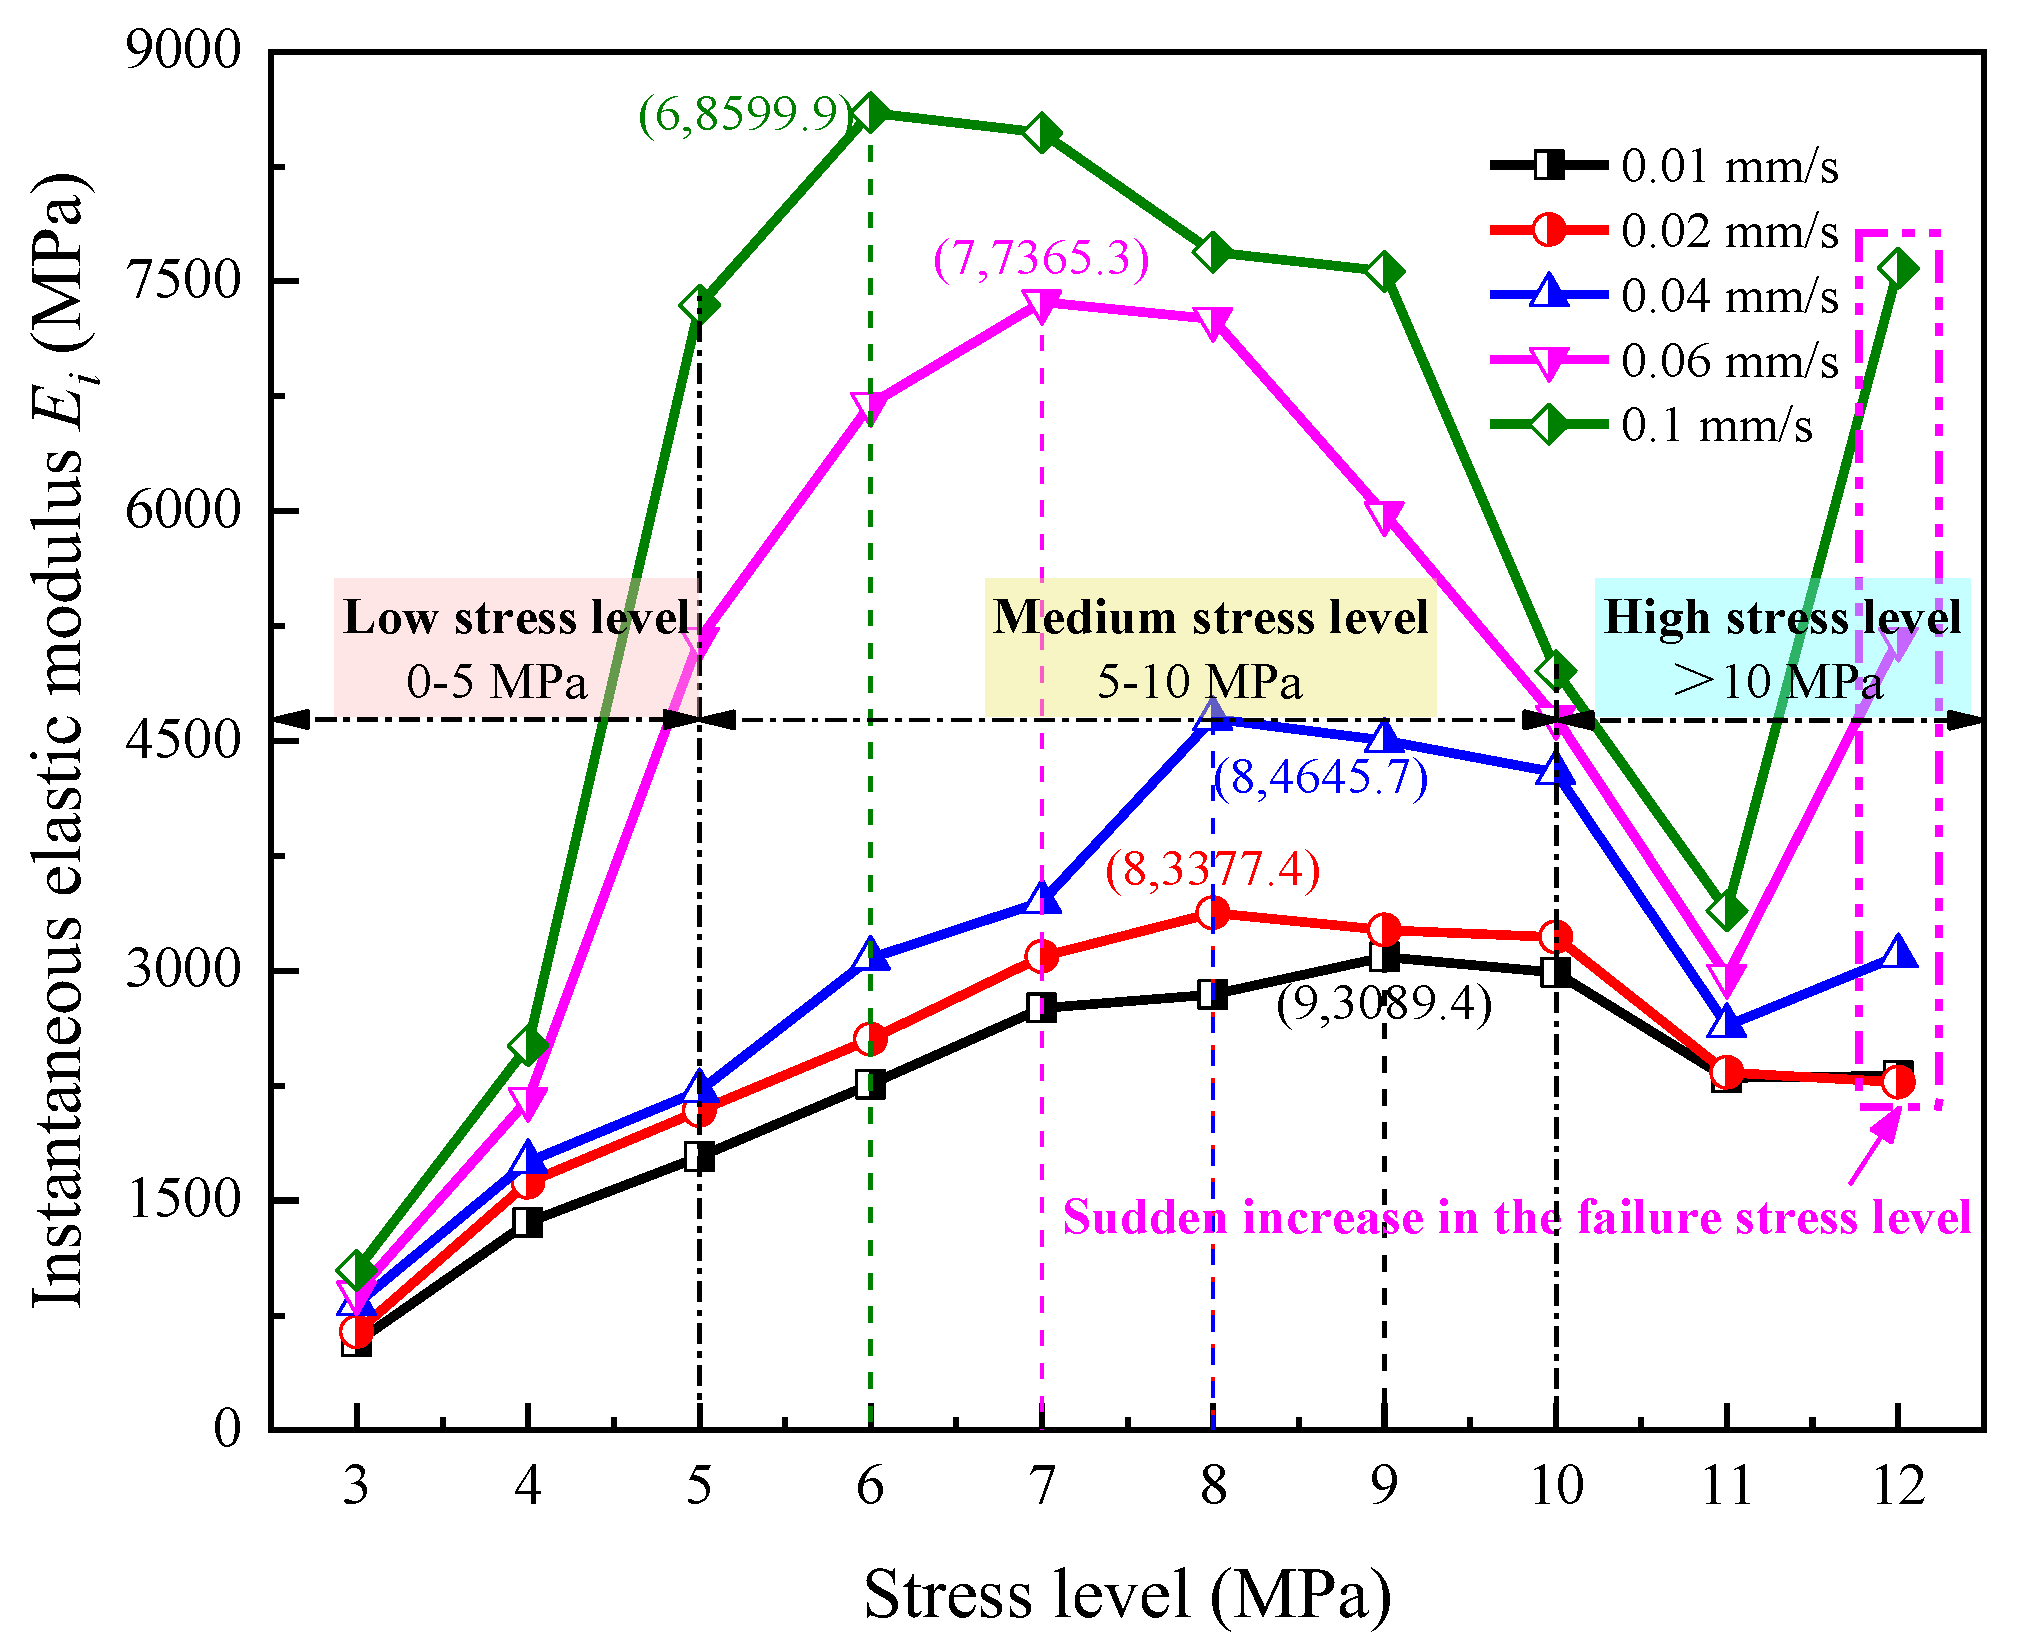
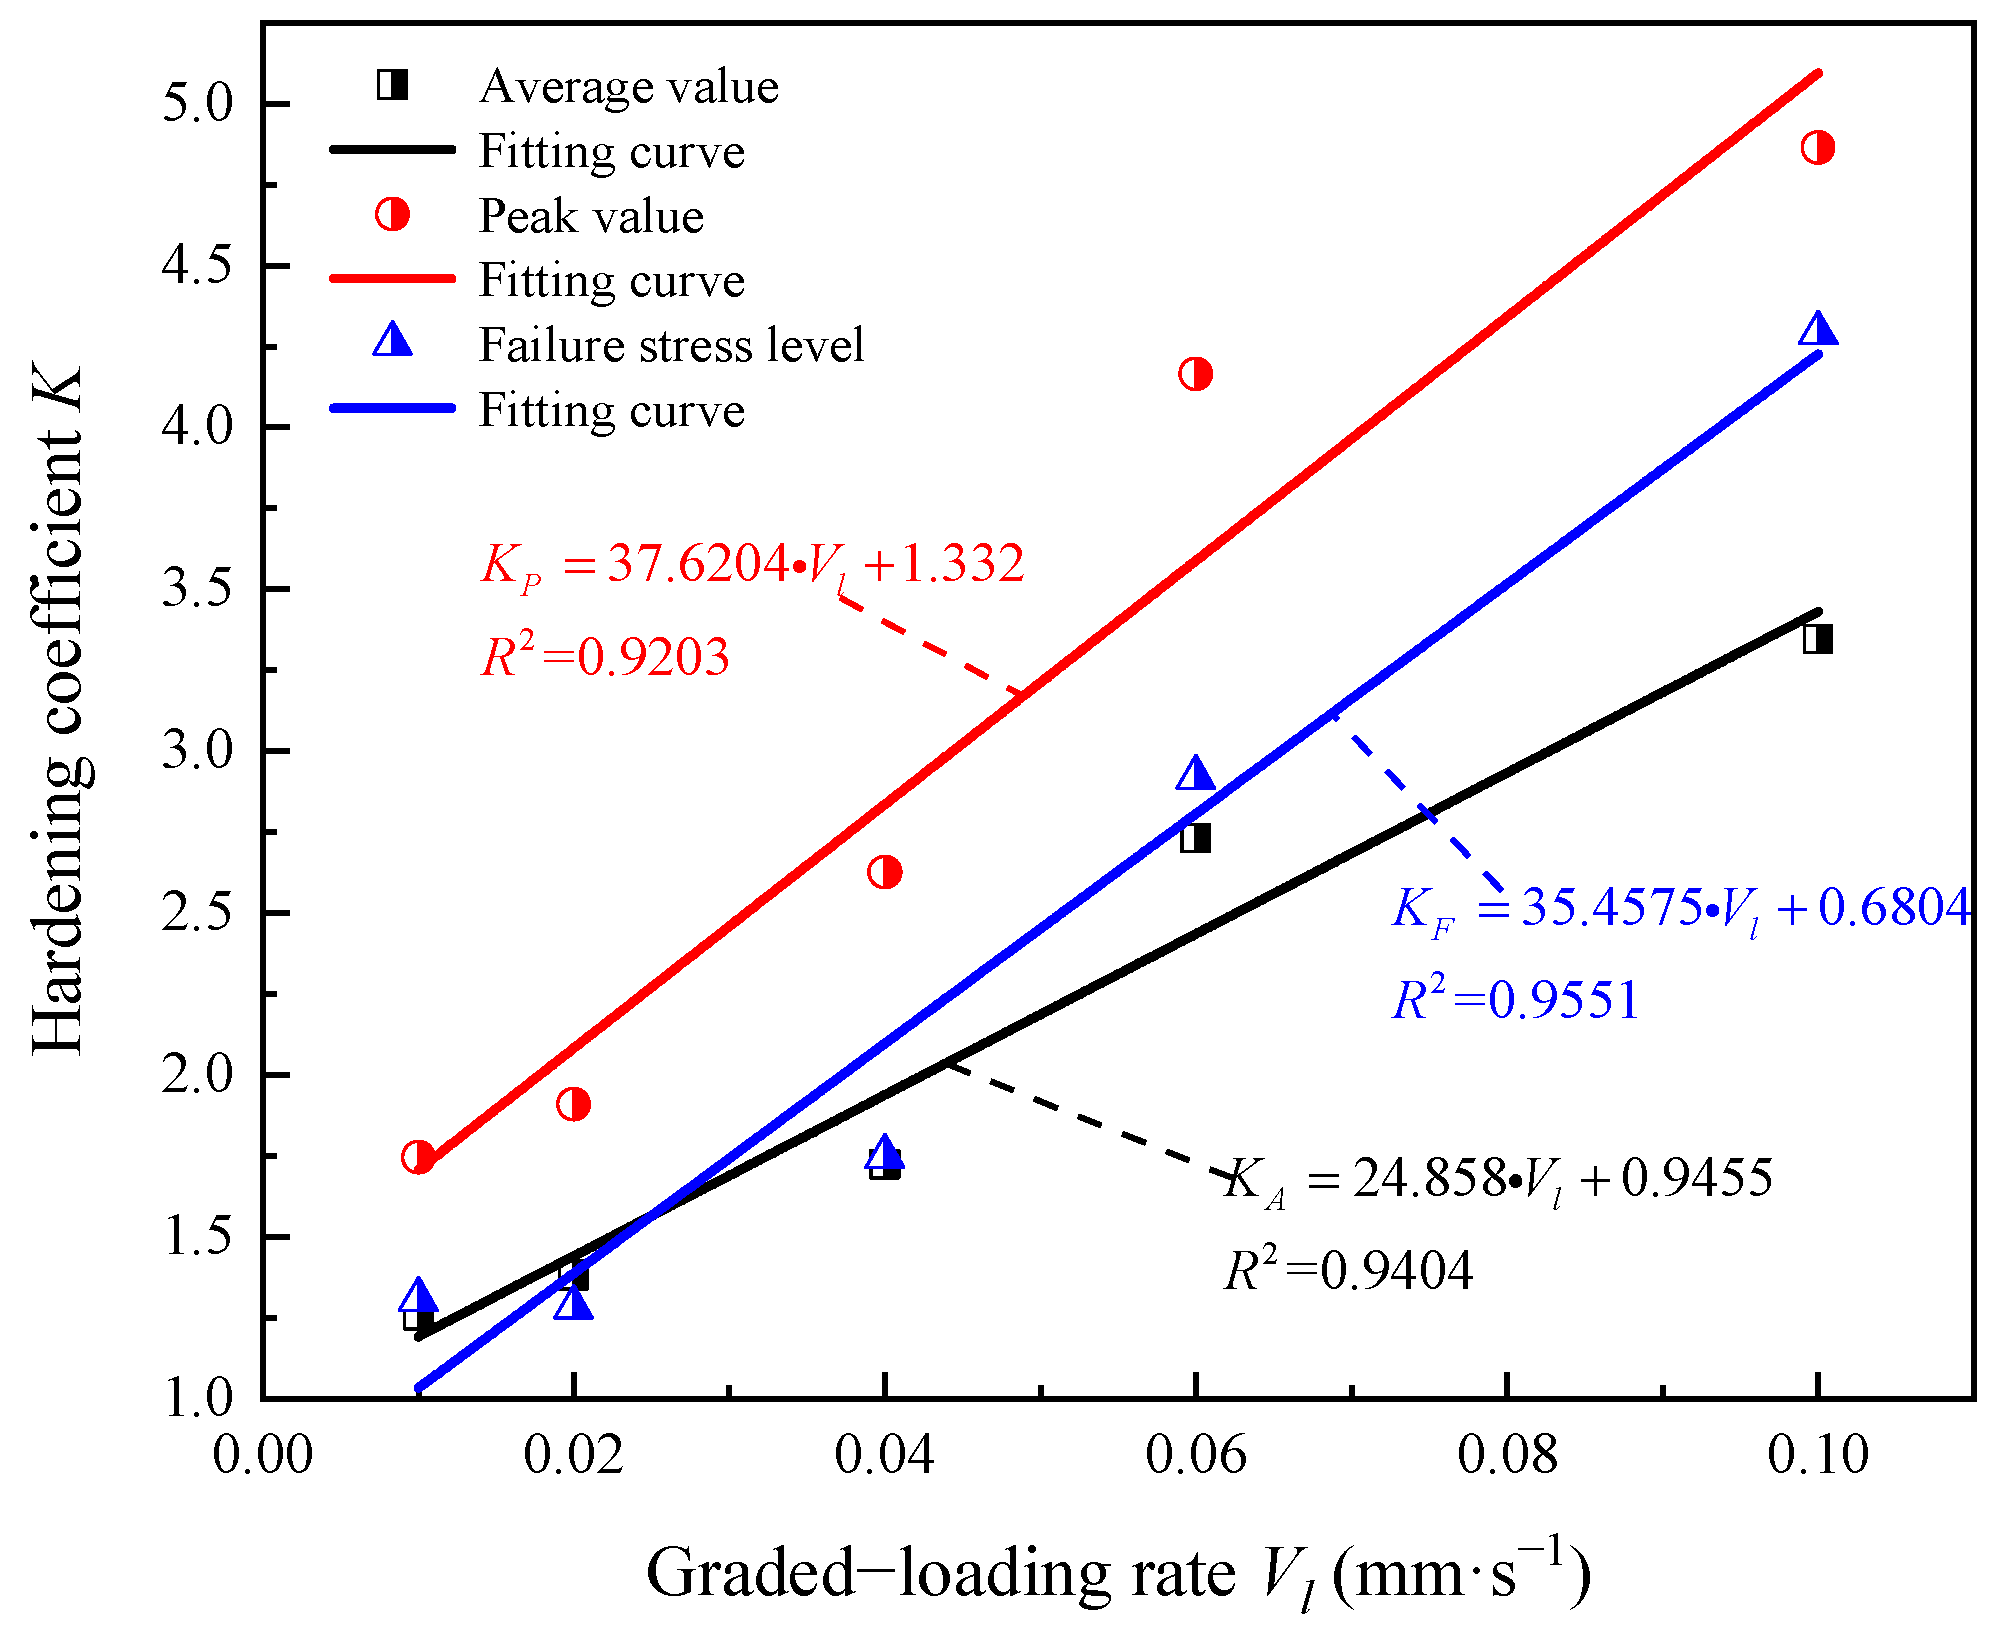
4.2. Evolution Trend of the Instantaneous Elastic Modulus in the Loading Stage
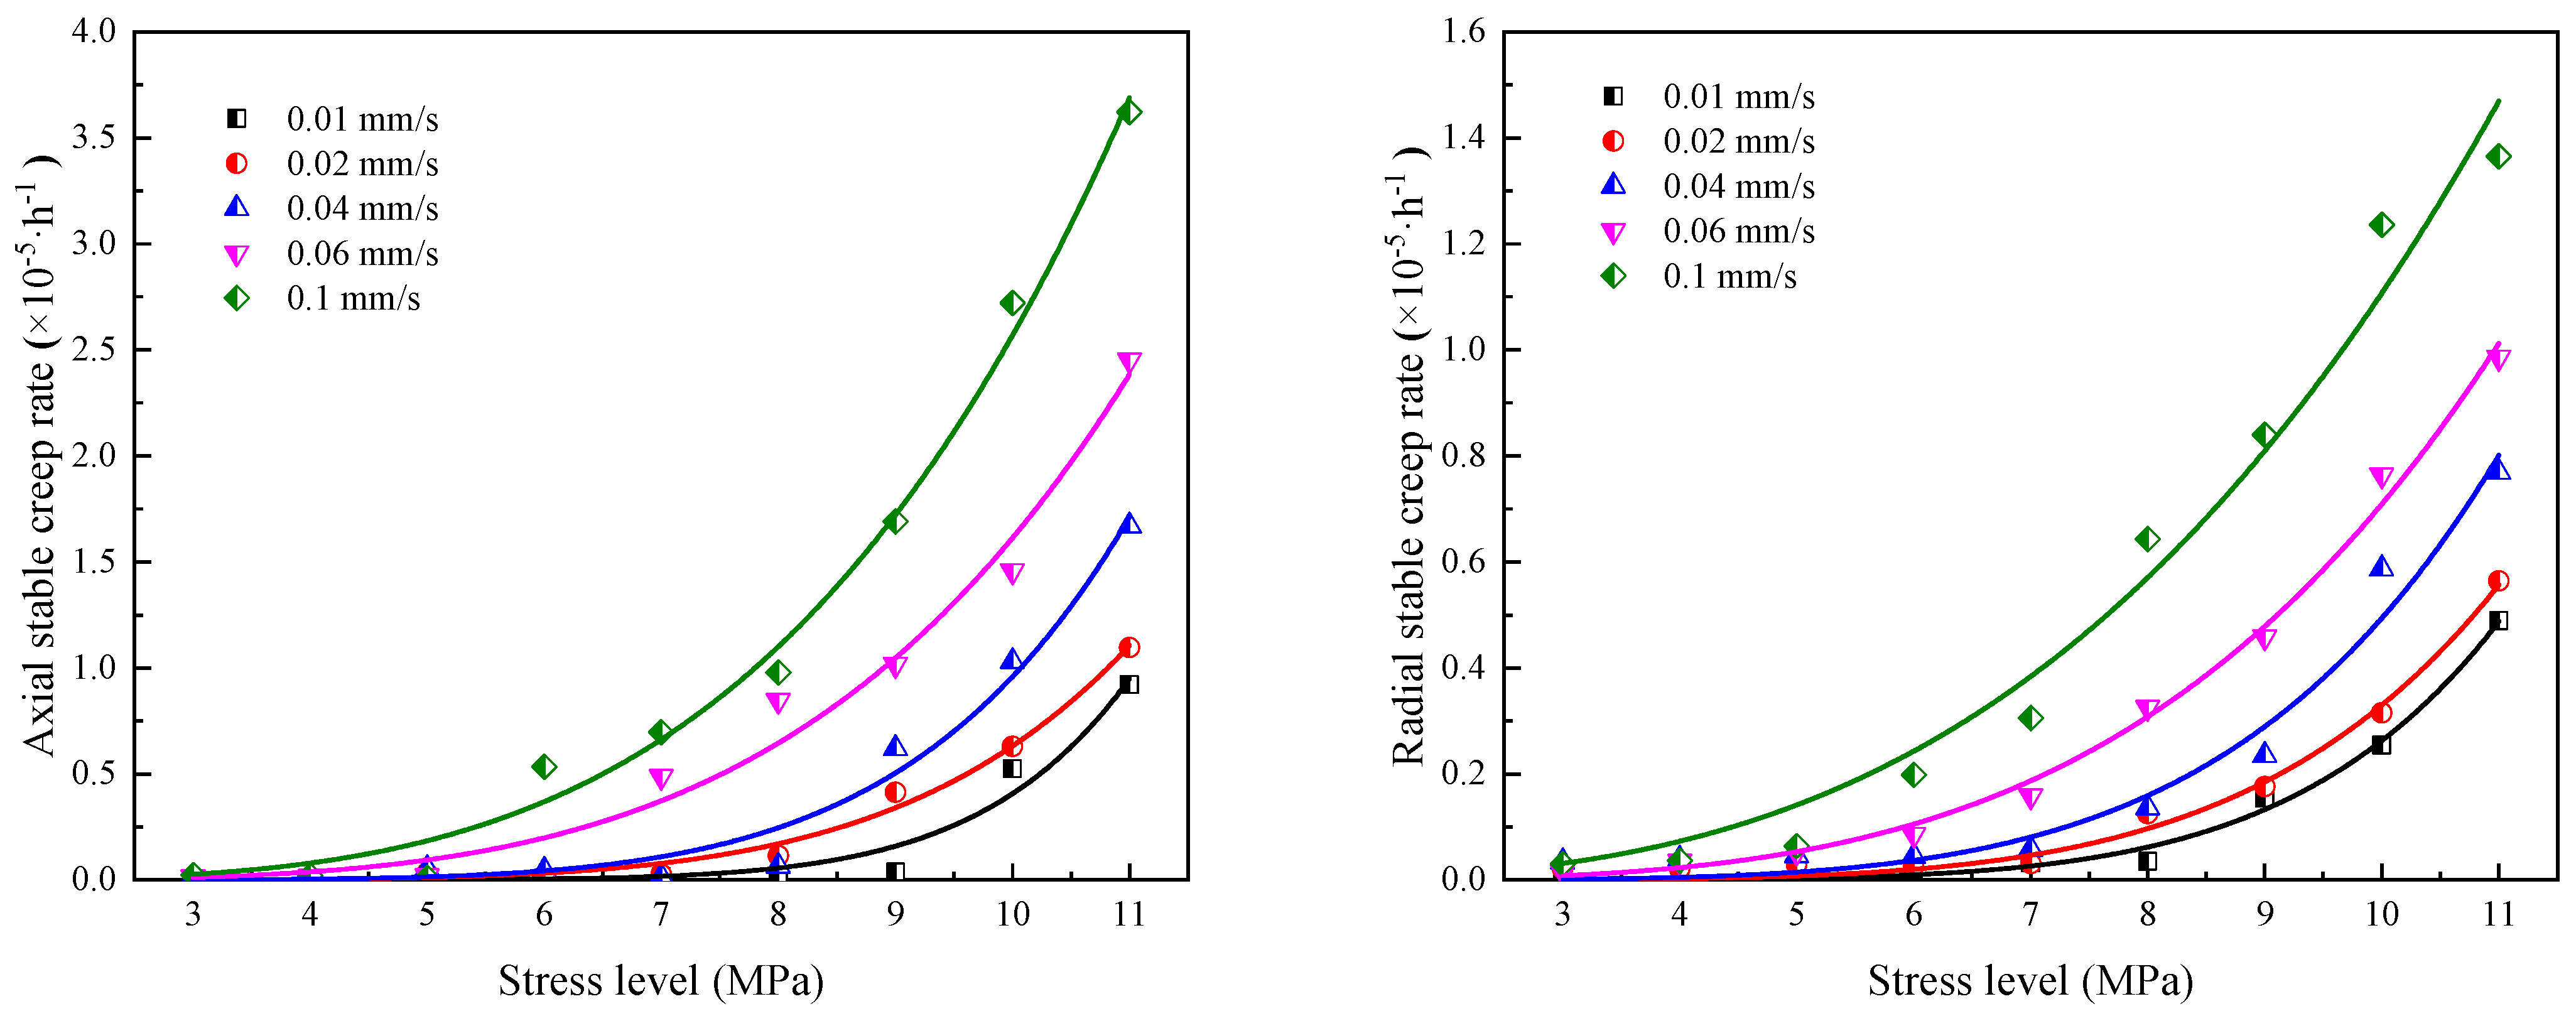
4.3. Characteristics of Strain Rate Decay in the Creep Stage
5. Conclusions
- (1)
- The hardening effect of the sample prepared in this study manifested as increasing instantaneous elastic modulus at the loading stage and decreasing strain rate at the creep stage.
- (2)
- The graded loading rate directly affects the instantaneous modulus of elasticity of the samples. With stress level increasing, the instantaneous elastic modulus at each stress level exhibited an increase–decrease–increase trend. The actual yield levels corresponding to the peak instantaneous elastic moduli of the samples are 9, 8, 8, 7, and 6 MPa, which linearly decreased with increasing graded loading rates.
- (3)
- With graded loading rates increasing from 0.01 to 0.1 mm/s, the instantaneous elastic modulus increases by 0.15–2.63 times, the elastic modulus hardening coefficient and the graded loading rate exhibit an increasing linear relation; when the graded loading rate was >0.04 mm/s, the hardening effect was considerably enhanced.
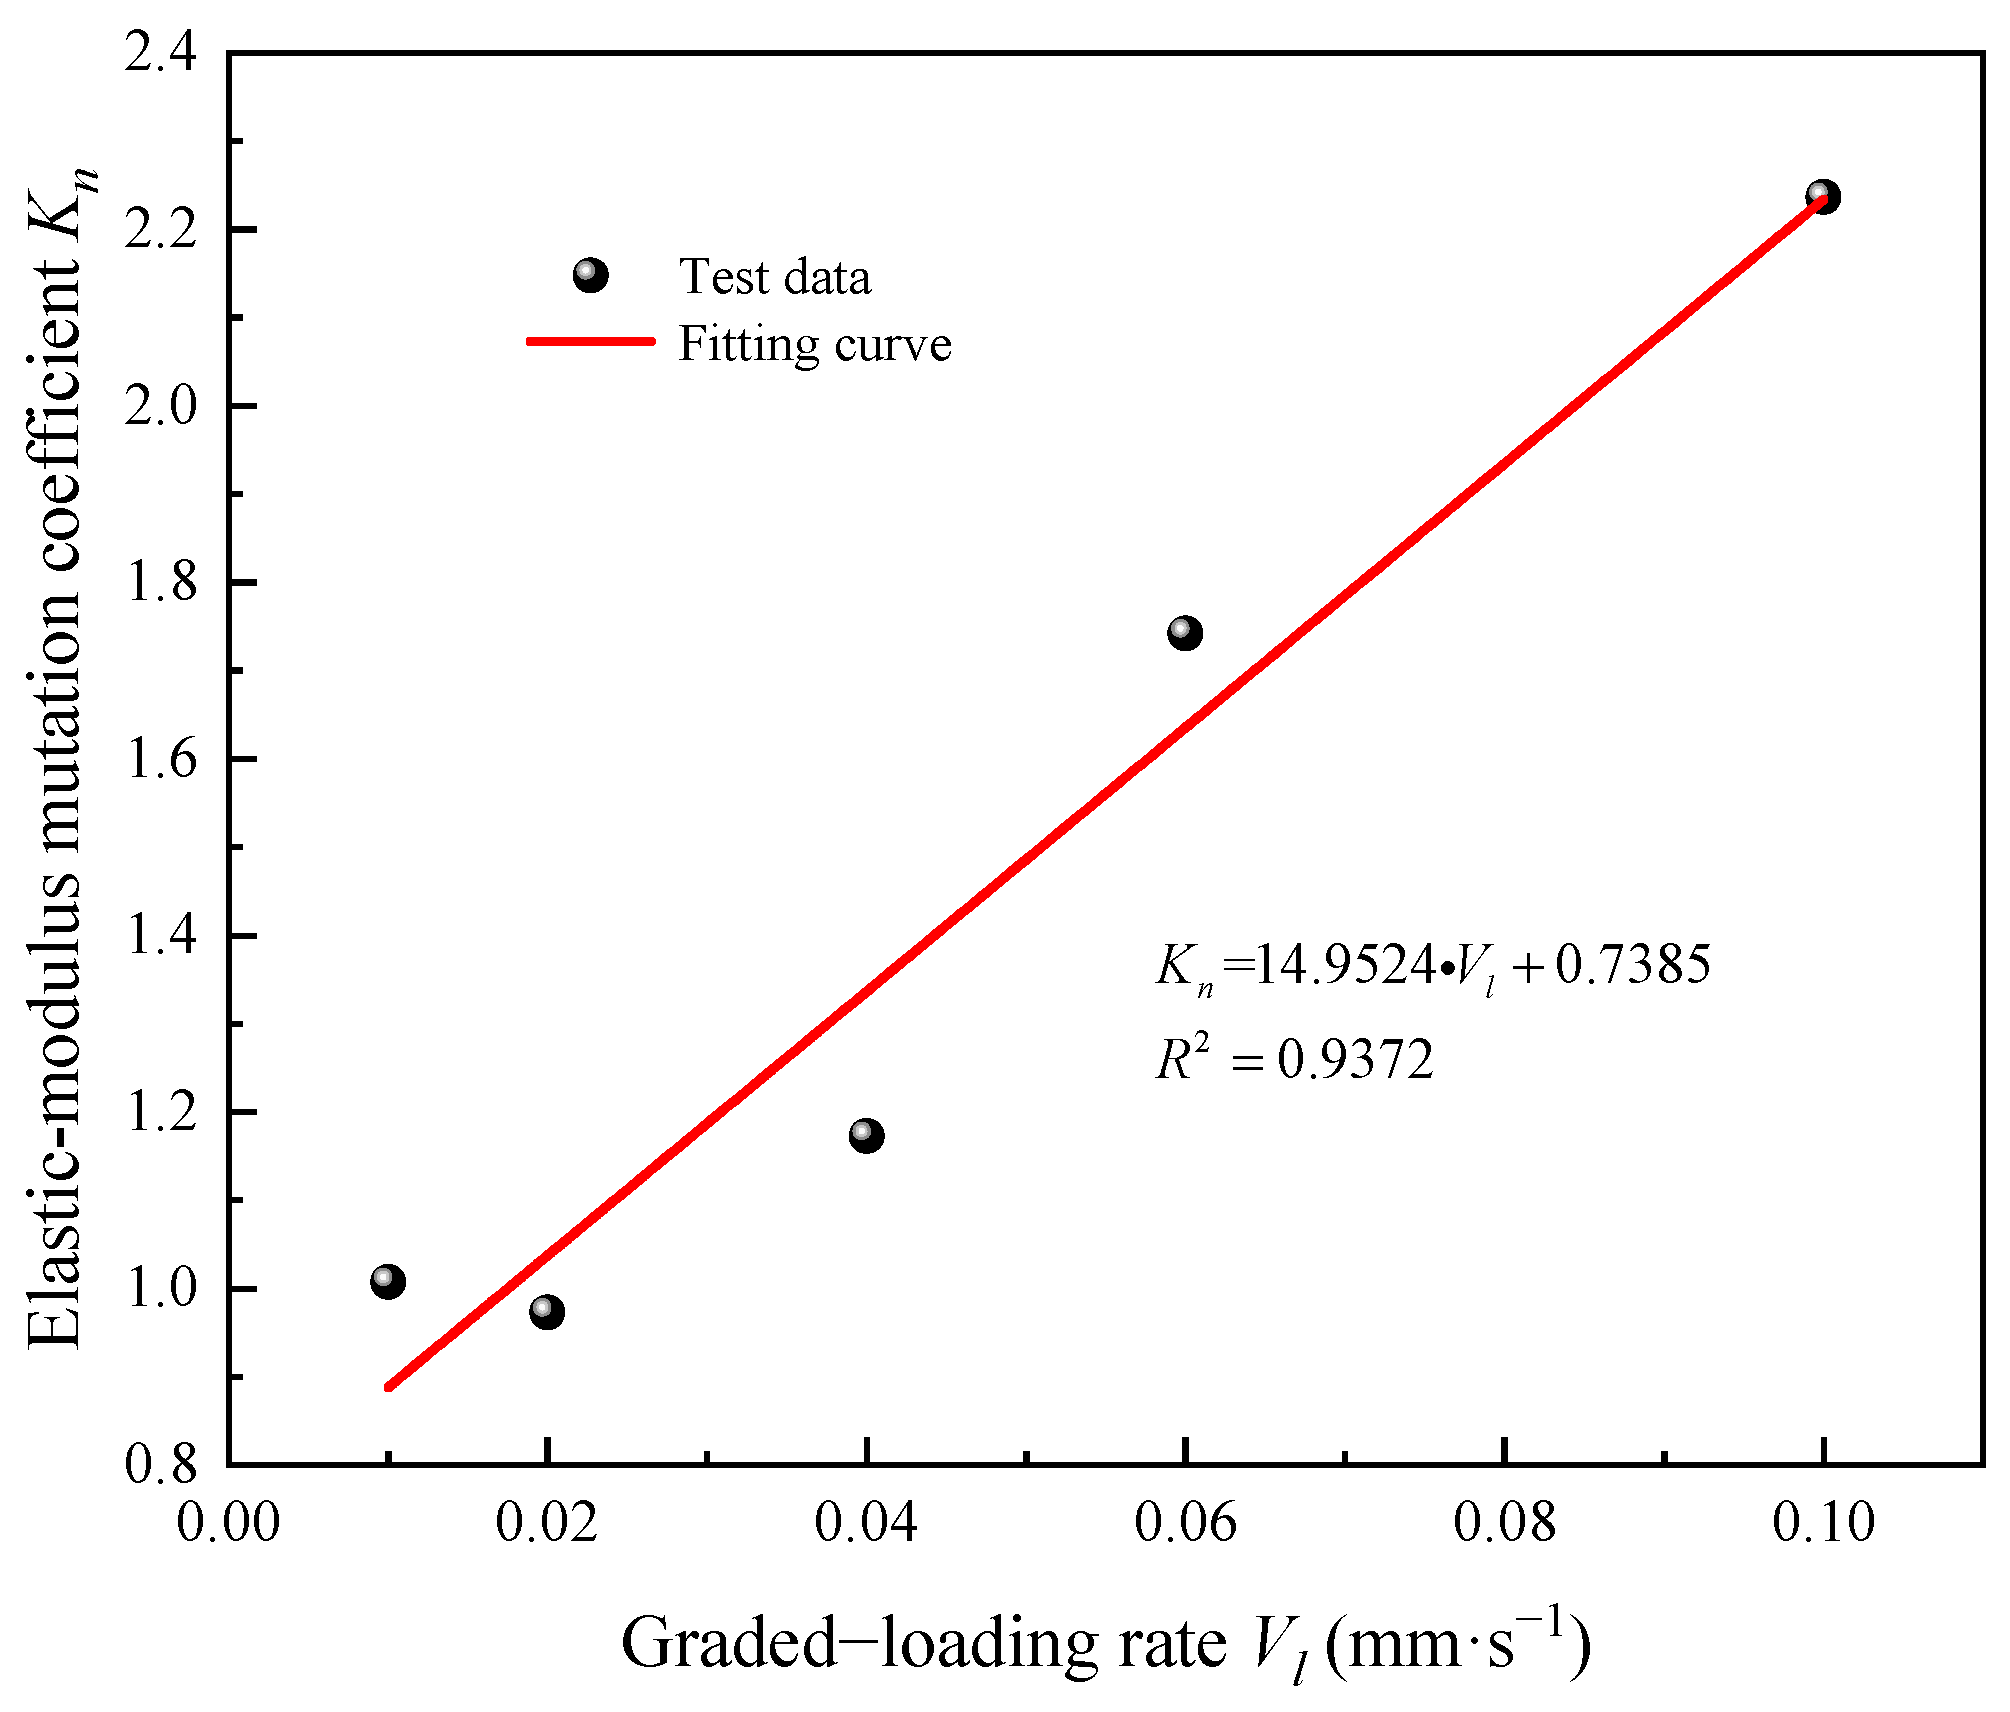
- (4)
- The hardening effect of the elastic modulus of the samples abnormally increased at the failure stress level compared with that at the previous stress level. With increasing graded loading rates, the mutation coefficient increased from 1.007 to 2.236, which linearly increased with increasing graded loading rates. When the graded loading rate was >0.04 mm/s, the sudden increase in the instantaneous elastic modulus resulted in a rapid accumulation of elasticity energy, which well explains the instantaneous failure and instability of the samples.
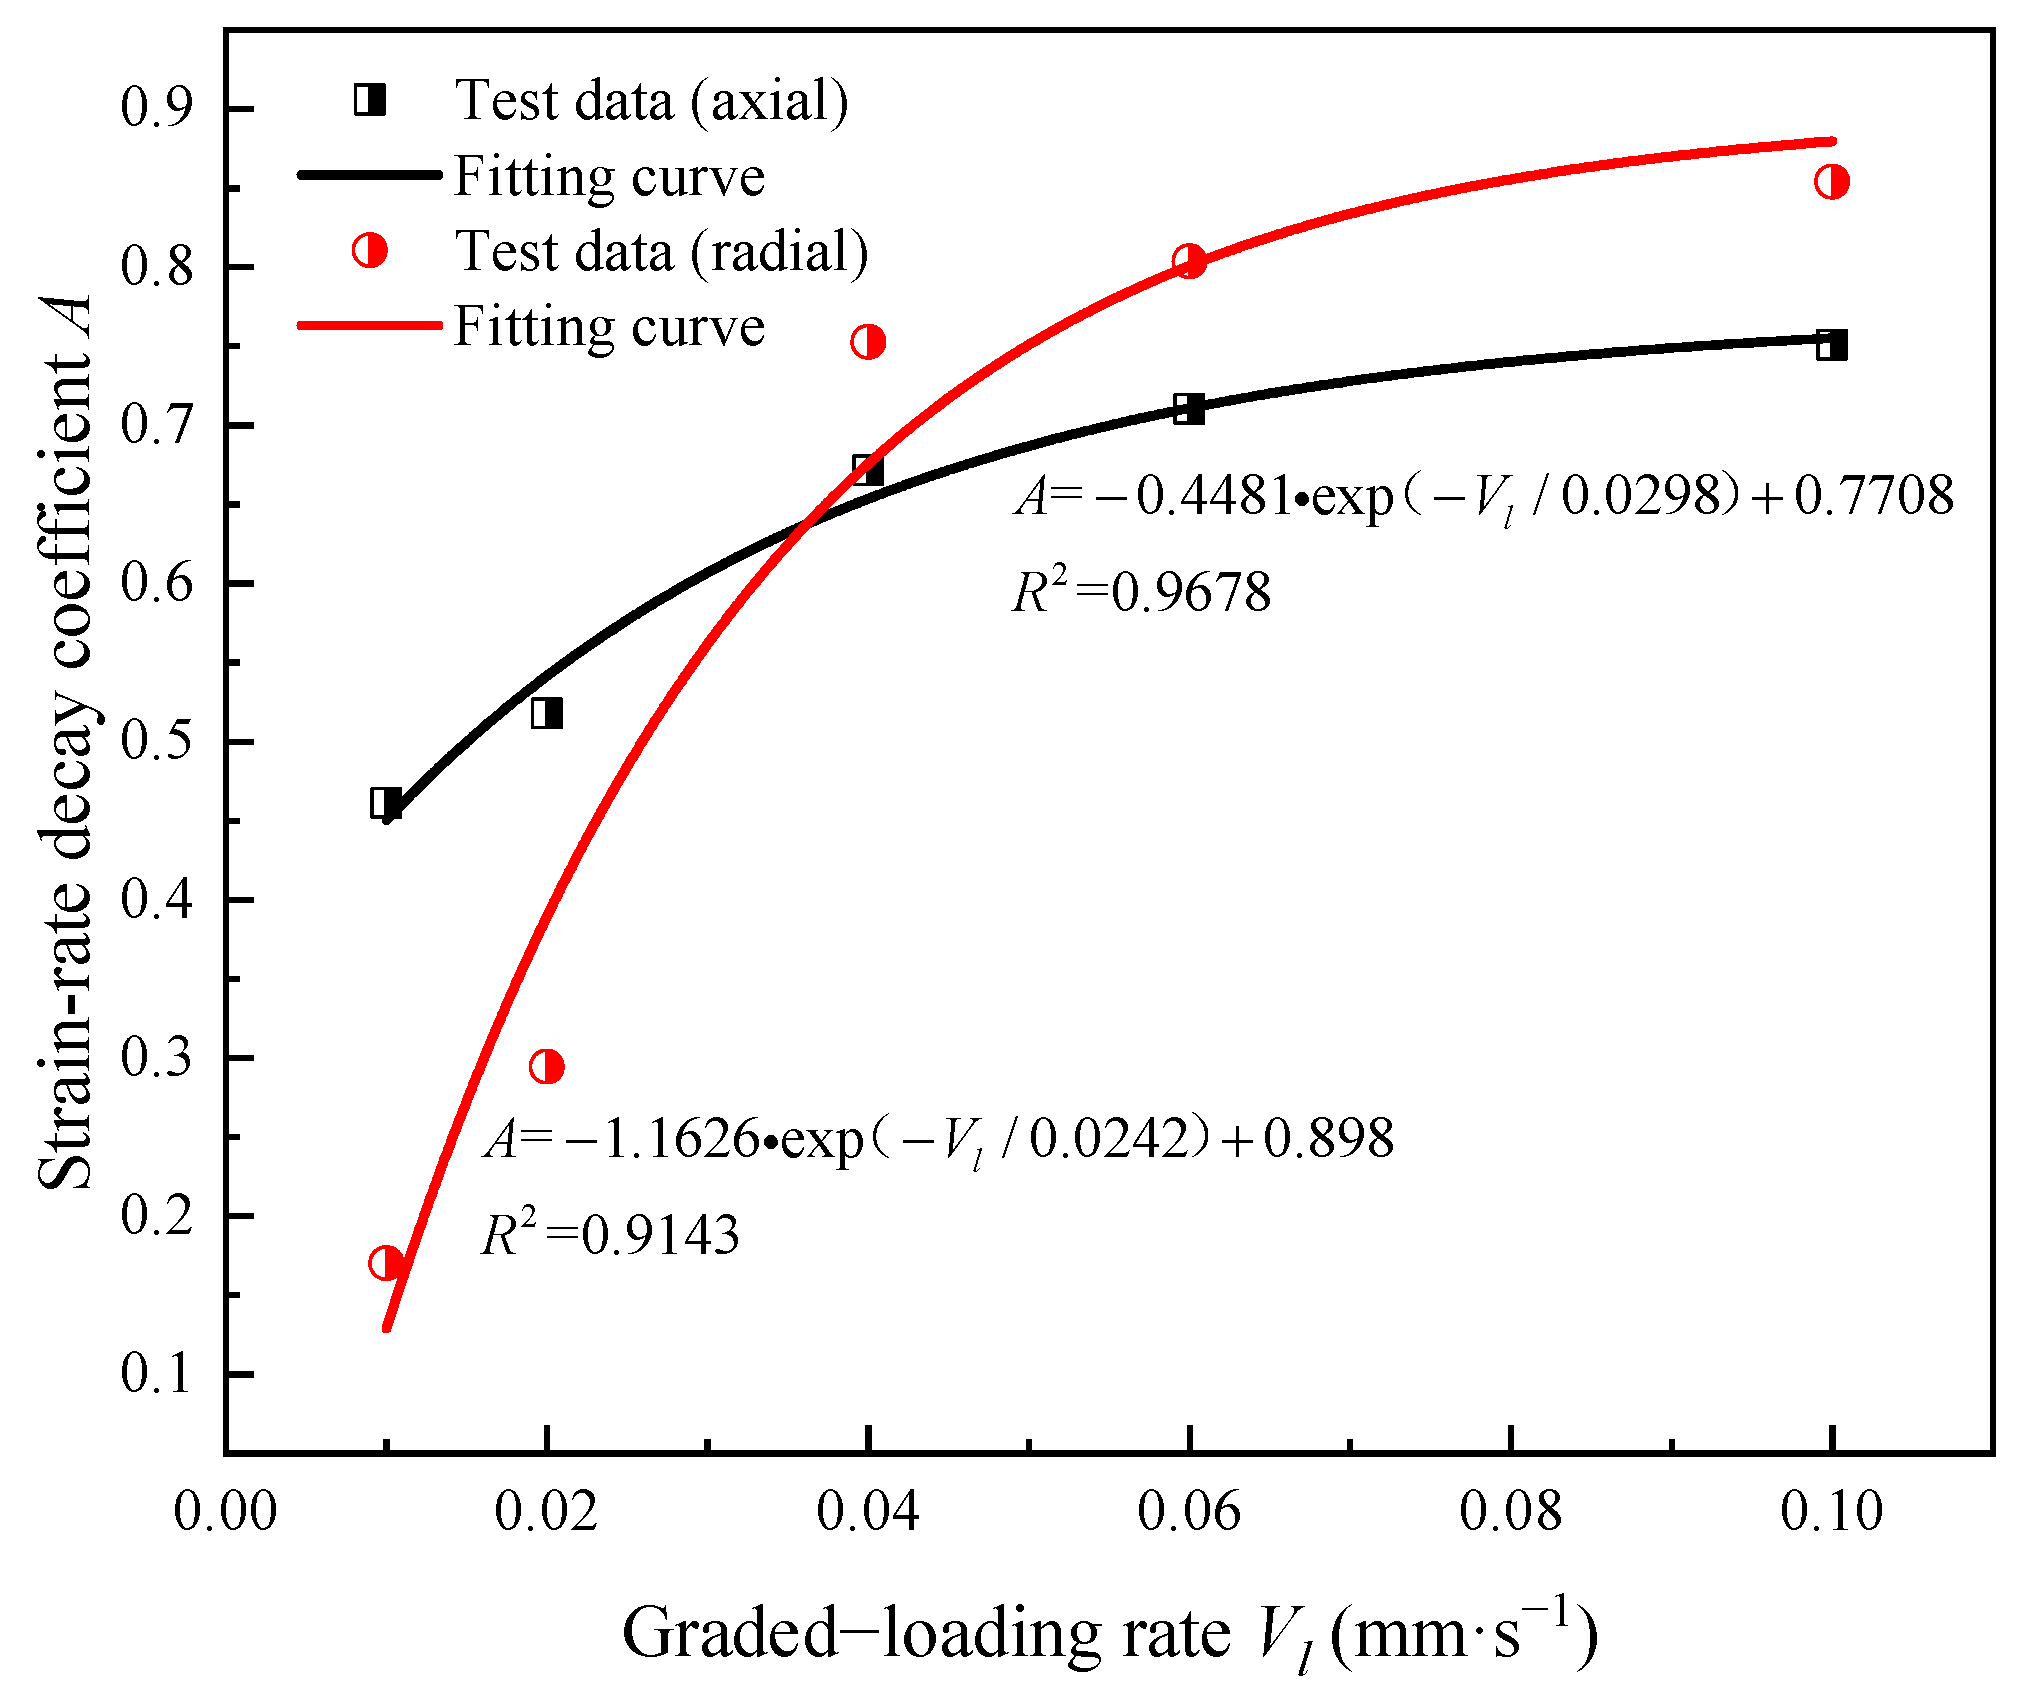
- (5)
- The initial strain rate attenuation coefficient and graded loading rate exhibit an exponential relation. With increasing graded loading rates, the attenuation of the initial axial strain rate increases from 46.1% to 75.1%, and that of the initial radial strain rate increases from 17.0% to 85.4%. Moreover, the time of the decay creep stage for the radial strain is longer than that for the axial strain; the radial strain indicates clear hysteresis.
Author Contributions
Funding
Institutional Review Board Statement
Informed Consent Statement
Data Availability Statement
Acknowledgments
Conflicts of Interest
References
- Xu, Z. Research on Remnant Coal, Fully-Mechanized Mining Technology and Strata Behavior Regularity with the Old Mining Method. Ph.D. Thesis, Taiyuan University of Technology, Taiyuan, China, 2016. [Google Scholar]
- Zhang, X. The Theory of Surrounding Rock Control and the Assessment Research of Recoverability in Thick Residual Coal Seam Remining Stope. Ph.D. Thesis, Taiyuan University of Technology, Taiyuan, China, 2015. [Google Scholar]
- Zhang, X.; Gong, P.; Wang, K.; Li, J.; Jiang, Y. Characteristic and Mechanism of Roof Fracture Ahead of the Face in an LTCC Panel When Passing an Abandoned Roadway: A Case Study from the Shenghua Coal Mine, China. Rock Mech. Rock Eng. 2019, 52, 2775–2788. [Google Scholar] [CrossRef]
- Xu, Y.; Ren, F.; Ahmed, Z.; Wang, K.; Wang, Z. Mechanical Characteristics and Damage Evolution Law of Sandstone with Prefabricated Cracks under Cyclic Loading. Arab. J. Sci. Eng. 2021, 46, 10641–10653. [Google Scholar] [CrossRef]
- Xu, Y.; Ren, F.; Ahmed, Z.; Wang, K. Mechanical and Fatigue Damage Evolution Properties of Cracked Sandstone under Cyclic Loading. Proc. Pak. Acad. Sci. A. Phys. Comput. Sci. 2020, 57, 59–72. Available online: https://paspk.org/wp-content/uploads/2020/09/ES-706.pdf (accessed on 1 September 2023).
- Wang, X.; Wang, E.; Liu, X.; Zhou, X. Failure mechanism of fractured rock and its AE behaviors under different loading rates. Eng. Fract. Mech. 2021, 247, 107674. [Google Scholar] [CrossRef]
- Liu, Z.; Yang, S.; Bai, Z.; Huang, Y. Creep property and damage constitutive model of dioritic porphyrite under cyclic loading-unloading. Chin. J. Eng. 2022, 44, 143–151. [Google Scholar] [CrossRef]
- Gao, S.; Cao, P.; Wang, S.; Pu, C. Improved nonlinear viscoelasto-plastic rheological model of rock and its correction of hardening coefficient of viscosity. J. China Coal Soc. 2012, 37, 936–943. [Google Scholar] [CrossRef]
- Mishra, B.; Verma, P. Uniaxial and triaxial single and multistage creep tests on coal-measure shale rocks. Int. J. Coal Geol. 2015, 137, 55–65. [Google Scholar] [CrossRef]
- Mansouri, H.; Ajalloeian, R. Mechanical behavior of salt rock under uniaxial compression and creep tests. Int. J. Rock Mech. Min. Sci. 2018, 110, 19–27. [Google Scholar] [CrossRef]
- Andargoli, M.B.E.; Shahriar, K.; Ramezanzadeh, A.; Goshtasbi, K. The analysis of dates obtained from long-term creep tests to determine creep coefficients of rock salt. Bull. Eng. Geol. Environ. 2019, 78, 1617–1629. [Google Scholar] [CrossRef]
- Fan, Q.; Li, S.; Gao, Y. Experimental study on creep properties of soft rock under triaxial compression. Chin. J. Rock Mech. Eng. 2007, 7, 1381–1385. [Google Scholar]
- Wei, E.; Hu, B.; Li, J.; Cui, K.; Zhang, Z.; Cui, A.; Ma, L. Nonlinear Viscoelastic-Plastic Creep Model of Rock Based on Fractional Calculus. Adv. Civ. Eng. 2022, 2022, 3063972. [Google Scholar] [CrossRef]
- Fahimifar, A.; Karami, M.; Fahimifar, A. Modifications to an elasto-visco-plastic constitutive model for prediction of creep deformation of rock samples. Soils Found. 2015, 55, 1364–1371. [Google Scholar] [CrossRef]
- Liang, X.; Xue, X.; Wang, H.; Zhang, C. Damage creep characteristics of rock time-hardening. J. Liaoning Tech. Univ. (Nat. Sci.) 2013, 32, 509–512. [Google Scholar]
- Song, Y.; Lei, S.; Liu, X. Non-linear rock creep model based on hardening and damage effect. J. China Coal Soc. 2012, 37, 287–292. [Google Scholar] [CrossRef]
- Zhang, Q.; Yang, W.; Zhang, J.; Yang, C. Variable parameters-based creep damage constitutive model and its engineering application. Chin. J. Rock Mech. Eng. 2009, 28, 732–739. [Google Scholar]
- Zou, J.; Zhao, T.; Fang, K.; Liu, X. Rock hardening and damage mechanism in step loading creep process. J. Shandong Univ. Sci. Technol. (Nat. Sci.) 2015, 34, 58–67. [Google Scholar] [CrossRef]
- Cai, T.; Feng, Z.; Zhao, D.; Jiang, Y. A creep model for lean coal based on hardening-damage mechanism. Rock Soil Mech. 2018, 39, 61–68. [Google Scholar] [CrossRef]
- Zhang, Z.; Song, Z.; Cheng, Y.; Huo, R.; Song, W.; Wang, K.; Wang, T.; Yang, T.; Liu, W. Acoustic emission characteristics and fracture response behavior of hard rock-like material under influence of loading rate. Coal Geol. Explor. 2022, 50, 115–124. [Google Scholar]
- Ma, Q.; Tan, Y.; Liu, X.; Zhao, Z.; Fan, D.; Purev, L. Experimental and numerical simulation of loading rate effects on failure and strain energy characteristics of coal-rock composite samples. J. Cent. South Univ. 2021, 28, 3207–3222. [Google Scholar] [CrossRef]
- Wang, C.; Wang, C.; Su, C.; Xiong, Z. Effects of different loading rates on Brazilian tension characteristics of limestone. J. Min. Saf. Eng. 2021, 38, 1036–1044. [Google Scholar] [CrossRef]
- Wei, W.; Wei, A.; Duan, M. Effect of axial loading rate on mechanical and permeability properties of raw coal. Saf. Coal Mines 2021, 52, 39–46. [Google Scholar] [CrossRef]
- Zhang, T.; Jing, C.; Wang, X.; Guo, H.; Zhang, L.; Pan, H. Exprimental investigation of the effect of different loading rates on deformation characteristics of porous samples. J. Min. Saf. Eng. 2021, 38, 847–856. [Google Scholar] [CrossRef]
- Zhang, J.; Yang, Y. Rock size effect and acoustic emission characteristics under the influence of loading rate. China Min. Mag. 2021, 30, 205–210. [Google Scholar]
- Li, S.; Long, K.; Zhang, Z.; Yao, X. Cracking process and energy dissipation of sandstone under repetitive impact loading with different loading rates: From micro to macro scale. Constr. Build. Mater. 2021, 302, 124123. [Google Scholar] [CrossRef]
- Wu, M. The effect of loading rate on the compressive and tensile strength of rocks. Chin. J. Geotech. Eng. 1982, 4, 97–106. [Google Scholar]
- Wu, M.; Liu, Y. The effect of intermediate strain rates on mechanical properties of rock. Rock Soil Mech. 1980, 2, 51–58. [Google Scholar]
- Guzev, M.; Riabokon, E.; Turbakov, M.; Kozhevnikov, E.; Poplygin, V. Modelling of the Dynamic Young’s Modulus of a Sedimentary Rock Subjected to Nonstationary Loading. Energies 2020, 13, 6461. [Google Scholar] [CrossRef]
- Marolt Čebašek, T.; Frühwirt, T. Investigation of creep behaviours of gypsum specimens with flaws under different uniaxial loads. J. Rock Mech. Geotech. Eng. 2018, 10, 151–163. [Google Scholar] [CrossRef]
- Sun, L.; Yang, Z.; Tian, B.; Liu, Z.; Li, K. Study on the damage characteristics of rock burst at granite drift under different loading rates. Min. Res. Dev. 2017, 37, 44–49. [Google Scholar] [CrossRef]
- Wang, Y.; Fu, J.; Wang, J. Study on uniaxial loading rate effect and fracture mesoscopic mechanism of mechanical properties of single fractured rock. Min. Res. Dev. 2020, 40, 66–74. [Google Scholar] [CrossRef]
- Gattu, M. Effect of loading rate and material viscosity on fracture energy dissipation. Mater. Today Proc. 2023, in press. [Google Scholar] [CrossRef]
- Oh, S.-W.; Min, G.-J.; Park, S.-W.; Kim, M.-S.; Obara, Y.; Cho, S.-H. Anisotropic influence of fracture toughness on loading rate dependency for granitic rocks. Eng. Fract. Mech. 2019, 221, 106677. [Google Scholar] [CrossRef]
- Xin, Y.; An, D.; Li, M.; Hao, H. Study of red-sandstone post-peak creep test in different loading rates. J. China Coal Soc. 2017, 42, 60–67. [Google Scholar] [CrossRef]
- Wang, J.; Zhang, Q.; Song, Z.; Zhang, Y.; Liu, X. Mechanical properties and damage constitutive model for uniaxial compression of salt rock at different loading rates. Int. J. Damage Mech. 2021, 30, 739–763. [Google Scholar] [CrossRef]
- Huang, P.; Zhang, J.; Damascene, N.J.; Wang, Z.; Li, M. Effect of loading rate on mechanical behavior of coal samples with initial damage accumulation. Mech. Time-Depend. Mater. 2021, 26, 309–322. [Google Scholar] [CrossRef]
- Miyazaki, K.; Tenma, N.; Yamaguchi, T. Relationship between Creep Property and Loading-Rate Dependence of Strength of Artificial Methane-Hydrate-Bearing Toyoura Sand under Triaxial Compression. Energies 2017, 10, 1466. [Google Scholar] [CrossRef]
- Li, J.; Lin, F.; Meng, L.; Zhang, H. Experimental research of varied loading method on creep of limestone. Sci. Technol. Eng. 2015, 15, 67–71+77. [Google Scholar]
- Li, F.; Yang, J.; Liu, W.; Fan, Z.; Yang, Y. Effect of loading rate changing on the mechanical properties of mudstone under uniaxial compression. Rock Soil Mech. 2021, 42, 369–378. [Google Scholar]
- Fan, Z. Study on Creep Characteristics of Mudstone Based on Loading Rate Effect. Master’s Thesis, China University of Mining and Technology, Beijing, China, 2019. [Google Scholar]
- Wang, Y.; Li, X.; Que, J.; Li, S. A porosity calculation method based on CT images and its application. J. Hydraul. Eng. 2015, 46, 357–365. [Google Scholar] [CrossRef]
- Li, J.; Wang, D.; Kang, T. Algorithmic study on rock pore structure based on micro-CT experiment. Chin. J. Geotech. Eng. 2010, 32, 1703–1708. [Google Scholar]
- Ahmed, Z.; Wang, S.; Hashmi, M.Z.; Zishan, Z.; Chengjin, Z. Causes, characterization, damage models, and constitutive modes for rock damage analysis: A review. Arab. J. Geosci. 2020, 13, 806. [Google Scholar] [CrossRef]


| Parameter | Dry Density (g/cm³) | Wet Density (g/cm³) | Longitudinal Wave Velocity (m/s) | Porosity (%) | Water Content (%) |
|---|---|---|---|---|---|
| Measured value | 1.43–1.51 | 1.47–1.56 | 1536.6–1742.8 | 6.87–10.54 | 2.95–3.52 |
| Average value | 1.46 | 1.51 | 1653.40 | 8.28 | 3.18 |
| Standard deviation | 0.02 | 0.03 | 50.35 | 0.94 | 0.18 |
| Sample Number | Type of Test | Graded Loading Rate Vl (mm·s−1) | (s−1) | Axial Loading Path MPa) |
|---|---|---|---|---|
| H-01–H-03 | Conventional compression test | 0.002 | 2 × 10⁻⁵ | Apply axial stress until the sample is damaged. |
| H-04 | Graded loading creep test | 0.01 | 10−4 | 3→4→5→6→7→8→9→10→11→12→13 |
| H-05 | 0.02 | 2 × 10⁻⁴ | ||
| H-06 | 0.04 | 4 × 10⁻⁴ | ||
| H-07 | 0.06 | 6 × 10⁻⁴ | ||
| H-08 | 0.1 | 10−3 |
| Sample Number | H-01 | H-02 | H-03 | Average |
|---|---|---|---|---|
| Peak strength (MPa) | 13.184 | 13.485 | 13.211 | 13.293 |
| Axial peak strain (%) | 0.9949 | 0.9698 | 1.126 | 0.9733 |
| Radial peak strain (%) | 1.139 | 1.054 | 1.187 | 1.127 |
| Elastic modulus (MPa) | 1803.6 | 1895.1 | 1606.1 | 1768.3 |
| Poisson’s ratio | 0.32 | 0.36 | 0.29 | 0.323 |
| Sample Number | Graded Loading Rate Vl (mm·s−1) | Axial Peak Strain | Radial Peak Strain | ||
|---|---|---|---|---|---|
| Value (%) | Compared with That in the Conventional Compression Test (%) | Value (%) | Compared with That in the Conventional Compression Test (%) | ||
| H-04 | 0.01 | 1.259 | +22.23 | 1.352 | +31.65 |
| H-05 | 0.02 | 1.308 | +26.99 | 1.404 | +46.45 |
| H-06 | 0.04 | 1.428 | +38.64 | 2.383 | +132.04 |
| H-07 | 0.06 | 1.256 | +21.94 | 1.856 | +80.72 |
| H-08 | 0.1 | 1.059 | +2.82 | 1.665 | +62.12 |
| Sample Number | Graded Loading Rate Vl (mm·s−1) | (%) (Axial) | (%) (Radial) | ||
|---|---|---|---|---|---|
| Minimum–Maximum | Average | Minimum–Maximum | Average | ||
| H-04 | 0.01 | 57.69–73.85 | 66.54 | 8.85–12.92 | 9.58 |
| H-05 | 0.02 | 52.96–66.61 | 59.27 | 7.12–16.03 | 10.77 |
| H-06 | 0.04 | 33.33–56.74 | 46.72 | 11.95–25.67 | 16.94 |
| H-07 | 0.06 | 25.54–56.15 | 34.56 | 8.65–75.58 | 39.57 |
| H-08 | 0.1 | 6.15–58.53 | 28.64 | 4.90–84.56 | 65.24 |
| Hardening Coefficient K | Graded Loading Rate Vl (mm·s−1) | Fitting Relation | ||||
|---|---|---|---|---|---|---|
| 0.01 | 0.02 | 0.04 | 0.06 | 0.1 | ||
| Average value | 1.259 | 1.383 | 1.725 | 2.731 | 3.346 | |
| Peak value | 1.747 | 1.910 | 2.627 | 4.165 | 4.863 | |
| Failure stress level | 1.310 | 1.285 | 1.751 | 2.921 | 4.291 | |
Disclaimer/Publisher’s Note: The statements, opinions and data contained in all publications are solely those of the individual author(s) and contributor(s) and not of MDPI and/or the editor(s). MDPI and/or the editor(s) disclaim responsibility for any injury to people or property resulting from any ideas, methods, instructions or products referred to in the content. |
© 2023 by the authors. Licensee MDPI, Basel, Switzerland. This article is an open access article distributed under the terms and conditions of the Creative Commons Attribution (CC BY) license (https://creativecommons.org/licenses/by/4.0/).
Share and Cite
Yue, S.; Wang, K.; Zhang, X.; Kang, T.; Yan, J.; Jiang, Y. Creep and Hardening Characteristics of Anthracite under Graded Static–Dynamic Coupled Loading. Appl. Sci. 2023, 13, 10648. https://doi.org/10.3390/app131910648
Yue S, Wang K, Zhang X, Kang T, Yan J, Jiang Y. Creep and Hardening Characteristics of Anthracite under Graded Static–Dynamic Coupled Loading. Applied Sciences. 2023; 13(19):10648. https://doi.org/10.3390/app131910648
Chicago/Turabian StyleYue, Shaofei, Kai Wang, Xiaoqiang Zhang, Tianhe Kang, Jianbing Yan, and Yulong Jiang. 2023. "Creep and Hardening Characteristics of Anthracite under Graded Static–Dynamic Coupled Loading" Applied Sciences 13, no. 19: 10648. https://doi.org/10.3390/app131910648
APA StyleYue, S., Wang, K., Zhang, X., Kang, T., Yan, J., & Jiang, Y. (2023). Creep and Hardening Characteristics of Anthracite under Graded Static–Dynamic Coupled Loading. Applied Sciences, 13(19), 10648. https://doi.org/10.3390/app131910648