Article

A Numerical Simulation Study on DC Positive Corona Discharge Characteristics at the Conductor’s Tip Defect

1
State Key Laboratory of Alternate Electrical Power System with Renewable Energy Source, North China Electric Power University, Beijing 102206, China
2
Department of Computer Application Technology, Huazhong Electric Power Union Staff University, Wuhan 430014, China
*
Author to whom correspondence should be addressed.
Appl. Sci. 2023, 13(18), 10472; https://doi.org/10.3390/app131810472
Submission received: 14 August 2023 / Revised: 7 September 2023 / Accepted: 11 September 2023 / Published: 19 September 2023

Abstract

:
For investigating the relationship between the surface corona discharge of a DC wire and other influencing factors, a hybrid numerical model based on a fluid-chemical reaction was proposed to simulate the discharge process at the tip defect of the wire. Under different defect geometries and gas pressures achieved via simulation, the microscopic process of the reaction and movement of electrons and heavy particles during a positive corona discharge was studied, and characteristic parameters such as corona inception voltage and discharge current were analyzed. Furthermore, through the corona cage test, for a specific electrode configuration, corona inception voltages under different pressures were compared and verified, which showed that the model was reasonable. The results showed that the maximum electron density of the streamer head was about 1 × 10²⁰ m−3, the rise time of the pulse current was about 10 ns, and the decay time was about 300–500 ns. The corona inception voltage decreased with an increase in the tip height and decreases in the tip curvature radius, conductor radius, and background air pressure; the amplitude of the pulse current increased with increases in the wire radius and curvature radius of the defect tip and decreases in tip height and background air pressure. The experimental results are consistent with the simulation results, which verifies the reasonability of the model.

1. Introduction

Ultra-high-voltage direct-current (HVDC) transmission is the main power transmission mode in the project “Power from West to East” in China [1,2]. When there are burrs, broken strands, loose strands, and other tip defects on the surface of the DC transmission line conductor, it is easy to produce a corona discharge at the defect. A corona discharge of transmission lines produces acoustic, optical, and thermal effects, as well as electric energy loss, and the high-frequency electromagnetic pulse generated by the discharge also has a negligible impact on radio communication. Therefore, it is of practical significance to study the characteristics of corona discharge and the influencing factors of DC conductor surface defects [3].
At present, many studies have been carried out on corona discharge on the surface of DC transmission lines at home and abroad [4,5,6,7,8,9,10,11]. These studies pay attention to the physical process of the generation and development of corona discharge and the influence of environmental parameters on corona discharge characteristics such as corona initial voltage, discharge current, and corona loss. Given air temperature and density, Aleksandrov et al. [4] studied the propagation characteristics of a positive streamer in an air gap. Their results showed that the average electric field and maximum charge density required for a streamer bridging the gap can be significantly affected by an increase in temperature or a decrease in density; in addition, the effect of density is less strong than that of temperature. For air pressure, in the range of 400 hPa to 1013 hPa, Pancheshnyi et al. [5] thoroughly analyzed a positive streamer discharge in the air. It was observed that electron concentration decreases by an order of magnitude with a decrease in pressure, while the electric field in the streamer head is rarely affected. In terms of humidity research, the following are representative [6,7,8]: Chen and Wang [6] proposed a numerical model to incorporate the effect of water vapor on corona plasma. The results of the simulation showed that the distribution of electron number density and electron kinetic energy are insensitive to variations in relative humidity due to the relatively low water content. Liu [7] carried out some experimental studies at different humidity levels to obtain the variation of the electric field strength near a wire as well as the distribution of charge density after the occurrence of a corona. Results showed that the impact of increasing humidity on the two are clearly opposite. In detail, at high humidity (>70%), charge density increases while the electric field strength decreases. Aiming at other influencing factors, scholars investigated the effects of rain intensity on the corona inception voltage (CIV) and corona loss (CL) of HVDC lines through indoor experiments [9]. The effect of high altitudes on the CIV of HVDC lines was also measured by using a mobile corona cage in [10]. In [11], the relationship between audible noise (AN) and conductor surface gradients was investigated for stranded conductors, and it was found that increased conductor surface gradients increased AN levels. The research above shows that a DC corona shows different behavior under conditions of specific natural environments and environmental meteorological parameters (temperature, humidity, air pressure, rain, high altitudes, etc.), which have an important and complex impact on the corona discharge of conductor surfaces [12,13,14]. As for corona discharge occurring at the tip defects of wire surfaces, there are, however, few studies focused on the influence of the geometric structures of tip defects on a corona discharge. Moreover, it can be seen from the existing literature that current research on the corona discharge of conductors is mainly based on analysis of macroscopic discharge characteristics (CIV, CL, AN, etc.) and microscopic particle processes (electric field, electric potential, etc.).
At present, there has been extensive discussion and simulation studies on the microscopic processes and discharge mechanisms of coronas, based on plasma chemical reactions. The models used in the simulations can be roughly divided into the global model and the fluid model. The former considers as many chemical reactions as possible to simulate an accurate corona discharge process [15,16,17,18,19], whereas the latter only uses a small number of important chemical reactions to investigate the temporal and spatial evolution of the corona discharge [20,21,22,23,24,25,26]. In contrast, the latter model is considerably less complex. For its application, as in reference [20,21], a numerical model based on plasma chemistry and hydrodynamics, which takes into account 35 collision reactions between 12 particles in dry air, was proposed. Using this hybrid model, electric field distribution, electron temperature distribution, and space charge distribution in the process of DC positive corona discharge were studied. The results obtained can help in understanding air discharge microscopically. Indeed, the macroscopic and microscopic characteristics of corona discharge are always inextricably linked. In [22], a numerical simulation was carried out to obtain voltage–current characteristics of gas discharge, which corresponds to the entire discharge evolution from normal glow discharge to arc discharge. Therefore, according to different discharge stages, voltage–current characteristics can be segmented to obtain the results of plasma parameters for each segment. Furthermore, in reference [23], a hybrid model for investigating the negative corona discharge in an air gap was presented. Researchers analyzed in detail variations in corona discharge current as well as the distribution morphology of particles and the reaction rates of plasma chemistry at certain typical moments. Results indicate that the effects of various chemical reactions vary at different discharge stages, which correspondingly affect the number density changes of particles. To summarize, the studies mentioned above reveal that current simulations of gas discharge mainly focus on the corona discharge of rod–plate electrodes or needle–plate electrodes. Moreover, there are many studies on the microscopic plasma chemistry of coronas, but there are few studies on corona discharge characteristics.
In response to existing problems, in this study, the tip structure of a DC conductor in a two-dimensional plane was established and a hybrid numerical model based on fluid-chemical reactions was used to simulate the discharge process of a defective conductor. During positive corona discharge, the process of the motion and reaction of electrons and heavy particles was studied, and the variation of the characteristic parameters such as corona voltage and discharge current under different defect states and pressure conditions were analyzed. Additionally, relevant experiments were carried out to verify the rationality of the model. In the experimentation, a cavity with a corona cage was designed and built, and the obtained discharge current and corona inception voltage were compared with the results obtained in simulation.

2. Hybrid Numerical Model

2.1. Microscopic Chemical Reactions

The study of gas discharge shows that there are many kinds of particles and associated excited states involved in physical and chemical reactions in the plasma of atmospheric streamer discharge. However, with the relatively low degrees of excitation, dissociation, and ionization of air, integrating all the particles and reactions into a chemical model is difficult and unnecessary. Based on the Pancheshnyi model [5], combined with Peng [15], Liao [21], Georghiou [27], and our current research, a reaction group including e, N2, N2+, N4+, N2O2+, O, O2, O3, O2 +, O4+, O2, and O is established, and a total of 35 plasma microscopic chemical reactions are involved in the reaction group. The equations of some microscopic reactions in the simulation are shown in Table 1.
In Table 1, ki is the reaction rate (The subscript i represents the reaction number), fi(ε) is the collision cross section data, T is the background gas temperature, and Te is the electron temperature. The values of k1 to k4 depend on the calculation of collision cross sections derived from databases such as those of Biagi, Bordage, and Itikawa [28,29].

2.2. Governing Equations of the Numerical Model

The macroscopic numerical model described in this study is based on the hydrodynamical model; its governing equations include: the continuity equations for electrons and heavy particles [30], the energy density equation of electrons [31], and the Poisson equation [5]. In order to introduce the microscopic chemical reactions of plasma into the macroscopic model, the Boltzmann equation [32] is used to calculate the electron transport coefficient (such as mobility, diffusion coefficient) and chemical reaction rate. The electronic continuity equation is shown in Equation (1), which contains some source terms introduced by the microscopic chemical reactions of plasma.
n e t Γ e = R α R η R ep + R det + S ph + S 0 , Γ e = D e n e n e μ e E ,
where ne is electronic density, Γe is electronic flux, De is the electronic diffusion coefficient, and μe is the electronic mobility. The source terms Rα, Rη, Rep, Rdet, Sph, and S0 respectively represent the collision ionization, the adsorption reaction, the composite reaction, the electron dissociation, the photoionization, and the initial number of electrons; finally, E represents the electric field intensity.
The continuity equation of heavy particles is a multi-component diffusion and transport equation, which is obtained by simplifying the basic Maxwell–Stefan equation. The expression of the multi-component diffusion and transport equation is shown in Equation (2):
ρ w k t + ρ u w k = j k + S k j k = ρ w k v k v k = D kM w k w k + D kM M n M n + D kT ρ w k T T z k μ kM E S P = R α R ep R np + S 0 S N = R η R np ,
where ρ is the density of the mixture, wk is the mass fraction of heavy particles (index k is the number of heavy particles), u is the average velocity vector of fluid, jk is the diffusion flux vector of heavy particles, Sk is the source term of heavy particles (indexes P and N represent positive and negative ions, respectively), vk is the diffusion velocity vector of heavy particles, DkM is the Maxwell diffusion coefficient, Mn is the average molar mass of the mixture, Dk is the thermodynamic diffusion coefficient, zk is the charge of heavy particles, μkM is the average mobility of heavy particles, and Rnp is the compound reaction term of positive and negative ions.
In the microscopic chemical reactions of plasma, the average energy density of electrons directly affects the reaction’s rate and the energy transfer’s rate when electrons collide with other particles [33]. In order to describe the generation and loss mechanism of electron energy in the corona discharge process, considering the influence of temperature, the electron energy conservation equation is shown in Equation (3):
n ε t + Γ ε + E T e = S ε Γ ε = D ε n ε n ε μ ε E T e = 2 n ε 3 k B n e ,
where nε is the energy density of electrons, Γε is the average energy flux of electrons, Dε is the electron diffusion coefficient, με is the electron mobility, and kB is the Boltzmann constant. Sε represents the average energy source for electrons.
The Poisson equation is used to solve the electric field according to the density distribution of electrons and heavy particles, then the calculation results are input into Equations (1)–(3) and the Boltzmann equation to update the density of charged particles, the average energy density of electrons, and the chemical reaction rate. The expression of Poisson’s equation is as shown in Equation (4) and the Boltzmann equation is shown in Equation (5):
2 ϕ = ρ ε 0 = e n p n n n e ε 0 E = φ ,
where ρ is the amount of charge, ε0 is the dielectric constant of vacuum gas, ni is the number density of charged particles (The subscripts e, p, and n respectively represent electrons, positive ions, and negative ions), and φ represents the electric potential.
f t + ν 1 cos θ f z e m e E ( cos θ f ν 1 + sin 2 θ ν 1 f cos θ ) = C ( f ) ,
where f is the probability distribution function of electrons and ions, ν is velocity, t is time, θ and z are the position coordinates in the cylindrical coordinate system, E is the electric field intensity, and C(f) represents the change in f caused by electron collision. Assuming that the electric field and the electron collision are in a uniform space, f in the six-dimensional phase space (three-dimensional position and three-dimensional velocity) is symmetrical and only changes along the direction of the electric field.

2.3. Boundary Conditions and Initial Values

The governing equations in the hybrid numerical model are solved based on Comsol Multiphysics 6.0. Actually, when there is a burr defect on the surface of a DC wire, corona discharges are concentrated at the tip of the burr. In order to simulate this phenomenon and reduce the solution difficulty, a two-dimensional geometric structure comprising a corona cage, wire, and burr tip defect is established, as shown in Figure 1.
In Figure 1, the center of the model represents the wire and the tip defect structure, and their enlarged diagram is pointed out by the red arrow, where the wire radius is R, the tip height is h, and the radius of curvature of the tip is r. The outer edge of the model simulates the corona cage wall, with a maximum radius of 200 mm from the center. The corona cage wall is set to be effectively grounded, and a positive voltage U is applied on the surface of the central conductor. The expression of the voltage is shown in Equation (6).
U = U app tanh 1 × 10 4 t ,
where the voltage unit is kV, the time unit is ns, and the model background temperature is 293.15 K.
The initial density of charged particles is set to a Gaussian distribution with the tip as the origin. As shown in Figure 2, compared with the uniform distribution, the Gaussian distribution converges faster and has little effect on the corona discharge characteristics.
The boundary’s flux conditions of electrons, electron energy, and heavy particles at the metal electrode are set according to Equation (7):
n Γ e = 1 γ e 1 + γ e 1 2 v eth n e P γ P Γ P n n Γ ε = 1 γ e 1 + γ e 5 6 v eth n ε P γ P ε P Γ P n n Γ k = 1 4 v kth n k ,
where n is the boundary’s normal vector, γe is the reflection coefficient of electrons on the electrode surface, veth is the thermodynamic velocity of electrons, γP is the secondary emission coefficient of electrons on the electrode surface, εp is the average energy of secondary electrons emitted from the cathode, and vkth is the thermodynamic velocity of heavy particles.
When the boundary condition is applied to the cathode, γP is 0.004; and when it is applied to the anode, γP is 0. The average energy of secondary electrons emitted from the electrode surface is always 5 eV. The thermodynamic velocities of electrons and heavy particles are shown in Equation (8):
v eth = 8 k B T e π m e , v eth = 8 R T π M n ,
where kB is the Boltzmann constant, me is the electronic mass, R is the universal gas constant, and Mn is the average molar mass of the mixture.
The quality of mesh generation largely determines the accuracy and efficiency of model solutions. So, the triangular elements are used for mesh generation, and the mesh inside the discharge channel and on the electrode’s surface is divided more densely. In addition, depending on the defect geometry and wire radius, the size of mesh division varies. The number of basic triangular cells used in this study is at least 105,330 and at most 214,970, and the typical mesh is shown in Figure 3.

3. Test and Verification

3.1. Corona Cage Test System

In order to verify the validity of the numerical simulation model, a small corona cage test system was built, as shown in Figure 4. The test system consists of three parts, in which the corona occurrence is composed of a DC power supply, protection resistance, corona cage cavity, sample, etc.; the acquisition part of the discharge signal is composed of a current sampling box, data acquisition card, and computer; and the adjustment part of atmospheric parameters is composed of a vacuum pump and so on.
The maximum radius of the corona cage cavity was 200 mm; the wire sample was simulated with a solid copper rod, and the M2 thread was set in the wire’s middle to assemble a conical spike. A realistic picture of the electrode configuration with the wire and spike is shown in Figure 5. By changing the connection height between the conical spike and the wire surface and changing the curvature radius at the top of the spike, a typical burr defect with different geometric structures can be obtained.

3.2. The Method of Obtaining Discharge Current and Judging Corona Inception

The corona cage test system and numerical simulation model were established to simulate the process of corona discharge from the tip defect on the surface of the wire to the cathode. The corona discharge characteristics such as corona inception voltage and pulse current amplitude measured in our experiment can be used to verify the corona characteristics obtained by the simulation model under the same conditions.
When the applied voltage was less than the corona inception voltage, the amplitude of the discharge current was very small and no pulse appeared. When the applied voltage was greater than or equal to the corona inception voltage, the discharge current exhibited periodic and pulsed characteristics. The reason for the periodic current is that the positive ions hit the surface of cathode to produce secondary electrons, which moved to the high-electric-field-strength region and then triggered a new corona discharge with continuous voltage. The method of obtaining the discharge current in the simulation was as follows: the cathode boundary of model was set to metal contact, and a circuit terminal was placed at the boundary to introduce the calculation equation of current. Finally, the corona current Ic can be obtained by calculating the integral of current density along the closed boundary L. The calculation equation is as shown in Equation (9):
L n J i + n J e + n J d   d l = I c ,
where n is the normal vector of the boundary, Ji is the density of the conduction current of ions, Je is the density of the conduction current of electrons, and Jd is the density of the displacement current caused by time-varying potential.
In the corona cage test, a sampling box of leakage current was used to detect the current signal. Using a high-precision non-inductive resistor, the current signal was converted into a voltage signal, which was then transmitted through a high-frequency cable to the data acquisition card with a minimum sampling interval of 2 ns.
In order to obtain the inception voltage of corona discharge in the simulation and experiment, it was necessary to identify the moment of corona occurrence. The specific judgment method uses the characteristics of discharge current, which were as follows in our study: the applied voltage increased following a gradient of 0.5 kV each time and the simulation result and actual sampling waveform of discharge current were obtained; when the current showed pulse characteristics and the pulse amplitude was greater than 1.5 μA, it was considered that the corona began and the applied voltage at that moment was considered the corona inception voltage.

3.3. Comparison of Experimental and Simulation Results

The same test and simulation conditions are set in this study; when the applied voltage is 48.5 kV and the background pressure is standard atmospheric pressure, the radius of the wire is 5 mm, the height of the tip defect is 6 mm, and the radius of curvature at the top of the tip is 0.1 mm. Under these conditions, the corona discharge current at the tip defect of the wire can be output stably. The simulation and test results of corona discharge current under the above conditions are obtained and compared.
Figure 6 shows the obtained current waveform. It can be seen that the two current curves exhibit pulse characteristics: the rise time of the pulse current is about 10 ns and the decay time is about 300–500 ns; the current amplitude is between 2.0 μA and 2.5 μA. The current results are basically consistent after comparison, indicating that the simulation model has certain rationality. In addition, there is a phenomenon (shown in Figure 6) in that the amplitude of the test current is slightly smaller than that of the simulated current; the reason is that the conical spike used in the test has slight passivation, which makes the intensity of corona discharge slightly weakened.
Furthermore, the results of corona inception voltage under the same simulation and test conditions are obtained. When the air pressure is 600 hPa, 700 hPa, 800 hPa, 900 hPa, and 1013 hPa, the wire’s radius is 5 mm, the tip’s height is 2 mm, and the curvature radius of the tip is 0.1 mm. The comparison of corona inception voltage is shown in Figure 7.
It can be seen from Figure 7 that the corona inception voltage increases with an increase in air pressure. Compared with the experimental results, the error of voltage gained by simulation is within 0.2–0.5 kV and the maximum error is less than 0.2%, which is considered to be acceptable and shows that the simulation model is basically reasonable.

4. Simulation Results and Discussion

4.1. Microscopic Process of Corona Discharge

Under the given model’s geometry and gas conditions, the microscopic process of particles’ motion and reaction during gas discharge at the tip defect of a wire is obtained by simulation. When the conductor’s radius is 5 mm, the curvature radius and the height of tip defect are 0.1 mm and 6 mm and the background pressure is 1013 hpa. The distribution diagram of the electric field near the tip defect at different moments is shown in Figure 8.
From Figure 8a, it can be seen that when a positive voltage of 48.5 kV is applied to the wire and the tip, a strong electric field is first formed near the tip with the smallest curvature radius, and the field strength reaches 92.1 kV/cm within 1.2798 ns.
In Figure 8b, after applying a positive voltage for 3.1131 ns, the electric field decreases in the area closest to the tip of the wire. In contrast, the area slightly farther away from the tip of the wire has a larger electric field [34]. The reason for the analysis is that at the initial moment, there are a large number of electrons distributed near the positive electrode. Under the strong electric field, the electrons move towards the positive electrode at high speed, which generates new ions and electrons through a series of collision reactions on the way. The mass of positive ions is much larger than that of electrons, but their moving speed is much slower than that of electrons, so when the electrons reach the anode, a large number of positive ions are still on the way, which weakens the electric field near the anode.
As can be seen from Figure 8c, near the anode, there is an almost electrically neutral region, which shows an almost zero-value charge density and is called the plasma region [35]. The reason for the analysis is that there are a large number of positive ions gathered near the anode, and their density is very high; when the electrons approach this region, the recombination reaction occurs in front of it, and the attachment reaction occurs inside it to produce more negative ions. In the region where a large number of positive and negative ions are concentrated, it is easy to form plasma. With the continuous development of the discharge, a small number of electrons continue to converge to the plasma region, which is extended.
As shown in Figure 8d, the length of plasma is obviously longer, and its distribution in width is relatively uniform, and it is extending to the cathode at a faster speed. Above, Figure 8 shows the process of corona initiation and discharge development [34,35].
By simulation, the distribution diagram of electron density near the tip at different moments is obtained, as shown in Figure 9.
From the analysis of Figure 9, it is shown that after 5.0944 ns, electrons appear in the region slightly farther away from the positive electrode, and with the development of time, the region where electrons are distributed becomes larger and larger, and the place with the highest electron density always appears in the streamer head farthest from the positive electrode. The reason for this phenomenon is that the photoionization effect always occurs in the high-electric-field-strength area of the streamer head; further, new electrons are continuously generated through collision ionization, making the electron density of the streamer head the largest, about 1 × 10²⁰ m−3.
In addition to the above density distribution of electrons, another 12 particles in the reaction group and their microscopic density distribution and variation can also be obtained by the hybrid numerical model. As shown in Figure 10 and Figure 11, during the development of discharge, the density of N2 decreases continuously due to collision and ionization reactions; meanwhile, the density of the newly reaction-generated particle N2+ increases continuously.
By simulation, the reaction intensity and reaction rate of 35 reactions in the model and their spatial and temporal distribution and change rules can be obtained. For example, in Figure 12, the spatial distribution of the reaction rate of collision between N2 molecules and free electrons at different times is shown. It intuitively shows that collision and ionization mainly take place at the streamer head, which can promote the plasma to continue to extend forward.

4.2. Simulation Results of Corona Characteristics under Different Factors

Through simulation, we can not only investigate the dynamic behavior of charged particles in gas space and analyze the microscopic process of the initiation and development of corona discharge at the tip, but we can also further analyze the macroscopic characteristics of corona discharge. In the following, with the changes in geometric structures of the wire tip defect and air pressure conditions, the characteristics of corona inception voltage and discharge current are carefully studied.
When the background air pressure is 1013 hPa and the temperature is 293.15 K, the variation of corona inception voltage in response to changes in the radius R of wire, the curvature radius r, and the height h of the tip is obtained by simulation. Then, the applied voltage is further increased to 1.1 times the corona inception voltage and the relationship between the amplitude of the pulse current and the radius R of wire, the curvature radius r, and the height h of the tip is calculated. The simulation results are shown in Figure 13, Figure 14 and Figure 15.
By analyzing the curves in Figure 13, it can be seen that when the curvature radius r of the tip is 0.1 mm, at the same value of R, the corona inception voltage gradually decreases with an increase in the tip’ height; for example, when the value of R is 10 mm, an increase in the tip’s height from 2 mm to 20 mm causes the corona inception voltage to decrease by 52.4%. Moreover, at the same tip height, the corona inception voltage decreases with a decrease in the wire’s radius. Taking the tip’s height h of 2 mm as an example, when the wire’s radius is reduced by 5 mm, the corona inception voltage is reduced by 22.9%.
Furthermore, in Figure 14, the given height h of the tip is 8 mm, and the curves obtained show that at the same value of R, the larger the curvature radius of the tip, the higher the corona voltage; when the curvature radius of the tip increases from 0.1 mm to 0.5 mm, the increase in corona inception voltage is between 27.7% and 37.5%. And, at the same curvature radius of the tip, the larger the wire’s radius, the higher the corona voltage. When the wire’s radius is expanded from 5 mm to 10 mm, the corona inception voltage is increased by 32.3–41.7%.
It can be concluded from the above that when the wire’s radius R is smaller, the curvature radius r of the tip is smaller, and the tip’s height is higher, corona discharge occurs more easily at the tip of the conductor.
Figure 15 shows the variation in corona current under different structures of defects on the surface of a wire. When the value of r is 0.1 mm–0.5 mm, the value of h is 2 mm–20 mm, and the value of R is 5 mm, 7.5 mm, and 10 mm. It can be seen from Figure 15 that when the applied voltage is 1.1 times the corona inception voltage, the amplitude of the current pulse decreases with a decrease in the curvature radius of the tip and increases with an increase in the wire’s radius and a decrease in the tip’s height.
In order to study the characteristics of corona discharge under different air pressure conditions, the given simulation conditions are as follows: the gas pressure varies from 600 hPa to 1013 hPa, the background temperature is 293.15 K, and the value of r is 0.1 mm, the value of h is 6 mm, and the value of R is 5 mm. The obtained curves of corona inception voltage and the amplitude of corona current are shown in Figure 16.
The analysis for Figure 16 shows that when the gas pressure rises from 600 hPa to the standard atmospheric pressure, the corona inception voltage rises from 13.5 kV to 24.5 kV, and the amplitude of current pulse drops from 2.43 μA to 2.21 μA. This shows that as the background pressure rises, the corona inception voltage increases and the amplitude of current pulse decreases [36]. This is because when the air pressure increases, the number density of gas molecules increases, and electrons are more likely to collide with gas molecules, so the average free path of electrons becomes shorter and the average energy of electrons decreases. Furthermore, the microscopic chemical reaction rate of electrons changes with a decrease in the average energy of electrons. In detail, the probability of obtaining effective electrons by means of collision and ionization is reduced and the free electrons are more likely to attach to gas molecules to form more negative ions, which eventually leads to the inhibition of the initiation and development of corona discharge, which is manifested as an increase in corona inception voltage and a decrease in the average amplitude of current pulse.

5. Conclusions

Numerical and experimental studies were conducted to investigate the DC positive corona discharge characteristics at a tip defect of a conductor. On the basis of analyzing the chemical reaction and dynamic motion of microscopic particles in the corona layer, the influence of the geometrical structure of wire tip defects and gas pressure on corona discharge characteristics was further calculated and studied numerically. Different aspects in the structure of conductor tip defects were controllable, namely the radius R of the conductor (5 mm, 7.5 mm, 10 mm), the height h of the tip (2 mm–20 mm), and the curvature radius r of the tip (0.1 mm–0.5 mm). The inception voltage and pulse current of corona discharge were extensively studied. From the results obtained, it is concluded that:
(1)
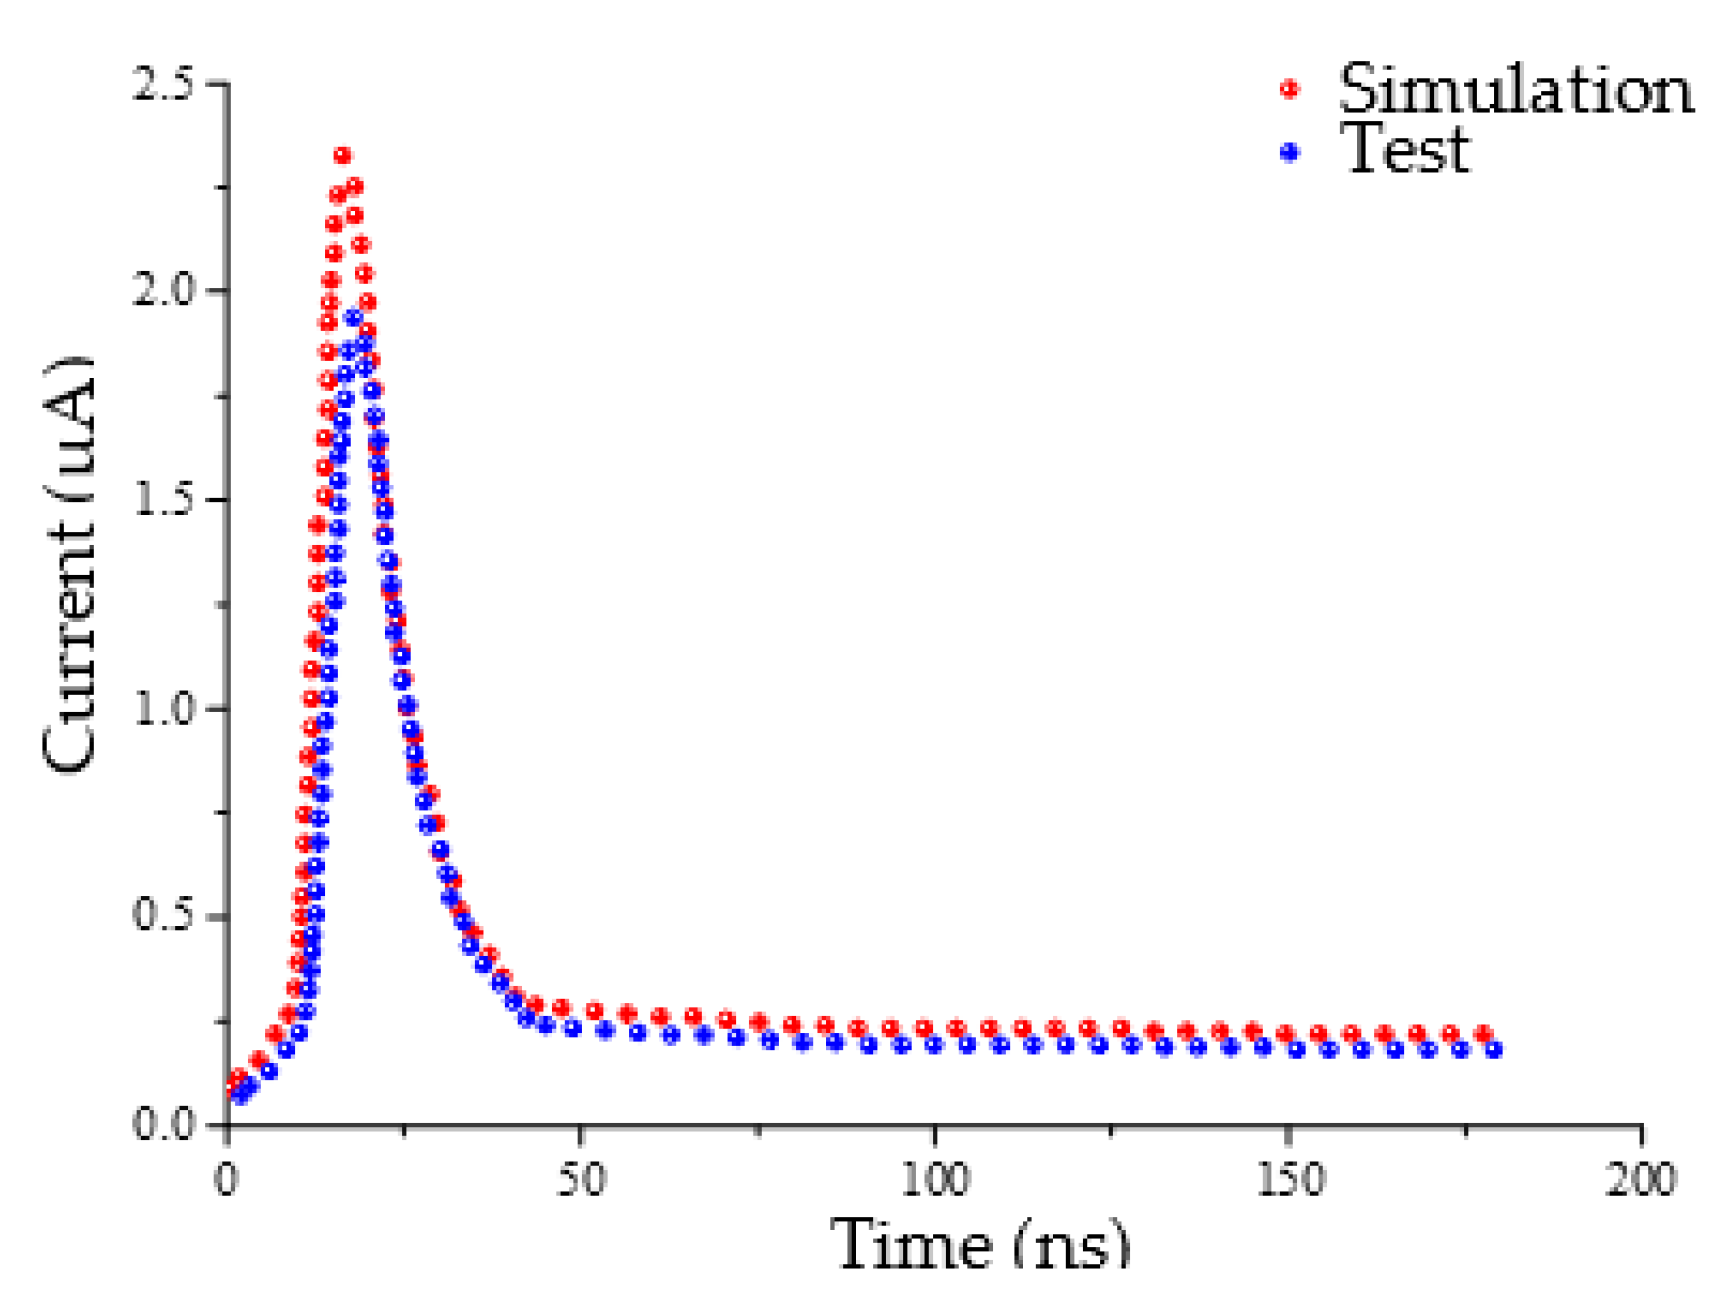
Through experimental research, the rationality of the model is verified. Compared with the experimental results, the maximum error of the corona inception voltage under different pressures is less than 0.2%. For comparison of discharge current, it is shown that the discharge current exhibits pulse characteristics: its rise time is about 10 ns and its decay time is about 300–500 ns and the current amplitude is between 2.0 μA and 2.5 μA. In general, the results in the test and simulation are consistent;
(2)
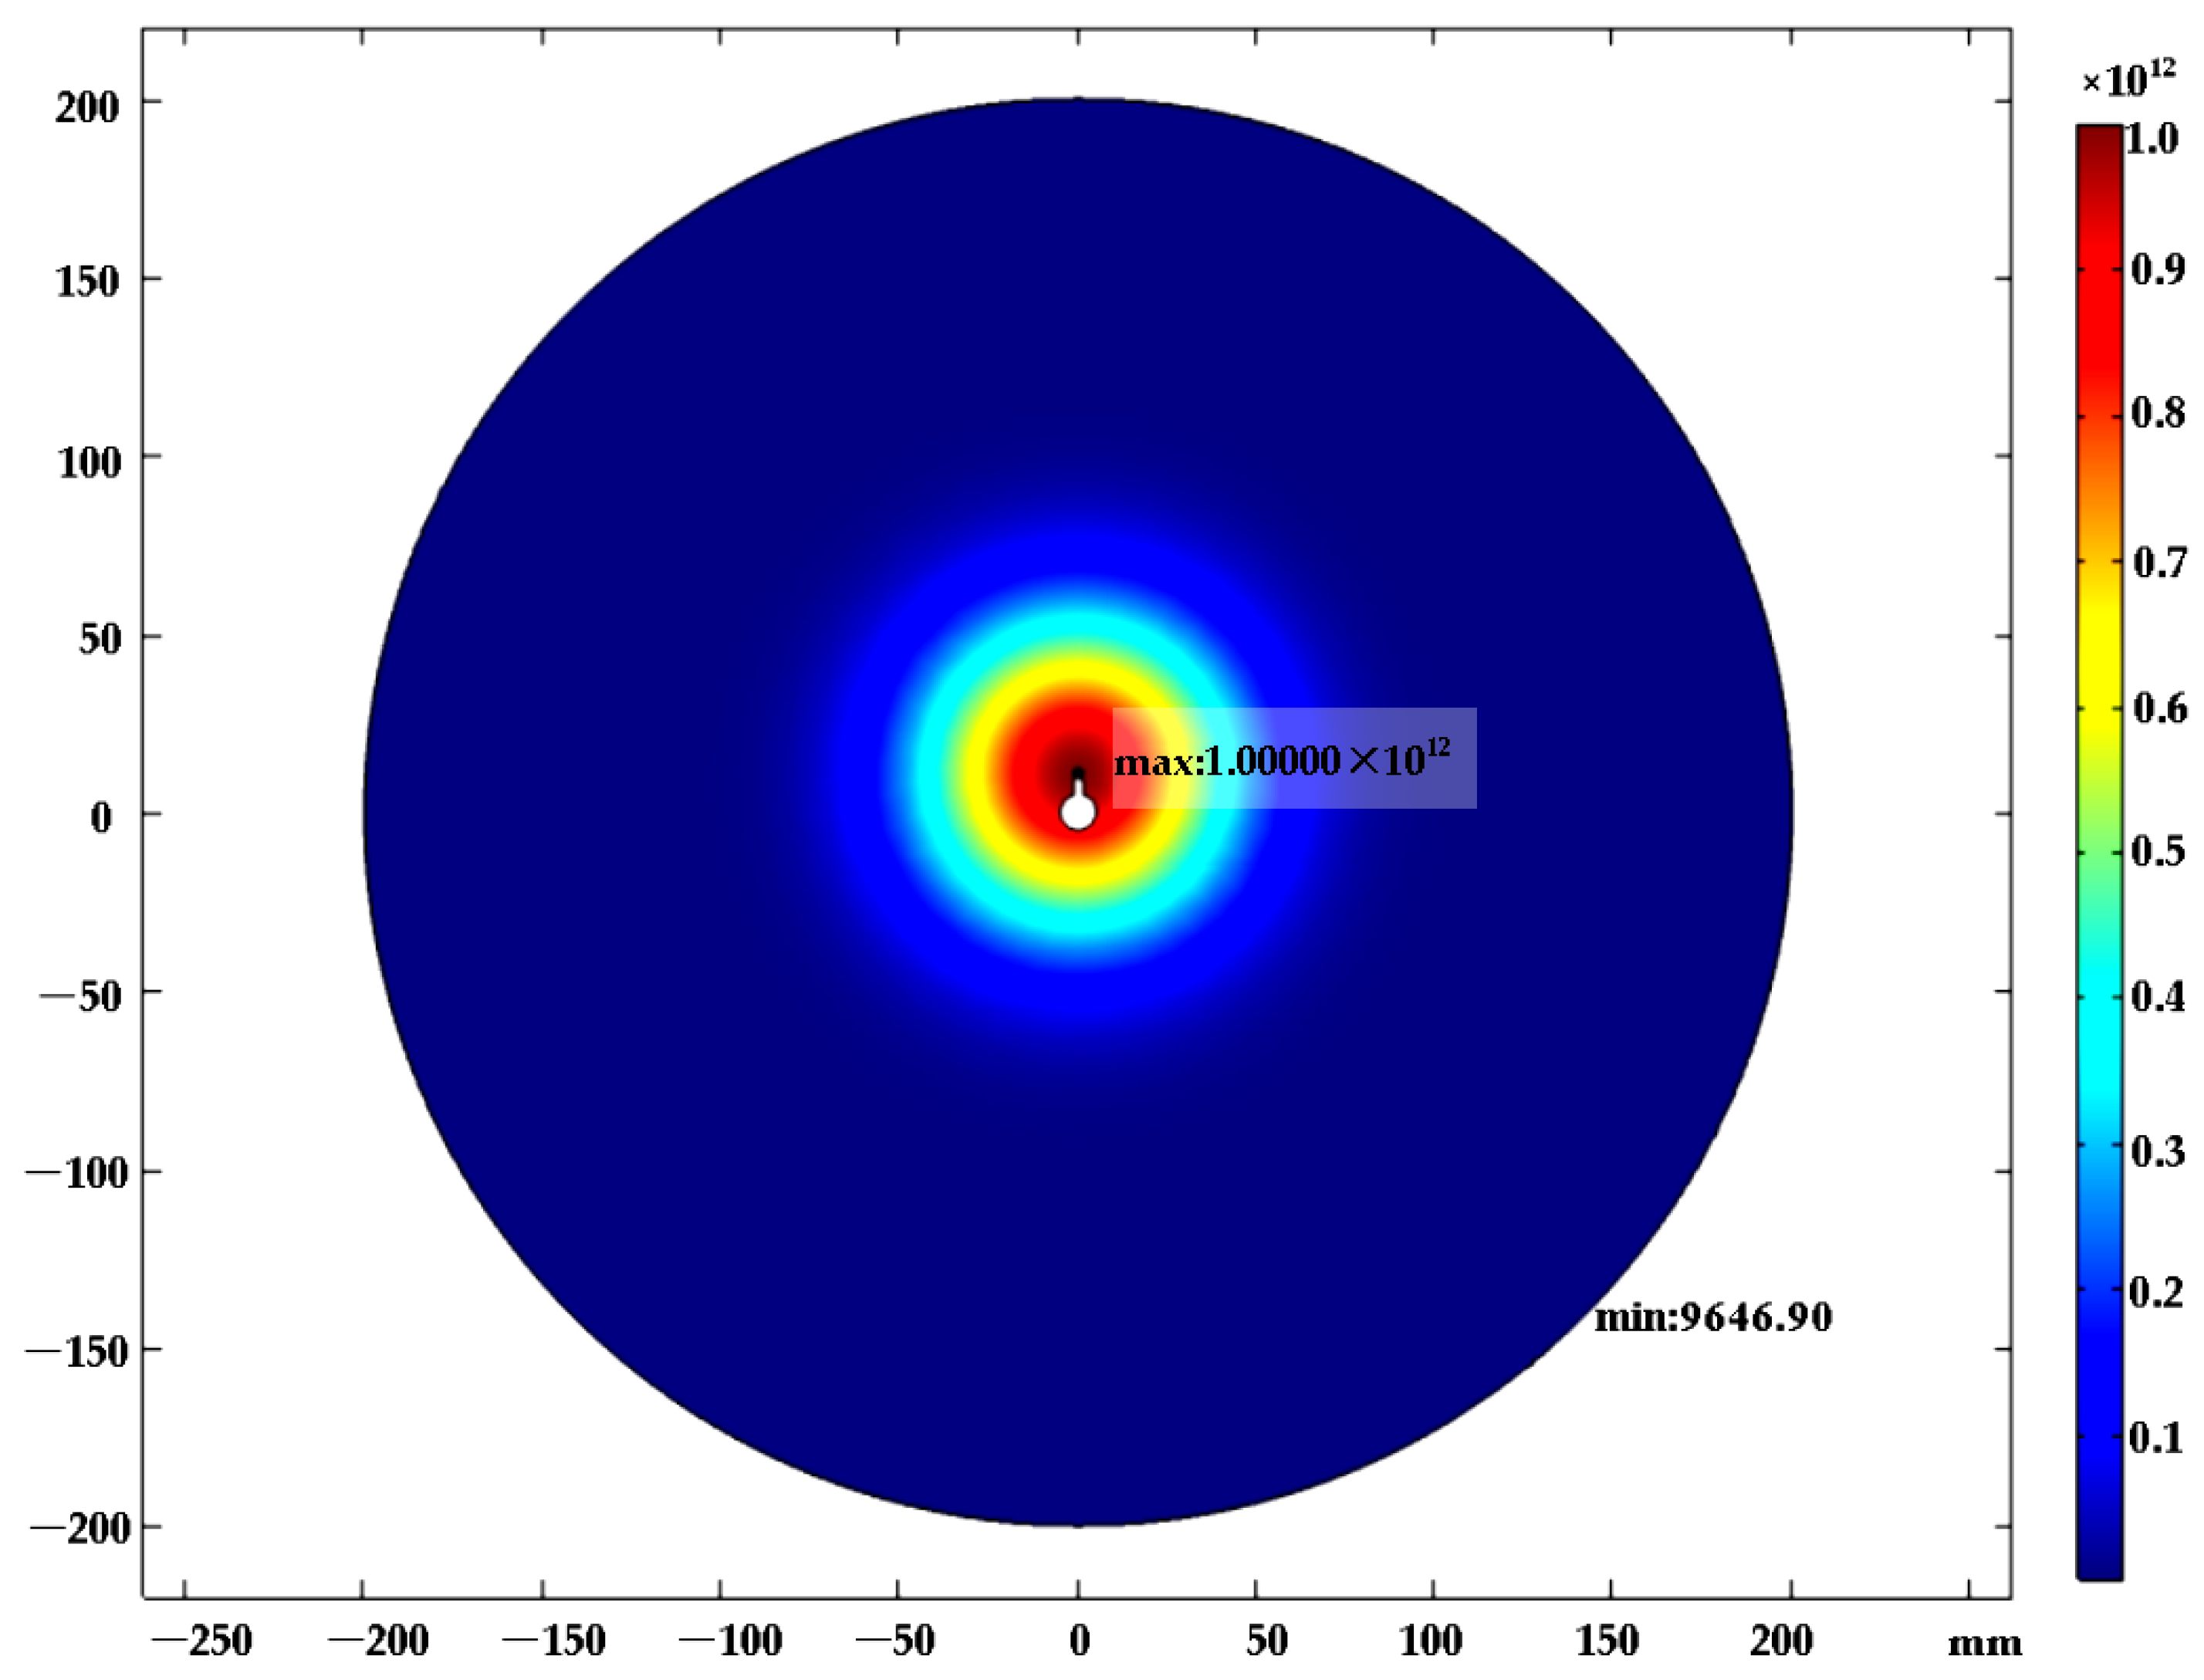
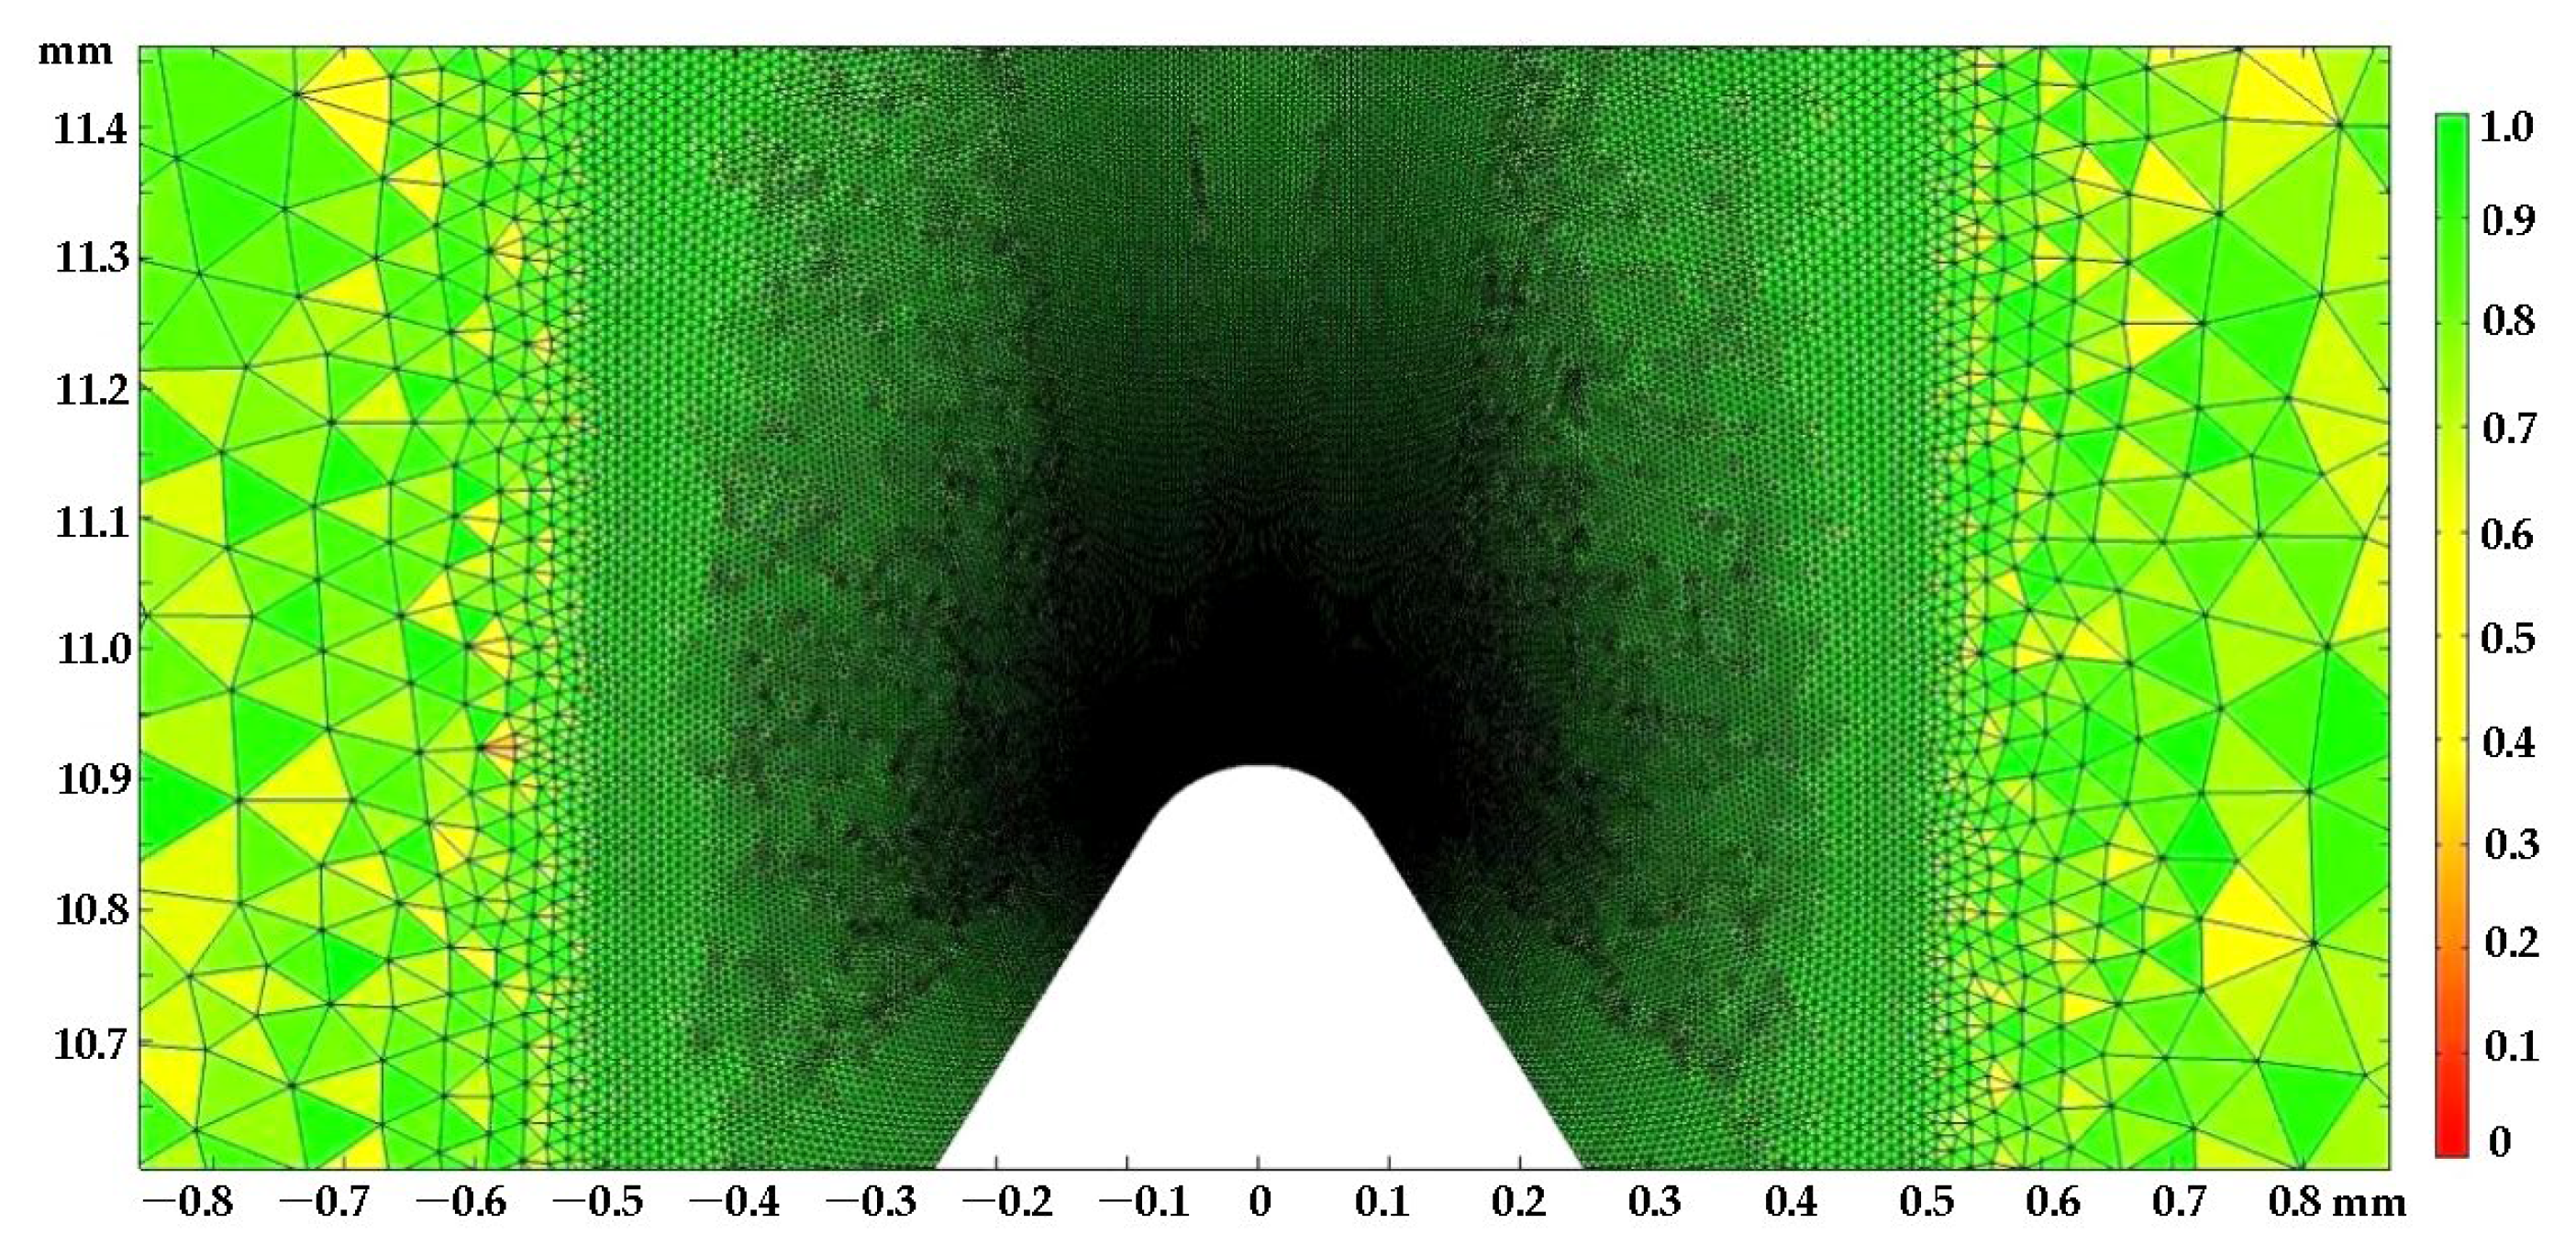
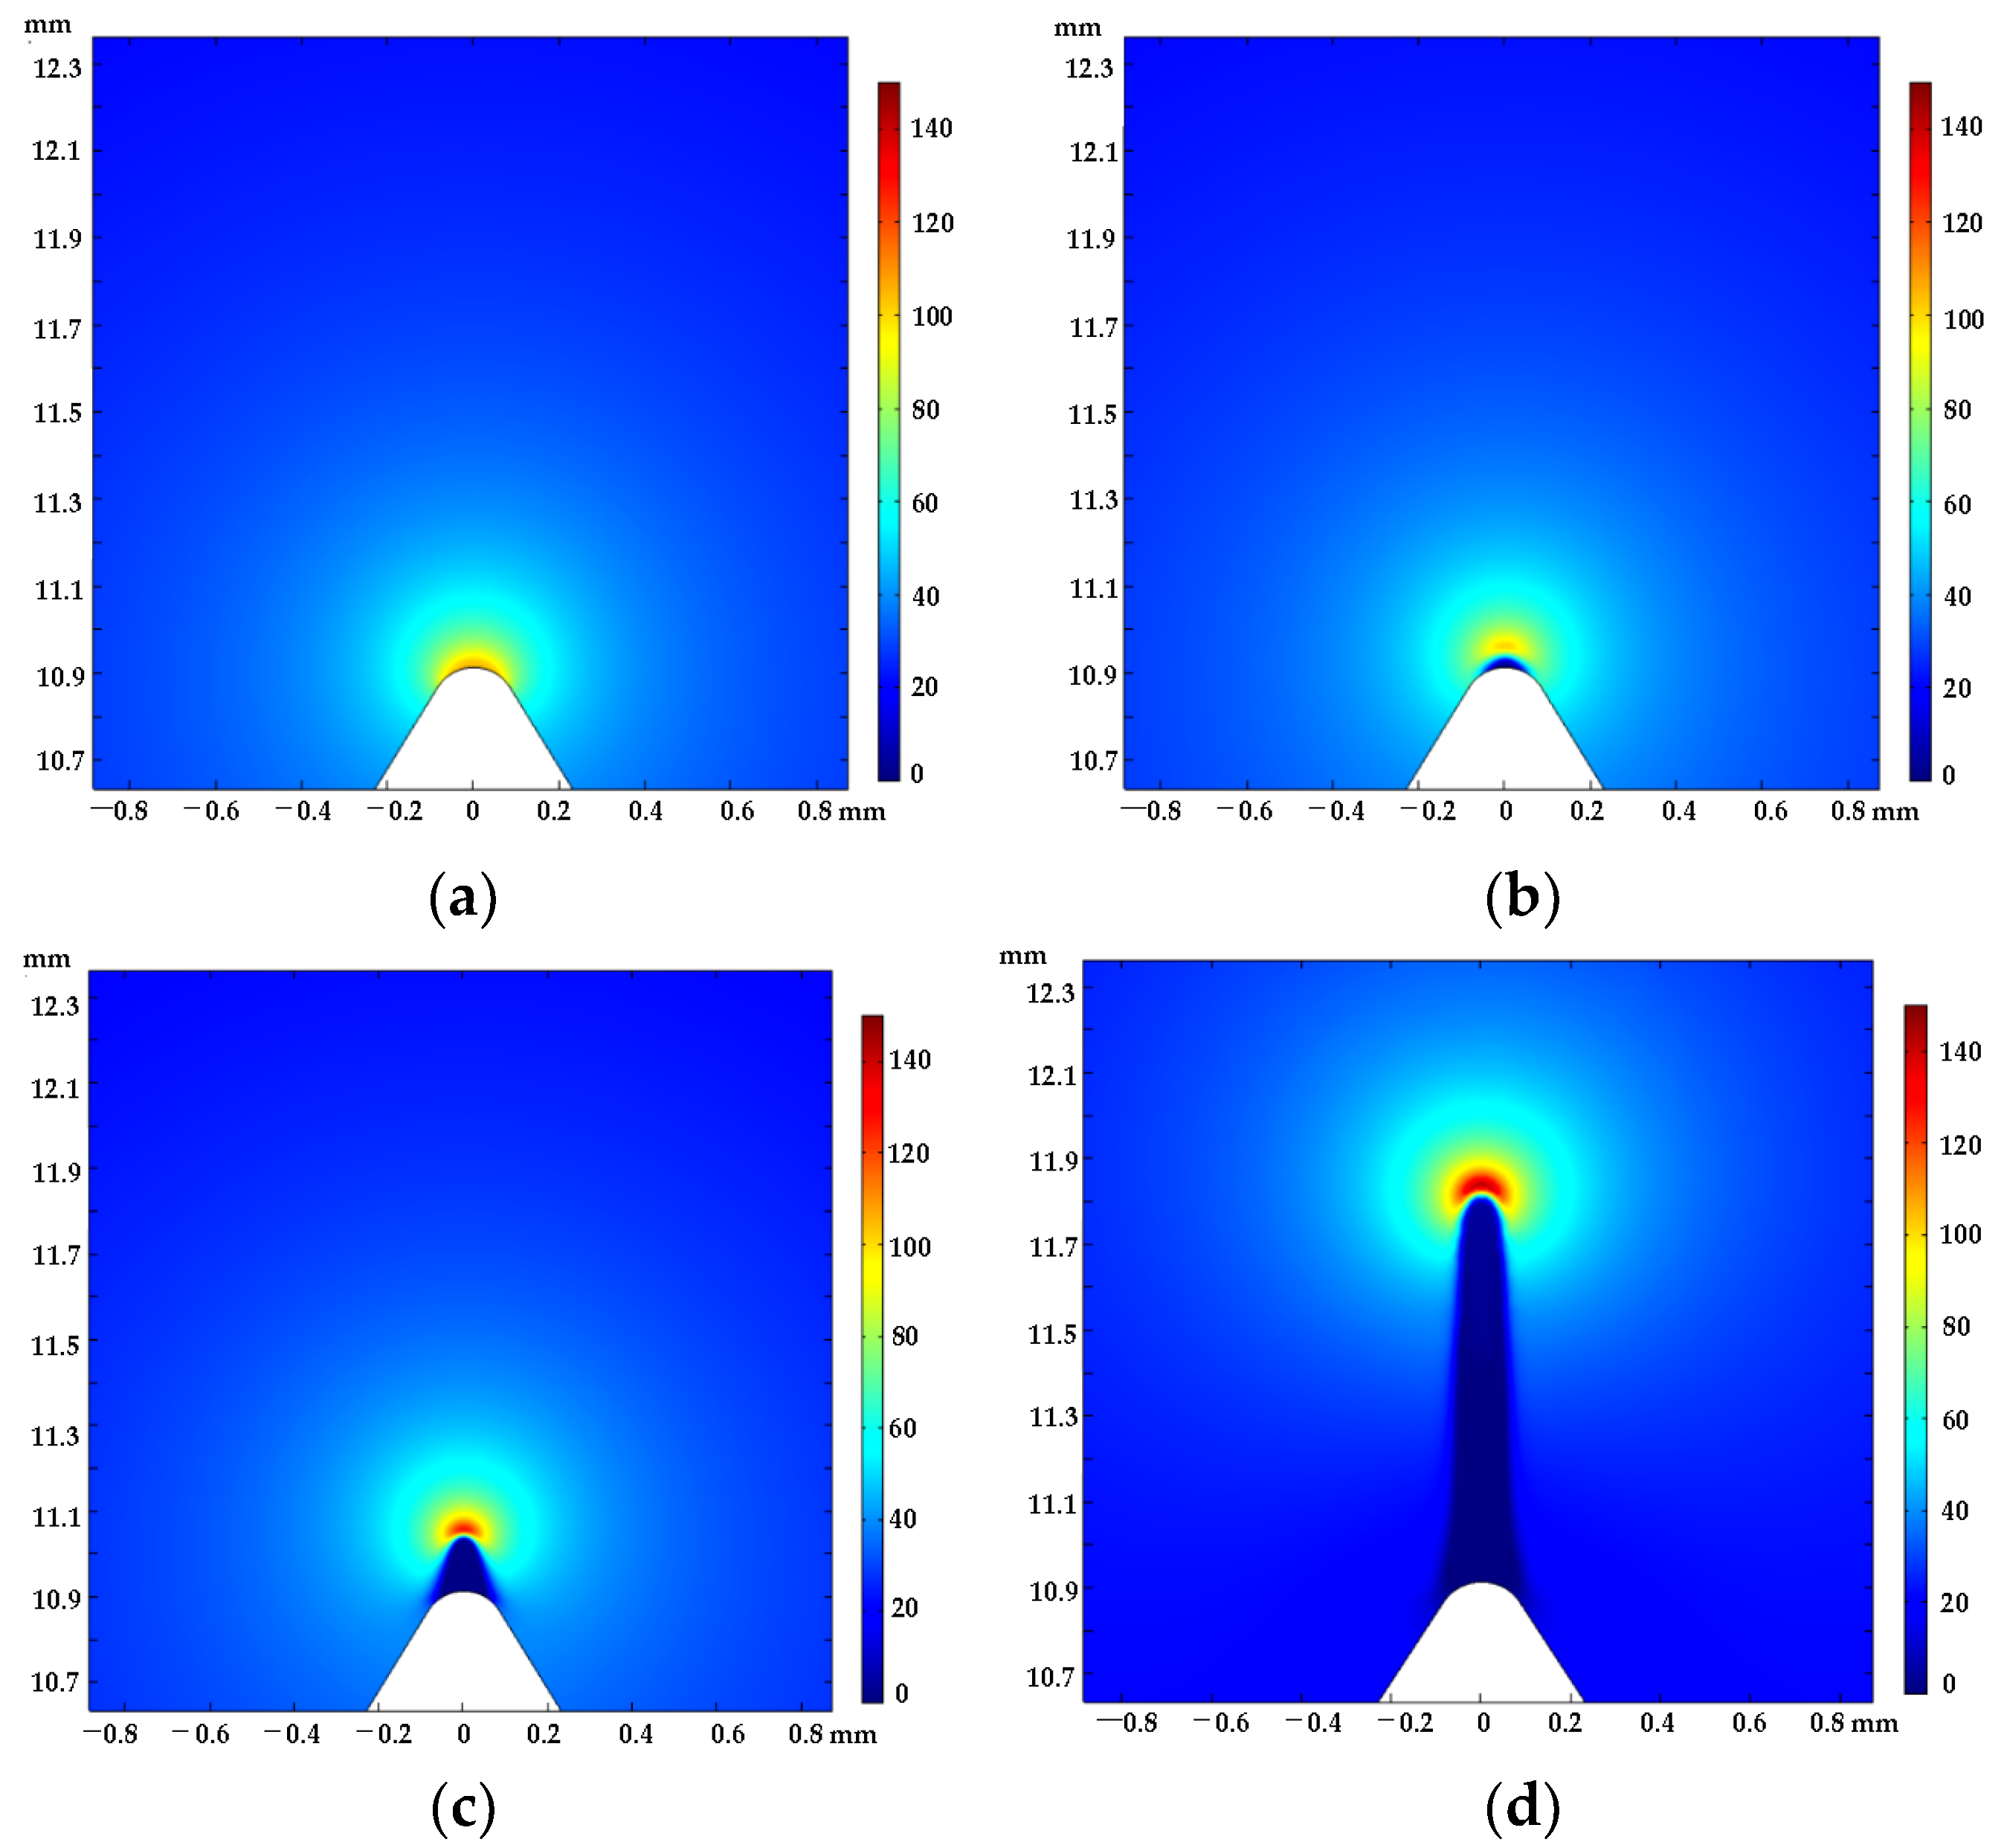
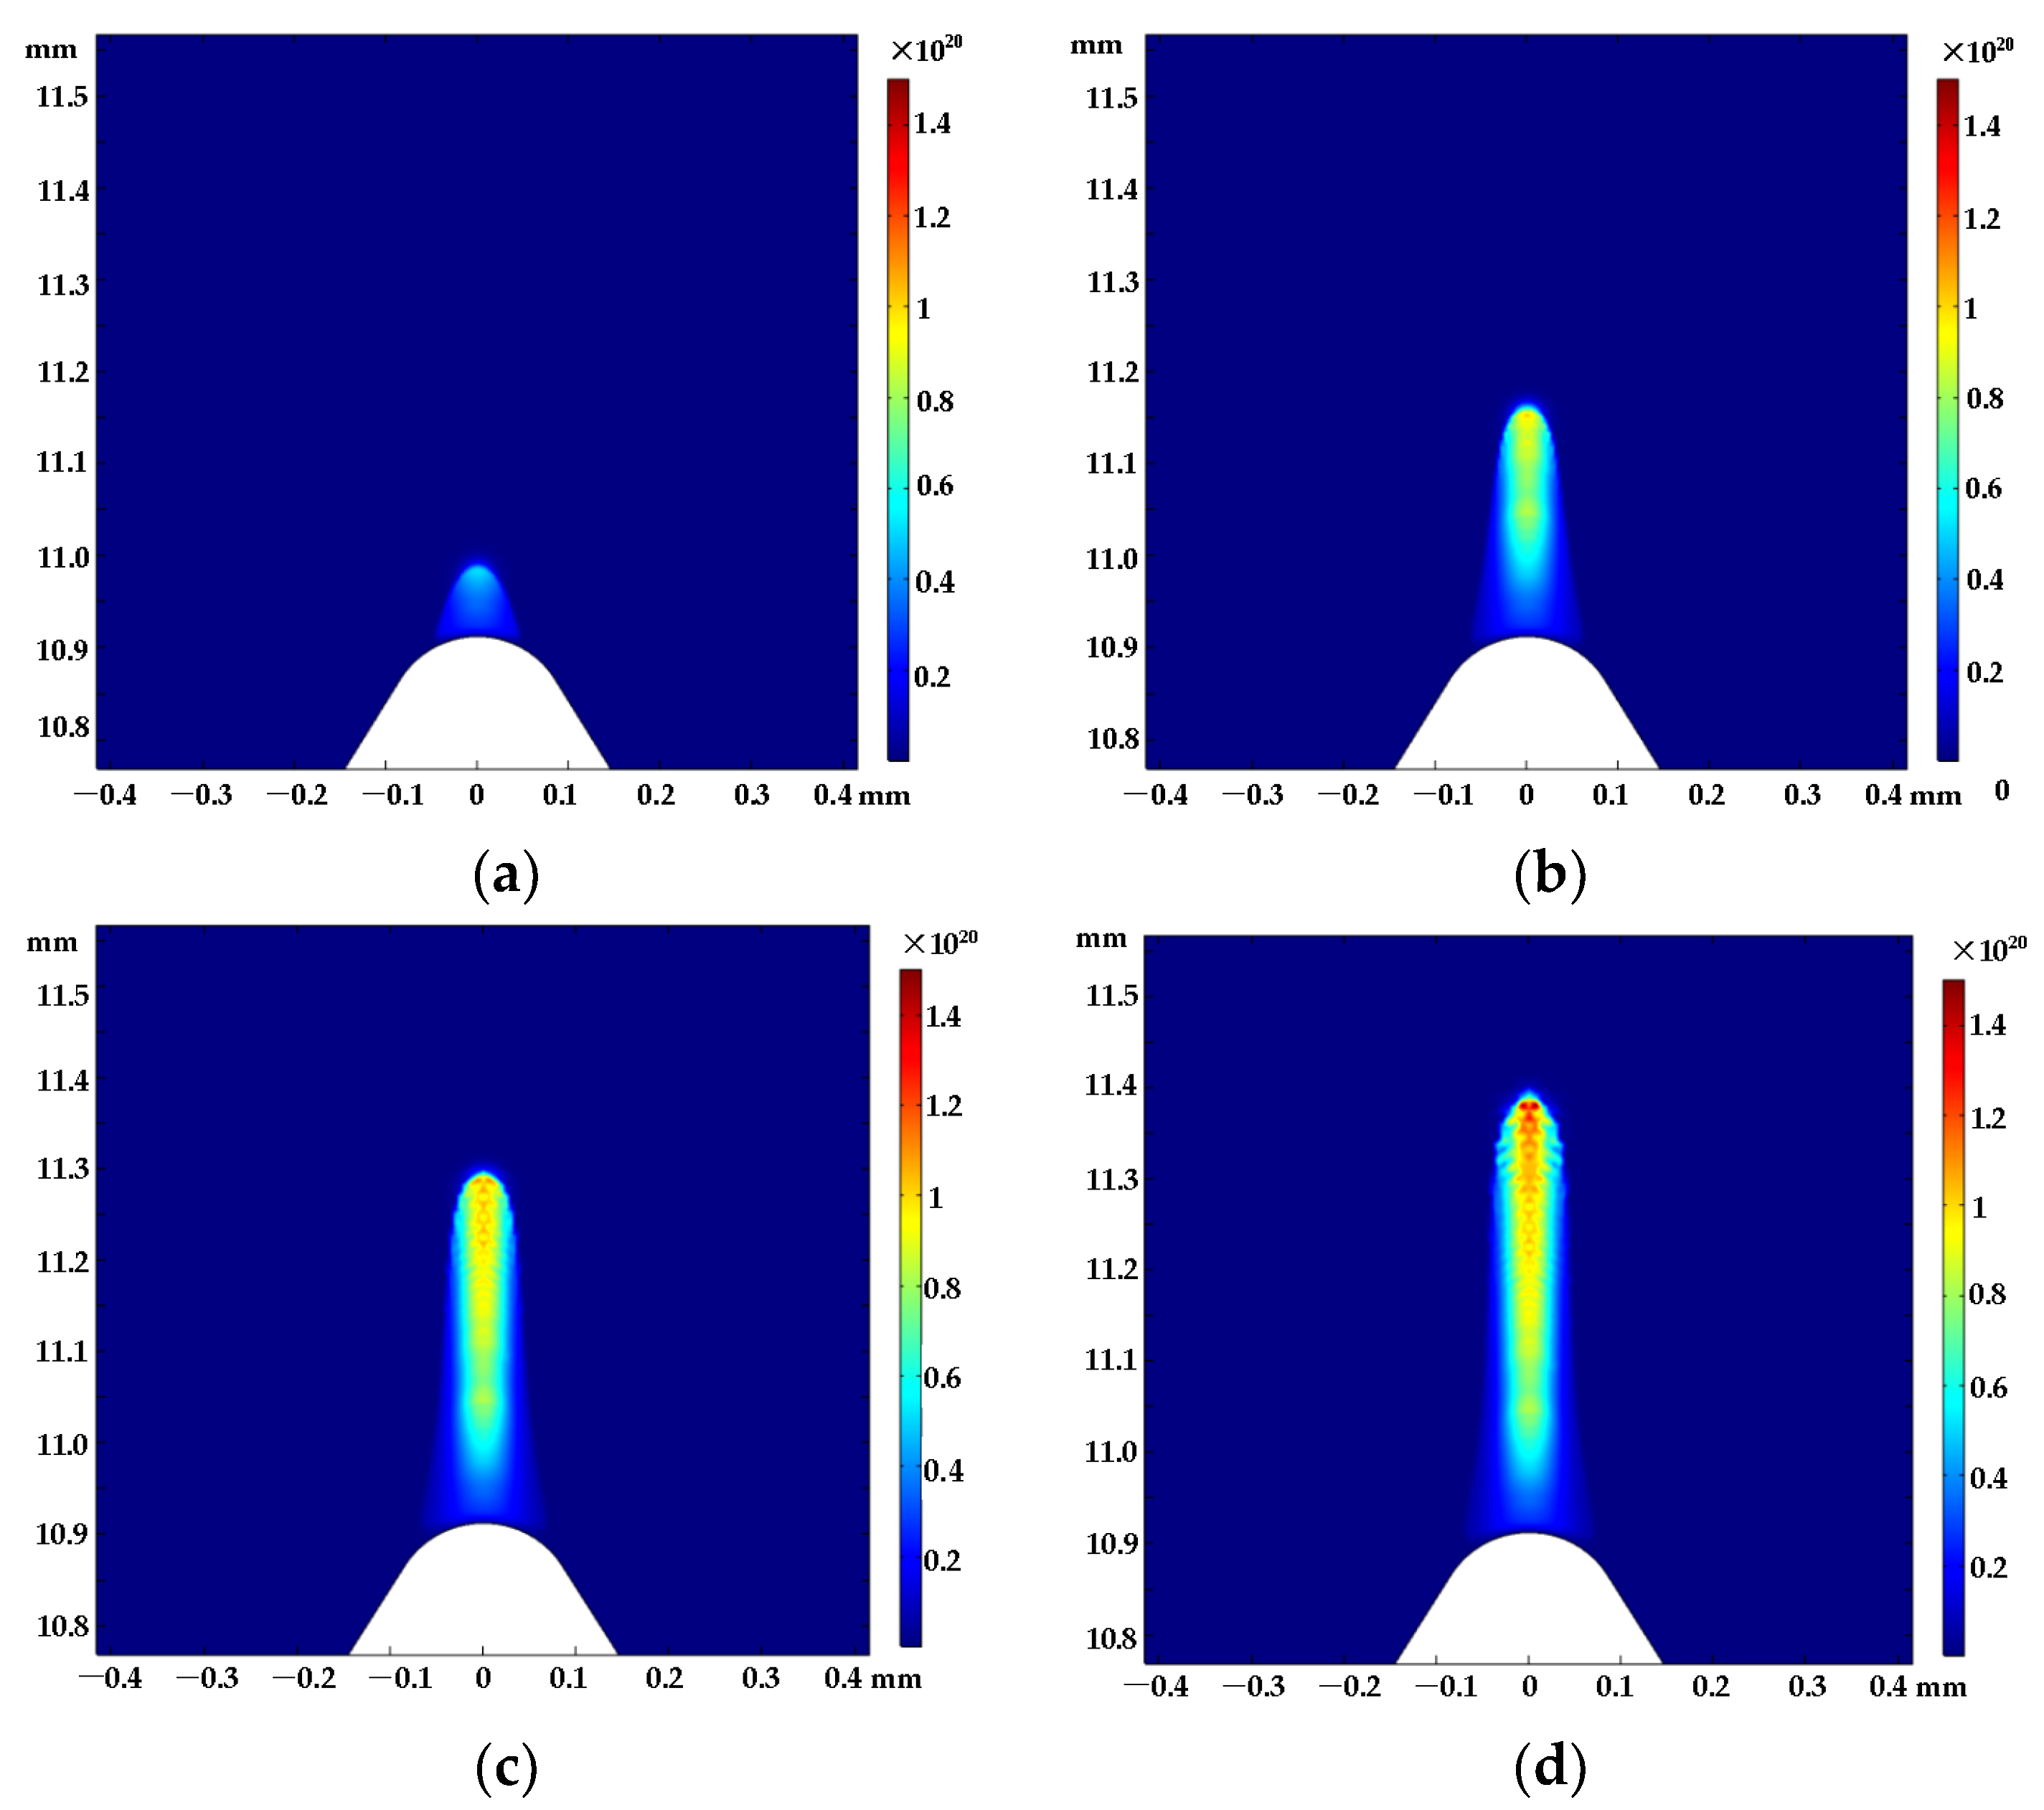
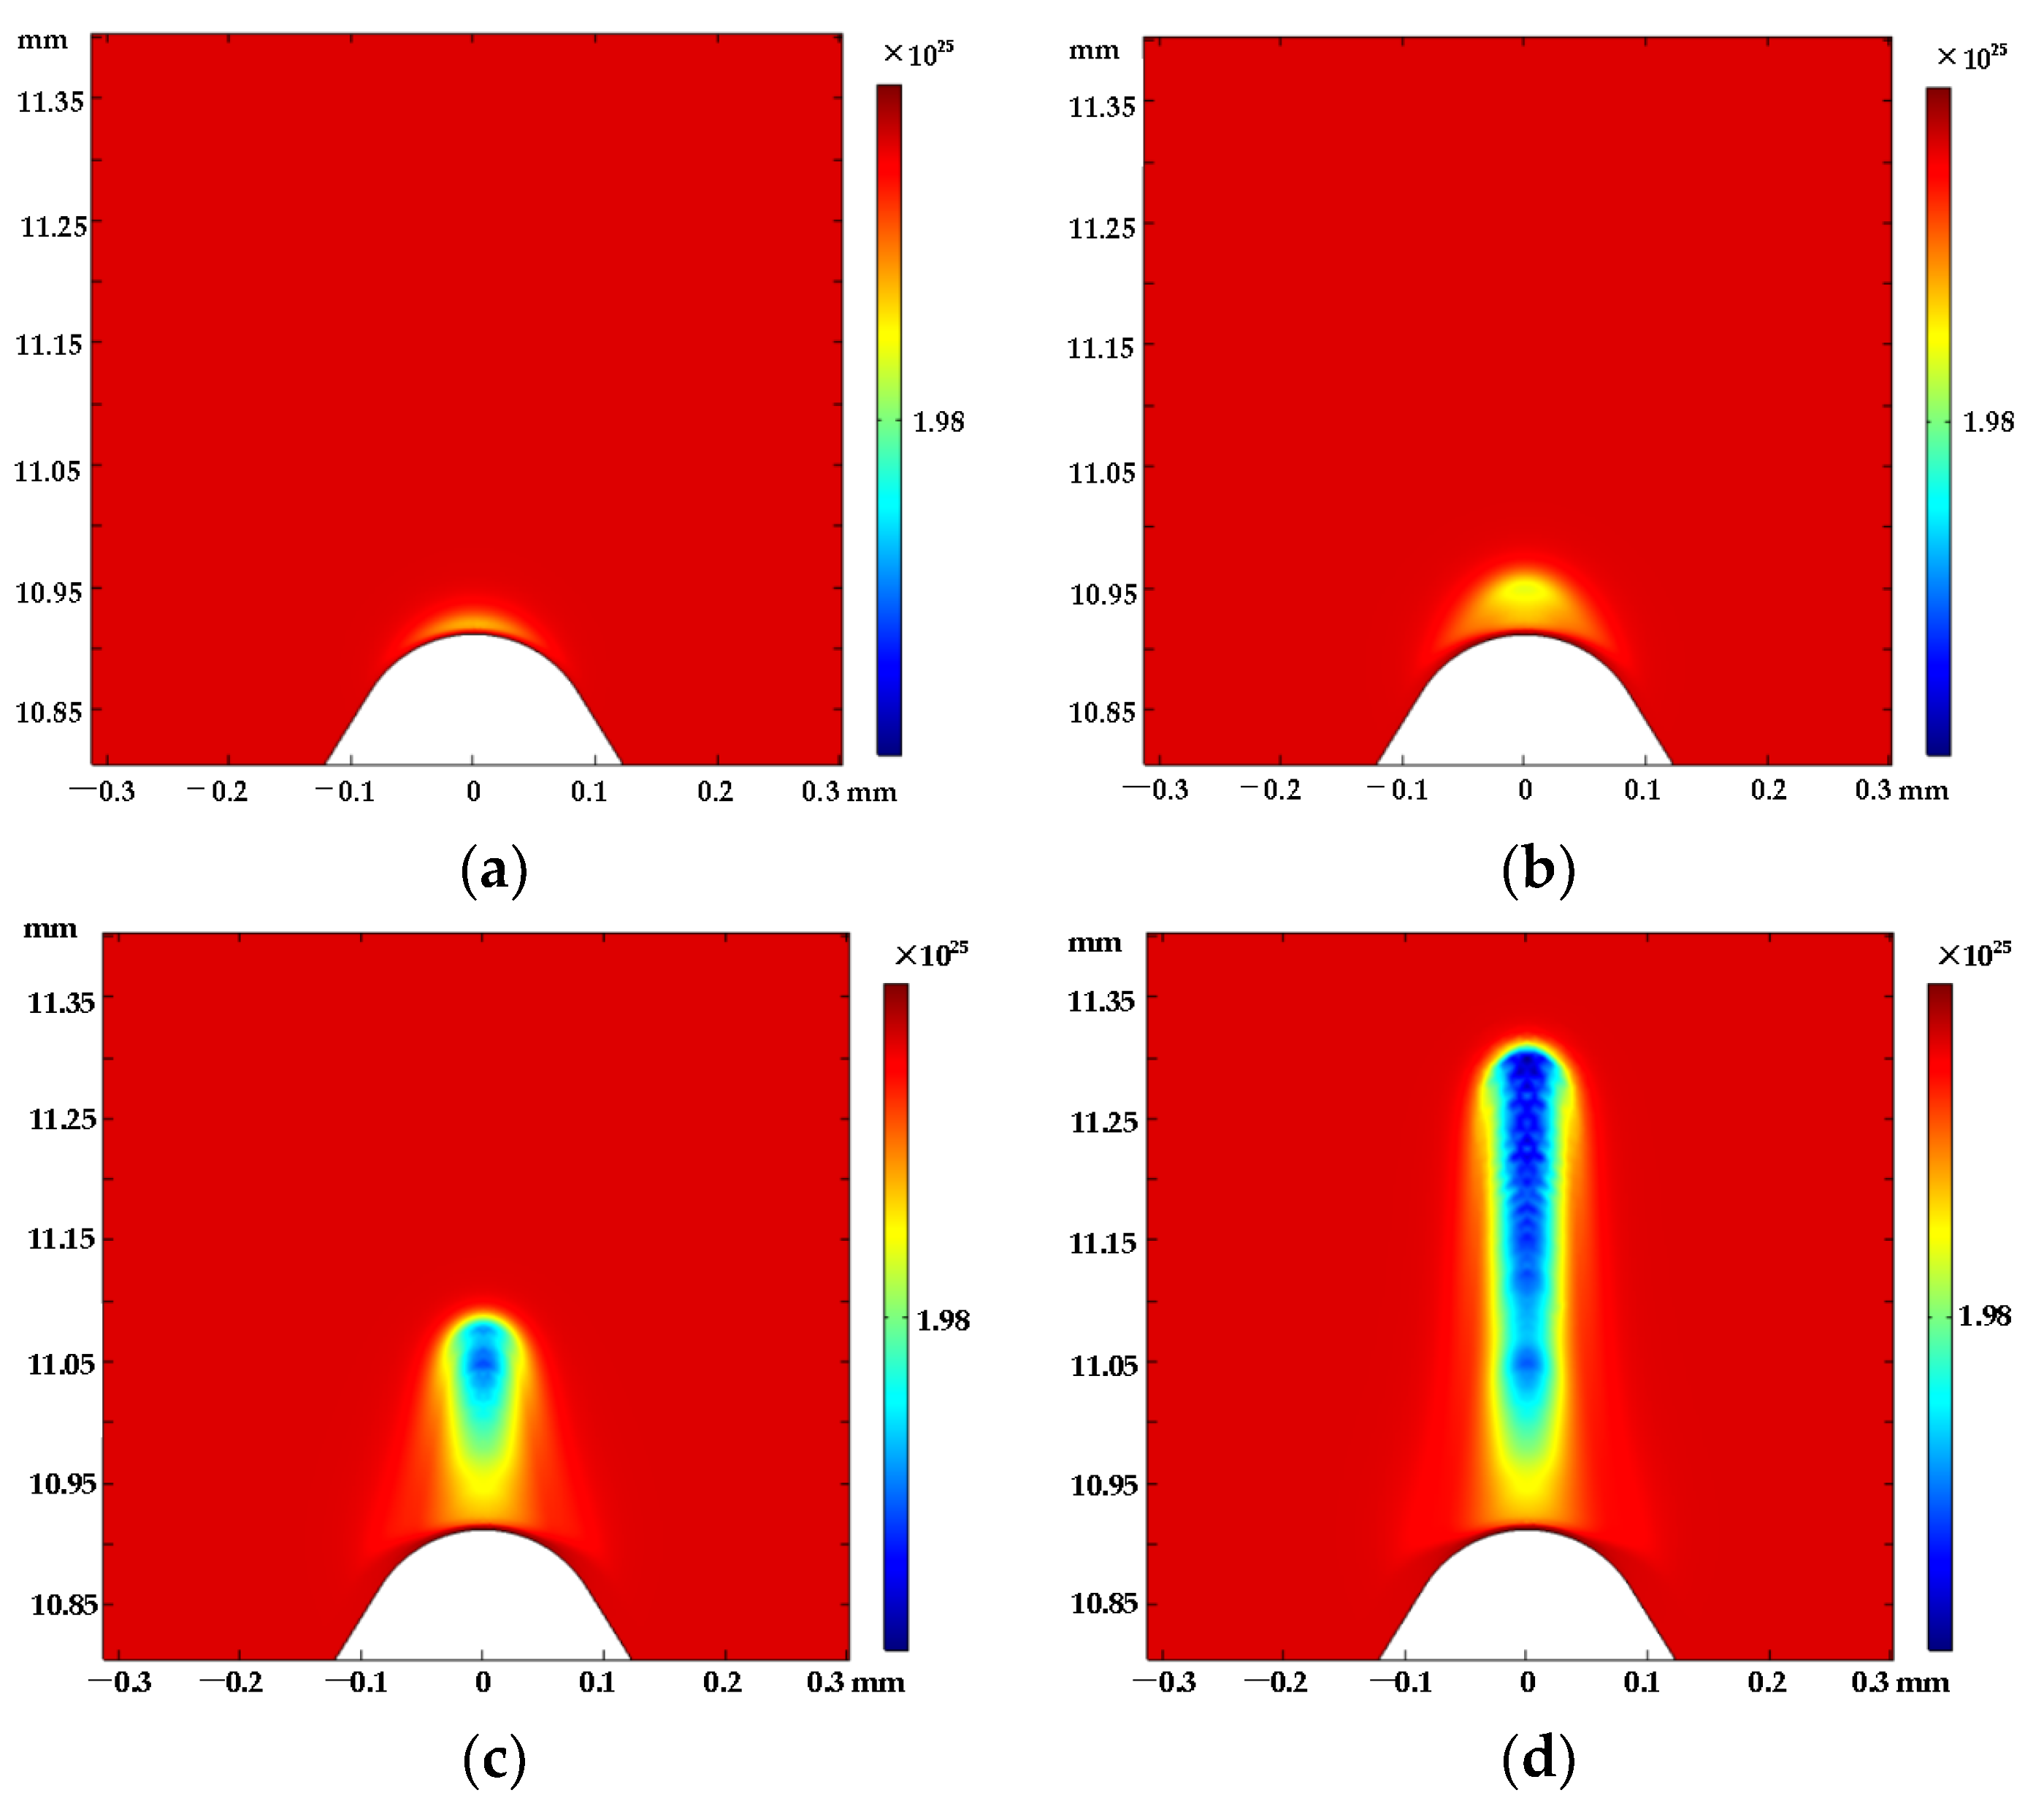
Based on the hybrid numerical model of fluid-chemical reactions, in the process of positive corona discharge developing from the wire’s tip defect to the cathode, the evolution of streamer morphology can be observed intuitively, and the density variation of space particles and the distribution of the electric field can be obtained. There are some representative results: the field strength reaches a peak value (92.1 kV/cm) within 1.2798 ns at the beginning of discharge and the maximum electron density of the streamer head in one discharge is about 1 × 10²⁰ m−3;
(3)
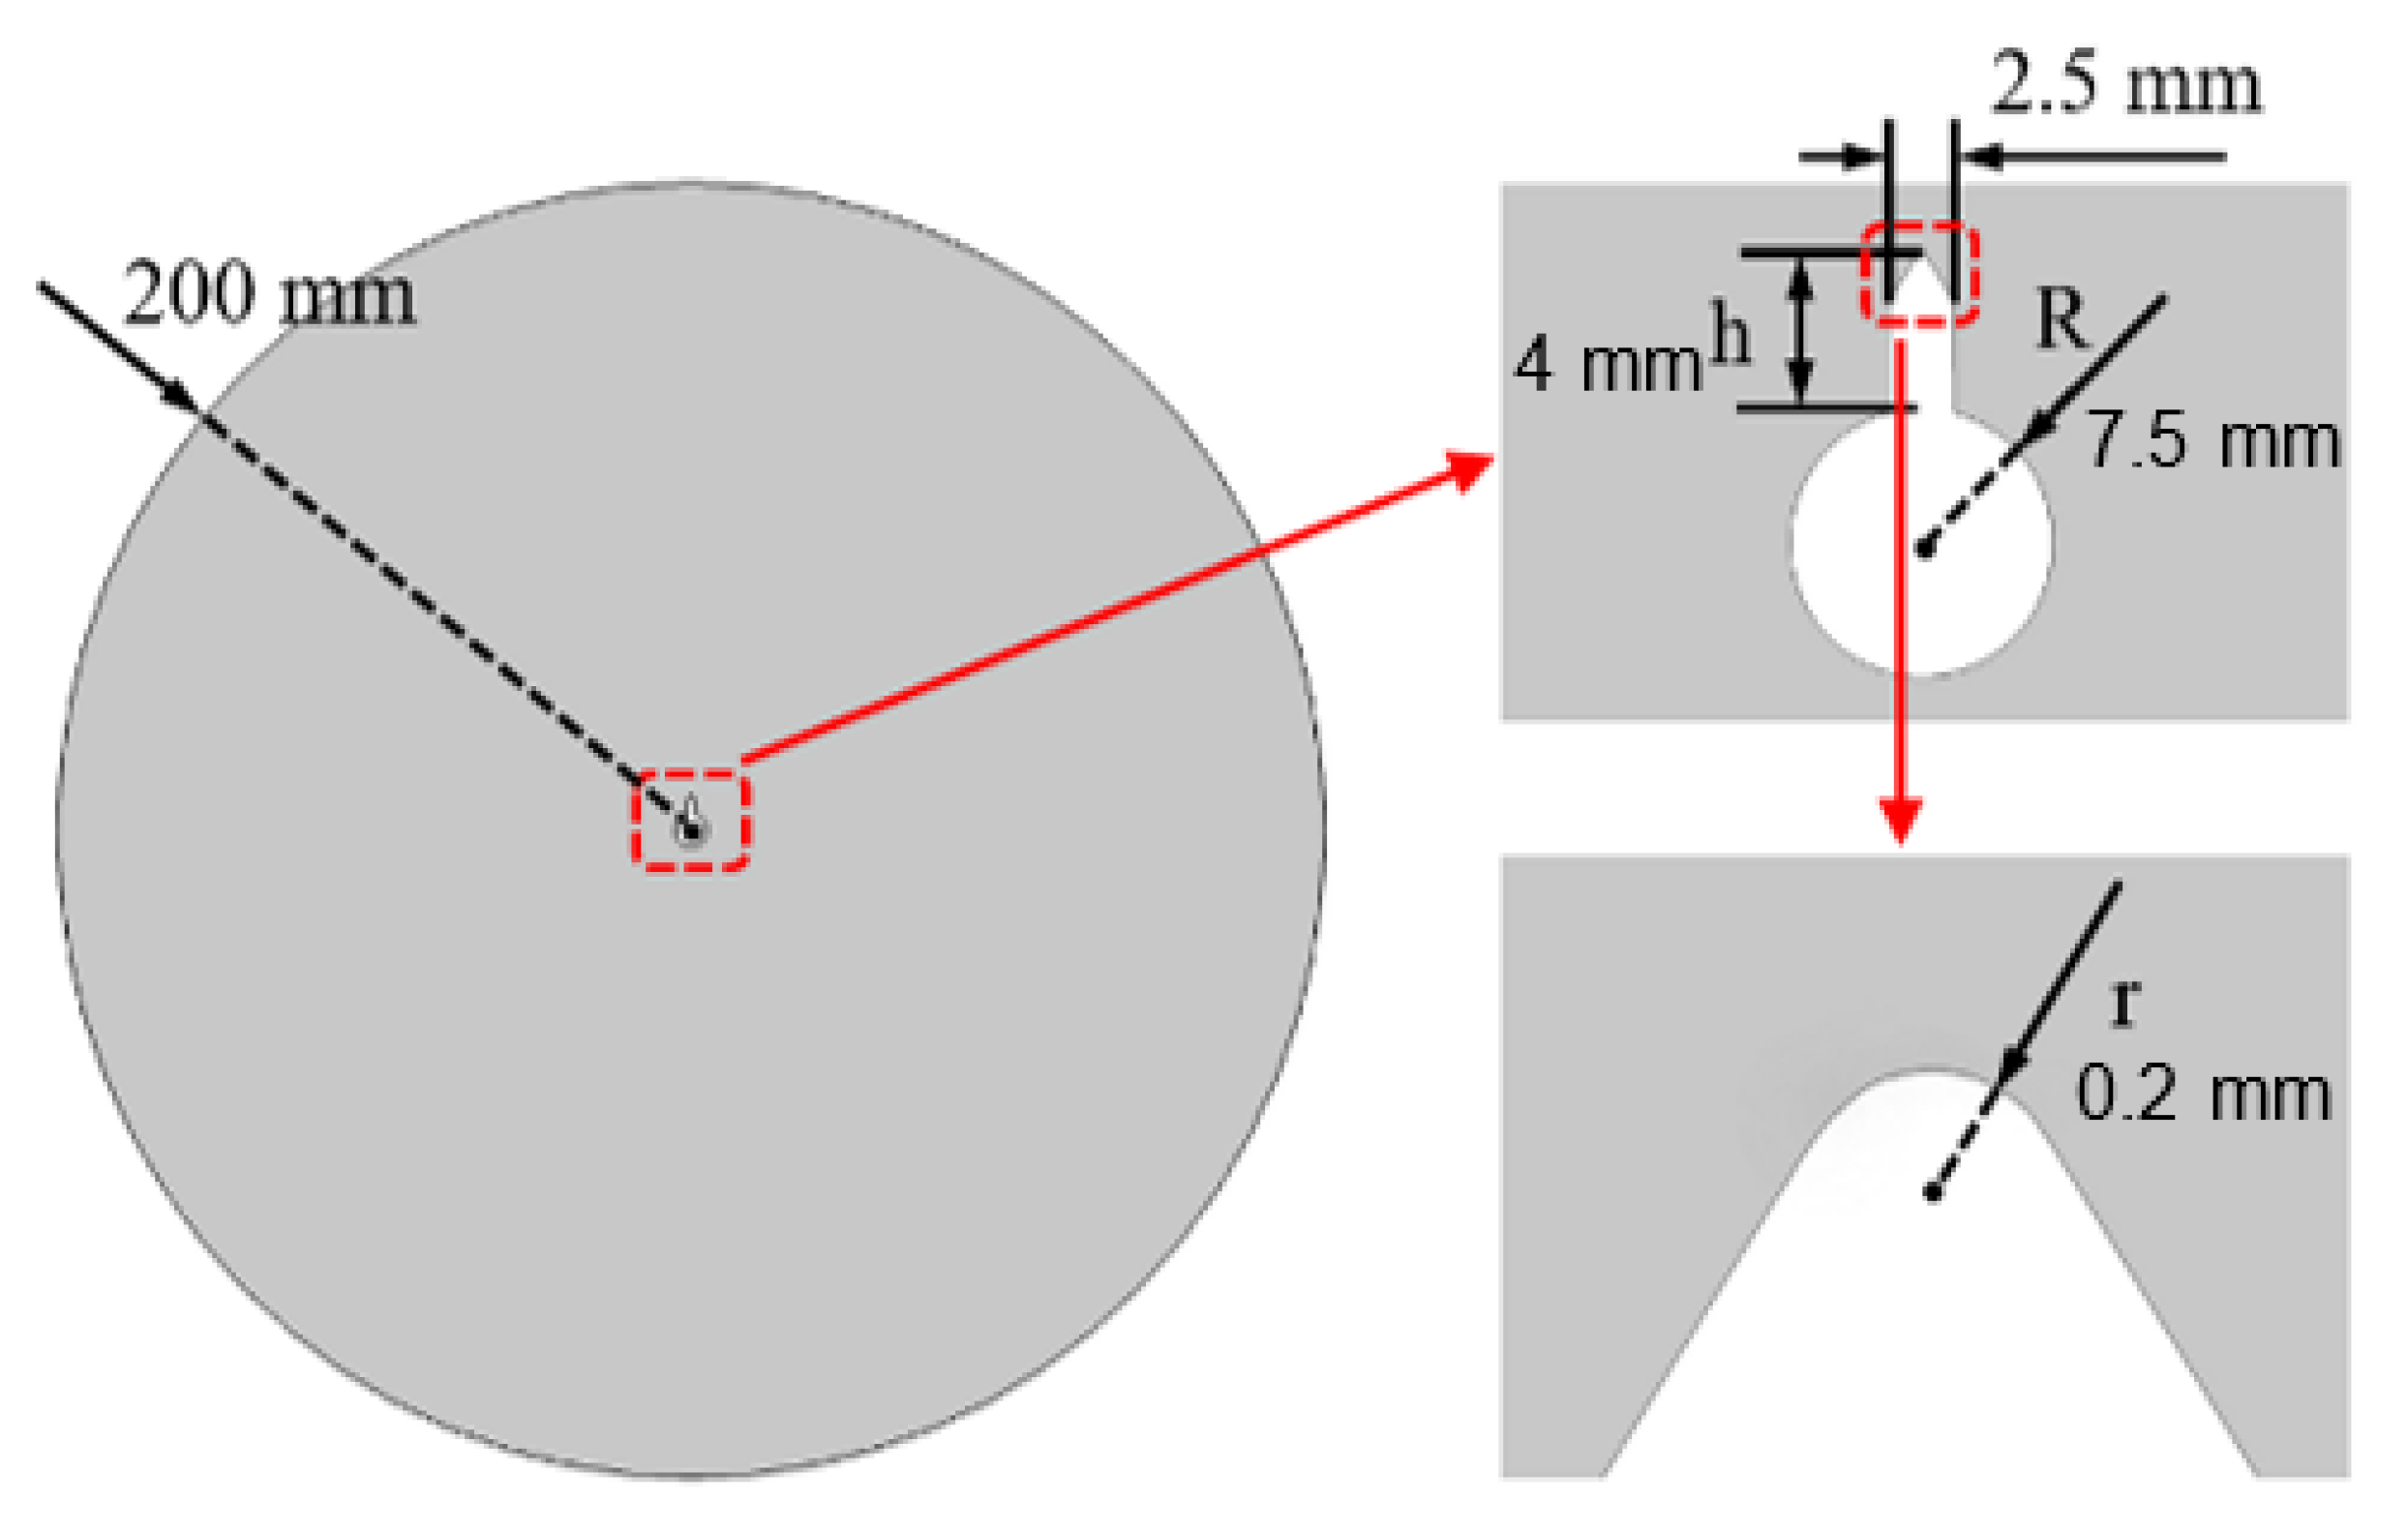
The simulation results show that, considering the geometry of conductor tip defects, the corona inception voltage decreases with an increase of tip height and decreases in tip curvature radius and conductor radius and the amplitude of the current pulse increases with increases in wire radius and tip curvature radius and a decrease in tip height. As for air pressure ascending from 600 hPa to 1013 hPa, the corona inception voltage obtained by simulation has an increase of 81.5% and the amplitude of current pulse has a drop of 9.1%.

Author Contributions

Conceptualization, S.W. and J.M.; methodology, S.W. and J.M.; software, J.M. and L.W.; validation, S.W., J.M. and L.W.; formal analysis, J.M.; investigation, J.M.; resources, J.M. and L.W.; data curation, J.M. and L.W.; writing—original draft preparation, J.M. and L.W.; writing—review and editing, S.W., J.M. and L.W.; visualization, J.M.; supervision, J.M.; project administration, S.W. and J.M.; funding acquisition, S.W. All authors have read and agreed to the published version of the manuscript.

Funding

This research received no external funding.

Institutional Review Board Statement

Not applicable.

Informed Consent Statement

Not applicable.

Data Availability Statement

Not applicable.

Conflicts of Interest

The authors declare no conflict of interest.

References

  1. Yi, Y.; Wang, Y.; Wang, L. Conductor surface conditions effects on audible noise spectrum characteristics of positive corona discharge. IEEE Trans. Dielectr. Electr. 2016, 23, 1872–1878. [Google Scholar] [CrossRef]
  2. Liu, H.; Liao, R.; Zhao, X.; Lin, Y. The effect of air pressure on the surface electric field intensity characteristics under negative DC corona discharge in a corona cage. Int. J. Electr. Power Energy Syst. 2019, 113, 244–250. [Google Scholar] [CrossRef]
  3. Ren, X.; Jiang, X.; Yang, G.; Huang, Y.; Wu, J.; Yang, Z. Effect of environmental parameters on streamer discharge in short air gap between rod and plate. Energies 2022, 15, 817. [Google Scholar] [CrossRef]
  4. Aleksandrov, N.L.; Bazelyan, E.M. Temperature and density effects on the properties of a long positive streamer in air. J. Phys. D Appl. Phys. 1996, 29, 2873. [Google Scholar] [CrossRef]
  5. Pancheshnyi, S.; Nudnova, M.; Starikovskii, A. Development of a cathode-directed streamer discharge in air at different pressures: Experiment and comparison with direct numerical simulation. Phys. Rev. E 2005, 71, 016407. [Google Scholar] [CrossRef] [PubMed]
  6. Chen, J.; Wang, P. Effect of relative humidity on electron distribution and ozone production by DC coronas in air. IEEE Trans. Plasma Sci. 2005, 33, 808–812. [Google Scholar] [CrossRef]
  7. Liu, H.; Wang, L.; Liao, R.; Zhao, X.; Hao, J.; He, G. Effect of relative humidity on the surface electric field intensity characteristics under DC voltage in a corona cage. IEEE Trans. Dielectr. Electr. 2021, 28, 3. [Google Scholar] [CrossRef]
  8. Li, H.; Zhu, J.; Yang, W.; Zhang, X.; Wang, D.; Zhu, J.; Bian, X. Humidity effects on the ground-level resultant electric field of positive DC conductors. Plasma Sci. Technol. 2019, 21, 074001. [Google Scholar] [CrossRef]
  9. Pfeiffer, M.; Franck, C.M. Impact of conductor surface type and rain intensity on HVDC corona losses. IEEE Trans. Power Deliv. 2015, 30, 2284–2292. [Google Scholar] [CrossRef]
  10. Bian, X.; Wang, L.; Liu, Y.; Yang, Y.; Guan, Z. High altitude effect on corona inception voltages of DC power transmission conductors based on the mobile corona cage. IEEE Trans. Power Deliv. 2013, 28, 1971–1973. [Google Scholar] [CrossRef]
  11. Lekganyane, M.J.; Ijumba, N.M.; Britten, A.C. Corona audible noise measurements in a small indoor corona cage under HVDC voltages. In Proceedings of the 2006 International Conference on Power System Technology, Chongqing, China, 22–26 October 2006; pp. 1–5. [Google Scholar] [CrossRef]
  12. Font, A.; Solak, Y.T.; Ilhan, S. DC corona characteristics derived from corona cage tests and simulations. IEEE Trans. Dielectr. Electr. 2019, 26, 1867–1875. [Google Scholar] [CrossRef]
  13. Xu, M.; Tan, Z.; Li, K. Modified peek formula for calculating positive DC Corona inception electric field under variable humidity. IEEE Trans. Dielectr. Electr. 2012, 19, 1377–1382. [Google Scholar] [CrossRef]
  14. Fu, Y.; He, M.; Chen, C.; Wang, C.; Zhang, Z. Effects of rod radius and voltage on streamer discharge in a short air gap. Plasma Sci. Technol. 2023, 25, 085401. [Google Scholar] [CrossRef]
  15. Peng, Y.; Chen, X.; Deng, Z.; Lan, L.; Zhan, H.; Pei, X.; Chen, J.; Yuan, Y.; Wen, X. Kinetic study of key species and reactions of atmospheric pressure pulsed corona discharge in humid air. Plasma Sci. Technol. 2022, 24, 172–186. [Google Scholar] [CrossRef]
  16. Van Gaens, W.; Bogaerts, A. Corrigendum: Kinetic modelling for an atmospheric pressure argon plasma jet in humid air. J. Phys. D Appl. Phys. 2014, 47, 079502. [Google Scholar] [CrossRef]
  17. Van Gaens, W.; Bogaerts, A. Reaction pathways of biomedically active species in an Ar plasma jet. Plasma Sources Sci. Technol. 2014, 23, 035015. [Google Scholar] [CrossRef]
  18. Wang, W.; Snoeckx, R.; Zhang, X.; Cha, M.S.; Bogaerts, A. Modeling plasma-based CO2 and CH4 conversion in mixtures with N2, O2, and H2O: The bigger plasma chemistry picture. J. Phys. Chem. C 2018, 122, 8704–8723. [Google Scholar] [CrossRef]
  19. Liu, D.; Sun, B.; Iza, F.; Xu, D.; Wang, X.; Rong, M.; Kong, M.G. Main species and chemical pathways in cold atmospheric-pressure Ar + H2O plasmas. Plasma Sources Sci. Technol. 2017, 26, 045009. [Google Scholar] [CrossRef]
  20. Wu, F.; Liao, R.; Yang, L. Numerical simulation of trichel pulse characteristics in bar-plate DC negative corona discharge. Acta Phys. Sin. 2013, 62, 348–357. [Google Scholar] [CrossRef]
  21. Wu, F.; Liao, R.; Wang, K.; Yang, L.; Grzybowski, S. Numerical simulation of the characteristics of heavy particles in bar-plate DC positive corona discharge based on a hybrid model. IEEE Trans. Plasma Sci. 2014, 42, 868–878. [Google Scholar] [CrossRef]
  22. Saifutdinov, A.I.; Fairushin, I.I.; Kashapov, N.F. Analysis of various scenarios of the behavior of voltage-current characteristics of direct-current microdischarge at atmospheric pressure. JETP Lett. 2016, 104, 180–185. [Google Scholar] [CrossRef]
  23. Feng, N.; Ma, T.; Chen, C.; Yao, B.; Gao, W. Simulation and study of DC corona discharge characteristics of bar-plate gap. Energies 2022, 15, 6431. [Google Scholar] [CrossRef]
  24. Sarrette, J.P.; Eichwald, O.; Marchal, F.; Ducasse, O.; Yousfi, M. Electro-hydrodynamics and kinetic modeling of dry and humid air flows activated by corona discharges. Plasma Sci. Technol. 2016, 18, 469–472. [Google Scholar] [CrossRef]
  25. Yang, W.; Zhou, Q.; Dong, Z. Kinetic study on non-thermal volumetric plasma decay in the early afterglow of air discharge generated by a short pulse microwave or laser. J. Appl. Phys. 2016, 120, 083302. [Google Scholar] [CrossRef]
  26. Jiang, M.; Li, Y.; Wang, H. 3D PIC-MCC simulation of corona discharge in needle-plate electrode with external circuit. Plasma Sources Sci. Technol. 2020, 29, 15–20. [Google Scholar] [CrossRef]
  27. Georghiou, G.E.; Papadakis, A.P.; Morrow, R.; Metaxas, A.C. Numerical modelling of atmospheric pressure gas discharges leading to plasma production. J. Phys. D Appl. Phys. 2005, 38, 303–328. [Google Scholar] [CrossRef]
  28. Pancheshnyi, S.; Biagi, S.; Bordage, M.C.; Hagelaar, G.J.M.; Morgan, W.L.; Phelps, A.V.; Pitchford, L.C. The LXCat project: Electron scattering cross sections and swarm parameters for low temperature plasma modeling. Chem. Phys. 2012, 398, 148–153. [Google Scholar] [CrossRef]
  29. Gas Discharge Plasma Database (GPLAS). Available online: http://plasma-data.net/ (accessed on 15 February 2023). (In Chinese).
  30. Farouk, T.; Farouk, B.; Gutsol, A.; Fridman, A. Atmospheric pressure methane–hydrogen dc micro-glow discharge for thin film deposition. J. Phys. D Appl. Phys. 2008, 41, 175202. [Google Scholar] [CrossRef]
  31. Li, C.; Ebert, U.; Hundsdorfer, W. Spatially hybrid computations for streamer discharges with generic features of pulled fronts: I. Planar fronts. J. Comput. Phys. 2010, 229, 200–220. [Google Scholar] [CrossRef]
  32. Hagelaar, G.J.M.; Pitchford, L.C. Solving the Boltzmann equation to obtain electron transport coefficients and rate coefficients for fluid models. Plasma Sources Sci. Technol. 2005, 14, 722–733. [Google Scholar] [CrossRef]
  33. He, W.; Liu, X.; Yang, F. Numerical simulation of direct current glow discharge in air with experimental validation. Jpn. J. Appl. Phys. 2012, 51, 026001. [Google Scholar] [CrossRef]
  34. Chang, J.-S.; Lawless, P.A.; Yamamoto, T. Corona discharge processes. IEEE Trans. Plasma Sci. 1997, 19, 1152–1166. [Google Scholar] [CrossRef]
  35. Giao, T.; Jordan, J. Modes of corona discharges in air. IEEE Trans. Power Appar. Syst. 1968, 5, 1207–1215. [Google Scholar] [CrossRef]
  36. Zogning, C.; Lobry, J.; Moiny, F. Comparison between positive and negative corona discharges by hydrodynamic plasma simulations. In Proceedings of the 2020 International Symposium on Electrical Insulating Materials (ISEIM), Tokyo, Japan, 13–17 September 2020; pp. 552–560. [Google Scholar]
Figure 1. Computation: geometric model.
Applsci 13 10472 g001
Figure 2. Gaussian distribution of initial electron density.
Applsci 13 10472 g002
Figure 3. Schematic diagram of mesh generation.
Applsci 13 10472 g003
Figure 4. Experimental device and wiring. DC—DC power supply; R—Protection resistance; K—Corona cage cavity; L—Sample; F—Cold fog generator; M—Vacuum pump; Ra—Current sampling box; C—Data acquisition card; PC—Computer; P—Video recorder; UV—UV imager; Ca—SLR camera.
Applsci 13 10472 g004
Figure 5. Wires and the electrode configuration.
Applsci 13 10472 g005
Figure 6. Comparison of current waveform.
Applsci 13 10472 g006
Figure 7. Comparison of voltage.
Applsci 13 10472 g007
Figure 8. Distribution of electric field (kV/cm). (a) 1.2798 ns; (b) 3.1131 ns; (c) 6.2033 ns; (d) 15.992 ns.
Applsci 13 10472 g008
Figure 9. Density distribution of electrons (m−3). (a) 5.0944 ns; (b) 8.746 ns; (c) 10.864 ns; (d) 12.169 ns.
Applsci 13 10472 g009
Figure 10. Density distribution of N2 (m−3). (a) 1.9895 ns; (b) 3.5863 ns; (c) 7.0239 ns; (d) 10.900 ns.
Applsci 13 10472 g010
Figure 11. Density distribution of N2+ (m−3). (a) 1.9895 ns; (b) 3.5863 ns; (c) 7.0239 ns; (d) 10.900 ns.
Applsci 13 10472 g011
Figure 12. N2 + e => 2e + N2+ reaction rate (mol/(m3·s)). (a) 1.9895 ns; (b) 3.5863 ns; (c) 7.0239 ns; (d) 10.900 ns.
Applsci 13 10472 g012
Figure 13. Corona inception voltage under different tip height and wire radius (tip’s curvature radius r of 0.1 mm).
Applsci 13 10472 g013
Figure 14. Corona inception voltage under different tip curvature radii and conductor radii (tip’s height h of 8 mm).
Applsci 13 10472 g014
Figure 15. Pulse amplitude under different geometries.
Applsci 13 10472 g015
Figure 16. Simulation results under different background air pressures (The value of r and h as well as R are 0.1 mm, 6 mm, and 5 mm).
Applsci 13 10472 g016
Table 1. Microscopic reaction equations and rates.
EquationsRates
Elastic collision
e + N 2 N 2 + e f 1 ( ε )
e + O 2 O 2 + e f 2 ( ε )
Impact ionization
e + N 2 2 e + N 2 + f 3 ( ε )
e + O 2 2 e + O 2 + f 4 ( ε )
Charge transfer between particles
N 2 + + 2 N 2 N 4 + + N 2 k 5 = 5 × 10 41
N 2 + + N 2 + O 2 N 4 + + O 2 k 6 = 5 × 10 41
N 4 + + O 2 O 2 + + 2 N 2 k 7 = 2.5 × 10 16
O 2 + N 2 + O 2 O 4 + + N 2 k 11 = 1 × 10 15
O 2 + + O 2 + N 2 O 4 + + N 2 k 12 = 2.04 × 10 34 T 3.2
O 2 + + 2 O 2 O 4 + + O 2 k 13 = 2.04 × 10 34 T 3.2
Recombination Reaction
e + O 4 + 2 O 2 k 14 = 1.4 × 10 12 300 / T e 0.5
e + O 2 + 2 O k 15 = 2.42 × 10 13 300 / T e
O 4 + + O 2 3 O 2 k 16 = 1 × 10 13
2 e + N 2 + e + N 2 k 22 = 5.651 × 10 27 T e 0.8
O 2 + + O O + O 2 k 23 = 3.46 × 10 12 T 0.5
Neutral reaction
O + O 2 + N 2 O 3 + N 2 k 24 = 2.5 × 10 46
O + 2 O 2 O 3 + O 2 k 25 = 2.5 × 10 46
Electron attachment
e + O 2 O + O f 26 ε
e + 2 O 2 O 2 + O 2 k 27 = 2 × 10 41 300 / T e
Surface Reaction
N 2 + N 2 N 2 O 2 + N 2 + O 2
N 4 + 2 N 2 O 2 O 2
O 2 + O 2 O 0.5 O 2
O 4 + 2 O 2 O 0.5 O 2
Disclaimer/Publisher’s Note: The statements, opinions and data contained in all publications are solely those of the individual author(s) and contributor(s) and not of MDPI and/or the editor(s). MDPI and/or the editor(s) disclaim responsibility for any injury to people or property resulting from any ideas, methods, instructions or products referred to in the content.

