Article

Dynamic Analysis of Train–Bridge Coupling System for a Long-Span Railway Suspension Bridge Subjected to Strike–Slip Fault

1
School of Civil Engineering, Southwest Jiaotong University, Chengdu 610031, China
2
China Railway First Survey and Design Institute Group Co., Ltd., Xi’an 710043, China
3
Guizhou Transportation Planning Survey & Design Academe Co., Ltd., Guiyang 550081, China
4
China Railway Eryuan Engineering Group Co., Ltd., Chengdu 610031, China
*
Author to whom correspondence should be addressed.
Appl. Sci. 2023, 13(18), 10422; https://doi.org/10.3390/app131810422
Submission received: 14 August 2023 / Revised: 13 September 2023 / Accepted: 14 September 2023 / Published: 18 September 2023

Abstract

:
Long-span railway bridges crossing active faults are more vulnerable owing to the joint combination of pulse ground motions and surface dislocation. To study the dynamic effects resulting from the coupling of long-span railway suspension bridges crossing strike–slip fault and trains, a nonlinear model in which wheel–rail contact was established based on Hertz’s nonlinear theory and Kalker creep theory. To generate the ground motions across strike–slip fault, an artificial synthetic method, which considers both the fling-step effect with a single pulse and the directivity effect with multiple pulses, is employed. The effects of fault-crossing angles (FCAs) and permanent ground rupture displacements (PGRDs) are systematically investigated based on wheel–rail dynamic (derailment coefficient, lateral wheel–rail force, and wheel–load reduction rate). Conclusions are drawn and can be applied in the practical seismic design and train running safety assessment of long-span railway suspension bridges crossing strike–slip fault.

1. Introduction

Given the intricate temporal and spatial distribution of earthquakes across fault lines, the limited warning time, and the significant risk of earthquake-induced damage, there is an urgent need to address the challenges related to the operational performance of bridges during sudden seismic events and the prompt restoration of bridges post-earthquakes. Consequently, there is a growing demand for enhanced seismic resilience and operational safety of bridges. It is, therefore, essential to undertake comprehensive research on the theoretical framework for seismic resilience of bridges in regions prone to intense seismic activity across fault lines, as well as conduct thorough assessments of their operational safety.
While earthquakes have inflicted considerable damage on bridges crossing faults and have the potential to result in derailments, the existing research primarily concentrates on bridge responses. However, there is a paucity of studies investigating the impact of train–bridge coupling vibrations. Nonetheless, researchers worldwide have made notable advancements in this area, yielding a range of valuable scientific research findings. Yang et al. [1] developed near-fault pulse seismic ductility spectra based on machine learning to investigate the influence of pulse parameters on structures in near-fault zones. Chen et al. [2] utilized a parameter sensitivity approach to investigate the influence of the velocity pulse period and velocity pulse count on high-pier bridges. The study involved conducting experiments on a prototype bridge using a shaking table, followed by calibrating and validating the corresponding numerical models based on recorded experimental data. Ucak et al. [3] delved into the consequences of a fault rupture zone intersecting a seismically isolated bridge. The research demonstrated that the response of the seismically isolated bridge was notably affected by the position of the fault crossing along the bridge’s span and the orientation of the fault relative to the bridge’s longitudinal direction. These findings emphasize the criticality of incorporating fault characteristics into the design and analysis of seismically isolated bridges, particularly in areas prone to intense seismic activity. Zhang et al. [4] and Gu et al. [5] investigated the impact of FCAs and PGRDs on the seismic responses of bridges. Their investigations revealed that the seismic responses of fault-crossing bridges surpassed those of bridges located near faults, particularly in terms of girder and bearing displacements. Moreover, the results indicated that, among the various FCAs analyzed, a 90° angle resulted in smaller pylon displacement and longitudinal bearing displacement while leading to larger transverse bearing displacement. Lin et al. [6], Yang et al. [7], and Zeng et al. [8] examined both ordinary and seismically isolated bridges crossing strike–slip faults. Their study systematically explored various factors, including FCA and fault-crossing location. Their consistent findings indicated that the most favorable outcomes were generally observed when the FCA was set at 90° and the fault-crossing location was positioned at the middle span of the bridge.
It is worth noting that the majority of existing studies have primarily focused on highway bridges crossing strike–slip fault, with relatively fewer investigations conducted on railway bridges. However, considering the substantial influence of train–bridge interaction on the dynamic characteristics of high-speed railway systems, further research in this domain becomes imperative. As previously mentioned, it is essential to account for the influence of trains when studying bridges crossing slip faults. Given the pressing need to ensure the safety of high-speed railway bridges and traffic, research in this area holds great significance.
Gong et al. [9] employed a real-time co-simulation approach to address the train–track–bridge dynamic interaction. Zhang et al. [10] considered the excitation effects of track irregularity and earthquake action on the train–bridge dynamic interaction system. The dynamic response of each subsystem of the vehicle and bridge was obtained, and the vibration mechanism was analyzed. Jiang et al. [11] developed a finite element model to study train–bridge interaction in a high-speed railway context. They focused on a simply supported beam bridge with CRTS II plate and CRH2C high-speed train as the subjects of their research. Jin et al. [12] and Liu et al. [13] took into account the randomness of earthquakes and track irregularity and evaluated the dynamic index of trains during and after earthquakes from a probabilistic perspective. Hu et al. [14] considered seismic residual deformations and studied the influence of additional lateral irregularities of the rail caused by the lateral defection of the girder and train speed on train safety and stability. Zeng et al. [15], Zhu et al. [16], Zhang et al. [17], Xia et al. [18], Gao et al. [19], and Wang et al. [20] studied the effects of the seismic wave incidence angle, seismic wave propagation velocity, seismic intensity, and train speed on the train–bridge dynamic interaction. Ma et al. [21] and Gong [22] investigated the influence of spatial variation on the dynamic performance of a train passing through a bridge and pointed out that the wave passage effect and incoherence effect should not be disregarded in this context, and the tri-directional spatially correlated ground motions may underestimate the random response and running safety. Qiao et al. [23,24] examined the impact of topographic effects on the seismic response of train–bridge systems and found that topography and the incident angle of seismic waves have a significant influence on the system’s seismic response. Chen et al. [25,26], Zhou et al. [27], and Yu et al. [28] investigated the dynamic response of train–track–bridge coupling systems under the influence of pulse parameters from near-fault pulse-type earthquakes. The analysis revealed that the dynamic response of the train group is approximately linear and positively correlated with the amplitude of the velocity pulse, and the dynamic response of the train group is negatively correlated with the velocity pulse period. Jiang [29] assessed the safe running speed limit under different seismic levels based on the wheel–rail dynamic indicators of CRH3 high-speed train and CRTS III ballastless track deformation indicators.
In this study, a train–bridge coupling model was developed to capture the intricate nonlinear behavior between the wheel and rail using ANSYS/LS-DYNA [30]. To investigate the train–bridge dynamic behavior under the influence of earthquakes, we have adopted the CRH2 high-speed train and a high-speed railway double-track steel truss suspension bridge (HSRDTSTSB) across strike–slip fault ground motions (ASSFGMs). To generate the ASSFGMs, an artificial synthetic method, which considers both the fling-step effect with a single pulse and the directivity effect with multiple pulses, was employed. The effects of FCAs and PGRDs were systematically investigated. This paper specifically concentrates on the nonlinear seismic response of the train–bridge system under the combined influence of both train load and seismic load rather than considering the train load in isolation. As a result, the impact of variations in train speed is not discussed in this study due to space constraints.

2. Train–Bridge System under Earthquake

The relative dislocation of strike–slip fault can result in varying or even opposite ground motion characteristics on either side of the fault. The internal forces of a structure are influenced not only by the ground vibration but also by the relative dislocation of fault planes. The equations of motion can incorporate the impact of surface dislocations on the seismic response of structures. This allows for an accurate representation of the internal forces and residual deformation of the piers of crossing-fault bridges subjected to ground motions. In this study, the multi-support excitation displacement input model is used as a more appropriate ground motion input mode. The dynamic equations of the train–track–bridge system subjected to earthquakes can be denoted as [31]
M v u ¨ v + C v u ˙ v + K v u v = R v
M t u ¨ t + C t u ˙ t + K t u t = R t
M b u ¨ b + C b u ˙ b + K b u b = R b + R b g
where M, C, and K represent the mass, damping, and stiffness matrices, respectively; u ¨ , u ˙ , and u represent the generalized acceleration vector, generalized velocity vector, and generalized displacement vector, respectively; R represents the generalized load vector with the subscripts v, t, b, and bg representing the train, track, bridge, and earthquake.
The vehicle Equation (1) and the track Equation (2) are coupled through the wheel–rail relationship, while the track Equation (2) and the bridge Equation (3) are coupled through the bridge–rail relationship, thus forming a comprehensive and complex system of dynamic equations. The train–track–bridge system contains strong nonlinear links such as wheel–rail contact geometric nonlinearity and wheel–rail force nonlinearity; it is part of a complex nonlinear dynamic system. The LS-DYNA explicit integral method [30] is used to simulate the system dynamics behavior of the bridge under seismic action, which is an effective way to analyze and evaluate the safety of trains crossing the bridge.

3. Numerical Analysis

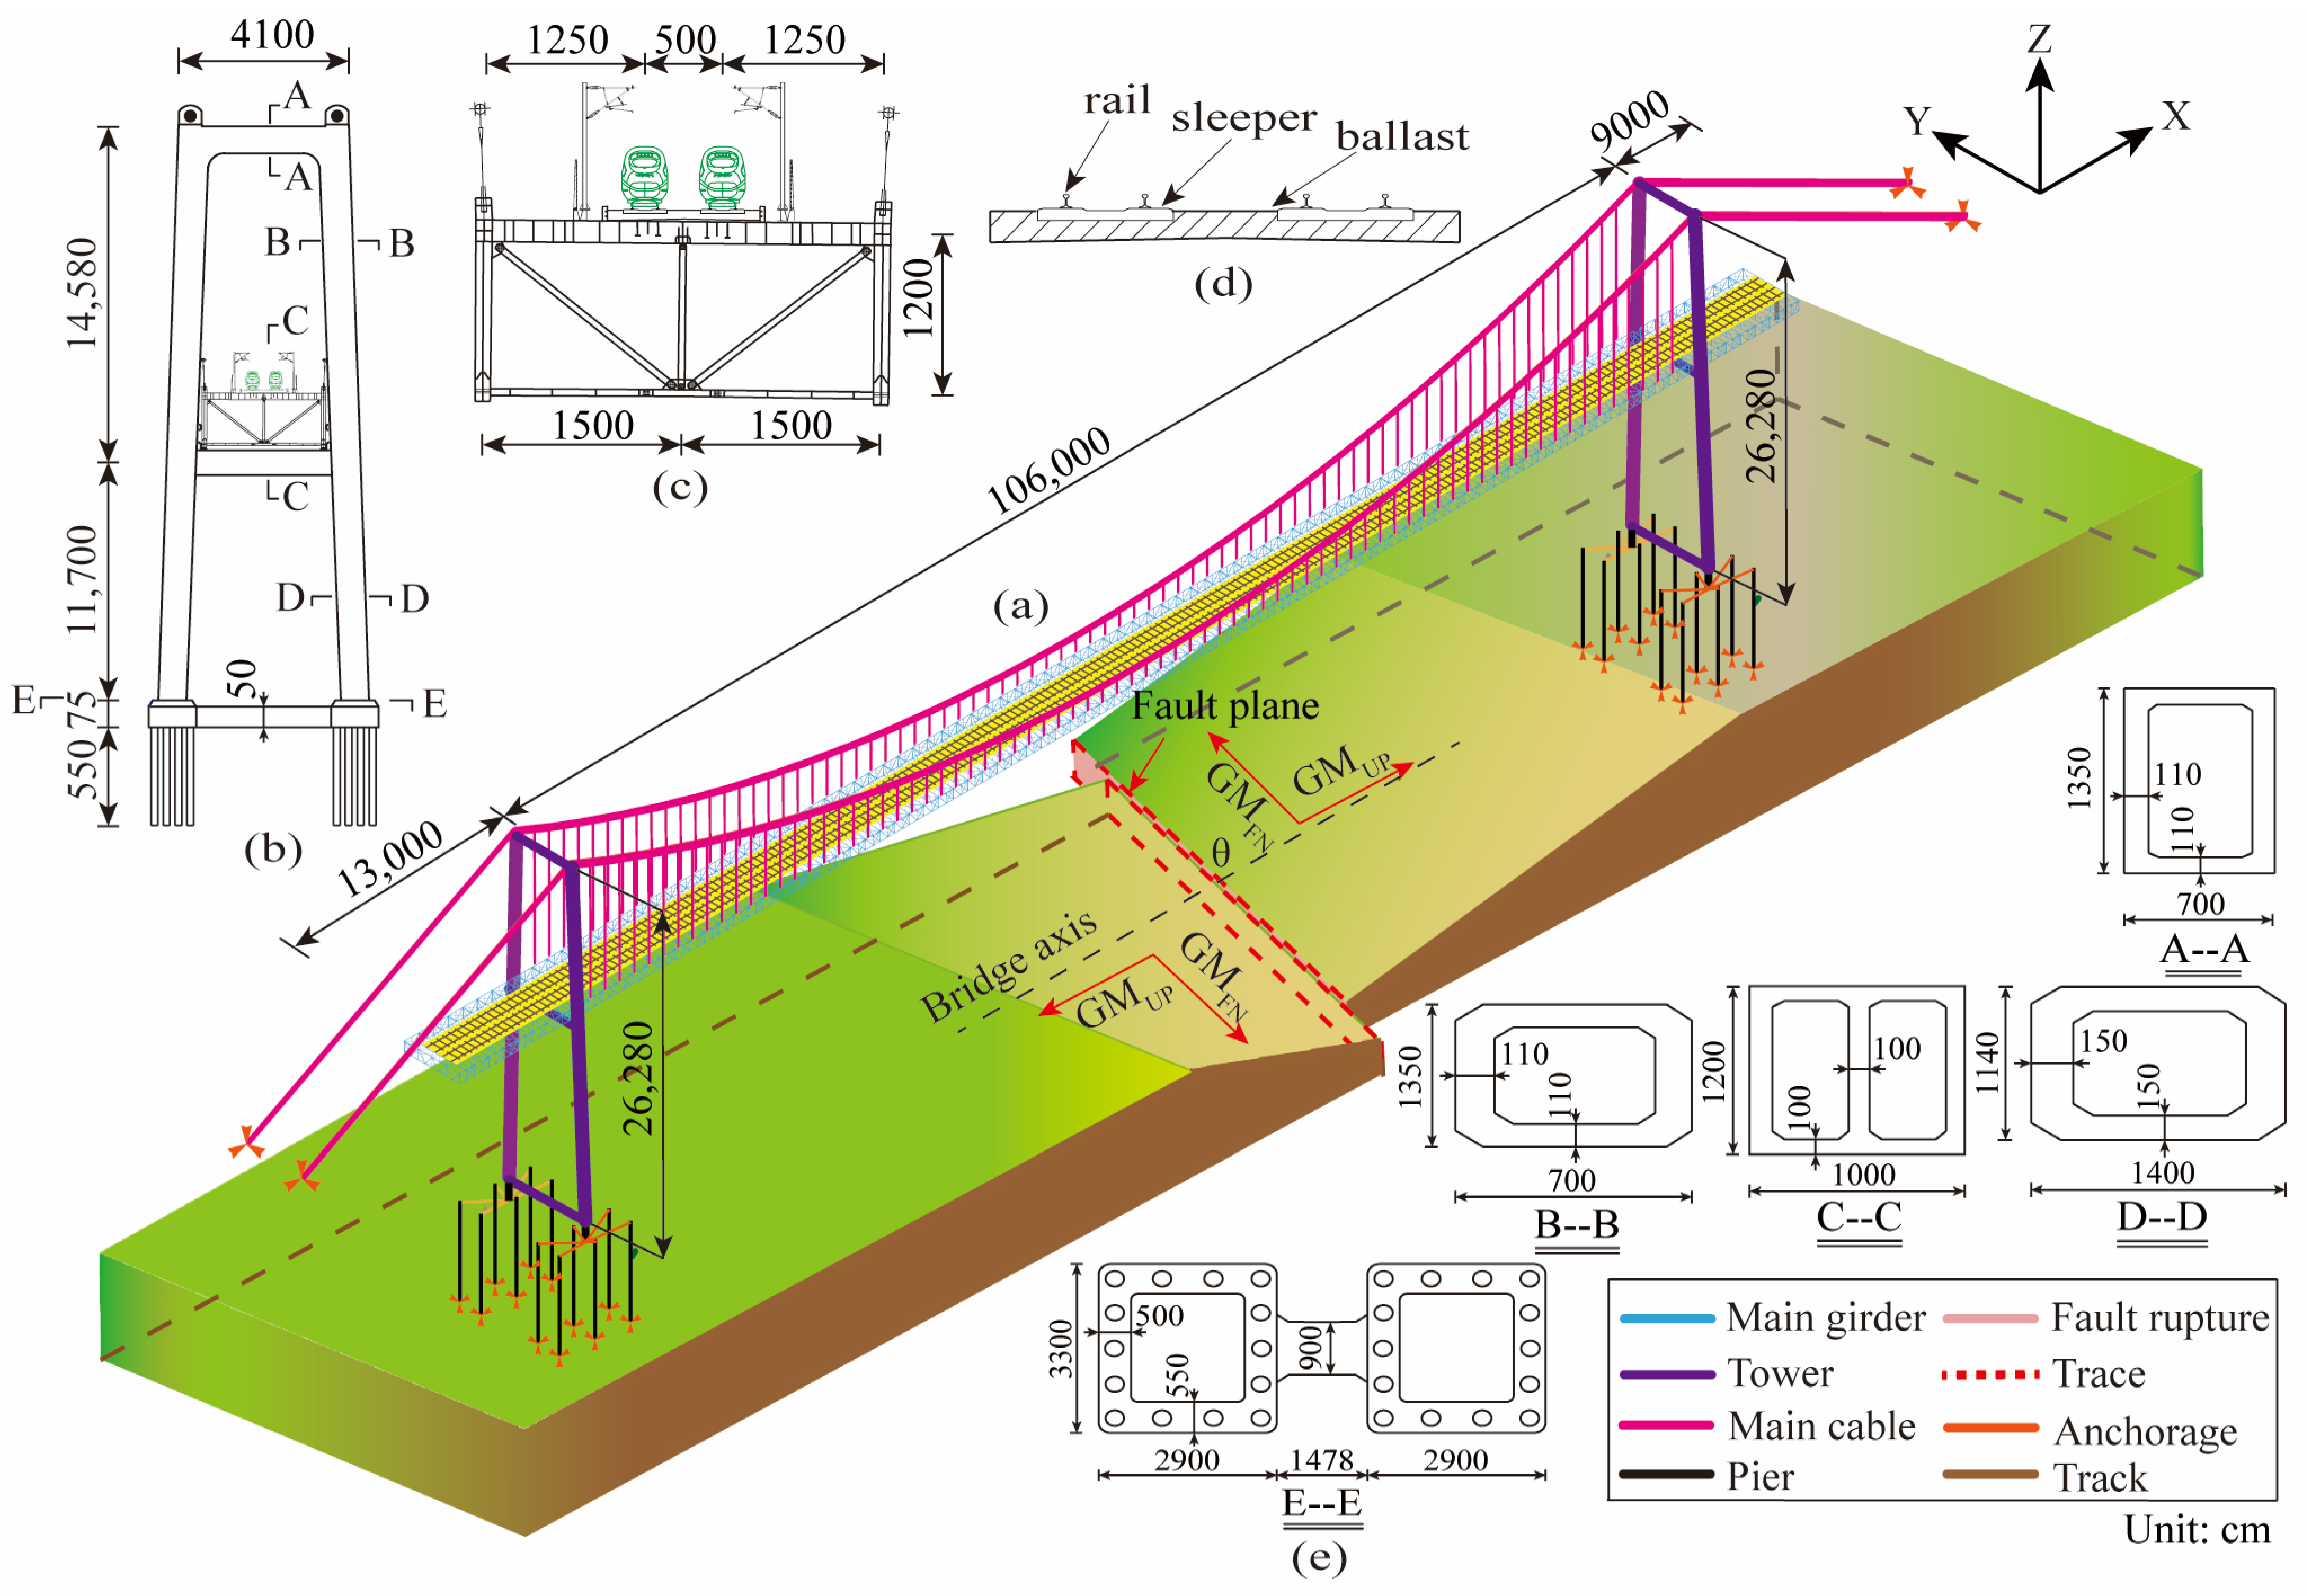
3.1. Configurations of HSRDTSTSB

To study the train–bridge dynamic behavior of the HSRDTSTSB subjected to strike–slip fault, a long-span HSRDTSTSB with a main span length of 1060 (m) is adopted herein. The overall bridge has a total length of 1280 (m) with a layout of 130 (m) + 1060 (m) + 90 (m), whose elevation layout view is shown in Figure 1a.
The main girder of the bridge has a total width of 30 (m) and a height of 12 (m) and adopts a stiffening girder with a three-span continuous system. The stiffening girder is designed as a fully floating system in the longitudinal direction, with transverse wind-resistant bearings installed at the bridge tower to enhance stability. The cross-section of the bridge features a double-track railway ballasted deck arrangement using a CHN60 rail type, with a spacing of 5 (m) between the middle lines of the tracks. The cross-section layout of the stiffening girder and ballasted railway are shown in Figure 1c,d, respectively. The interval distances of the main cable and slings are 41 (m) and 30 (m) in the transversal direction, respectively. The main tower is an H-type concrete structure with a height of 262.8 (m) and a longitudinal width of 41.0 (m) at both sizes shown in Figure 1b. The main tower foundation adopts 40 bored cast-in-place piles with a diameter of 3.0 (m). The dimension of the cushion cap is 33.0 (m) × 29.0 (m). Two gravity-type anchorages are located on the bank. The expanded foundation placed on the bedrock is adopted. In addition, the ASSFGMs are displayed in Figure 1.

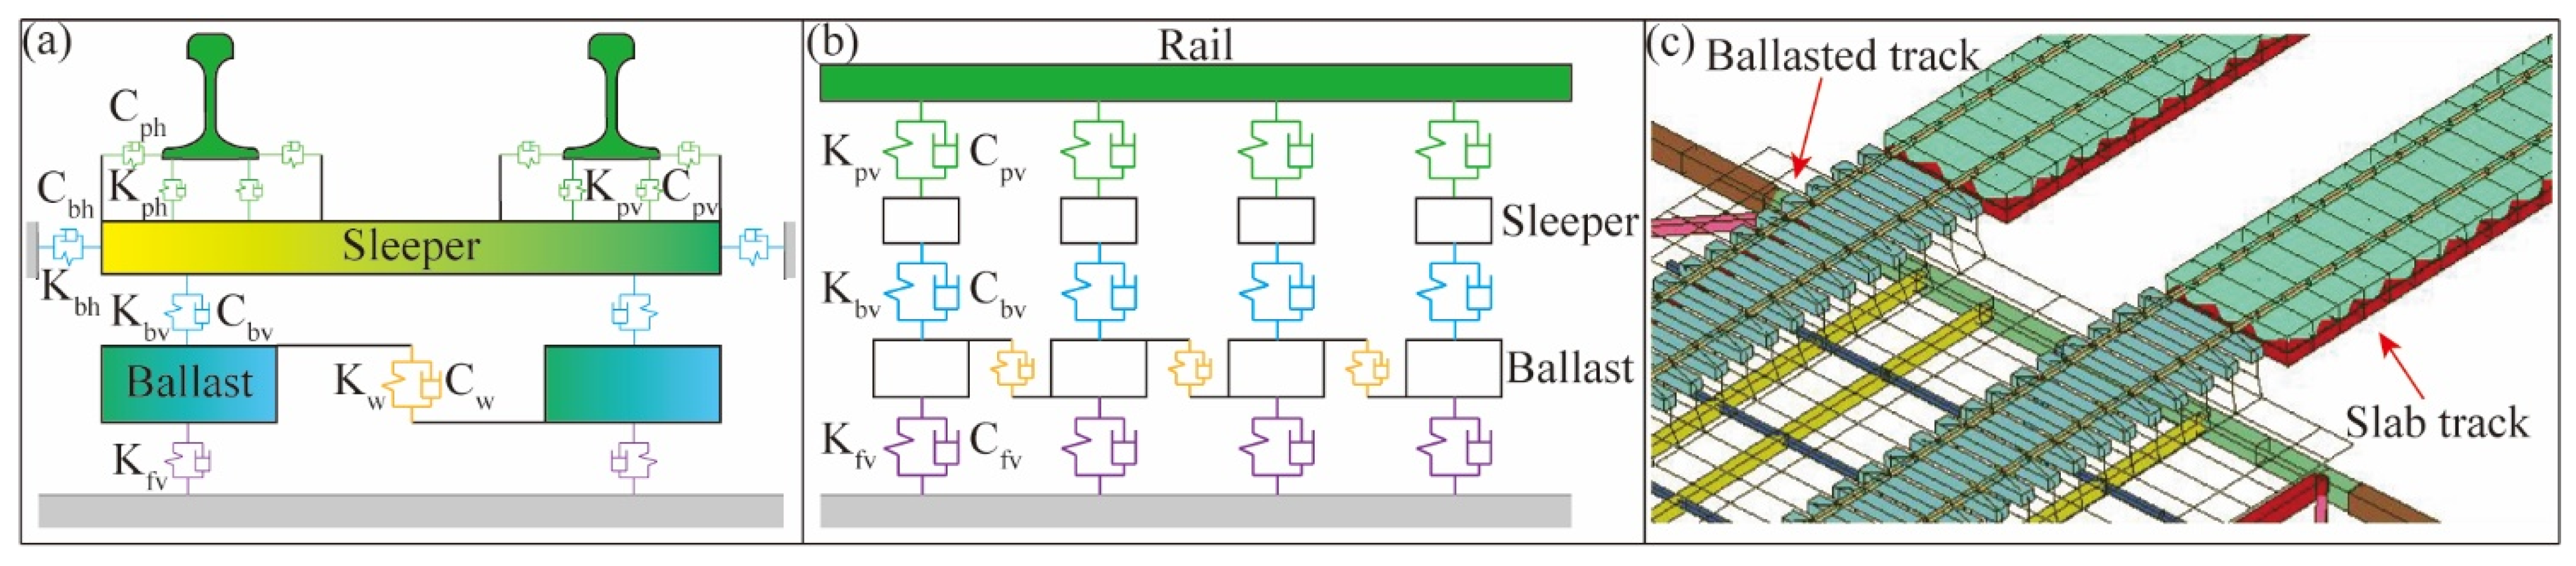
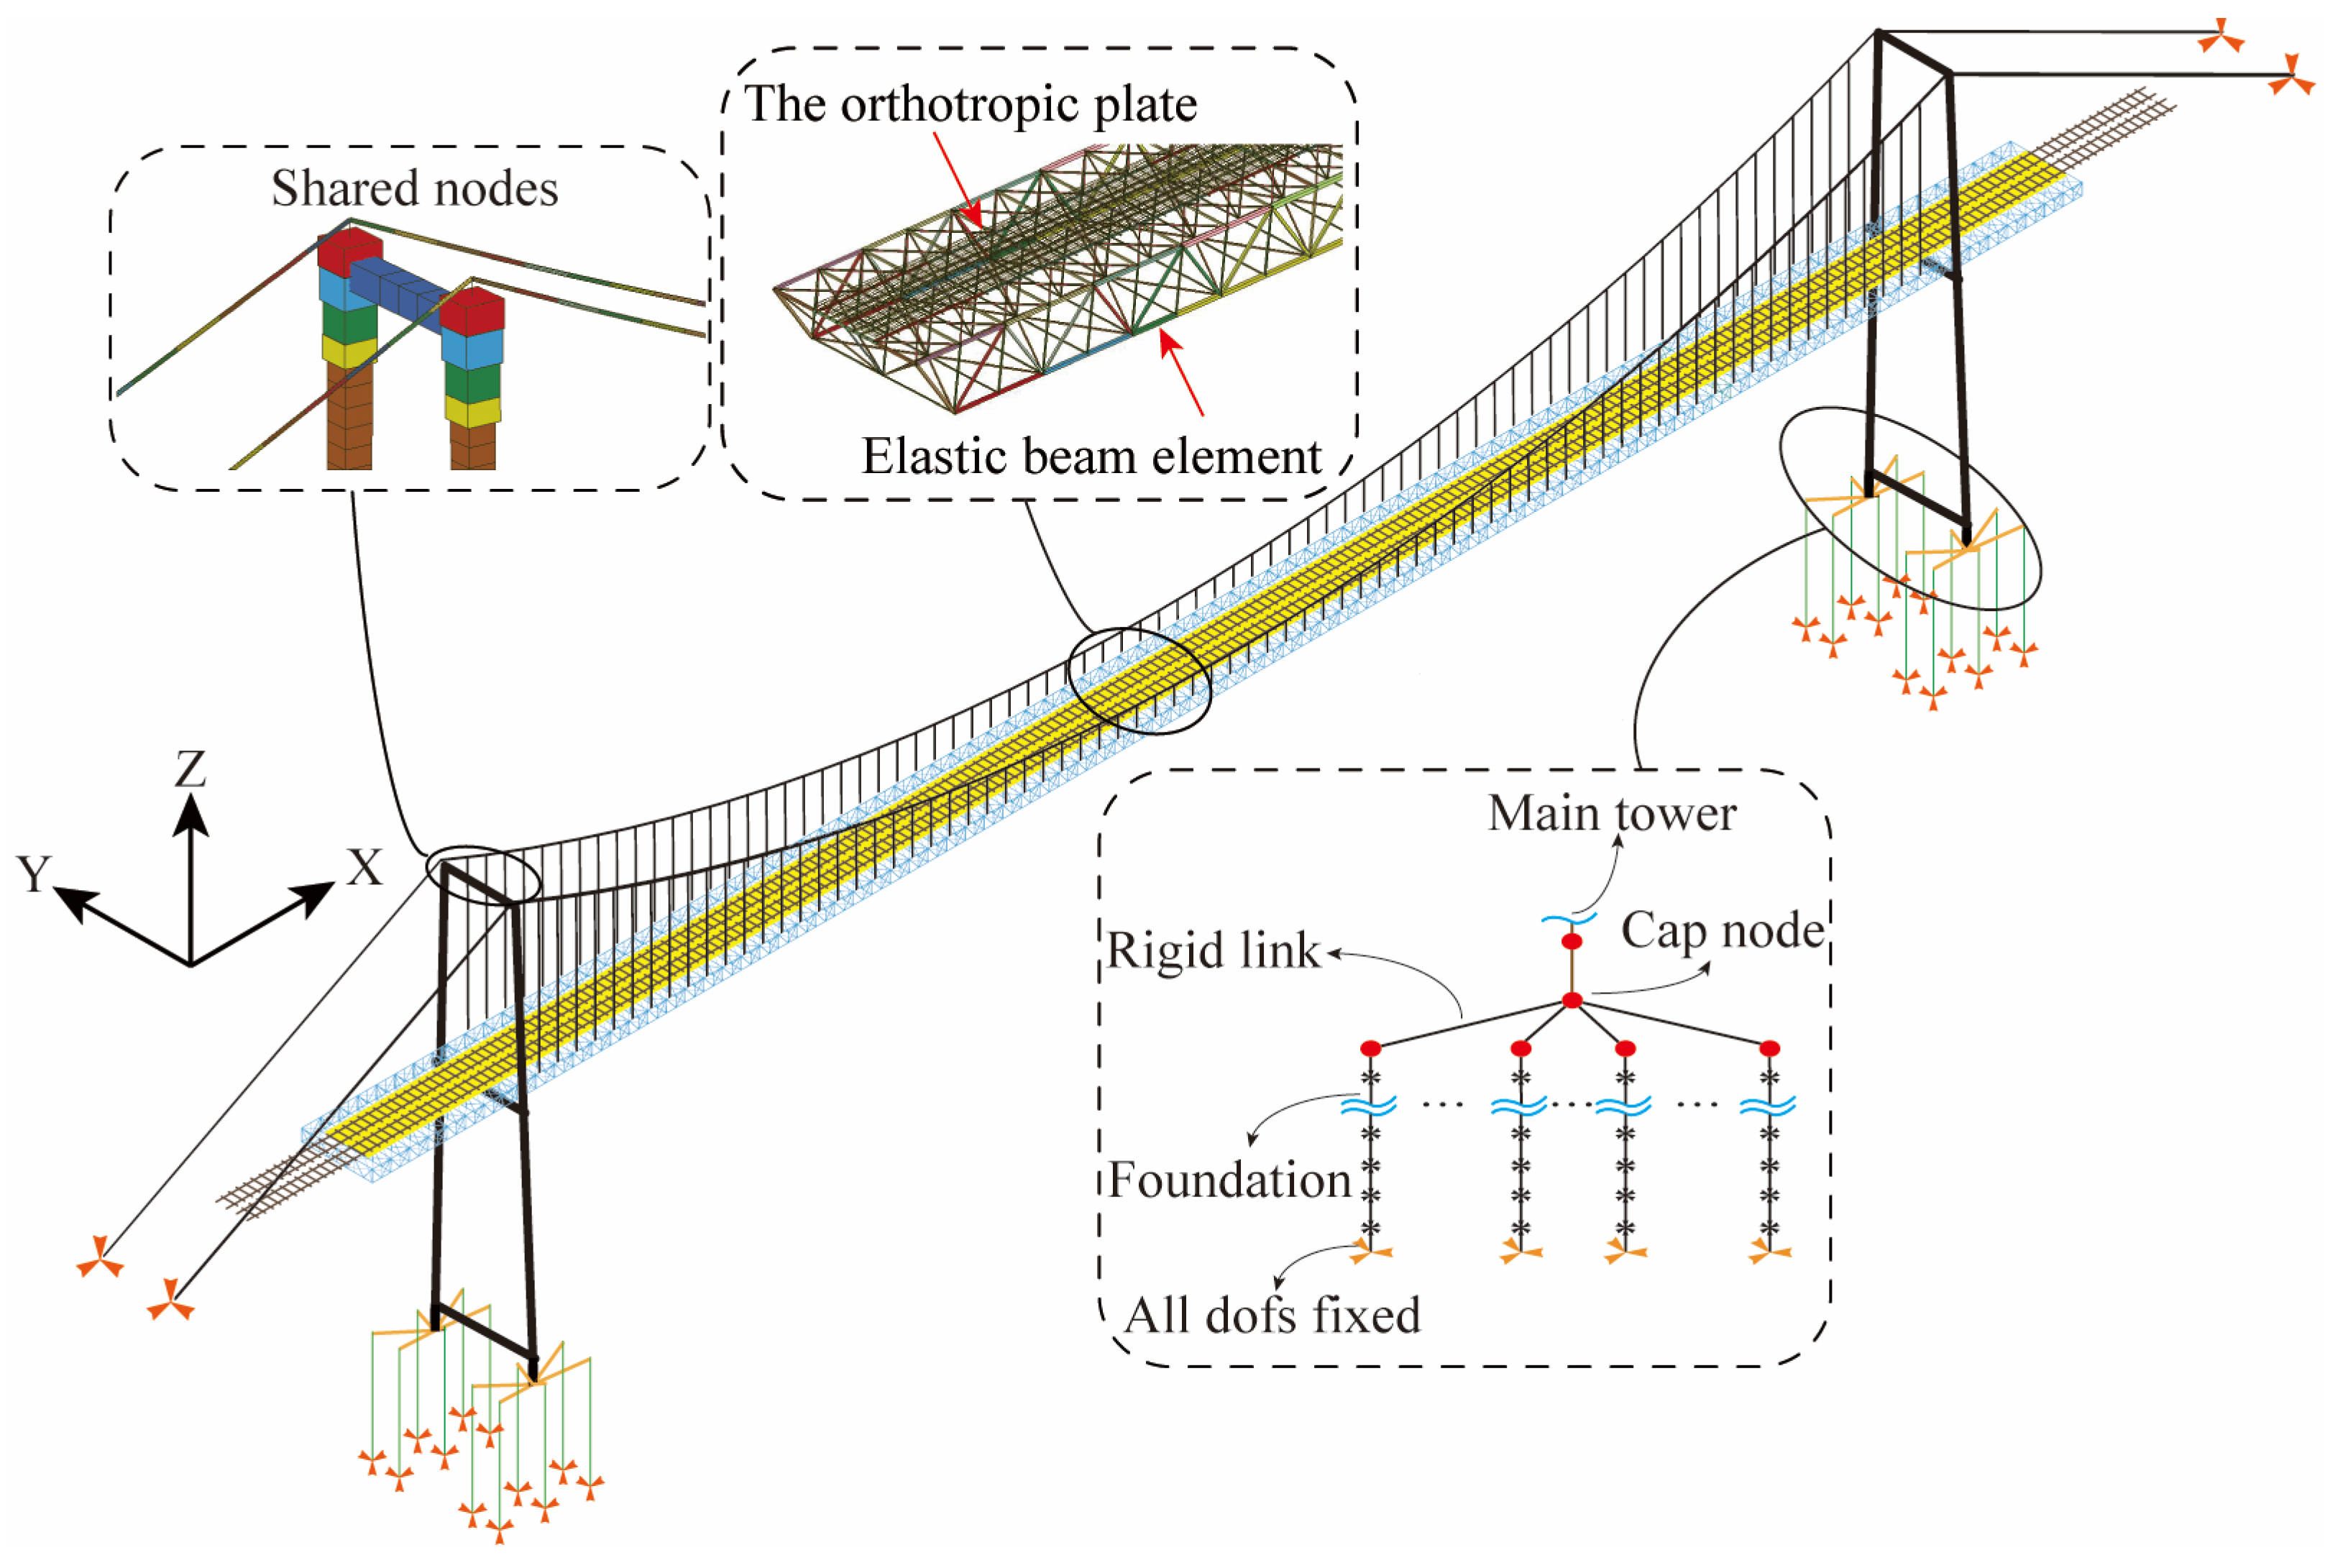
3.2. Bridge and Track Model

This study employs Timoshenko beam elements to model the steel truss main girder, main tower, and sleeper, which are characterized by slender to moderately stubby beam structures. The rail is treated as an infinitely long Euler–Bernoulli beam with discrete elastic point supports, and its vertical, lateral, and rotational degrees of freedom are taken into account. The ballast is distributed in mass blocks according to the actual distance between the sleepers, taking into account their vertical and lateral vibrations (as shown in Figure 2a,b). A link element is used to model the main cable and sling, with the assumption that the stress is uniformly distributed across the entire element. Shell elements are appropriate for simulating orthogonal plates, and the mesh size of the plates should correspond to the spacing of the sleepers. The transverse pounding generated by horizontal seismic motion significantly influences the dynamic response of bridge structures. Consequently, there are lateral anti-wind connections between the steel truss girders and the towers [32,33]. Figure 3 shows the detailed FE model of the HSRDTSTSB. The present study adopts the well-established properties for the connection between track structures [34]. In addition, 300 m of ballastless tracks are constructed on each side of the ballasted tracks as boundary conditions and the parameters related to Jiang [29]. Table 1 tabulates the material properties adopted in this study.

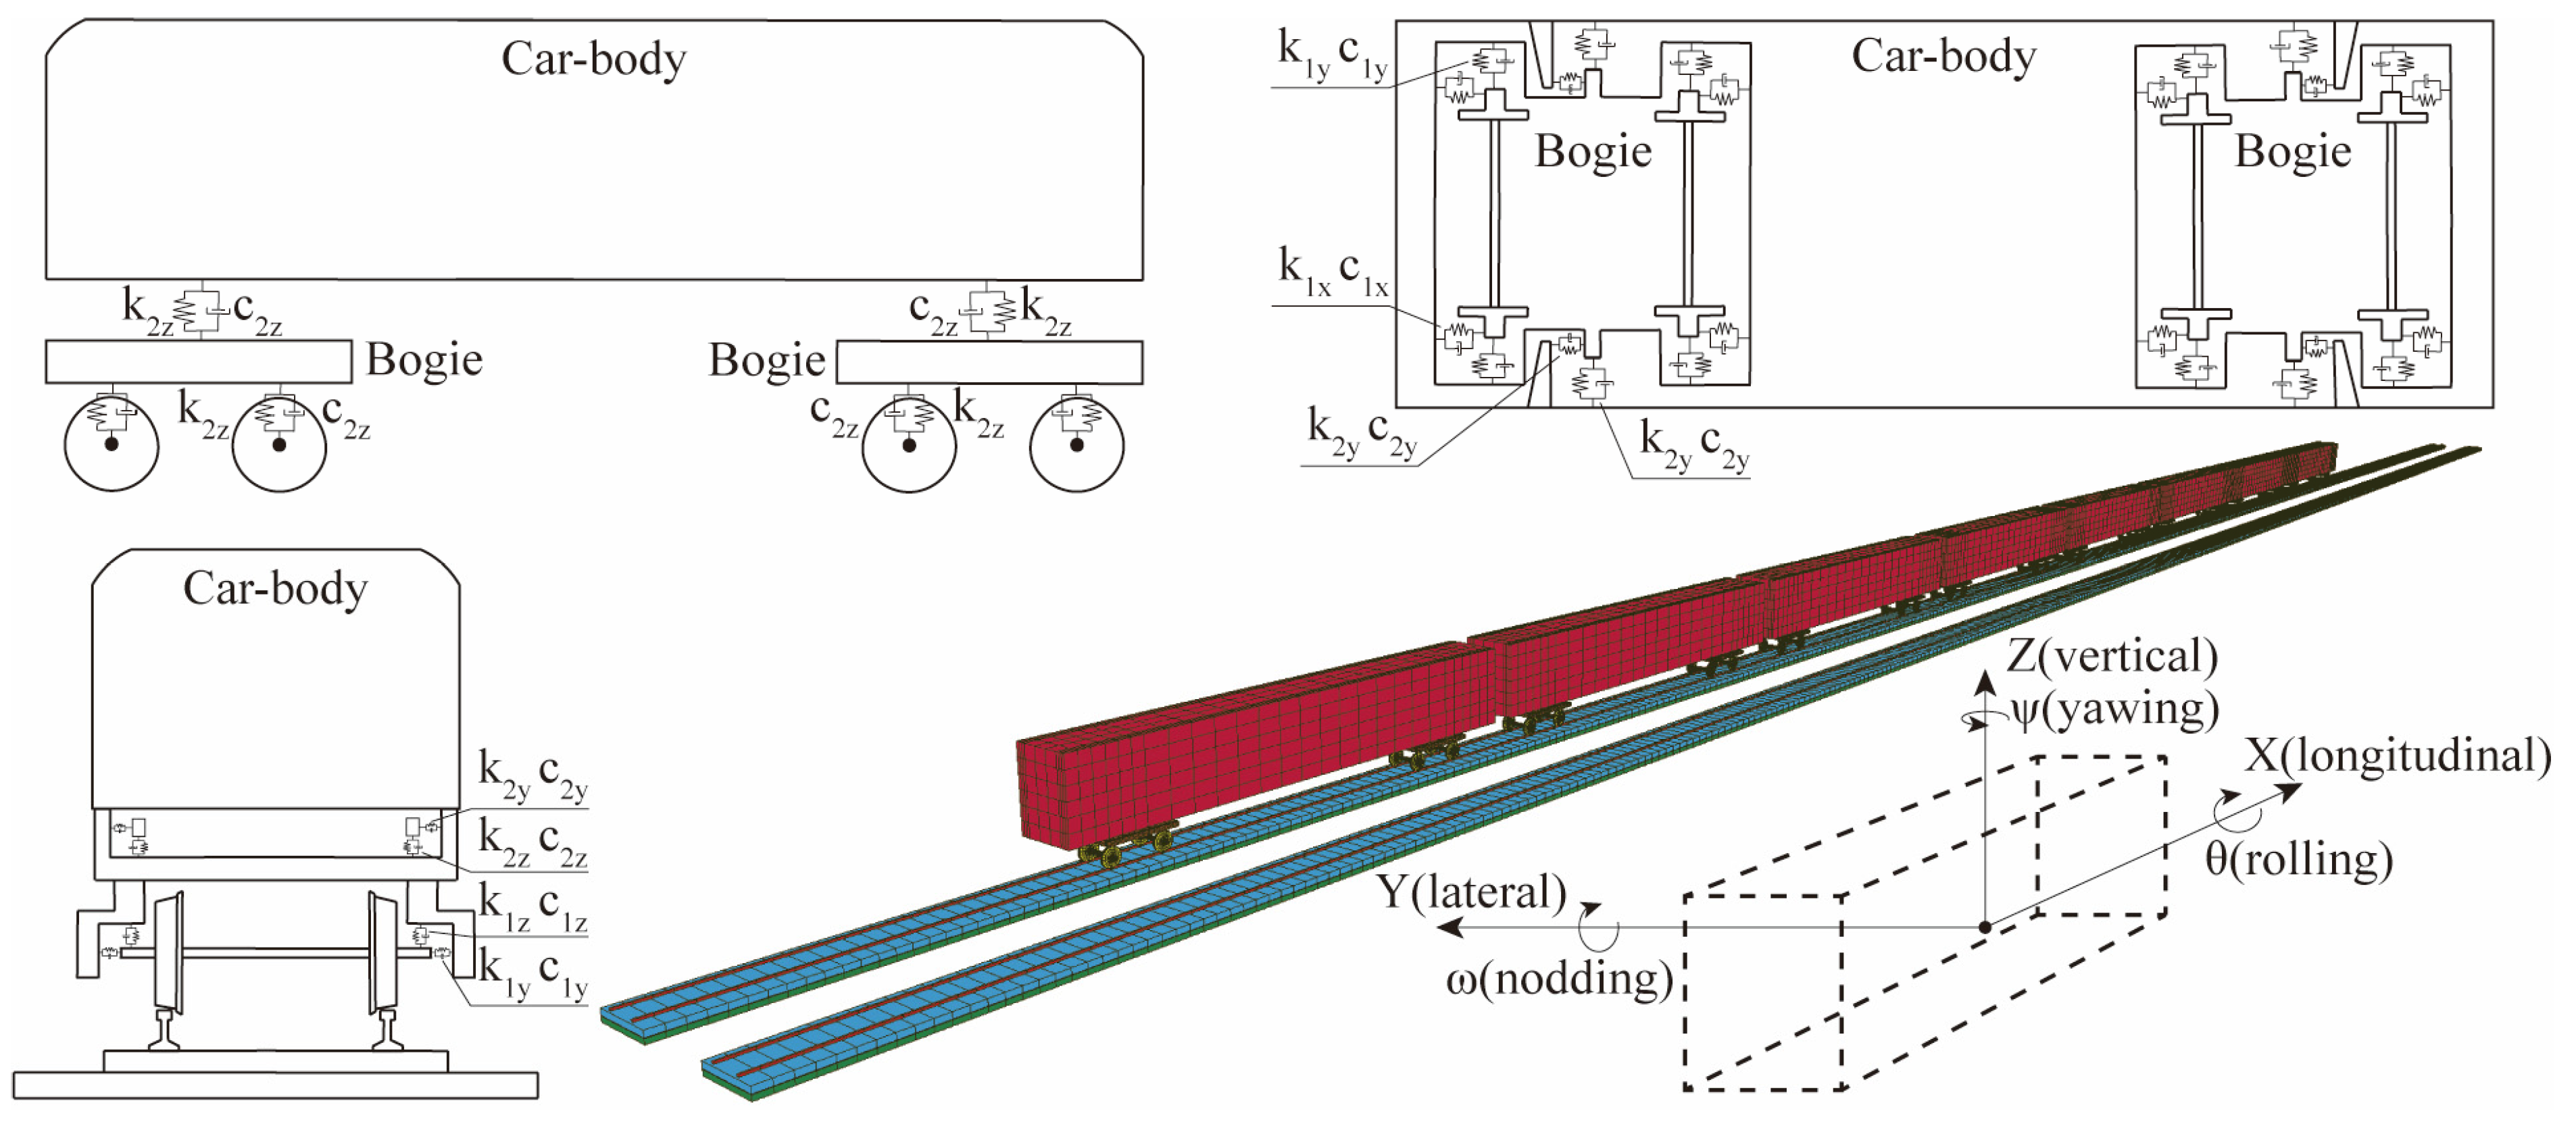
3.3. Train and Wheel–Rail Contact Model

The CRH2 high-speed train, comprising 8 carriages, is simulated using a mass-spring damping system with 31 degrees of freedom (DOFs) per carriage, including the lateral, floating, rolling, yawing, and nodding DOFs of the car-body and 2 bogies, as well as the lateral, vertical, and yawing DOFs of the 4 wheelsets. The car body is linked to the bogie through a secondary suspension system, while the bogie is connected to the wheelset through a primary suspension system. Indeed, the suspension system comprises both springs and dampers. In particular, the car body, bogies, and wheelsets can be considered rigid bodies and ignore the coupling effect between trains (as shown in Figure 4). Details of train parameters can be found in the work by Zhou [27]. The actual running speed of the train is 250 km/h.
Locomotive vehicles experience vibrations due to track irregularities and earthquakes, which are then transmitted to the track and bridge structures through the contact point between the wheels and rails. This creates a dynamic interaction process within the train–bridge system. In order to consider both the vertical and lateral wheel–rail contact and the nonlinear characteristics of wheel–rail contact state, the Hertz’s nonlinear theory [35] and the Kalker creep theory [36] are used to obtain the vertical contact stiffness of 1.325 × 10 9   N / m [37] and the lateral contact stiffness of 1.671 × 10 7   N / m [38].

3.4. Rail Irregularity

Track geometry irregularities serve as the primary source of excitation that alters the dynamic interaction between the wheels and rails, leading to coupled vibrations within the train–bridge system. This phenomenon represents a crucial factor that directly influences the safety and comfort of train operations. The presence of track irregularities directly affects the dynamic behavior of the wheel–rail system by impacting the geometry of the wheel–rail contact. German Low Disturb Track Spectra are chosen as the track irregularity [39]. Four groups of irregularities are considered for both the left and right rails, which include left vertical, right vertical, left lateral, and right lateral irregularities (as shown in Figure 5).

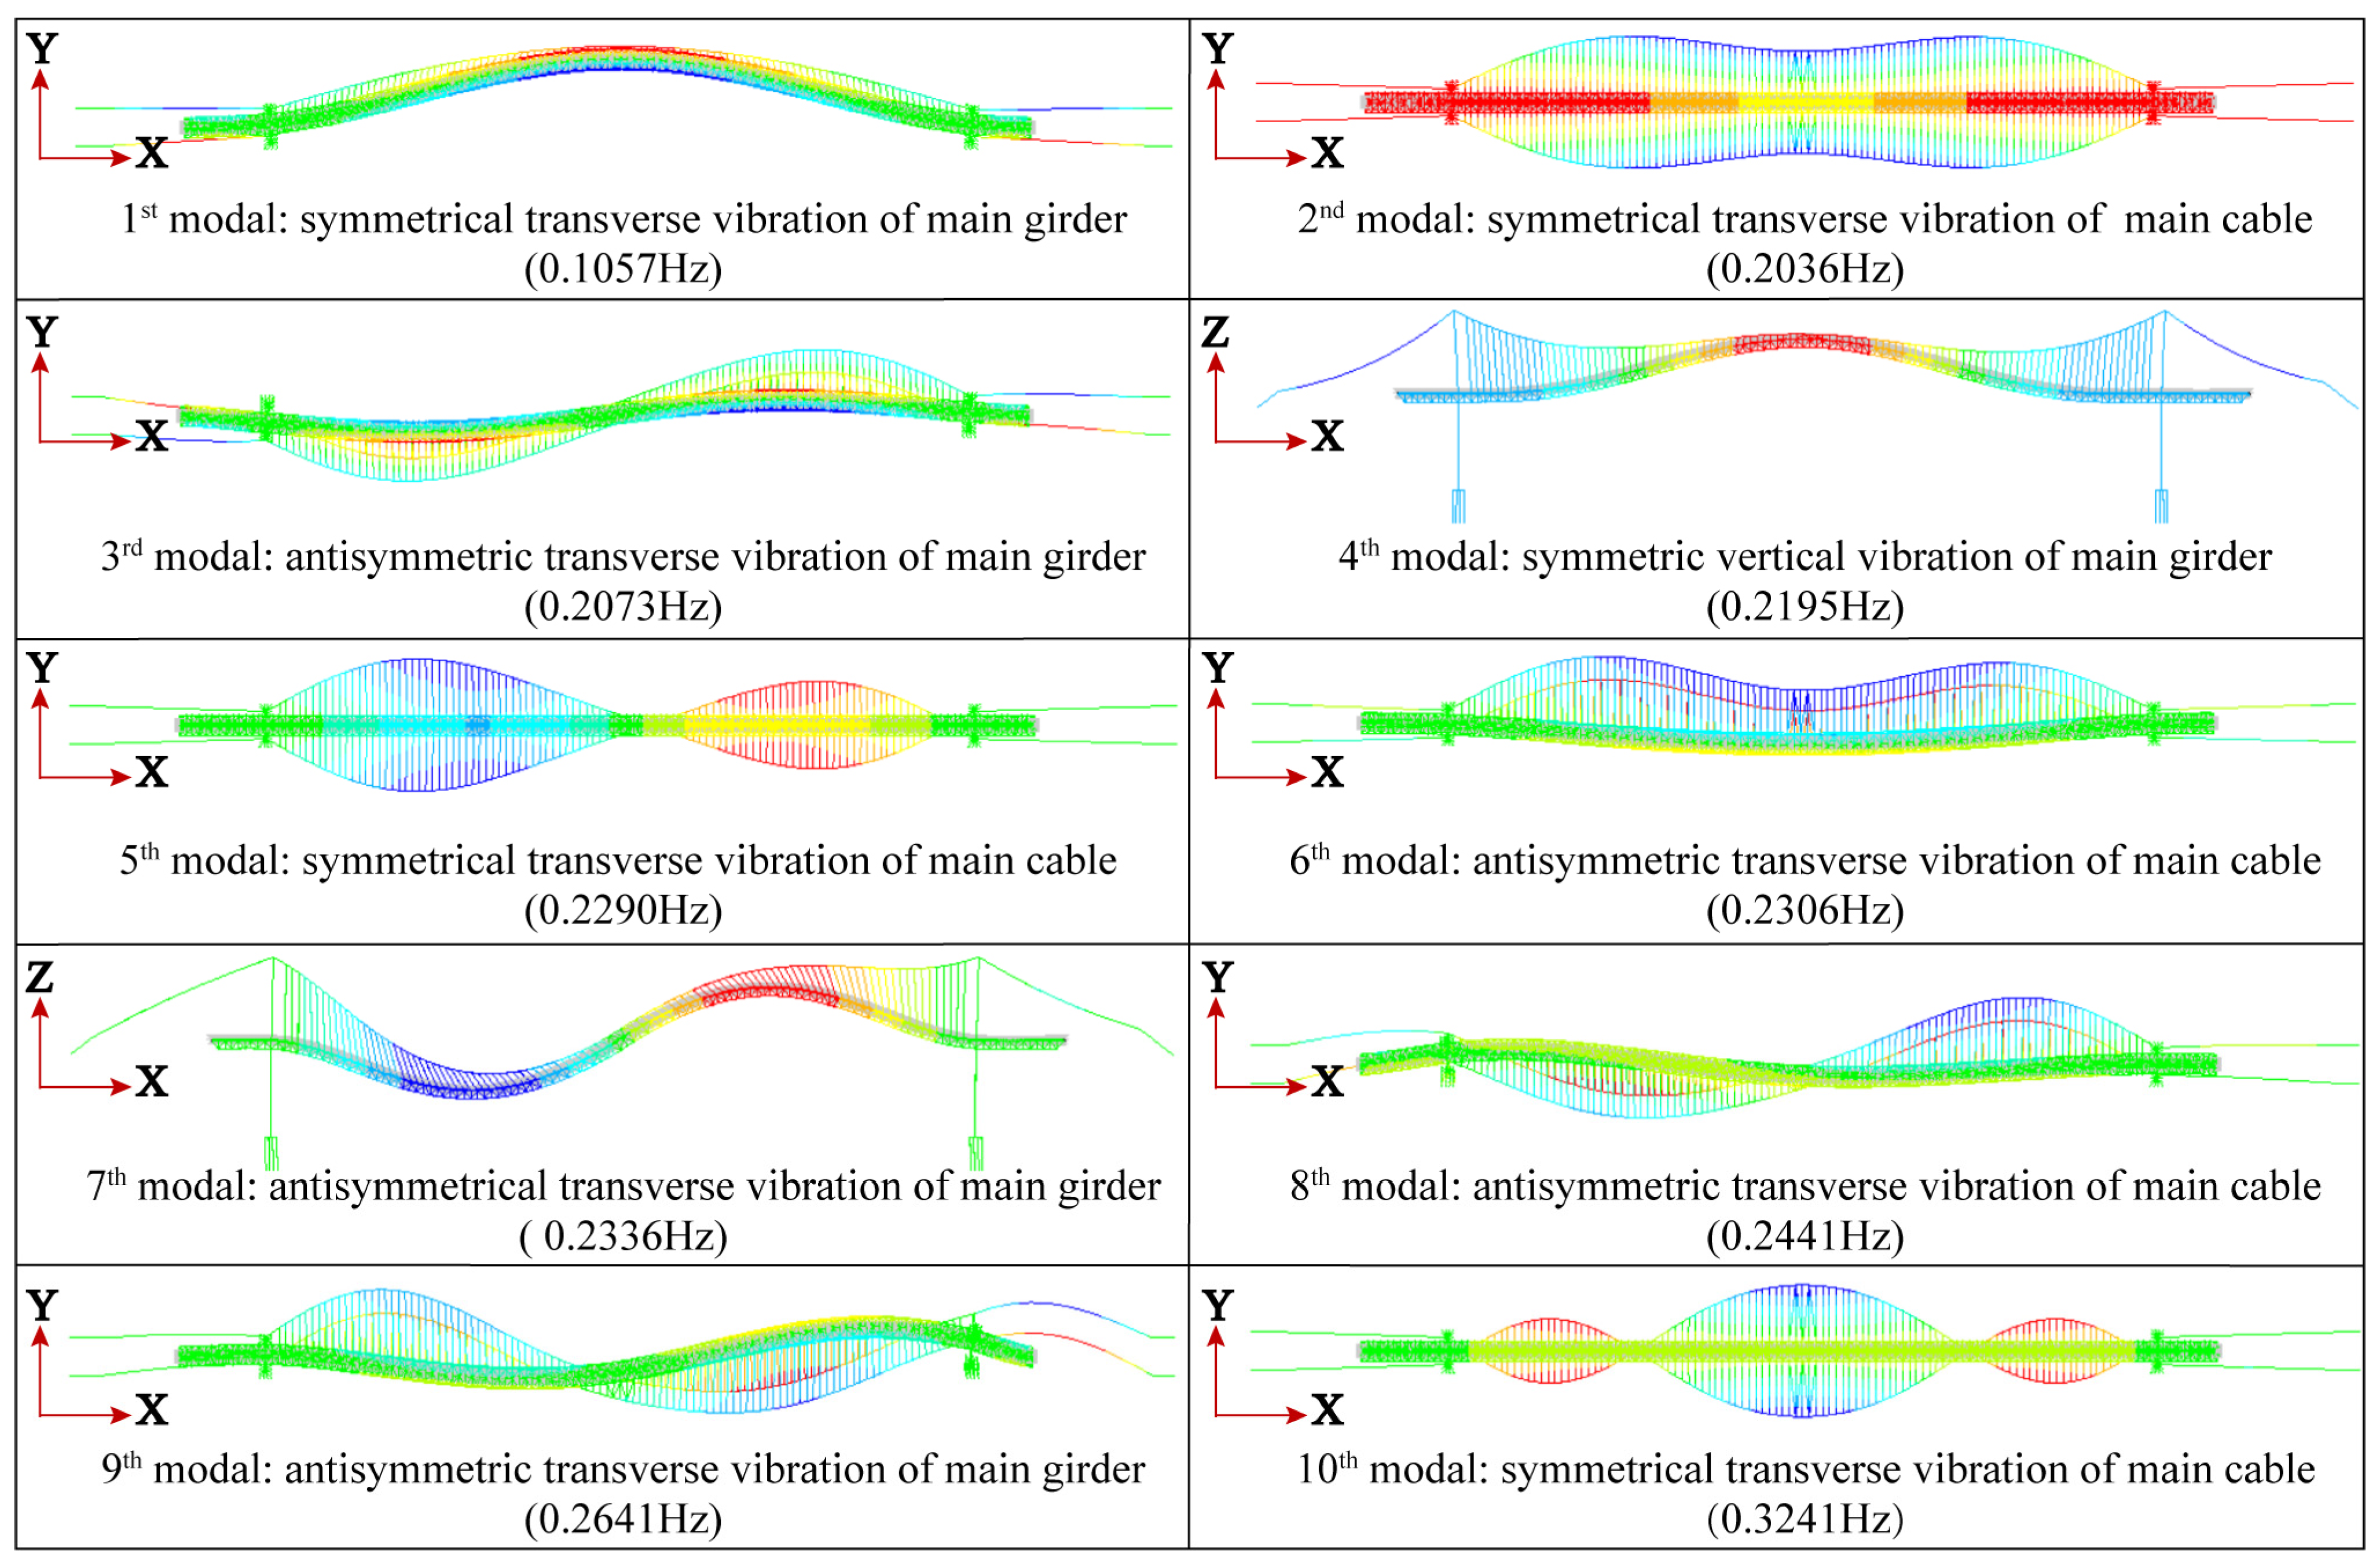
3.5. Vibration Characteristics

The bridge’s modal analysis is performed using the block-Lanczos method [40]. The first ten natural frequencies and their corresponding mode shapes are presented in Figure 6. It can be observed that most of these modes exhibit dominant transverse vibration of the main cable due to its smaller stiffness in the transverse direction. The first-order mode shows the symmetrical transverse vibration of the main girder, while the second-order mode shows the symmetric transverse vibration of the main cable. The third-order mode exhibits the antisymmetric transverse vibration of the main girder. Finally, the fifth- to tenth-order modes primarily involve cable vibration.

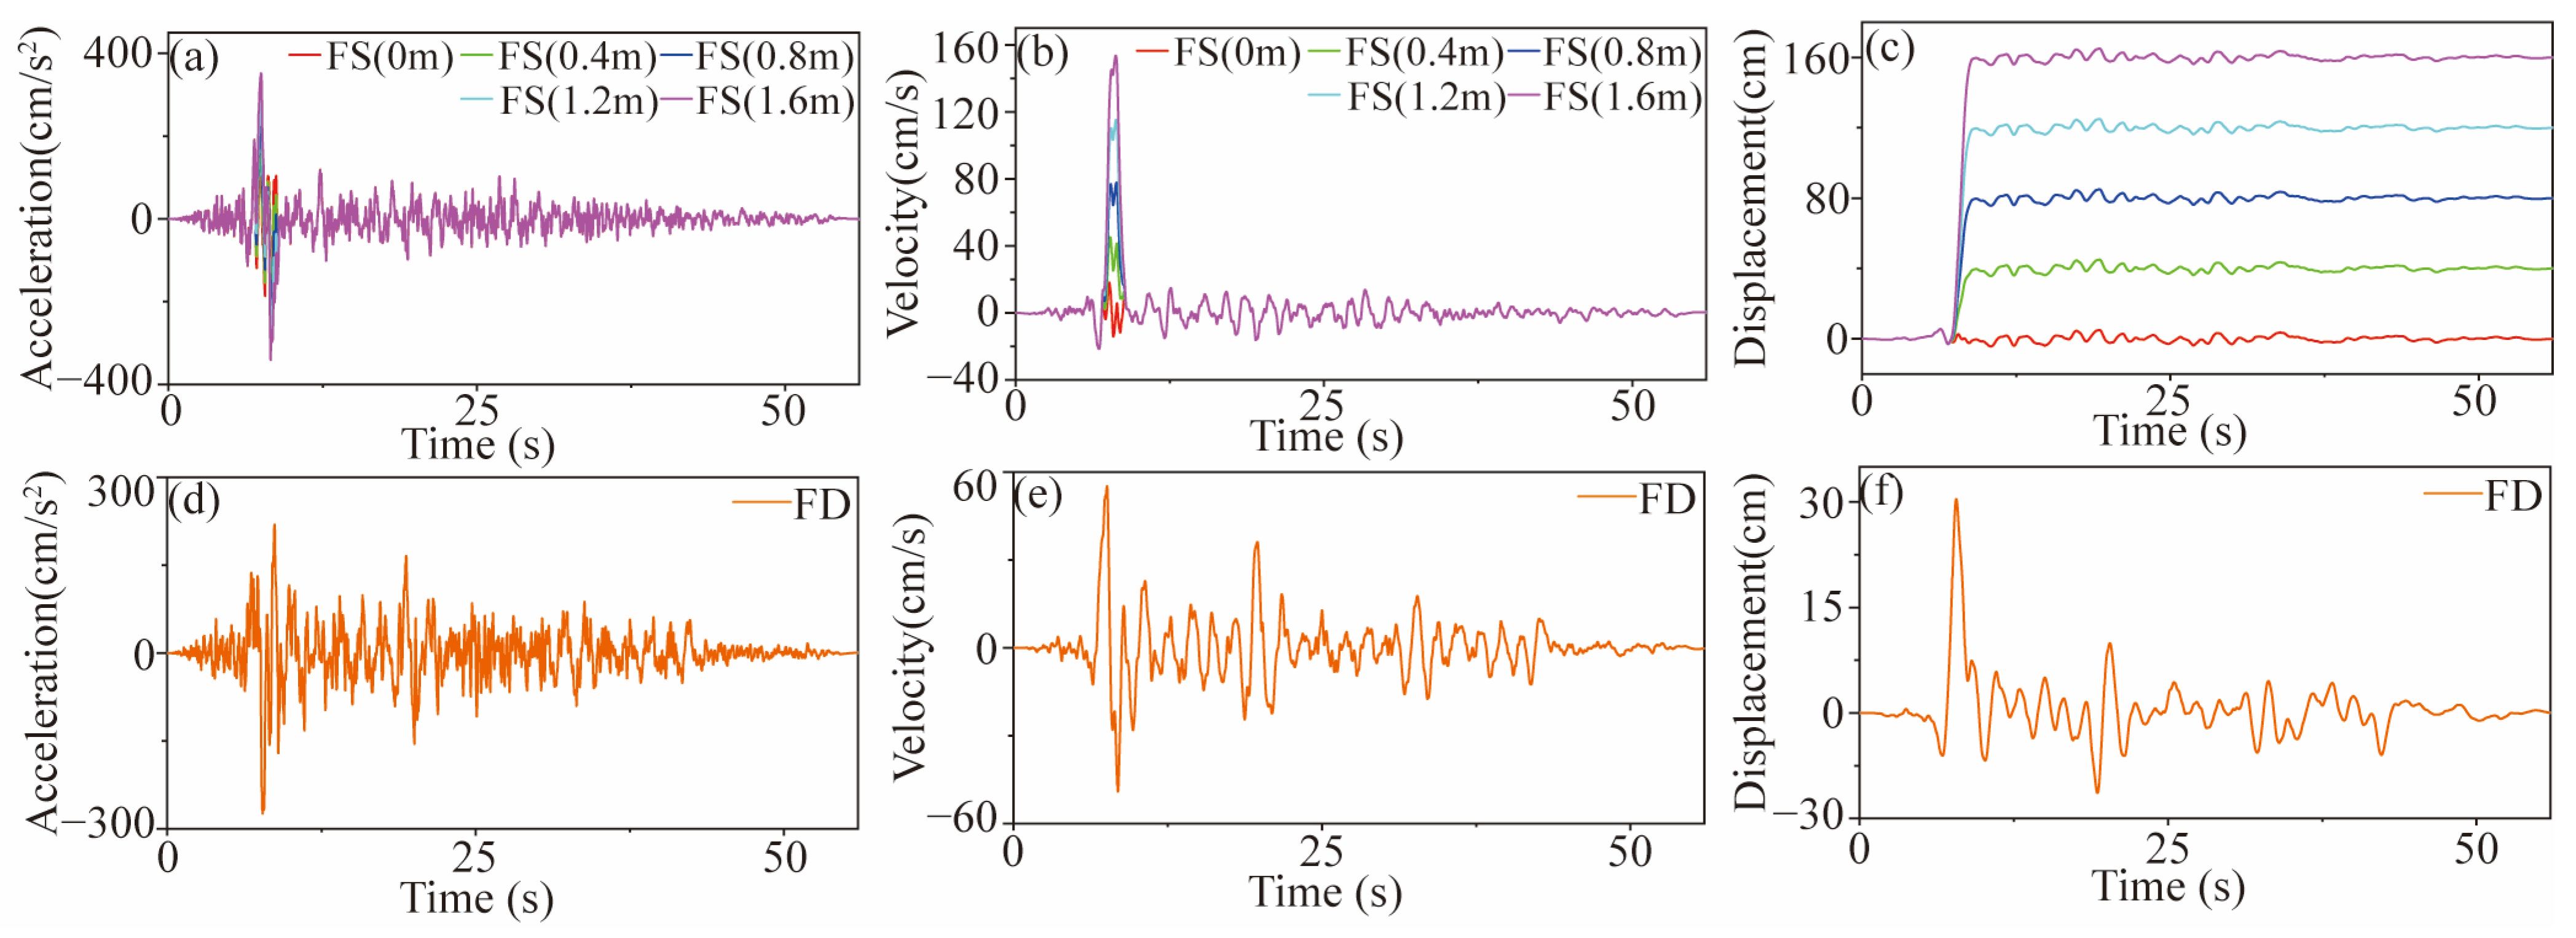
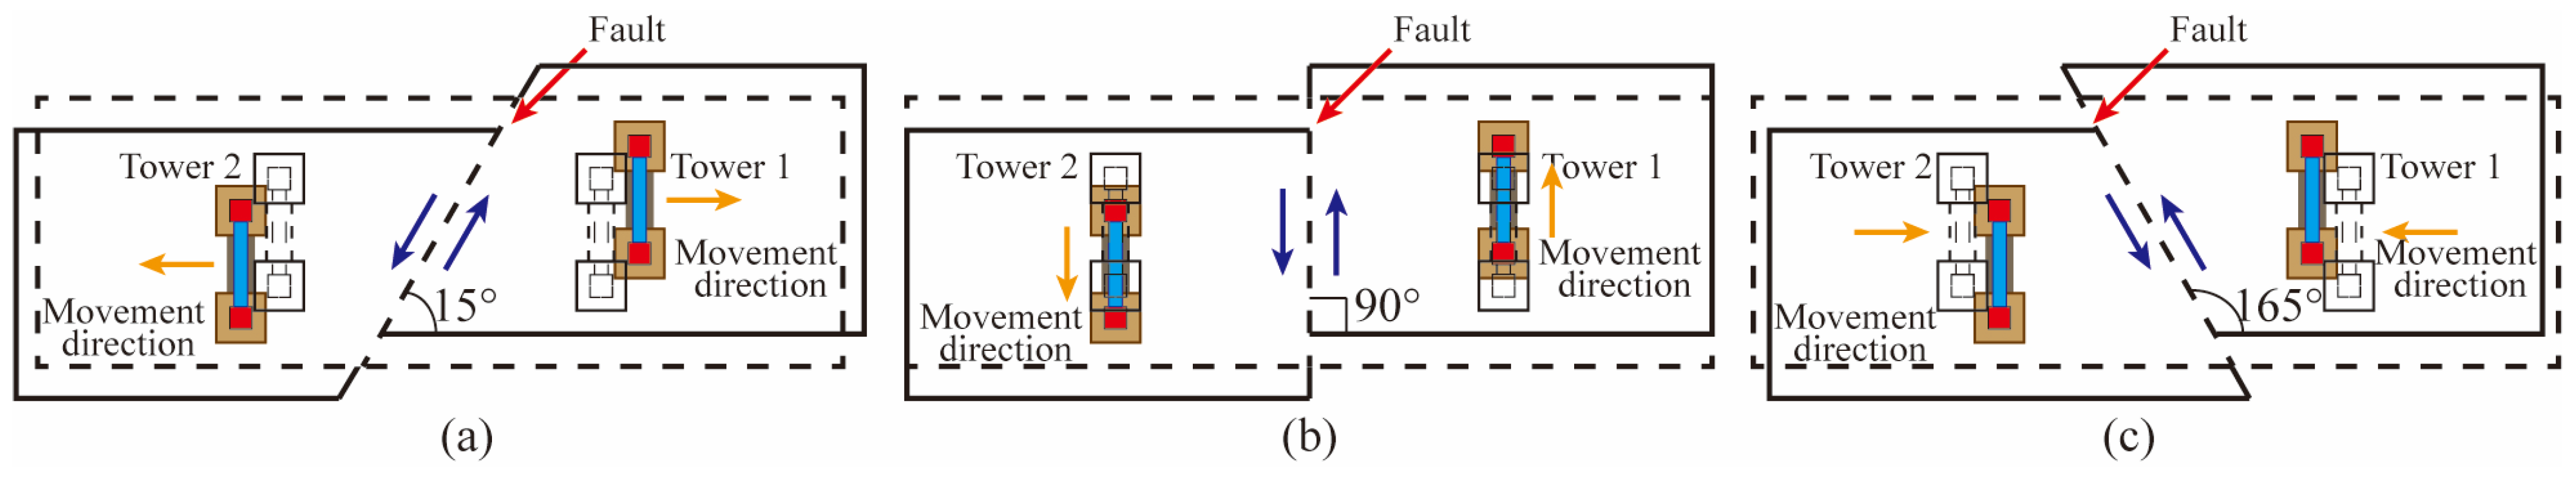
3.6. Generation of Ground Motions on Both Sides of a Strike–Slip Fault

ASSFGMs are pulse-type seismic motions caused by fling step and rupture directivity effects. For strike–slip fault, the fling step effect parallel to the fault direction and the rupture directivity effect perpendicular to the fault direction occur almost simultaneously and should be considered at the same time. This paper uses the pulse model proposed by Abrahamson [41] to simulate the low-frequency part and uses an artificial simulation method based on the phase difference spectrum to synthesize the high-frequency part. At the same time, the frequency domain method [42] is used to iteratively adjust the synthesized seismic amplitude. The ground motion across faults can be obtained by superimposing low-frequency components to high-frequency components, and the synthesized fling step effect pulse and directivity effect pulse are located in the parallel fault direction and perpendicular fault direction, respectively. A record from the Landers earthquakes in 1992, with a magnitude of 7.28 and the closest distance of 1.1 km from the surface rupture of the fault, was selected as the original near-fault ground motion for synthesizing cross-fault ground motions. Table 2 shows the records of the Landers earthquakes. Figure 7 illustrates the time histories of the synthetic ASSFGMs with different pulse characteristics.

4. Results and Discussion

The effect of FCAs, defined as an intersection angle between the bridge axial and fault strike–slip directions, is examined in this section. Additionally, the PGRDs are considered from 15°, 45°, 90°, 135°, and 160° and decomposed along these angles and input along the two orthogonal axes of the bridge.

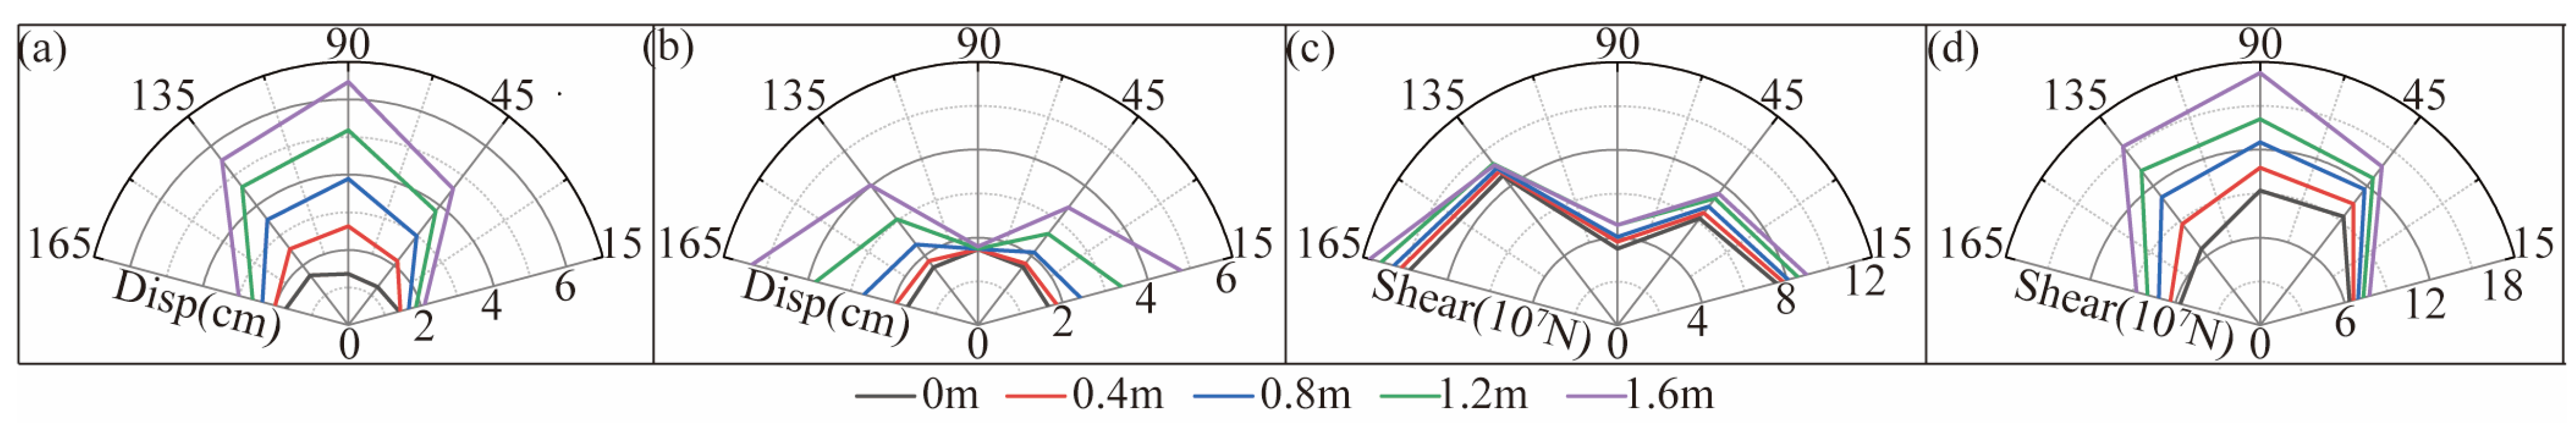
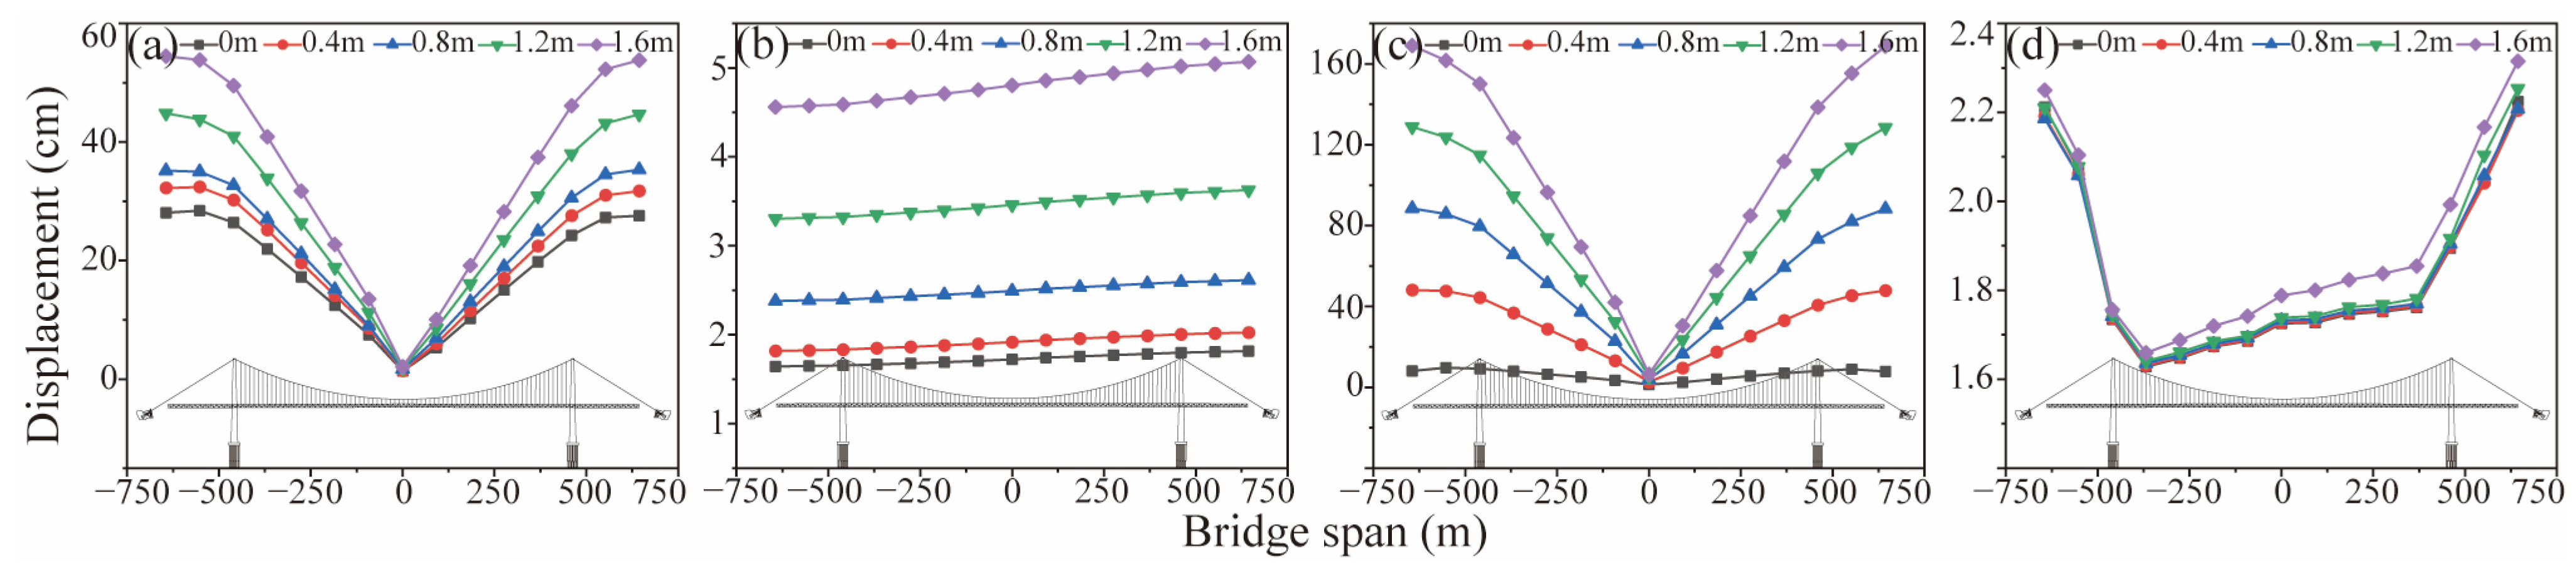
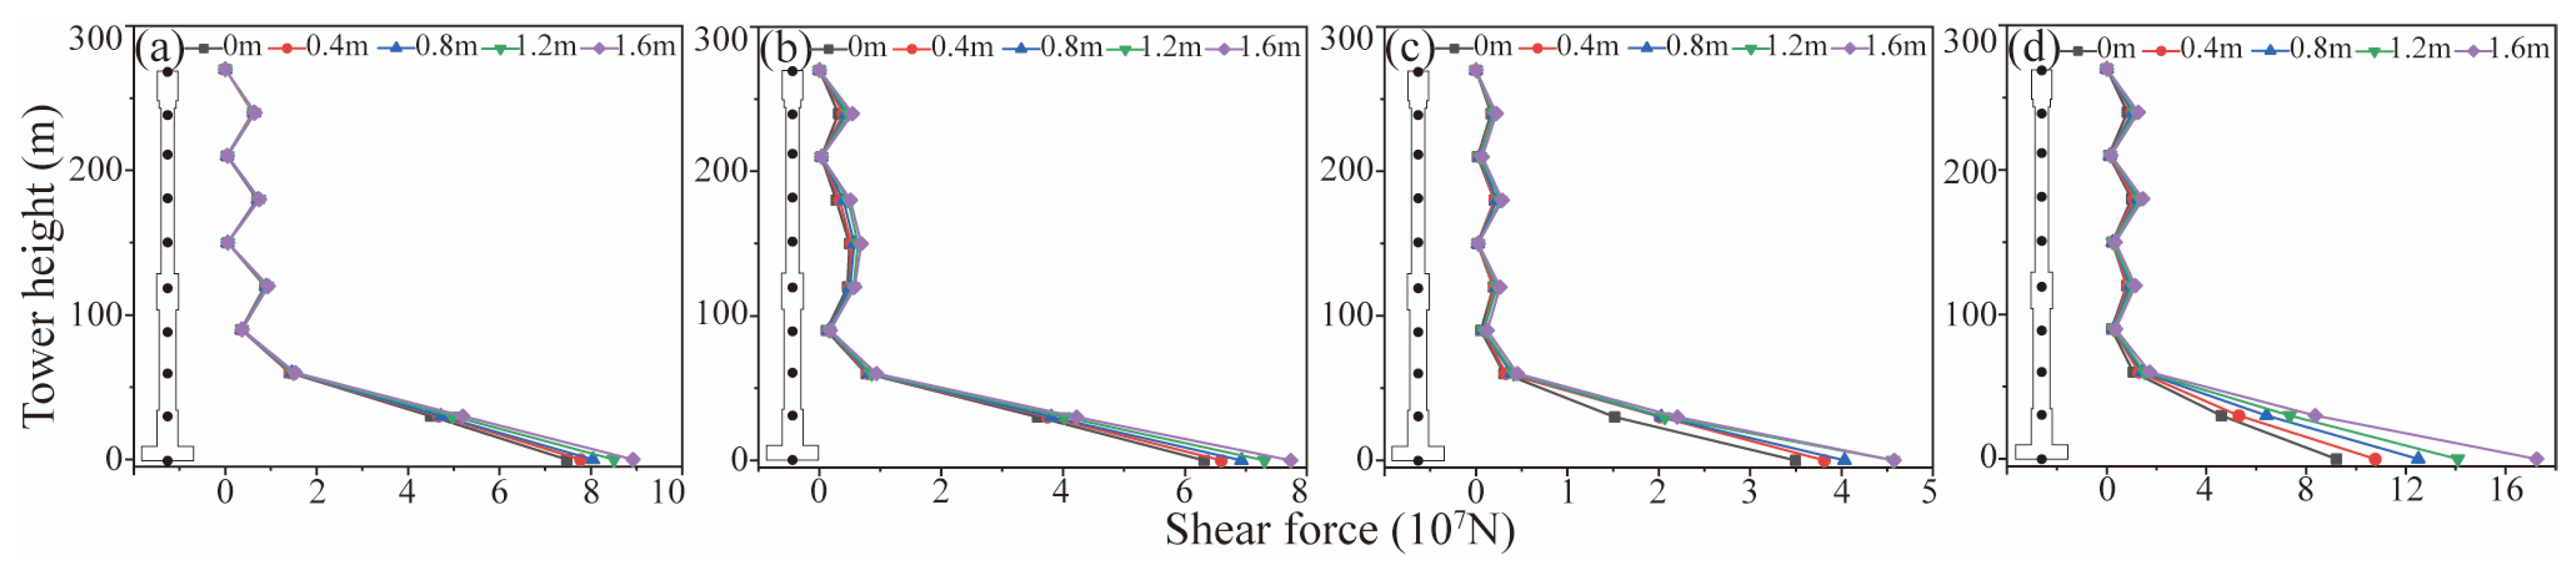
4.1. Dynamic Response of Bridge

Figure 8 displays the peak displacements in the middle of the span and shear force at the bottom of the tower with the variation of FCAs and PGRDs. As seen from each row view, the responses of interest vary with FCAs under different PGRDs. It should be noted that when FCA = 15°, the movements on both sides of the sinistral strike–slip fault plane cause the two towers to move backward along the direction of the bridge axis. Yet, when FCA = 165°, the opposite is found in the present study (as shown in Figure 9). Moreover, it is also very noteworthy that the peak response of the structure is almost symmetric in Figure 8, although the FCAs vary from 15° to 165° in a symmetrical way because of the symmetry of the examined suspension bridge.
In Figure 8a, it can be seen that the transverse displacements of the midspan increase as the FCA increases from 15° to 90° and decrease as the FCA increases from 90° to 165°. Yet, the vertical displacement has the opposite distribution in Figure 8b. A similar phenomenon is found in shear force at the bottom of the tower in Figure 8c,d. That is, there is a greater response in the transverse direction at 90°, while vertical displacement and longitudinal shear force are more sensitive at 15° and 165°.
The displacement response demands of the long-span suspension bridge subjected to strike–slip fault is comprehensively determined by these deformations of soil layers, pier deformation, tower, and girder. For instance, the deformations from three soil layers with a depth of 270 m and tower are responsible for the displacement responses on the top of the 2# tower on Chengdu Bank. Meanwhile, the maximum transverse displacement of the midspan and tower top does not occur at FCA = 90° but rather at FCA = 165° because of the asymmetry of the bridge structure and valley terrain and the characteristics of sinistral strike–slip fault.
As was found during recent major strong earthquakes, the PGRDs induced by sinistral strike–slip fault varied from tens of centimeters to several meters [4,43]. The faulting-induced dislocation, which affects the responses of fault-crossing bridges through the quasi-static term in the vibration equation of structures in nature, is a crucial factor in influencing the seismic behavior of bridges in the immediate vicinity of active seismic faults. Therefore, it is necessary to study the influence of PGRDs on the responses of long-span suspension railway bridges crossing faults. In addition, FCA = 15° and FCA = 90° are two extreme cases for fault-crossing bridges. To save space, these two extreme cases of FCA = 15° and FCA = 90° are considered herein to study the influence of PGRDs on the responses of long-span suspension railway bridge crossing faults.
As depicted in Figure 10a,c, the transverse displacement of the midspan barely changes with the increase in PGRD, which is attributed to the symmetry of the bridge. The transverse displacement on both sides of the midspan is more sensitive to the increase in PGRD. Particularly when vertically crossing the fault, the displacement at the edge span is almost equivalent to the size of the PGRD. As presented in Figure 10b,d, the vertical displacement of the girder is more sensitive to longitudinal ground motion and almost barely changes in transverse ground motion. Regarding the vertical displacement of the girder, it increases throughout the entire girder with the increment in PGRD. This can be attributed to the fact that longitudinal ground motion has a significant impact on the vertical displacement of the girder, and when the FCA = 15°, the ground motion acts as a longitudinal load.
As shown in Figure 11, when the PGRD increases, the longitudinal and transverse shear forces remain almost unchanged, indicating that the increase in PGRD has little effect on the internal forces of the tower. However, for the pier bottom, the increase in PGRD is still relatively sensitive. When FCA = 15°, as PGRD increases, the shear force increases by 20%, while when FCA = 90°, it increases by 88%.

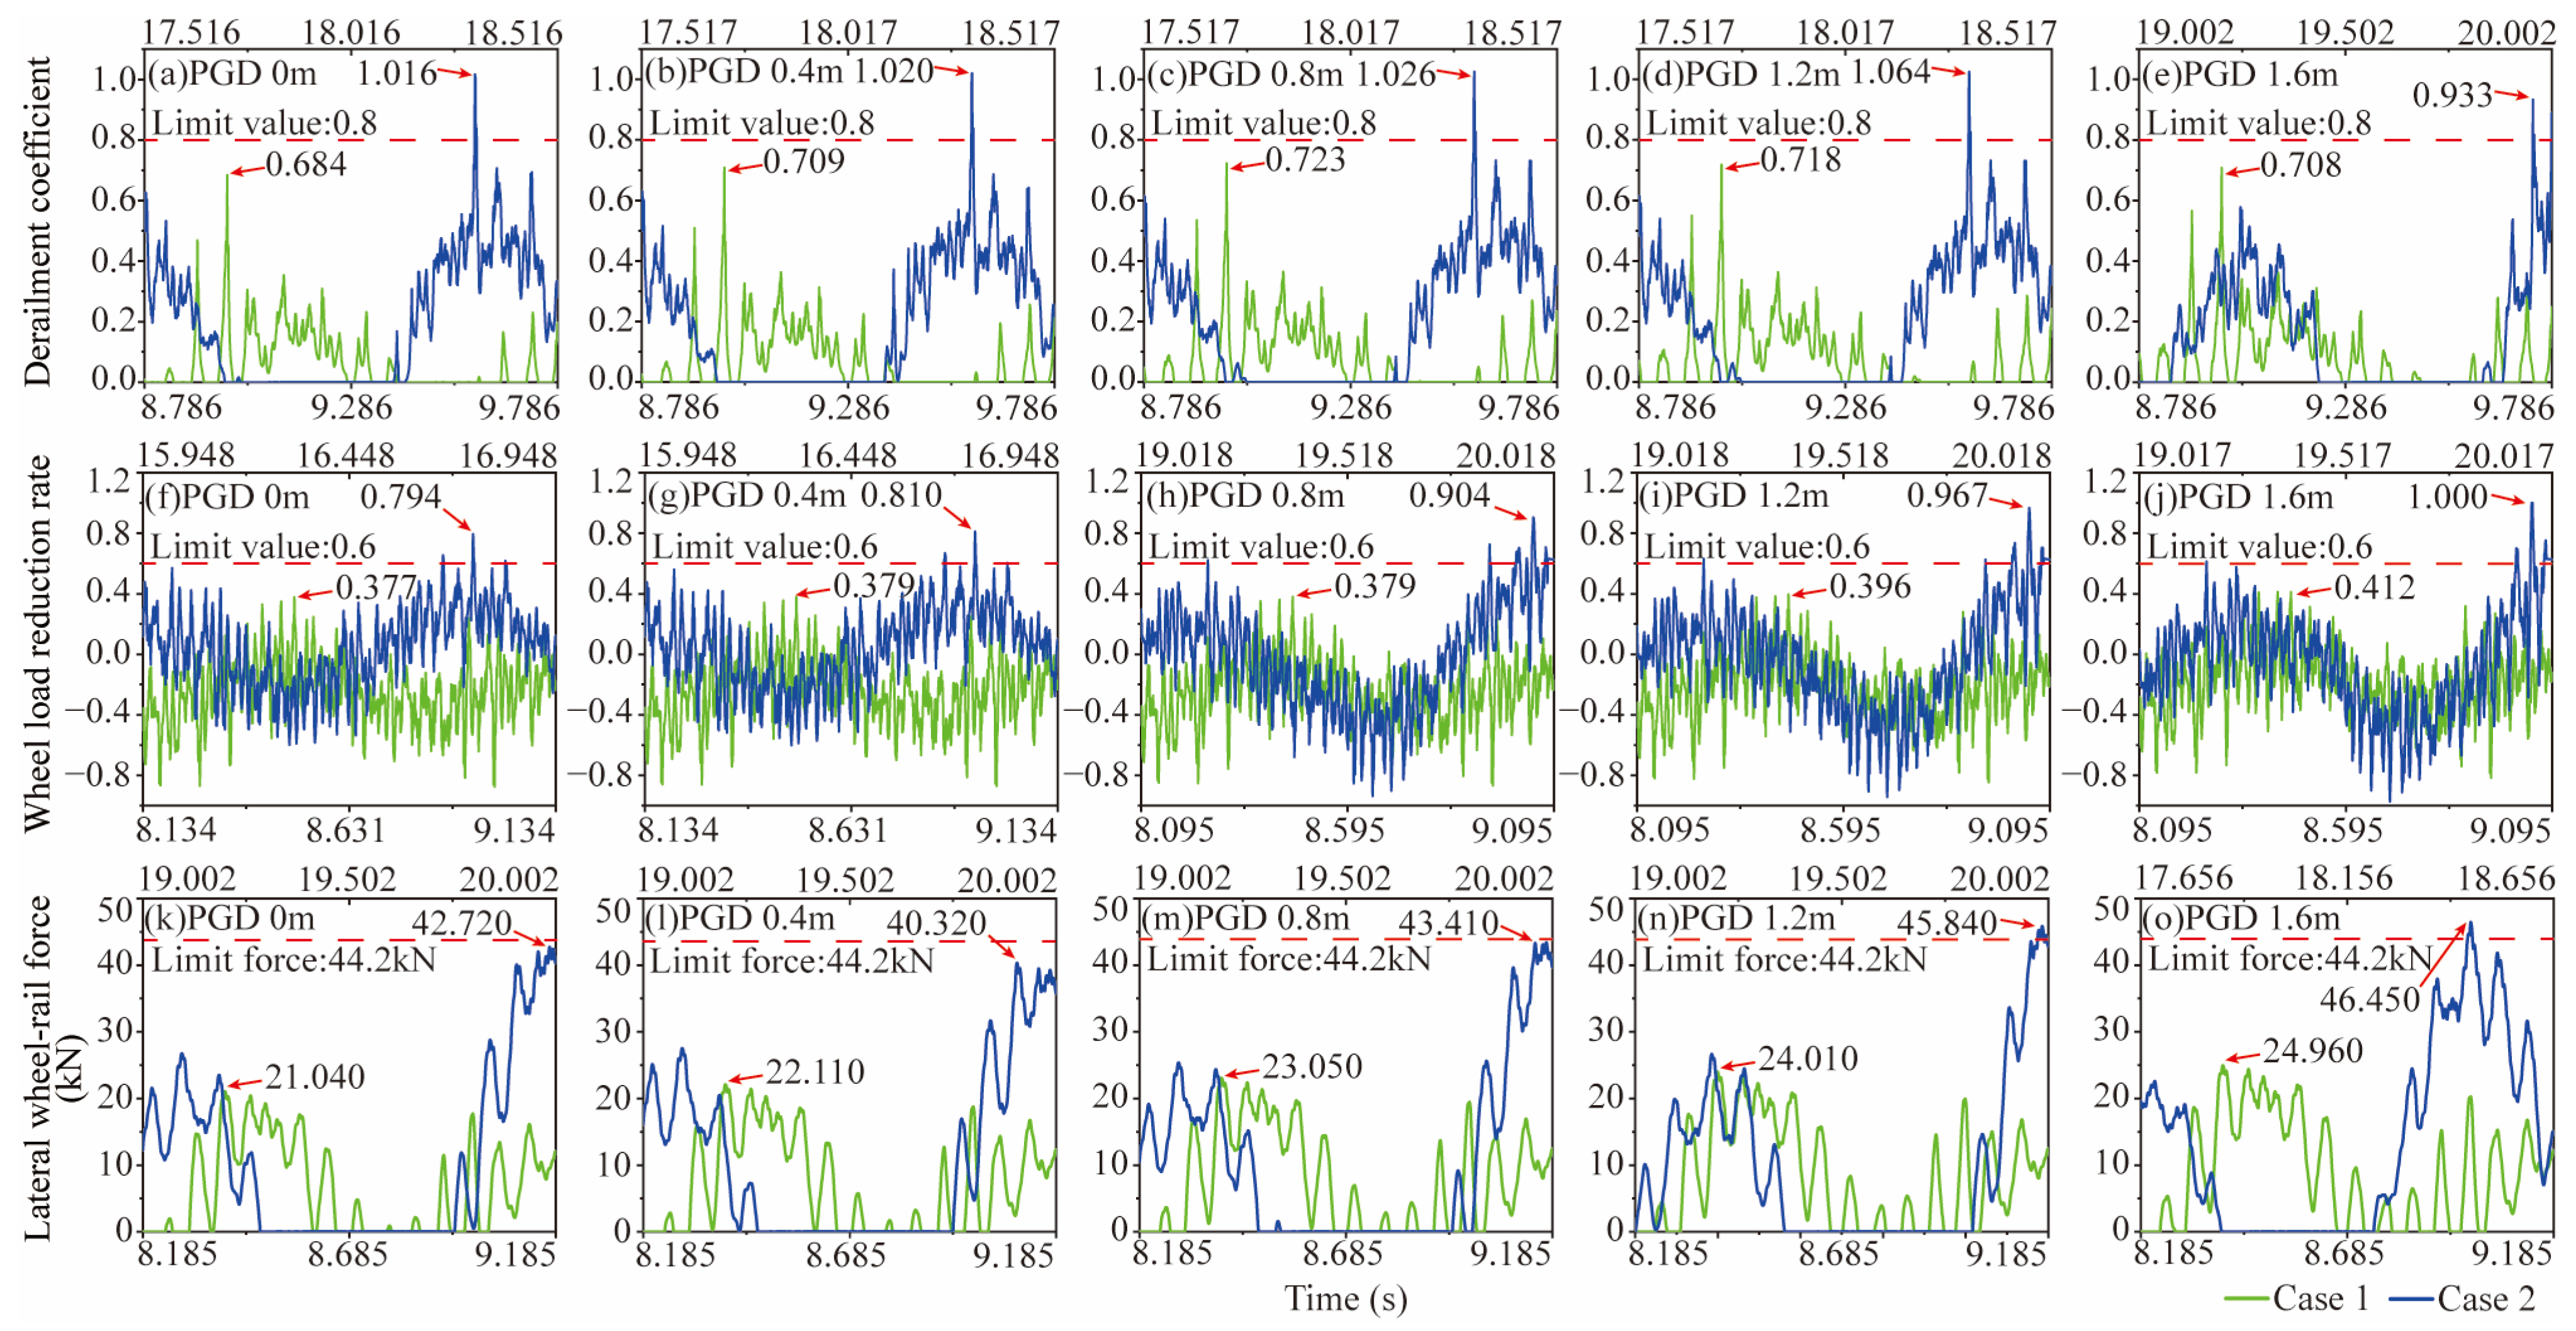
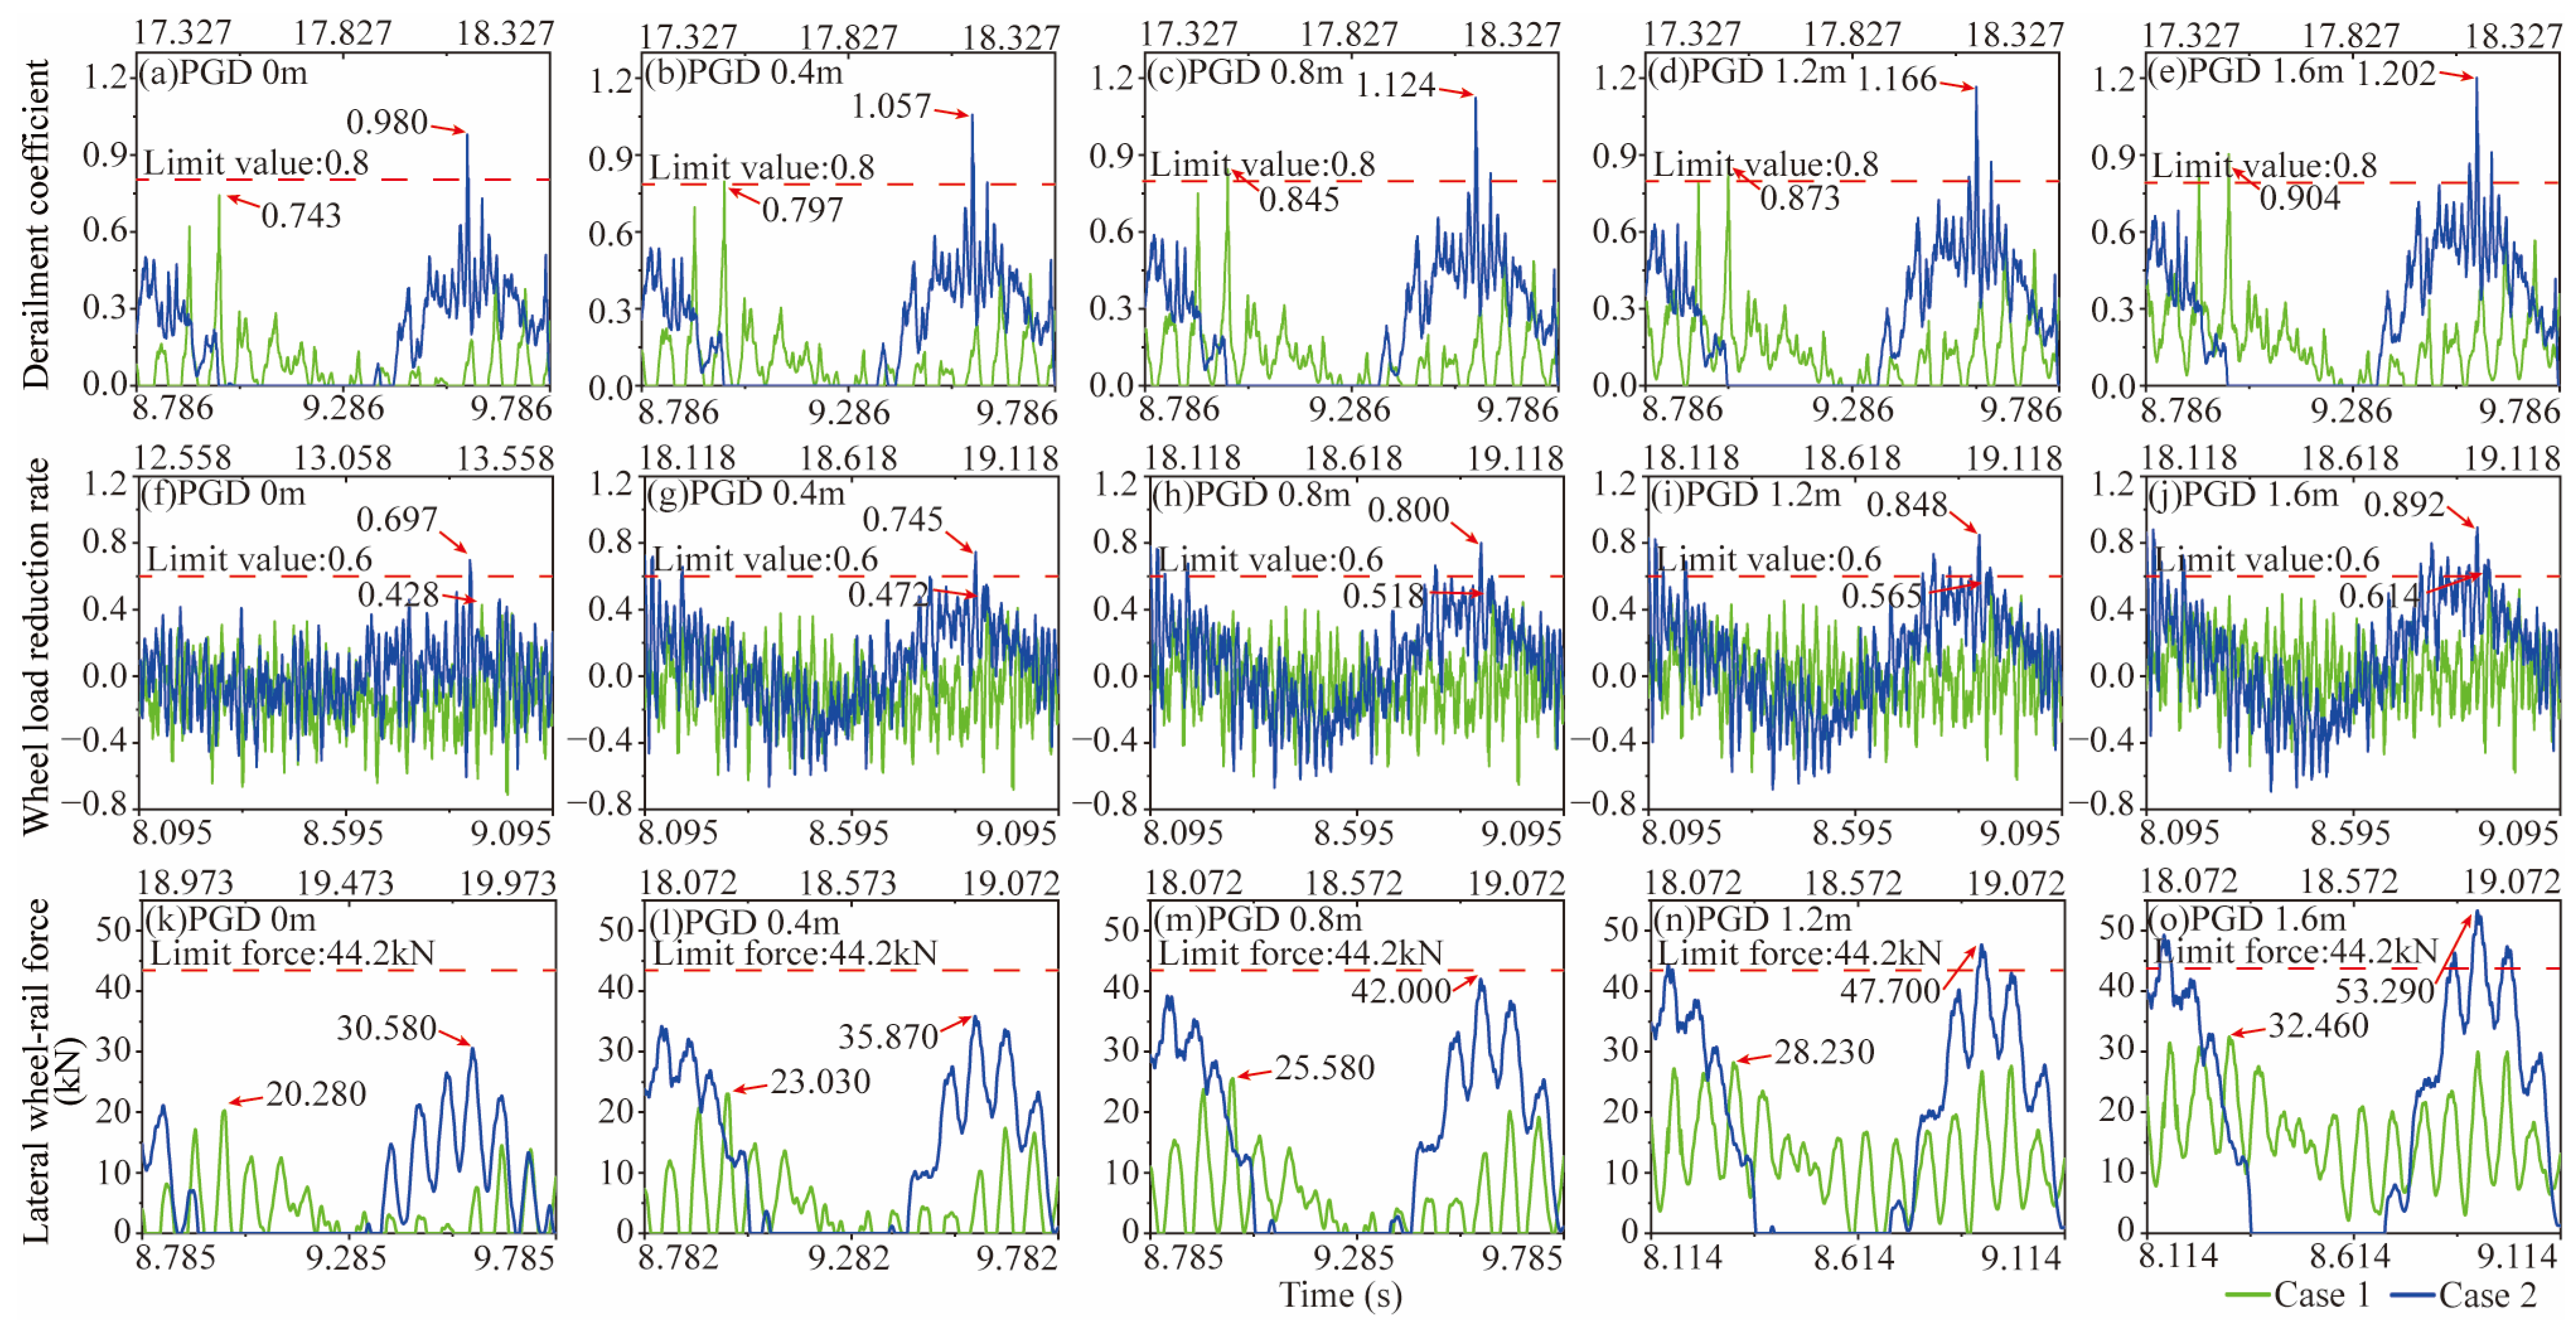
4.2. Dynamic Response of Train

Due to the nonlinear behavior of the wheel–rail contact and the randomness of seismic motion, coupled with the superposition of low-frequency pulse components and high-frequency impulsive components in fault seismic motion, the seismic random analysis of the train–bridge coupled system is highly complex. To unveil the correlation between the dynamic indicators of the train and FCAs and PGRDs, the assumption is made that the earthquake occurs simultaneously while the train is on the bridge. The scenario before the complete formation of PGRD is defined as case 1, while the scenario after the complete formation of PGRD is defined as case 2.
The Code for Design of High Speed Railways [44] and the High-Speed Test Train Power Car Strength Dynamic Performance Specifications [45] of China offer three indicators to assess responses of train wheel–rails: (1) the maximum lateral wheel–rail force Q , where Q 10 + P 0 / 3 and P 0 represents the static wheel load on the load-reduction side; (2) the derailment coefficient Q / P , where Q / P 0.8 and P denotes the maximum vertical force of the wheel–rail; (3) the wheel-load-reduction rate P / P m , where P / P m 0.6 , P refers to the reduction in wheel load on the load-reduction side, and P m stands for the average static wheel load. In this study, these indicators were employed to evaluate the running safety of the high-speed train.
When the FCA is 90°, the fling-step effect is primarily characterized by lateral excitation. In Figure 12, it is clear that lateral excitation is fatal to train derailment, and all three indicators show a positive correlation with the PGRD. When the bridge crosses the fault at a small angle, the fling-step effect is primarily characterized by longitudinal excitation. However, longitudinal excitation has a minimal impact on train derailment. Nevertheless, there is no clear tendency between the derailment coefficient and PGRD, which suggests the intricate nature of the train–bridge interaction.
During fault dislocation, the fault seismic motion is primarily dominated by low-frequency components, which control the internal forces and displacements of the bridge. Consequently, trains have the potential to pass safely during this phase. Figure 12 illustrates that when the bridge crosses the fault at a small angle, all three indicators (the dynamic indicators of the train) remain below the specified limit. This suggests that trains can safely traverse the bridge under such conditions. Similarly, when the bridge is oriented vertically across the fault, it is still safe for trains to pass as long as the PGRD does not exceed 0.4 m.
Due to space limitations, only representative scenarios of the bridge crossing the fault at a small angle (FCA = 15°) and vertically crossing the fault (FCA = 90°) are selected for the comparison of case 1 and case 2, as shown in Figure 13 and Figure 14. In Figure 13 and Figure 14, it can be observed that the PGRD generation phase (case 1) accounts for only 40% to 80% of the influence on the wheel–rail dynamic indicators. After the formation of PGRD (case 2), the train is simultaneously affected by additional track irregularities and the high-frequency components of fault seismic motion. This results in a 31% to 48% increase in the derailment coefficient, a 45% to 142% increase in the wheel load reduction rate, and a 50% to 103% increase in the lateral wheel–rail force. It is also noteworthy that case 1 occurs when the PGRD is about to be fully formed, while case 2 occurs when the train is about to exit the bridge. This indicates that the train’s dynamic indicators while traveling on large-span bridges are significantly reduced when the train passes through the bridge before the complete formation of PGRD. However, the wheel–rail contact is a dynamic accumulation process, and under the combined action of additional track irregularities caused by PGRD and high-frequency components of fault ground motion, the wheel–rail dynamic indicators will continue to increase. That is to say, if the train cannot leave the bridge before the PGRD is fully formed, the risk of derailment will significantly increase.

5. Conclusions

This study provides a better understanding of the train–bridge interaction of long-span railway suspension bridges subjected to strike–slip fault. This study presents a detailed discussion of a nonlinear model of wheel–rail contact based on ANSYS/LS-DYNA software. A refined finite element model of train–bridge coupling system was established based on the nonlinear finite element software of ANSYS/LS-DYNA. The findings of this study can provide guidance for the seismic design and train running of long-span railway suspension bridges crossing faults and help improve the safety and efficiency of the railway transportation system. Therefore, the following conclusions are drawn:
(1)
For long-span suspension bridges crossing left-lateral strike–slip faults, it is crucial to emphasize the substantial impact of the fling-step effect on PGRD, leading to amplified bridge responses. This effect is particularly pronounced in the transverse response at FCA = 90° and significantly influences the longitudinal response at lower FCA values. Consequently, PGRD plays a pivotal role in seismic bridge responses, with a direct correlation between the magnitude of the response and PGRD.
(2)
It is imperative to underscore the critical consequences of lateral seismic motion during fault dislocation, which profoundly affects the dynamic parameters of trains. In contrast, the influence of longitudinal seismic motion on the derailment coefficient is relatively minor. However, as seismic motion persists, longitudinal ground motion can lead to vertical displacements in the main beam, potentially causing the wheel-load-reduction rate to surpass permissible limits.
(3)
Within the context of strike–slip faults, it is worth noting that PGRD resulting from fault slips is predominantly governed by the low-frequency components of seismic waves, accounting for approximately 70% of its impact on train dynamic parameters. This underscores the necessity for trains to traverse large-span bridges before PGRD reaches its full formation to significantly mitigate dynamic indicators.
(4)
Continuing to emphasize the importance of timing, if trains persist in traversing the bridge after the complete formation of PGRD, they will encounter a compounded effect. This effect combines additional track irregularities induced by PGRD with the high-frequency components of seismic waves, resulting in a progressive escalation of dynamic parameters that may ultimately breach established safety limits.
It should be noted that the above conclusions are derived from the simulation analysis in this paper. The wheel–rail contact in the train–bridge system involves nonlinear dynamic behavior, and it is important to acknowledge that earthquakes are characterized by random vibrations. Seismic random analysis of the train–bridge coupled system is a highly complex issue. Therefore, additional numerical calculations and field experiments are necessary to provide further support for these conclusions.

Author Contributions

Conceptualization, S.C.; Software, S.C.; Validation, S.C.; Investigation, W.K., J.Y. and S.D.; Data curation, S.C.; Writing—original draft, S.C.; Writing—review and editing, H.J.; Funding acquisition, H.J. and S.Z. All authors have read and agreed to the published version of the manuscript.

Funding

The research for this paper was supported partially by the National Science Foundation of China (No. 52178169 and No. 2021YFB1600300), Science and Technology Plan of Sichuan Science and Technology Department (No. 2019YJ0243 and No. 2020YJ0081), and Major Systematic Projects of China Railway Corporation (No. P2018G007). The authors would like to express their sincere gratitude to all the sponsors for the financial support.

Institutional Review Board Statement

Not applicable.

Informed Consent Statement

Not applicable.

Data Availability Statement

The data is unavailable due to privacy.

Conflicts of Interest

The authors declare no conflict of interest.

References

  1. Yang, T.; Yuan, X.; Zhong, J.; Yuan, W. Near-fault pulse seismic ductility spectra for bridge columns based on machine learning. Soil Dyn. Earthq. Eng. 2023, 164, 107582. [Google Scholar] [CrossRef]
  2. Chen, X.; Xiang, N.; Li, J.; Guan, Z. Influence of near-fault pulse-like motion characteristics on seismic performance of tall pier bridges with fragility analysis. J. Earthq. Eng. 2020, 26, 2001–2022. [Google Scholar] [CrossRef]
  3. Ucak, A.; Mavroeidis, G.P.; Tsopelas, P. Behavior of a seismically isolated bridge crossing a fault rupture zone. Soil Dyn. Earthq. Eng. 2014, 57, 164–178. [Google Scholar] [CrossRef]
  4. Zhang, F.; Li, S.; Wang, J.; Zhang, J. Effects of fault rupture on seismic responses of fault-crossing simply-supported highway bridges. Eng. Struct. 2020, 206, 110104. [Google Scholar] [CrossRef]
  5. Gu, Y.; Guo, J.; Dang, X.; Yuan, W. Seismic performance of a cable-stayed bridge crossing strike-slip faults. Structures 2022, 35, 289–302. [Google Scholar] [CrossRef]
  6. Lin, Y.; Zong, Z.; Bi, K.; Hao, H.; Lin, J.; Chen, Y. Experimental and numerical studies of the seismic behavior of a steel-concrete composite rigid-frame bridge subjected to the surface rupture at a thrust fault. Eng. Struct. 2020, 205, 110105. [Google Scholar] [CrossRef]
  7. Yang, S.; Mavroeidis, G.P.; Tsopelas, P. Seismic response study of ordinary and isolated bridges crossing strike-slip fault rupture zones. Earthq. Eng. Struct. Dyn. 2021, 50, 2841–2862. [Google Scholar] [CrossRef]
  8. Cong, Z.E.; Hui, J.I.; Lei, H.U.; Hui, G.U.; Xin-yi, M.A.; Guang-song, S.O. Nonlinear seismic response characteristics of fault-crossing single-tower cable-stayed bridge. China J. Highw. Transp. 2021, 34, 230–245. [Google Scholar]
  9. Gong, W.; Zhu, Z.; Wang, K.; Yang, W.; Bai, Y.; Ren, J. A real-time co-simulation solution for train–track–bridge interaction. J. Vib. Control 2021, 27, 1606–1616. [Google Scholar] [CrossRef]
  10. Zhang, N.; Tian, Y.; Xia, H. A Train-Bridge Dynamic Interaction Analysis Method and Its Experimental Validation. Engineering 2016, 2, 528–536. [Google Scholar] [CrossRef]
  11. Jiang, L.; Peng, K.; Yu, J.; Zhou, W.; Zuo, Y. The influence of trains on the seismic response of simply-supported beam bridges with different pier heights expressed through an impact factor. Bull. Earthq. Eng. 2022, 20, 2795–2814. [Google Scholar] [CrossRef]
  12. Jin, Z.; Liu, W.; Pei, S. Probabilistic evaluation of railway vehicle’s safety on bridges under random earthquake and track irregularity excitations. Eng. Struct. 2022, 266, 114527. [Google Scholar] [CrossRef]
  13. Liu, X.; Jiang, L.; Xiang, P.; Jiang, L.; Lai, Z. Safety and comfort assessment of a train passing over an earthquake-damaged bridge based on a probability model. Struct. Infrastruct. Eng. 2023, 19, 525–536. [Google Scholar] [CrossRef]
  14. Hu, Z.; Wei, B.; Jiang, L.; Li, S.; Min, H. Track structural damage index for high-speed railway girder bridges considering residual deformations due to earthquake. Bull. Earthq. Eng. 2022, 20, 6587–6609. [Google Scholar] [CrossRef]
  15. Zeng, Z.P.; Zhao, Y.G.; Xu, W.T.; Yu, Z.W.; Chen, L.K.; Lou, P. Random vibration analysis of train–bridge under track irregularities and traveling seismic waves using train–slab track–bridge interaction model. J. Sound Vib. 2015, 342, 22–43. [Google Scholar] [CrossRef]
  16. Zhu, D.Y.; Zhang, Y.H.; Kennedy, D.; Williams, F.W. Stochastic vibration of the vehicle-bridge system subject to non-uniform ground motions. Veh. Syst. Dyn. 2014, 52, 410–428. [Google Scholar] [CrossRef]
  17. Zhang, N.; Xia, H.; De Roeck, G. Dynamic analysis of a train-bridge system under multi-support seismic excitations. J. Mech. Sci. Technol. 2010, 24, 2181–2188. [Google Scholar] [CrossRef]
  18. Xia, H.; Han, Y.; Zhang, N.; Guo, W. Dynamic analysis of train–bridge system subjected to non-uniform seismic excitations. Earthq. Eng. Struct. Dyn. 2006, 35, 1563–1579. [Google Scholar] [CrossRef]
  19. Gao, X.; Duan, P.; Qian, H. Dynamic Response Analysis of Long-Span Continuous Bridge Considering the Effect of Train Speeds and Earthquakes. Int. J. Struct. Stab. Dyn. 2020, 20, 2040013. [Google Scholar] [CrossRef]
  20. Wang, W.; Zhang, Y.; Ouyang, H. Influence of Random Multi-Point Seismic Excitations on the Safety Performance of a Train Running on a Long-Span Bridge. Int. J. Struct. Stab. Dyn. 2020, 20, 2050054. [Google Scholar] [CrossRef]
  21. Ma, C.; Choi, D. Stochastic dynamic analysis of the train-track-bridge system under tridirectional spatially correlated ground motions. Soil Dyn. Earthq. Eng. 2022, 160, 107324. [Google Scholar] [CrossRef]
  22. Gong, W.; Zhu, Z.; Liu, Y.; Liu, R.; Tang, Y.; Jiang, L. Running safety assessment of a train traversing a three-tower cable-stayed bridge under spatially varying ground motion. Railw. Eng. Sci. 2020, 28, 184–198. [Google Scholar] [CrossRef]
  23. Qiao, H.; Dai, Z.; Du, X.; Wang, C.; Long, P.; Jiao, C. Parametric study of topographic effect on train-bridge interaction of a continuous rigid frame bridge during earthquakes. Bull. Earthq. Eng. 2023, 21, 125–149. [Google Scholar] [CrossRef]
  24. Qiao, H.; Du, X.; Xia, H.; De Roeck, G.; Lombaert, G.; Long, P. The effect of local topography on the seismic response of a coupled train-bridge system. Struct. Eng. Mech. 2019, 69, 177–191. [Google Scholar]
  25. Chen, L.K.; Jiang, L.Z.; Qin, H.X.; Zhang, N.; Ling, L.; Zhang, Q.H.; Li, Q.; Cao, D.F. Nonlinear seismic assessment of isolated high-speed railway bridge subjected to near-fault earthquake scenarios. Struct. Infrastruct. Eng. 2019, 15, 1529–1547. [Google Scholar] [CrossRef]
  26. Chen, L.K.; Kurtulus, A.; Dong, Y.F.; Taciroglu, E.; Jiang, L.Z. Velocity pulse effects of near-fault earthquakes on a high-speed railway vehicle-ballastless track-benchmark bridge system. Veh. Syst. Dyn. 2022, 60, 2963–2987. [Google Scholar] [CrossRef]
  27. Zhou, T.; Jiang, L.; Xiang, P.; Liu, X. Effects of near-fault pulse-type ground motion on train–track–bridge coupled system with nonlinear supports. Nonlinear Dyn. 2023, 111, 6213–6238. [Google Scholar] [CrossRef]
  28. Yu, J.; Jiang, L.; Zhou, W.; Liu, X.; Lai, Z.; Feng, Y. Study on the dynamic response correction factor of a coupled high-speed train-track-bridge system under near-fault earthquakes. Mech. Based Des. Struct. Mach. 2022, 50, 3303–3321. [Google Scholar] [CrossRef]
  29. Jiang, H.; Zeng, C.; Peng, Q.; Li, X.; Ma, X.Y.; Song, G.S. Running safety and seismic optimization of a fault-crossing simply-supported girder bridge for high-speed railways based on a train-track-bridge coupling system. J. Cent. South Univ. 2022, 29, 2449–2466. [Google Scholar] [CrossRef]
  30. LS-DYNA. LS-DYNA Keyword User’s Manual; Livermore Software Technology Corporation: Livermore, CA, USA, 2021. [Google Scholar]
  31. Wanming, Z.; He, X. Train-Track-Bridge Dynamic Interaction: Theory and Engineering Appliction; Science Press: Beijing, China, 2011. [Google Scholar]
  32. Shen, Y.; Li, J.; Freddi, F.; Igarashi, A.; Zhou, J. Numerical investigation of transverse steel damper (TSD) seismic system for suspension bridges considering pounding between girder and towers. Soil Dyn. Earthq. Eng. 2022, 155, 107203. [Google Scholar] [CrossRef]
  33. Li, R.; Yuan, X.; Yuan, W.; Dang, X.; Shen, G. Seismic analysis of half-through steel truss arch bridge considering superstructure. Struct. Eng. Mech. 2016, 59, 387–401. [Google Scholar] [CrossRef]
  34. Ying, W.; Ouyang, Z.; Ke, J.; Han, T. Study on the eccentricity between the ballast track and supporting bridge under the action of moving trains. J. Railw. Sci. Eng. 2021, 18, 2552–2560. (In Chinese) [Google Scholar]
  35. Wang, W.; Zhang, Y.; Ouyang, H. An iterative method for solving the dynamic response of railway vehicle-track coupled systems based on prediction of wheel-rail forces. Eng. Struct. 2017, 151, 297–311. [Google Scholar] [CrossRef]
  36. De Pater, D.A.; Kalker, J.J. On the rolling contact of two elastic bodies in the presence of dry friction. Wear 1968, 11, 303. [Google Scholar]
  37. Lei, X.; Wang, J. Dynamic analysis of the train and slab track coupling system with finite elements in a moving frame of reference. J. Vib. Control 2014, 20, 1301–1317. [Google Scholar] [CrossRef]
  38. Cheng, Y.; Chen, C.; Hsu, C. Derailment and Dynamic Analysis of Tilting Railway Vehicles Moving Over Irregular Tracks Under Environment Forces. Int. J. Struct. Stab. Dyn. 2017, 17, 1750098. [Google Scholar] [CrossRef]
  39. ICE Technology Assignment for Inter-City Express Train; Munich Research Center of German Federal Railway: Heidelberg, Germany, 1993.
  40. Kim, H.M.; Craig, R.R., Jr. Application of unsymmetric block Lanczos vectors in system identification. J. Vib. Control 1992, 7, 227–241. [Google Scholar]
  41. Abrahamson, N.A. Velocity Pulses in Near-Fault Ground Motions. In Proceedings of the UC Berkeley—CUREE Symposium in Honor of Ray Clough and Joseph Penzien, Berkeley, CA, USA, 9–11 May 2002; UC Berkeley: Consortium of Universities for Research in Earthquake Engineering: Berkeley, CA, USA, 2002. [Google Scholar]
  42. Thráinsson, H.; Kiremidjian, A.S. Simulation of digital earthquake accelerograms using the inverse discrete Fourier transform. Earthq. Eng. Struct. Dyn. 2002, 31, 2023–2048. [Google Scholar] [CrossRef]
  43. Jia, H.; Lan, X.; Zheng, S.; Li, L.P.; Liu, C.Q. Assessment on required separation length between adjacent bridge segments to avoid pounding. Soil Dyn. Earthq. Eng. 2019, 120, 398–407. [Google Scholar] [CrossRef]
  44. TB10621-2014; Code for Design of High-Speed Railway. China Railway Press: Beijing, China, 2015. (In Chinese)
  45. 95J01-L; High-Speed Test Train Power Car Strength and Dynamic Performance Specifications. China Railway Press: Beijing, China, 2014. (In Chinese)
Figure 1. General schemata and details of ballasted railway suspension bridge: (a) Distribution of geological conditions and schematic view of Bridge, (b) Elevation of main tower, (c) Layout of stiffening girder, (d) Layout of ballasted railway, (e) Key sections of main tower (GMUP: Ground motion in the up direction; GMFN: Ground motion in the fault-normal direction).
Applsci 13 10422 g001
Figure 2. Ballasted track structure: (a) Transverse section of ballasted track, (b) Longitudinal section of ballasted track, (c) Transition zone.
Applsci 13 10422 g002
Figure 3. Finite element model of the bridge.
Applsci 13 10422 g003
Figure 4. Train and finite element model.
Applsci 13 10422 g004
Figure 5. Lateral and vertical track irregularity samples: (a) Lateral track irregularity of the left rail, (b) Lateral track irregularity of the right rail, (c) Vertical track irregularity of the left rail, (d) Vertical track irregularity of the right rail.
Applsci 13 10422 g005
Figure 6. Modal frequencies and mode shapes.
Applsci 13 10422 g006
Figure 7. Time history of synthetic cross-fault ground motions with different pulse characteristics: (ac) Fling-step effect with PGRDs of 0 m, 0.4 m, 0.8 m, 1.2 m, and 1.6 m, respectively; (df) Forward directivity effect. Note: FS and FD represent fling-step effect and forward directivity effect, respectively.
Applsci 13 10422 g007
Figure 8. Peak responses with different FCAs: (a) displacement of midspan in transverse direction; (b) displacement of midspan in vertical direction; (c) shear force of pier bottom in longitudinal direction; (d) shear force of pier bottom in transverse direction.
Applsci 13 10422 g008
Figure 9. Sketch of tower movement with different FCAs: (a) FCA = 15°, (b) FCA = 90°, (c) FCA = 165°.
Applsci 13 10422 g009
Figure 10. Peak displacement in girder: (a) transverse direction at FCA = 15°; (b) vertical direction at FCA = 15°; (c) transverse direction at FCA = 90°; (d) vertical direction at FCA = 90°.
Applsci 13 10422 g010
Figure 11. Peak shear force in tower: (a) longitudinal direction at FCA = 15°; (b) transverse direction at FCA = 15°; (c) longitudinal direction at FCA = 90°; (d) transverse direction at FCA = 90°.
Applsci 13 10422 g011
Figure 12. Peak wheel–rail responses with different FCAs and PGRDs in case 1: (a) derailment coefficient; (b) wheel-load-reduction rate; (c) lateral wheel–rail force.
Applsci 13 10422 g012
Figure 13. Time histories of wheel–rail responses at FCA = 15°: (ae) derailment coefficient; (fj) wheel-load-reduction rate; (ko) lateral wheel–rail force.
Applsci 13 10422 g013
Figure 14. Time histories of wheel–rail responses at FCA = 90°: (ae) derailment coefficient; (fj) wheel-load-reduction rate; (ko) lateral wheel–rail force (note: the time of occurrence is depicted on the lower horizontal axis for the peak value of case 1, while the time of occurrence is depicted on the upper horizontal axis for the peak value of case 2).
Applsci 13 10422 g014
Table 1. Material properties.
LS-DYNA ModelComponentParameterValue
* MAT_ELASTIC (MAT_001)Main girder/RailYoung’s modulus210 GPa
Poisson’s ratio0.3
Mass density7850 k g / m 3
Main towerYoung’s modulus34.5 GPa
Poisson’s ratio0.2
Mass density2420 k g / m 3
Cushion capYoung’s modulus33.5 GPa
Poisson’s ratio0.2
Mass density2410 k g / m 3
FoundationYoung’s modulus31.5 GPa
Poisson’s ratio0.2
Mass density2390 k g / m 3
* MAT_CABLE_DISCRETE_BEAM (MAT_071)Main cableYoung’s modulus200 GPa
Mass density8500 k g / m 3
SlingYoung’s modulus200 GPa
Mass density8400 k g / m 3
* MAT_LINEAR_ELASTIC_DISCRETE
_BEAM (MAT_066)
TrackTransversal stiffness of the fastener K p h 3 × 10 7   N / m
Transversal damper of the fastener C p h 6 × 10 4   N · S / m
Vertical stiffness of the fastener K p v 7.8 × 10 7   N / m
Vertical damper of the fastener C p v 5 × 10 4   N · S / m
Transversal stiffness of the sleeper-ballast K b h 3 × 10 7   N / m
Transversal damper of the sleeper-ballast C b h 6 × 10 4   N · S / m
Vertical stiffness of the sleeper-ballast K b v 1.2 × 10 7   N / m
Vertical damper of the sleeper-ballast C b v 7.5 × 10 4   N · S / m
Stiffness of adjacent ballast K w 7.8 × 10 7   N / m
Damper of adjacent ballast C w 8 × 10 4   N · S / m
Vertical stiffness of the ballast-bridge K f v 1.7 × 10 7   N / m
Vertical damper of the ballast-bridge C f v 3.1 × 10 4   N · S / m
Table 2. Actual near-fault ground-motion records.
LocationData M w StationRupture Distance (km)ComponentPGA (cm/s2)PGV (cm/s)PGD (cm)
Landers, CA, USA28 June 19927.2LUC1.1FN 206°702.564.864.5
FP 296°672.8141.4258.1
Disclaimer/Publisher’s Note: The statements, opinions and data contained in all publications are solely those of the individual author(s) and contributor(s) and not of MDPI and/or the editor(s). MDPI and/or the editor(s) disclaim responsibility for any injury to people or property resulting from any ideas, methods, instructions or products referred to in the content.

