Abstract
Chemical flooding, such as alkaline-surfactant (AS) or nanoparticles-surfactant (NS) flooding, is an enhanced oil recovery (EOR) technique that has been increasingly utilized to enhance the oil production rate and recovery factor while reducing chemical adsorption. The AS/NS flooding process involves the injection of a mixture of surfactant and alkali/nanoparticles solutions into an oil reservoir to reduce the interfacial tension between the oil and water phases by surfactant and lower surfactant adsorption by alkali or nanoparticles (NPs) to improve the residual oil recovery. In this study, the AS/NS flooding is evaluated for a Kazakhstani oilfield by systematically screening the chemical constituents involved. Field A in Kazakhstan, one of the oldest fields in the country, has been waterflooded for decades and has not produced even 50% of the original oil in place (OOIP). Currently, the water cut of the field is more than 90%, with a high residual oil saturation. Therefore, besides polymer flooding to control mobility, chemical EOR is proposed as a tertiary recovery method to mobilize residual oil. This study aimed to screen chemicals, including surfactant, alkali, and NPs, to design an effective AS/NS flooding program for the target field. The study focused on conducting laboratory experiments to identify the most effective surfactant and further optimize its performance by screening suitable alkaline and NPs based on their compatibility, stability, and adsorption behavior under reservoir conditions. The performance of the screened chemicals in the porous media was analyzed by a set of coreflood experiments. The findings of the study indicated that alkali agents, particularly sodium carbonate, positively affected surfactant performance by reducing its adsorption by 9–21%. The most effective surfactant combination was found, which gave Winsor type III microemulsion and the lowest interfacial tension (IFT) of 0.2 mN/m. The coreflood tests were conducted with the screened surfactant, alkali, and NPs. Both AS and NS tests demonstrated high residual oil recovery and microemulsion production. However, NS flooding performed better as the incremental oil recovery by NS flooding was 5% higher than standalone surfactant flooding and 9% higher than AS flooding. The results of this screening study helped in designing an efficient chemical formulation to improve the remaining oil recovery from Field A. The findings of this study can be used to design EOR projects for oil fields similar to Field A.
1. Introduction
Hydrocarbon extraction from reservoirs involves primary, secondary, and tertiary recovery stages. Enhanced oil recovery (EOR), the tertiary stage, employs several methods to recover trapped hydrocarbons from pores, such as thermal, chemical, miscible, mobility control, and microbial [1]. Parameters such as wettability, interfacial tension, fluid properties, and mobility control the performance of EOR methods [2,3]. Chemical EOR recovers the trapped oil droplets in pores by changing wettability, fluid properties, mobility ratio, and oil–water interfacial tension (IFT) parameters of reservoir rocks and fluids. For instance, the mobility-control EOR method such as polymer flooding aims to maintain and keep the favorable mobility ratio by which vertical sweep efficiency can be improved.
The surfactant flooding technique is directed to injecting chemicals to change the oil–water phase behavior, which reduces IFT between oil and water or, ideally, reaches the Winsor type III microemulsion with ultralow IFT and improves the reservoir fluid flow to the production well [4]. It improves the microscopic sweep efficiency in reservoir pores. The oil recovery performance of surfactants depends on several parameters such as concentration of chemicals, ionic composition of injection water, salinity, and temperature of the system [5,6]. Consequently, different Winsor type microemulsions form under different conditions of salinity [7]. The Winsor type I is typical for lower salinity systems where most of the chemicals stay in the water phase, therefore IFT reduction is not considerable. The Winsor type II is typical for higher salinity systems where chemicals have higher affinity for the oil phase and IFT can be reduced, but not to the ultralow values. The Winsor type III microemulsion is the three-phase system where oil and water molecules can co-exist as a middle phase by surfactant action. In the middle phase, the IFT between oil and water reaches ultralow values and is usually typical for moderate salinity systems. Hence this type of microemulsion is favorable during surfactant flooding [6,8].
Surfactant flooding is not a new chemical EOR application. Historically, the first surfactant usage for oil recovery was dated in the 1920s when there was not enough information about chemicals and their impact on the petroleum industry. In the 1960s, surfactants started to be investigated, and in 1968 micellar flood, which consists of petroleum sulfonate based on surfactant mixed with oil and water, was reported, named microemulsion. Later, numerous studies were performed to investigate surfactants for EOR. These studies demonstrated surfactants’ ability to reduce IFT between oil and water and even reach ultra-low IFT, which improves microscopic sweep efficiency [9,10]. However, as with other production methods, surfactant flooding has complications, such as chemical loss by adsorption and/or precipitation in the reservoir and phase trapping [1,8]. These mechanisms may affect the surfactant flooding process and the performance of the surfactant to recover oil. If the adsorption is high, injecting only surfactant is not economically feasible since the chemical molecules will be adsorbed, and less will be available to form the microemulsion [11,12].
Several models are available in the literature to estimate surfactant adsorption on rock surface. Park et al. used the Langmuir Isotherm model and Freundlich models to select a surfactant with lower adsorption density [13]. In the Langmuir Isotherm equation, surfactant adsorption on rock surface is considered as a monolayer process whereas the Freundlich model is used to describe multilayer, reversible adsorption process. In another study, Ahmadi and Shadizadeh compared Langmuir, Freundlich, and Linear adsorption models to determine the static and dynamic adsorption of a natural surfactant on a shale-sand rock surface [14]. The results showed a better prediction of adsorption equilibrium with the Freundlich model over a wide surfactant concentration range. The Linear Isotherm model provided acceptable results for surfactant concentrations less than 2 wt%.
Alkaline-surfactant (AS) flooding was developed in the 1980s by Shell to overcome the problems of standalone surfactant flooding [4]. The main advantage of AS flooding is the combination of the working mechanisms of each chemical. Specifically, reduced IFT and lower surfactant adsorption are the primary governing parameters for incremental oil recovery by AS flooding [15,16]. Alkali is a high-pH chemical which can form in situ surfactants in contact with oil’s saponifiable components [1,3]. Sodium hydroxide (NaOH) and sodium carbonate (Na2CO3) are the most effective alkalis for chemical EOR [17,18]. For in situ surfactant formation, the oil’s total acid number (TAN) is an important parameter to be assessed prior to commencing alkali flooding. According to Ehrlich and Wygal [19], the TAN should exceed 0.1–0.2 mg KOH per gram of oil to facilitate an effective emulsification recovery mechanism during alkali flooding. However, recent findings by Sagyndikov et al. [20] demonstrate successful ASP applications in fields with even lower TAN, such as the West Salym field in Russia (0.04 mg KOH/g) and the Daqing field in China (0.02 mg KOH/g).
Guo et al. [21] also indicated that even in cases of low TAN, a synergistic effect between the injected synthetic surfactants and the in situ surfactants leads to an ultra-low interfacial tension [22]. Additionally, injecting alkali into reservoirs with low TAN is beneficial as alkali helps reduce surfactant adsorption [23]. The adsorption reduction happens because of the increasing pH level of the system. A higher pH increases the negative charge of the reservoir rock and surfactant molecules, so more electrical repulsion between surfactant molecule and reservoir rock occurs [24,25]. Since alkali is less costly than surfactant, using it even with low TAN crude oil can be economically beneficial as it can significantly lower the surfactant consumption [5,23].
AS flooding is generally conducted in combination with polymer flooding to improve macroscopic sweep efficiency. However, an efficient screening of surfactant and alkali for an alkaline—surfactant-polymer (ASP) flood recipe governs the success of the EOR project [26,27]. An ASP pilot project consisting of four injectors and one producer was initiated in Mangala field, India, in 2014 and continued for 10 months [28]. The water cut of the pilot area right before ASP flooding was 92%. The pilot ASP design included injection of 0.5 PV of ASP solution, 0.5 PV of polymer flooding, followed by 0.1 PV chase water flooding. One month after ASP slug injection initiated, the oil cut increased from 10% to 80%, yielding an incremental oil production of 23,000 STB. The cores collected from the pilot area after ASP flooding showed residual oil saturation (Sor) in the range of only 5–10% [15,18]. Similarly, ASP flooding has proved beneficial in Daqing oilfield, China [29,30,31] and West Salym oilfield in West Siberia [32,33]. In all these studies, the successful reduction in Sor was specifically due to selection of the best surfactant and the remedies adopted to control its adsorption to make the projects economically feasible.
Other than alkali, nanoparticles have also gained popularity as an additive for chemical flooding which is attributed to their surface properties and their ability to control adsorption of chemicals such as surfactant and polymer. Various mechanisms exist through which nanoparticles control the adsorption of surfactants in sandstone reservoirs. One notable observation is that surfactant molecules tend to exhibit higher adsorption on the surface of nanoparticles, mainly because of the presence of stronger hydrogen bonding. Consequently, this leads to a reduced amount of surfactant molecules available for adsorption onto the interface of the rock. As a result of the bonding between nanoparticles and surfactant molecules, both remain distributed within the solution, causing a decline in the overall surfactant adsorption [34]. Research findings suggest that most surfactant molecules tend to collide with nanoparticles rather than bonding with the rock surface. This collision phenomenon ultimately leads to a decrease in the amount of surfactant adsorbed on the rock [35].
In the reservoir, nanofluid with a surfactant serves the purpose of generating stable foams and emulsions, consequently reducing the IFT. It works by minimizing the interfacial energy at the interface, resulting in a decrease in IFT. Unlike conventional surfactants that detach from the interface over time, the nanoparticles in the nanofluid prevent the surfactant molecules from desorbing, ensuring a continuous reduction in IFT and ultimately leading to enhanced surfactant efficiency [6,36].
The aim of this screening study is to select the optimum chemicals for an AS/NS flooding design for an oilfield in Kazakhstan. Field A is a multilayered sandstone reservoir, located in the western Kazakhstan, near the Caspian Sea [37]. It was discovered in the early 1960s and reached a stable oil production during the early years of field development. The field was water flooded with Caspian seawater (CSW) in the late 1960s under several five spot square patterns [38]. The peak of oil production in the field was reached in 1975. The field is still producing oil by waterflooding; however, the oil production has considerably decreased with a field-wide water cut of above 90% [39]. In addition to high water cut, the field also faces problem of a high asphaltene and paraffin content in the crude oil which crystalizes at temperatures ranging from 50–60 °C. The remaining oil saturation in the field is 59%, but due to water breakthrough and the presence of high permeable layers, the remaining oil cannot be produced with waterflooding [39]. As a result of high Sor in the field, chemicals such as surfactant and alkali are needed to detach the residual oil. The Field A reservoir and fluid characteristics are similar to the fields where ASP proved to be effective, as can be seen in Table 1. Therefore, low TAN and high paraffin content are not the main limitations, and chemical flooding can be successfully conducted in Field A.

Table 1.
Comparison of Field A reservoir and fluid characteristics with other ASP-flooded fields.
ASP flooding is proposed as a tertiary recovery method for the Field A, given its success in fields with similar characteristics, including the Daqing field in China and the Mangala field in India. However, the available literature suggests that surfactants, alkalis, and nanoparticles have not been tested for Field A. While polymer flooding has been reviewed as an EOR method for this field, no laboratory studies have been conducted for selection of chemicals design under field conditions. In this context, several experiments should be conducted considering the reservoir rock and fluid properties to design a chemical flooding recipe for maximum oil recovery from the target field [40,41,42]. For this reason, surfactant, alkali, nanoparticles, and polymer screening should be conducted to design a proper chemical flooding project. Screening includes aqueous stability tests to select stable chemical concentration, phase behavior studies to observe Winsor type III microemulsion and IFT reduction, and adsorption studies to select optimum alkali and NPs concentration. The Linear Isotherm model for surfactant adsorption is employed in this work due its simplicity, ease of use, and reasonably accurate estimation for surfactant concentrations used in current study.
The innovation of the current study lies in the fact that it is the first systematic and comprehensive study to our knowledge to not only screen the optimum surfactant for a real complex and mature oilfield, but to also optimize the surfactant design by lowering adsorption with application of novel techniques such as silica NPs and quantify the resulting gain in terms of residual oil recovery by performing extensive coreflood tests. All the experiments in this study were conducted using real core samples, crude oil, formation water, and injection brines provided directly from the target field. To summarize, this study aims to screen proper surfactant, alkaline, and nanoparticles for the chemical flooding project in Field A. The laboratory studies for the polymer selection have already been conducted by our team and can be found elsewhere [43]. Hence, as a final step in this study, screened surfactant will be tested with optimum alkali and nanoparticles in oil displacement tests on the Field A cores to evaluate the efficiency of the AS/NS design and assess which one works better.
2. Methodology
The screening tests aim to study the stability of each surfactant at various concentrations in the makeup brine, their ability to produce Winsor type III microemulsion and to reduce IFT, and the effectiveness of alkali and NPs in controlling surfactant adsorption. All the tests are performed at reservoir temperature of 63 °C.
2.1. Crude Oil and Brines
Field A crude oil with a viscosity of about 8 cp at a reservoir temperature of 63 °C was used. This crude oil has a low acid number of 0.08 mg KOH/g of oil. The Caspian seawater (CSW) with a salinity of 14,250 ppm was used as a makeup brine for all chemical solutions. The ionic composition of CSW is presented in Table 2. Additionally, formation water (FW) from the field with a salinity of 77,000 ppm was used to saturate the cores used for oil displacement tests. Crude oil and brines were filtered prior to use.
Table 2.
Composition of CSW.
2.2. Chemicals
2.2.1. Surfactants
For this study, three surfactants labeled 1S, 2S, and 3S, and one co-surfactant labeled 2A were tested. 1S was tested as a standalone surfactant, while 2S was evaluated in standalone mode as well as in combination with co-surfactant 2A. Table 3 shows a brief description of three surfactants and the co-surfactant. Surfactants 1S and 3S were provided by the operator while 2S and 2A were procured from Sasol Germany.
Table 3.
Description of surfactants selected for screening.
Surfactant 3S was provided in six different compositions wherein the percentage of surfactant, solvent, co-surfactant, and formation water was varied. Table 4 represents the approximate proportion of each chemical in these solutions.
Table 4.
Composition of 3S surfactant solutions.
The pH of the pure surfactants was in the range of 11–14 and their density varied from 0.966 to 1.1 g/cm3. Co-surfactant Alfoterra had a pH range between 8–10.5 with a density of 1.12–1.16 g/cm3.
2.2.2. Alkalis
Two alkalis, namely sodium hydroxide (NaOH) and sodium carbonate (Na2CO3), were evaluated for surfactant adsorption control in combination with the screened surfactant. These alkalis were chosen because of their effectiveness in minimizing adsorption in similar studies [21,23,27,44]. Moreover, both of the alkalis are inexpensive and readily available. Since Field A contains a low AN oil, it can barely produce in situ surfactants. Owing to this fact, the performance of alkali to reduce IFT was not considered. The main objective of the alkali screening stage was to observe and evaluate its impact on controlling adsorption and increasing microemulsion volume.
2.2.3. Nanoparticles
Silica NPs were selected for this research based on previous studies that highlighted their significant effectiveness in reducing surfactant adsorption [34]. SkySpring Nanomaterials provided spherical-shaped porous silica NPs in powdered form, boasting a purity of 99.5%. These nanoparticles ranged in size from 10 to 20 nanometers and had a density of 2.4 g/cc.
2.3. Rock Samples
Six sandstone cores from Field A were used for core flooding. Three of the cores were employed in dynamic adsorption tests while the remaining three were used for oil displacement tests. The physical properties of the core samples are provided in Table 5. For static adsorption study, a Field A reservoir rock sample was crushed and converted to a powder form prior to mixing with designed alkali/surfactant and NPs/surfactant solutions.
Table 5.
Physical properties of the core samples used in the study.
2.4. Chemical Solutions Preparation
The surfactant solution was prepared by adding a properly weighed amount of surfactant to CSW while magnetically stirring at a low speed of 150 rpm to prevent foaming. The solution was then stirred at the same speed for 1.5–2 h to ensure homogeneous mixing. To prepare alkali–surfactant solutions, alkaline solution was first prepared by adding alkali to CSW at a stirring speed of 600–700 rpm and continued mixing for 15–20 min. The alkali–surfactant solution was then prepared by adding surfactant at the desired concentration to the alkaline solution at 150 rpm stirring speed. The solution was then mixed for 1.5–2 h at the same speed.
To prepare the NP–surfactant solution, a carefully measured quantity of silica NPs was introduced into seawater. The mixture was thoroughly stirred using a magnetic stirrer at 600 rpm for half an hour. Subsequently, the solution underwent ultrasonic homogenization at 70 °C for one hour using an ultrasonic homogenizer supplied by Bueno Biotech Company. To prevent thermal degradation of the surfactant molecules, the nanofluid was cooled down before adding the surfactant. The surfactant was then introduced to the nanofluid and stirred at a reduced speed of 150 rpm for a duration of 2 h to ensure a consistent and foaming-free dispersion. All solutions were covered with parafilm to minimize contact with the air.
2.5. Chemicals Screening
This stage aimed to select the best surfactant, alkali, and NPs on the basis of aqueous stability, microemulsion generation, and IFT reduction capabilities. Adsorption studies were then performed to select the optimum alkali and NPs concentration.
2.5.1. Aqueous Stability Study
Precipitation occurs due to the surfactant phase separation under certain conditions, such as temperature and the presence of multivalent ions in the system. Hence, aqueous stability tests are required to check for compatibility between the makeup brine and available surfactants, alkaline, and NPs. Tests were conducted under reservoir conditions to select the most stable chemicals for further phase behavior analysis [11,12]. Standalone surfactant solutions for 1S and 2S were prepared over a 0.1 to 2 wt% concentration range. For surfactant 3S, the six samples provided by the operator were diluted 10 and 20 times with seawater, as per the instructions of the manufacturer. Based on the preliminary aqueous stability results of standalone 2S, stable concentrations were used to prepare combined 2S/2A solutions for surfactant-to-cosurfactant ratios of 10/90, 20/80, 30/70, 40/60, and 50/50.
The prepared surfactant solutions were poured into 10 mL glass vials and were kept at room temperature and in the oven at 63 °C. The samples were observed after three and seven days for transparency of the solutions and precipitation. The samples with precipitation or a milky appearance were discarded and not studied during phase behavior analysis. A similar procedure was followed to check the aqueous stability of the alkalis and NPs to select the most stable concentrations for further tests.
2.5.2. Phase Behavior Analysis
The objective of the phase behavior study was to select the optimum surfactant formulation that could generate Winsor Type-III microemulsion and achieve the lowest IFT. The stable surfactant solutions from the aqueous stability study were assessed during the phase behavior analysis. For this purpose, 2 mL of surfactant solution was mixed with 2 mL of crude oil in a 10 mL vial. The sample was gently agitated for 15 min at a mixing angle of 30°. This was to ensure sufficient contact between crude oil and surfactant solution. The vials were kept in the oven at 63 °C for one week to promote aging under reservoir conditions. The samples were assessed after 7 days for the presence of middle microemulsion phase.
The stable alkali and NPs screened from aqueous stability studies were tested for phase behavior in conjunction with the optimum surfactant. A procedure similar to the surfactant phase behavior test was followed. The purpose of this study was to assess the microemulsion forming ability of selected alkali and NPs.
2.5.3. IFT Measurements
The objective of IFT measurements was to determine the surfactant formulation that would result in minimum IFT between oil and water. The shape and size of the droplets formed in emulsions during surfactant injection depends on oil–water IFT. With reduction in IFT, smaller-sized crude oil droplets are created more easily, leading to generation of Winsor Type III microemulsion. Due to their higher surface area-to-volume ratio, these smaller droplets are easily displaced by the injected surfactant solution [8,45,46]. Additionally, a lower IFT facilitates the generation of stable microemulsions, which enclose droplets of oil in surfactant molecules, yielding a more evenly dispersed emulsion phase [47,48,49]. As a result, the crude oil in the formation becomes more mobile and is efficiently displaced by the injection fluid. Thus, it is critical to design a surfactant solution that can effectively lower the oil–water IFT, thereby lowering capillary pressure and enhancing the microscopic sweep efficiency of chemical flooding.
Optical Contact Angle (OCA-25) apparatus by DataPhysics Instruments GmbH was used for IFT measurement. The device consisted of a camera, a light source, and a special needle to release a droplet of microemulsion/oil in the aqueous phase. Figure 1 shows a schematic of the setup. The pendant drop method was used for IFT determination wherein a small droplet of one liquid is suspended from a needle or capillary immersed in the other liquid. The droplet’s shape was measured and analyzed to calculate the IFT by Laplace-Young equation [16]. The formulations short-listed from the phase behavior study were used, and IFT was measured by taking the microemulsion sample from the oil–water interface.

Figure 1.
Schematic illustration of IFT apparatus.
2.5.4. Static Adsorption Study
The retention of surfactant on the reservoir rock surface and within the pores, known as adsorption, is a well-recognized challenge in chemical EOR methods. To investigate this phenomenon, static adsorption studies are widely employed, wherein the accumulation of surfactant molecules on sand grain surfaces is examined. In this research, the adsorption behavior of the screened surfactant on Field A rock was thoroughly analyzed, focusing on the impact of mixing time. Furthermore, the study explored the effects of alkali and nanoparticles on surfactant adsorption through static adsorption experiments utilizing NP–surfactant and alkali–surfactant solutions. Specifically, two alkalis were chosen for the surfactant–alkali solutions: sodium carbonate (Na2CO3) and sodium hydroxide (NaOH), each at concentrations of 0.01 wt%, 0.015 wt%, and 0.02 wt%. Silica nanoparticles were used at concentrations of 0.05 wt% and 0.1 wt% for the surfactant–nanoparticle solution. These concentrations were selected based on the aqueous stability and transparency of alkali–surfactant and NP–surfactant solutions. The alkali–surfactant and NPs–surfactant solutions prepared at different concentrations were placed in 10 mL glass vials and were kept at room temperature and in the oven at 63 °C. After three and seven days the samples were assessed for the transparency of the solutions and the precipitation appearance. The samples with precipitation were dropped and not studied for static adsorption of surfactant.
The stable surfactant–alkali solutions or surfactant–nanoparticle solutions were mixed in the rotary oven at room temperature with crushed Field A sandstone at a mass ratio of 4:1. Such a proportion was chosen to ensure complete adsorption on the sandstone particles. The aging process continued for different time periods: 4 h, 12 h, 24 h, 36 h, and 72 h. The samples were diluted 100 times and subsequently analyzed using a UV-Vis spectrophotometer. This dilution process was necessary due to the resolution limits of the apparatus, which allow for more precise and accurate results, particularly for lower solution concentrations of up to 500 ppm.
2.5.5. Dynamic Adsorption Study
Following the surfactant adsorption results obtained from the static adsorption study, the next phase involved measuring dynamic adsorption values, as they are considered more reliable and representative of the real field conditions during flooding. To achieve this, experiments were conducted with both nanoparticles and alkali, and the outcomes were compared to the standalone surfactant scenario. The specifics of these tests are outlined in Table 6.
Table 6.
Sequence of dynamic adsorption tests.
To evaluate the dynamic adsorption of the chosen surfactant on Field A sand in the presence of alkali and NPs, flooding experiments were performed using natural cores. The Vinci core flooding system CFS 700, depicted in Figure 2, was utilized for all the coreflood tests.
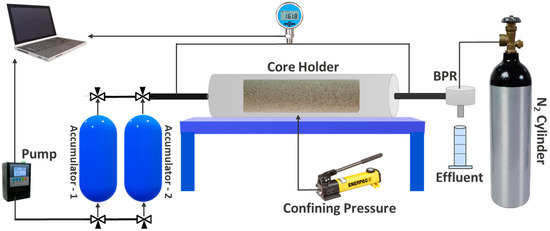
Figure 2.
Schematic of Vinci CFS 700 coreflood apparatus.
A confining pressure of 1500 psi was applied throughout the experiments, and a back pressure of 300 psi was maintained during all injection stages. The tests were conducted at a reservoir temperature of 63 °C and a flow rate of 0.5 cc/min. The core was first flooded with seawater to obtain absolute permeability. Following that, the targeted surfactant solution was injected into the core, and the effluent was continuously collected within a specified volume. Finally, a seawater post-flush was conducted to recover the un-adsorbed surfactant. The surfactant concentration in the effluent was determined afterwards by a UV–Vis spectrophotometer. Dynamic adsorption was calculated using Equation (1), as follows:
where adsorption of the surfactant on sandstone (μg/g) is represented by Qs. Co stands for the initial concentration of the surfactant (ppm), while V represents the total volume of the injected surfactant solution (L). The surfactant concentration in effluents collected at different time periods is denoted by Ci (ppm), and Vi signifies the volume of each effluent sample (L). Lastly, represents the total mass of the core sample (g) and n is the total number of effluent samples collected during surfactant injection and subsequent seawater post-flush.
2.6. Coreflood Tests
Coreflooding was the last step of the study, which was to inject the designed alkali–surfactant and NPs–surfactant formulations to quantify and select the best design on the basis of incremental oil recovery. Linear core flooding was conducted on three Field A cores using Vinci CFS 700 coreflood apparatus. The detailed injection sequence for all tests is presented in Table 7.
Table 7.
Sequence of oil displacement experiments.
First, cores were saturated with the Field A formation water, and then FW was injected at injection rates of 0.5, 1, 1.5, and 2 cc/min until the pressure stabilized at each rate. Oil injection was then initiated at different rates until the pressure stabilized and effluent water cut dropped to less than 0.1%. By measuring the produced water volume, the initial water saturation (Swi) was calculated using Equation (2).
where Swi is the initial water saturation (%), Vp is the pore volume (cc), and Vw is the produced water volume by oil injection (cc). Afterwards, waterflooding was started by injecting CSW at 0.5 cc/min. The injection rate was increased to the next value once oil production in the effluent was negligible and a stable pressure drop across the core was achieved. Once the waterflooding stage was completed, the core was flooded with the designed surfactant solution until no more oil was recovered in the effluents. The volume of oil in the effluents was measured and the recovery factor for each flooding stage was calculated using Equation (3).
where Voi is the initial volume of oil in the core and Vo is the volume of oil produced by a specific injection fluid.
3. Results and Discussion
This section presents the results of the screening study for chemical flooding design for Field A.
3.1. Chemicals Screening
3.1.1. Aqueous Stability Results
An aqueous stability test was conducted for a total of 42 surfactant solutions at reservoir conditions as the first stage of the screening process. The surfactant solutions were checked for transparency after 7 days of aging at reservoir temperature of 63 °C. The 1S stability test showed that all concentrations except 0.1 wt% were stable (Figure 3a) and, thus, the 0.1 wt% concentration was discarded. As demonstrated in Figure 3b, the 2S solutions were unstable at surfactant concentrations higher than 0.1 wt%, as indicated by milky appearance and precipitation. Thus, only 0.1 wt% 2S was selected for the phase behavior study.
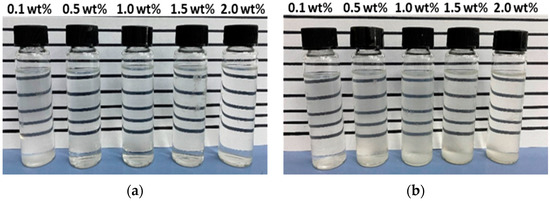
Figure 3.
Aqueous stability results for (a) 1S and (b) 2S at 7th day of aging at 63 °C.
After standalone 2S was tested for aqueous stability, the aqueous stability tests were conducted with co-surfactant 2A to evaluate stable surfactant/co-surfactant ratios. The preliminary tests showed that higher co-surfactant percentages resulted in better stability. Hence, 2S/2A ratios of 10/90, 20/80, 30/70, 40/60, and 50/50 were selected at overall concentrations of 0.5, 1.0, 1.5, and 2.0 wt%. All samples remained stable at reservoir temperature and thus were selected for further tests. Figure 4 shows the aqueous stability performance on the 7th day for 1.5 wt% and 2.0 wt% concentrations.
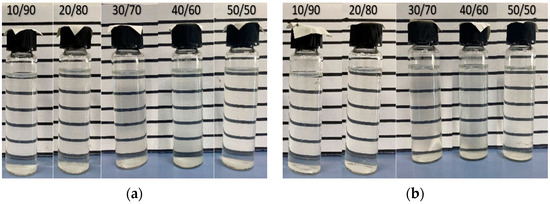
Figure 4.
Aqueous stability results for several 2S/2A ratios at overall concentration of (a) 1.5 wt% and (b) 2.0 wt%.
For the aqueous stability analysis of six 3S surfactants, the samples were diluted 10 times and 20 times with CSW. However, none of these dilutions were stable with seawater, as suggested by the high precipitation after the 7th day in Figure 5. Consequently, all 3S solutions were discarded from the study.
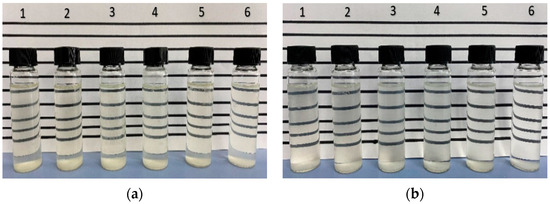
Figure 5.
The 7th day aqueous stability results for six 3S samples after (a) 10 times and (b) 20 times dilution with CSW.
3.1.2. Phase Behavior and IFT Results
This section presents the results of the phase behavior study for the stable surfactants 1S, 2S, and 2S/2A. The screening criteria for this phase was to select surfactant solutions based on the development of the oil/brine microemulsion middle phase after 7 days of aging at reservoir temperature. As shown in Figure 6a, none of the 1S concentrations showed the formation of a microemulsion phase, and hence, surfactant 1S was fully discarded from the study. Likewise, the standalone 2S at a stable concentration of 0.1 wt% also did not show any microemulsion formation (Figure 6b) and thus was dropped from further analysis. Microemulsion was developed at different 2S/2A ratios; however, it was difficult to compare the microemulsion size due to the smaller volume of samples. To measure the volume of the middle phase more accurately, 20 mL vials were used. Then, 10 mL of brine/surfactant solution and 10 mL of oil were mixed in each case. Table 8 shows the phase distribution for all five 2S/2A ratios at four overall concentrations after 7 days under reservoir temperature. The IFT of all cases was also measured. The size of the middle phase and the IFT value were used as screening criteria to select the most effective surfactant formulation for the next phase of the study.
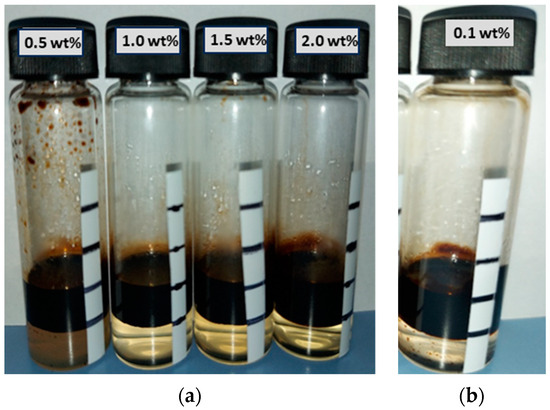
Figure 6.
Phase behavior results of (a) 1S and (b) 2S at reservoir temperature on the 7th day.
Table 8.
Phase behavior of all 2S/2A formulations after 7 days at 63 °C.
The phase behavior results showed that the samples with 1.5 wt% and 2 wt% overall concentration had higher microemulsion volumes. Most of these samples developed Winsor Type II microemulsions while only the 1.5 wt% samples with 2S/2A ratios of 30/70 and 40/60 exhibited Winsor Type III microemulsions. Figure 7 shows a comparison of IFT results as a function of the 2S/2A ratio for the four overall concentrations studied. The initial oil–water IFT between Field A crude oil and CSW was 14 mN/m. Although all 2S/2A formulations showed a reduction in IFT compared to original oil–water IFT, the reduction was not appreciable for 0.5 and 1.0 wt% concentrations. The results of this screening phase showed that lower 2S/2A concentrations were not efficient in forming microemulsion since their IFT values ranged between 4–8 mN/m and the phase behavior showed Winsor type II microemulsion. As a result, all the 2S/2A ratios at 0.5 wt% and 1.0 wt% over all concentrations were discarded from the study.
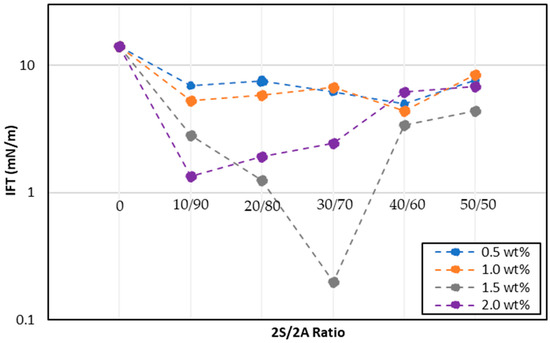
Figure 7.
IFT of 2S/2A solutions.
It can be seen from Figure 7 that higher overall 2S/2A concentrations of 1.5 and 2.0 wt% showed a considerable reduction in IFT; however, only 1.5 wt% concentration with a 2S/2A ratio of 30/70 caused a reduction two orders of magnitude in IFT with an ultralow IFT of 0.2 mN/m. The rest of the samples showed a tendency to form Winsor type II microemulsion with higher IFT values. Overall, the addition of co-surfactant 2A to surfactant 2S improved the stability of this anionic surfactant and resulted in desired microemulsion formation. Based on the IFT and phase behavior results, 1.5 wt% 2S/2A at a surfactant/co-surfactant ratio of 30/70 was selected as an optimum surfactant formulation for ASP/NSP flooding design for Field A.
After screening the most suitable surfactant, the next step was to select the optimum alkali and NPs to control surfactant adsorption. To select the alkali and nanoparticles concentrations for the static adsorption study, the aqueous stability of various alkali–surfactant and NP–surfactant solutions was analyzed using the optimum surfactant 2S/2A at 1.5 wt% concentration and a surfactant/co-surfactant ratio of 30/70. The aqueous stability results showed that both alkalis Na2CO3 and NaOH were stable in CSW at reservoir temperature only at a very low concentration. The stable alkaline concentrations chosen for the static adsorption study were 0.01, 0.015, and 0.02 wt% for both alkalis. NP–surfactant solutions remained stable at concentrations of 0.05 and 0.1 wt% and thus were selected for static adsorption study.
3.1.3. Static Adsorption Results
The calibration curve for static adsorption calculation was constructed by analyzing standalone surfactant solutions at different concentrations (50 ppm, 100 ppm, 150 ppm, and 200 ppm) for their degree of adsorption using a UV–Vis spectrophotometer. Figure 8 shows the developed calibration curve along with the equation of the best fit line.
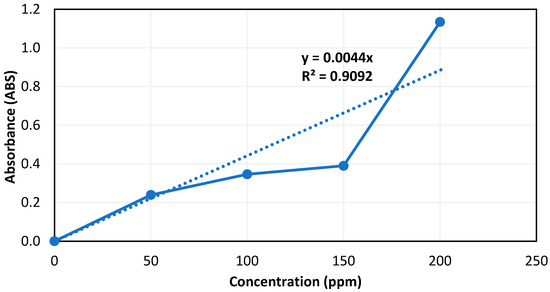
Figure 8.
Surfactant calibration curve at a fixed 2S/2A ratio of 30/70.
The absorbance of each alkali–surfactant or NP–surfactant sample was measured by UV–Vis Spectrophotometer and was converted to surfactant adsorption using the calibration curve. The standalone surfactant static adsorption was in the range of 14.1–45.7 mg/g of rock at different mixing times. The general trend was that with increasing aging/mixing time, the static adsorption of surfactants increased in all cases. Since the typical contact times in the reservoir are higher, the results at 72 h mixing time were considered more reliable for screening.
Na2CO3 at a concentration of 0.02 wt% reduced surfactant adsorption by 21% after 72 h of mixing time with crushed Field A rock. However, a reduction of only 5% was observed by 0.02 wt% NaOH. Figure 9 shows a comparison of both alkalis in reducing surfactant adsorption after 72 h of aging time. It can be seen that Na2CO3 caused 16% more reduction in surfactant adsorption compared to NaOH at the same concentration of 0.02 wt%.
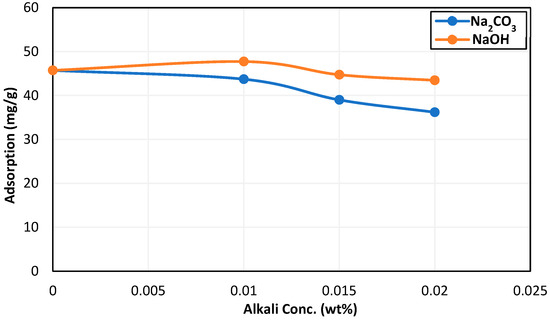
Figure 9.
Comparison of the effect of alkali on surfactant adsorption after 72 h of aging time.
In the case of silica NPs, a concentration of 0.05 wt% reduced surfactant adsorption by 4%. Figure 10 shows the effect of NPs on surfactant adsorption at 72 h. The poor performance of NPs in controlling surfactant adsorption may be due to low compatibility between silica NPs and the surfactant reducing the stability of the solution and causing more surfactant to adsorb on the rock.
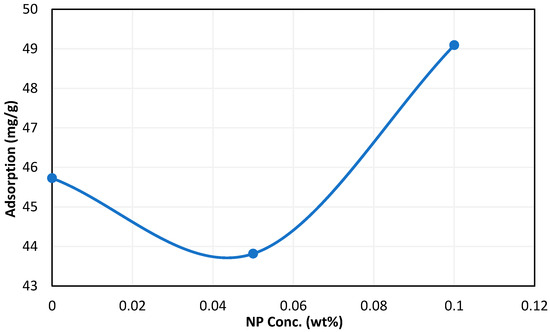
Figure 10.
Effect of silica NPs on surfactant adsorption after 72 h of aging time.
Figure 11 shows the comparison between both alkalis and NPs in controlling surfactant static adsorption after 72 h of aging. It can be seen from these results that Na2CO3 worked best in minimizing surfactant adsorption at an optimum concentration of 0.02 wt%. The reason for this phenomenon is that the alkaline solution renders the rock surface more negatively charged, causing it to repel the negatively charged surfactant molecules. For silica NPs, 0.05 wt% concentration worked better than 0.1 wt%, mainly because of increased instability of the solution at a higher concentration of NPs. Based on the results of static adsorption study, 0.02 wt% Na2CO3 and 0.05 wt% SiO2 were selected for surfactant dynamic adsorption tests.
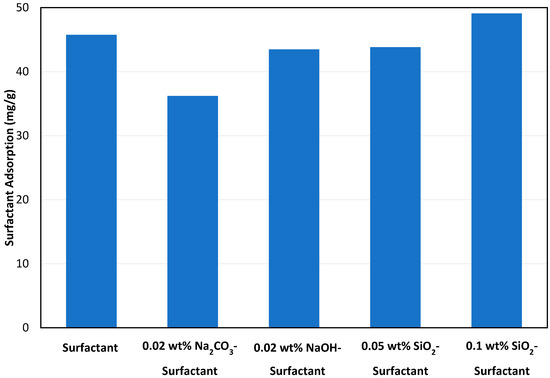
Figure 11.
Comparison of alkalis and NPs in reducing surfactant adsorption after 72 h.
3.1.4. Dynamic Adsorption Results
Figure 12 illustrates the relationship between pressure drop and injected pore volumes for all three tests. The observed pressure drop behavior suggests that there is relatively lower surfactant adsorption during alkali–surfactant flooding when compared to the other two cases. Notably, from Figure 12, it is evident that the pressure drop during NP–surfactant flooding was approximately 67% higher than the pressure drop during alkali–surfactant flooding. Such a high pressure drop could be due to pore blocking caused by the NPs. Moreover, it can be observed in Figure 12b that the pressure drop during alkali–surfactant flooding was lower than the SW pre-flush pressure drop.
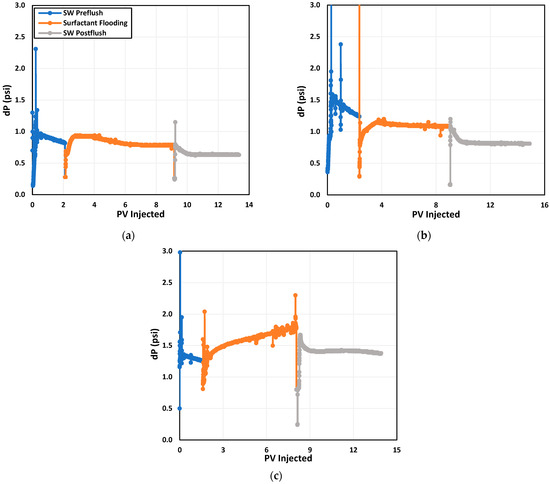
Figure 12.
Pressure drop profile during dynamic adsorption test of (a) surfactant, (b) alkali–surfactant, and (c) NP–surfactant.
This lower pressure drop during alkali–surfactant flooding may be due to presence of a greater number of surfactant molecules in the SW imparting a lower in situ viscosity and yielding a lower pressure drop. The viscosity of the surfactant solution at 63 °C was 0.75 cp while the viscosity of seawater was 0.79 cp. Thus, a lower pressure drop during alkali–surfactant flooding is an indication of less surfactant adsorption.
The surfactant concentration In the effluents during surfactant flooding and seawater post-flush was measured using a spectrophotometer and was plotted as a function of pore volume injected, as shown in Figure 13.
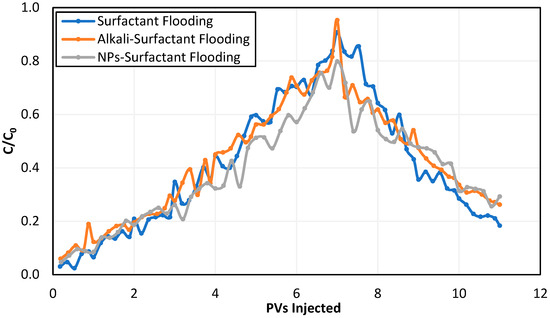
Figure 13.
Effluent concentration profiles for the three dynamic adsorption tests.
It can be observed that the mass of surfactant recovered during NP–surfactant flooding was less than the mass recovered during alkali–surfactant flooding. Dynamic surfactant adsorption was calculated using Equation (1) and the results are presented in Table 9.
Table 9.
Surfactant dynamic adsorption results for Field A Reservoir Cores.
The standalone surfactant dynamic adsorption was around 9.2 mg per gram of rock. Dynamic adsorption is generally less than static adsorption and yields more realistic results under filed conditions. The results in Table 9 show that alkali resulted in a 9% reduction in the surfactant dynamic adsorption. Silica NPs, on the other hand, lowered the dynamic adsorption by only 1%. These results indicate that the addition of alkali to surfactant solution can improve surfactant performance by lowering its adsorption. The reduction in surfactant adsorption is attributed to alkali, such as sodium carbonate, dissociating into a weak carbonic acid and generating OH− ions upon interaction with water molecules. As a result, the system’s pH increases, leading to a more negatively charged surface of the sample. Consequently, there is an electrostatic repulsion between the surfactant molecules and the rock surface, significantly decreasing surfactant adsorption [50].
NPs, however, were not successful in overcoming the surfactant adsorption issue. Due to the anionic surfactant charge not being negative enough in the presence of NPs, the repulsive force between the rock and the surfactant molecules weakened, resulting in a higher surfactant dynamic adsorption. The outcomes of the dynamic adsorption study unequivocally validated the appropriateness of Na2CO3 for controlling 2S/2A adsorption on the Field A rock surface. Consequently, based on the findings from both the static and dynamic adsorption experiments, Na2CO3 was selected as an ingredient in the surfactant solution recipe for Field A ASP design to reduce surfactant adsorption. Following the dynamic adsorption tests, the chosen alkali and NPs were evaluated for their impact on the microemulsion generation capacity of the surfactant.
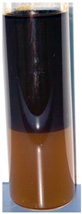
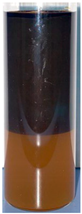
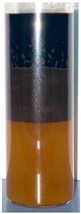
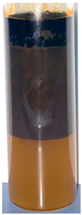
3.1.5. Phase Behavior Analysis with Selected Alkali and NPs
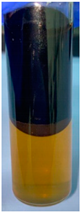
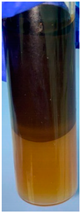
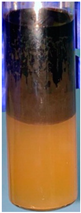
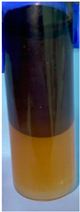
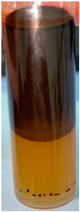
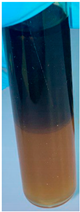
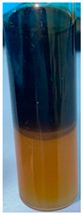
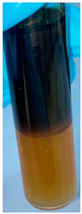
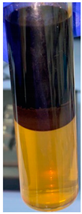
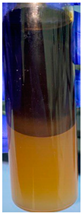
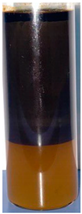
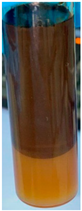
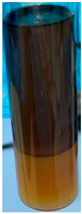
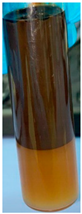
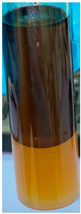
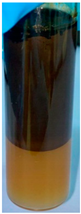
The phase behavior study was performed for the optimum alkali and NPs concentrations to assess the effect of these constituents on microemulsion formulation. A comparison of the microemulsion type and volume of surfactant, 0.02 wt% Na2CO3–surfactant, and 0.05 wt% SiO2–surfactant combinations, is presented in Figure 14. Figure 14b shows that an alkali surfactant solution did not generate an appreciable microemulsion volume during the phase behavior test. This can be attributed to a low AN of crude oil, resulting in the inability of alkali to synthesize in situ surfactant. The nanoparticle surfactant solution, on the other hand, exhibited Winsor type 3 microemulsion with a volume of 1.2 mL, as can be seen in Figure 14c.
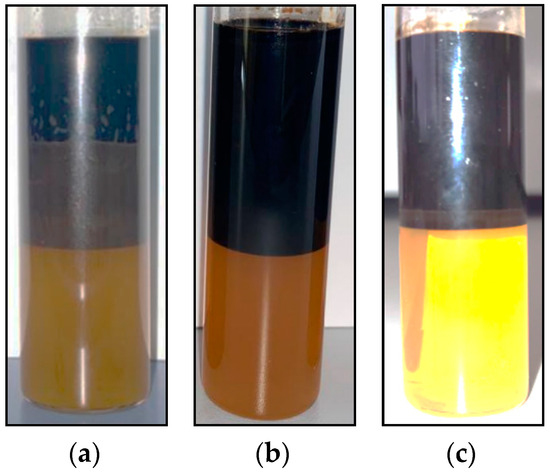
Figure 14.
Microemulsion formation tendency of (a) surfactant, (b) alkali–surfactant, and (c) NP–surfactant.
A comparison of the standalone 2S/2A and NPs–2S/2A phase behavior revealed that both formulations exhibited the characteristics of Winsor type 3 microemulsion. However, it was observed that the surfactant solution with a concentration of 1.5 wt% and a 2S/2A ratio of 30/70 demonstrated a higher propensity for microemulsion formation, as depicted in Figure 14a. Overall, these results showed that the selected alkali and NPs did not adversely affect the phase behavior of selected surfactant. Based on the phase behavior results, 1.5 wt% 2S/2A with a surfactant/co-surfactant ratio of 30/70 was chosen as the best surfactant while 0.02 wt% Na2CO3 and 0.05 wt% SioO2 NPs were selected as the optimum alkali and NPs, based on adsorption results. Oil displacement tests were performed next with standalone surfactant as well as with both alkali and NPs to compare the effect on oil recovery and conclude the screening study.
3.2. Oil Displacement Results
To evaluate the effectiveness of the selected chemicals, the first coreflood test was conducted with standalone surfactant. After reaching Sor by waterflooding, surfactant flooding started and continued for around 23 pore volumes. This phase recovered an additional 17% OOIP, increasing the total recovery factor to around 60% OOIP. Figure 15 shows a comparison of the oil recovery and pressure drop profiles of the three coreflood tests. An important observation from Figure 15a is that the pressure drop during surfactant flooding exhibited a slightly increasing trend at each injection rate and was closer to the pressure drop during waterflooding. This is an indication of surfactant adsorption and surfactant loss from the injected surfactant solution, resulting in a pressure drop similar to that of waterflooding.
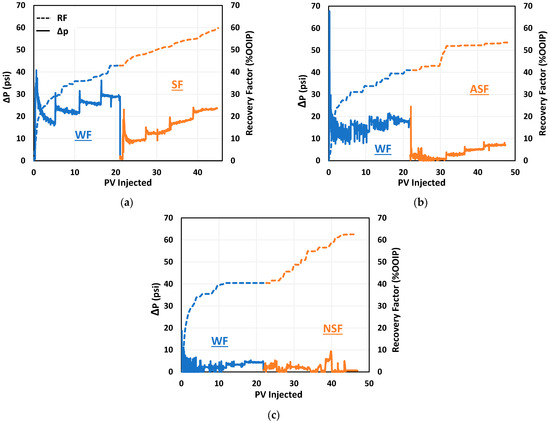
Figure 15.
Comparison of oil recovery performance of (a) SF, (b) ASF, and (c) NSF.
The second coreflood test was a combination of the selected alkaline Na2CO3 and surfactant 2S/2A. After injecting a total of 21 pore volumes of seawater, oil recovery was around 41% OOIP. The injection fluid was then switched to the alkali–surfactant solution (0.02 wt% Na2CO3 and 1.5 wt% 2S/2A at 30/70 ratio), and AS flooding was continued for additional 26 pore volumes. The alkali–surfactant flooding resulted in 13% OOIP incremental recovery, increasing the total recovery factor to 54% at the end of AS flooding. The incremental recovery during alkali–surfactant flooding can be credited to the mobilization of residual oil in the form of microemulsion by surfactant action and a reduction in surfactant adsorption by the action of alkali. As shown in Figure 15b, the incremental oil recovery during the first couple of pore volumes was relatively slow as the surfactant solution needed some time to interact with the oil and generate microemulsion. Moreover, the pressure drop during AS flooding at 0.5 cc/min was significantly lower and was probably not sufficient to produce the mobilized oil and microemulsion, which was later produced at higher rates. Overall, the pressure drop during AS flooding was 3–5 times lower than the pressure drop during seawater flooding, indicating the efficient performance of alkali in controlling surfactant adsorption. As a result, the surfactant solution maintained its lower viscosity and helped in recovering residual oil by generating microemulsion.
The purpose of the third flooding experiment was to assess the NPs’ effect of lowering surfactant adsorption on recovering more oil by comparing the results of this test with an SF and AS flooding test. As depicted in Figure 15c, waterflooding recovered 40% OOIP from this core. The NS flooding was then started by injection of NPs–surfactant solution (0.05 wt% SiO2 and 1.5 wt% 2S/2A at 30/70 ratio) for a total of 24 pore volumes. The total recovery factor was increased to 63%, translating to 22% incremental oil recovery by NP–surfactant flooding. This incremental oil recovery can be attributed to IFT reduction by surfactant and adsorption control by NPs. NPs could have also helped by blocking some pores and diverting the surfactant to previously un-contacted areas, as evident by repeated fluctuations in the pressure drop during NP–surfactant flooding.
Table 10 presents a comparison of the incremental oil recovery by SF, ASF, and NSF. It can be observed from Table 10, the incremental recovery in terms of the remaining oil in core (ROIC) by NP–surfactant flooding was almost 7% higher compared to standalone surfactant flooding; meanwhile, it was around 16% higher compared to alkali–surfactant flooding.
Table 10.
Comparison of oil recovery factors by ASP and NSP flooding.
The better performance of the NSF scenario can be explained by the fact that the selected NPs were successful in lowering surfactant adsorption as well as lowering the oil–water IFT. Fewer surfactant molecules adsorbed on the rock surface in presence of NPs, leading to a reduction in surfactant loss. Hence, a greater volume of oil was contacted by the surfactant molecules and a higher residual oil saturation was mobilized during NP–surfactant stage.
Several possible mechanisms explain the better performance of surfactant in the presence of NPs. Nanoparticles can augment the ability of surfactants to lower the oil–water IFT. Their high surface area-to-volume ratio enables them to adhere to the interface between oil and water. Hence the contact area between oil and water increases, leading to a higher IFT reduction, enhancing the detachment of oil from reservoir rock, and facilitating the mobilization of oil with greater ease. Alkali, on the other hand, seems to not work here in lowering the IFT, which may be due to a very low acid number of the target field crude oil. However, alkali does work in minimizing surfactant adsorption, which is evident from the relatively lower pressure drop during AS flooding compared to standalone surfactant flooding.
Based on these results, the surfactant, alkali, and NPs screened in this study can be tested with the previously selected polymer to design the most efficient chemical flood recipe for Field A.
4. Conclusions
In this research, a systematic screening study was carried out to screen surfactants, alkalis, and NPs for Field A and assess their flooding performance on the core scale. Caspian seawater was chosen as makeup brine for all chemical solutions as it has been used for waterflooding in the field for years. Surfactant screening demonstrated that surfactant solution (with co-surfactant) was able to generate microemulsion and lower oil–water IFT. Particularly, anionic surfactant 2S in combination with co-surfactant 2A with a 2S/2A ratio of 30/70 and an overall concentration of 1.5 wt% successfully produced Winsor Type III microemulsion and resulted in a two order of magnitude reduction in IFT, lowering it from 14 mN/m to 0.2 mN/m. The screened surfactant was tested for adsorption control with alkalis NaOH and Na2CO3 and SiO2 NPs. Both static and dynamic adsorption results showed a better performance of 0.02 wt% Na2CO3 as it caused a 21% and 9% reduction in surfactant static and dynamic adsorption, respectively. NPs, however, did not provide favorable adsorption control. To test the screened chemicals in terms of oil recovery efficiency, three coreflood tests were performed utilizing surfactant, alkali–surfactant, and NP–surfactant.
The coreflood study showed that the selected formulations were able to recover the residual oil by the combined action of surfactant and alkali/NPs. However, the NPs performed better in that they effectively lowered surfactant adsorption as well as aided in IFT reduction. Surfactant loss was minimized and an appreciable microemulsion volume was generated by the NP–surfactant solution. Thus, residual oil was effectively mobilized by the injected chemicals, notably reducing Sor. The incremental oil recovery by NSF was 9% higher compared to ASF. The results of this study showed that each constituent in a chemical flood design must be carefully and thoroughly evaluated as the recovery of the residual oil is strongly affected by the combined and individual actions of the chemicals involved. Based on the superior performance of alkali in lowering surfactant adsorption and a higher residual oil recovery by NSF flooding, an effective chemical flooding recipe can be designed by combining the chemicals selected in this study with an optimum polymer for Field A.
Author Contributions
Conceptualization, A.D., A.M. and D.S.; methodology, A.D. and M.S.; validation, M.S., P.P. and D.M.; writing—original draft preparation, A.D., A.M. and D.S.; review and editing, M.S. and P.P.; supervision, M.S., P.P. and D.M. All authors have read and agreed to the published version of the manuscript.
Funding
This research was funded by “Samruk-Kazyna” grant number SMG2022003, and The APC was funded by SMG2022003.
Data Availability Statement
Not applicable.
Acknowledgments
The authors thank “Samruk-Kazyna” JSC, KMG Engineering, and Nazarbayev University for supporting this research.
Conflicts of Interest
The authors declare no conflict of interest.
References
- Green, D.W.; Willhite, G.P. Enhanced Oil Recovery; Society of Petrolem Engineer (SPE): Richardson, TX, USA, 1998; Volume 6. [Google Scholar]
- Sandersen, S.B. Enhanced Oil Recovery with Surfactant Flooding. Ph.D. Thesis, Technical University of Denmark, Kongens Lyngby, Denmark, 2012; pp. 1–162. [Google Scholar]
- Sheng, J. Modern Chemical Enhanced Oil Recovery: Theory and Practice; Sheng, J., Ed.; Gulf Professional Publishing: Houston, TX, USA, 2010. [Google Scholar]
- Sagir, M.; Mushtaq, M.; Tahir, M.S.; Tahir, M.B.; Shaik, A.R. Surfactants for Enhanced Oil Recovery Applications; Springer: Berlin/Heidelberg, Germany, 2020; ISBN 3030187845. [Google Scholar]
- Belhaj, A.F.; Elraies, K.A.; Mahmood, S.M.; Zulkifli, N.N.; Akbari, S.; Hussien, O.S. The Effect of Surfactant Concentration, Salinity, Temperature, and PH on Surfactant Adsorption for Chemical Enhanced Oil Recovery: A Review. J. Pet. Explor. Prod. Technol. 2020, 10, 125–137. [Google Scholar]
- Massarweh, O.; Abushaikha, A.S. The Use of Surfactants in Enhanced Oil Recovery: A Review of Recent Advances. Energy Rep. 2020, 6, 3150–3178. [Google Scholar]
- Bera, A.; Ojha, K.; Mandal, A.; Kumar, T. Interfacial Tension and Phase Behavior of Surfactant-Brine–Oil System. Colloids Surf. A Physicochem. Eng. Asp. 2011, 383, 114–119. [Google Scholar]
- Chowdhury, S.; Shrivastava, S.; Kakati, A.; Sangwai, J.S. Comprehensive Review on the Role of Surfactants in the Chemical Enhanced Oil Recovery Process. Ind. Eng. Chem. Res. 2022, 61, 21–64. [Google Scholar]
- Hamidi, H.; Mohammadian, E.; Rafati, R.; Azdarpour, A.; Ing, J. The Effect of Ultrasonic Waves on the Phase Behavior of a Surfactant–Brine–Oil System. Colloids Surf. A Physicochem. Eng. Asp. 2015, 482, 27–33. [Google Scholar]
- Sekerbayeva, A. Experimental Design of “Hybrid Low Salinity Water Flooding and Low Salinity Surfactant Flooding” Enhanced Oil Recovery Method. Master’s Thesis, Nazarbayev University, Astana, Kazakhstan, 2020; pp. 1–67. [Google Scholar]
- Sekerbayeva, A.; Pourafshary, P.; Hashmet, M.R. Application of Anionic Surfactant\ Engineered Water Hybrid EOR in Carbonate Formations: An Experimental Analysis. Petroleum 2022, 8, 466–475. [Google Scholar]
- Zulkifli, N.N.; Mahmood, S.M.; Akbari, S.; Manap, A.A.A.; Kechut, N.I.; Elrais, K.A. Evaluation of New Surfactants for Enhanced Oil Recovery Applications in High-Temperature Reservoirs. J. Pet. Explor. Prod. Technol. 2020, 10, 283–296. [Google Scholar]
- Park, S.; Lee, E.S.; Sulaiman, W.R.W. Adsorption Behaviors of Surfactants for Chemical Flooding in Enhanced Oil Recovery. J. Ind. Eng. Chem. 2015, 21, 1239–1245. [Google Scholar]
- Ahmadi, M.A.; Shadizadeh, S.R. Experimental Investigation of a Natural Surfactant Adsorption on Shale-Sandstone Reservoir Rocks: Static and Dynamic Conditions. Fuel 2015, 159, 15–26. [Google Scholar] [CrossRef]
- Koduru, N.; Prasad, D.; Pandey, A. ASP Formulation Development Journey, Optimisation and Validation for Mangala Field. In Proceedings of the International Petroleum Technology Conference, Bangkok, Thailand, 1–3 March 2023; p. D021S011R002. [Google Scholar]
- Rapp, B.E. Chapter 22—Measuring Surface Tension and Free Surface Energy. In Microfluidics: Modelling, Mechanics and Mathematics; Rapp, B.E., Ed.; Elsevier: Oxford, UK, 2017; pp. 453–465. [Google Scholar]
- DeZabala, E.F.; Vislocky, J.M.; Rubin, E.; Radke, C.J. A Chemical Theory for Linear Alkaline Flooding. Soc. Pet. Eng. J. 1982, 22, 245–258. [Google Scholar]
- Pandey, A.; Beliveau, D.; Kumar, M.S.; Pitts, M.J.; Qi, J. Evaluation of Chemical Flood Potential for Mangala Field, Rajasthan, India-Laboratory Experiment Design and Results. In Proceedings of the IPTC 2008: International Petroleum Technology Conference, Kuala Lumpur, Malaysia, 3–5 December 2008; p. cp-148. [Google Scholar]
- Ehrlich, R.; Wygal, R.J., Jr. Interrelation of Crude Oil and Rock Properties with the Recovery of Oil by Caustic Waterflooding. Soc. Pet. Eng. J. 1977, 17, 263–270. [Google Scholar]
- Sagyndikov, M.S.; Kushekov, R.M.; Seright, R.S. Review of Important Aspects and Performances of Polymer Flooding versus ASP Flooding. Bull. Univ. Karagand Chem. Geofluids 2022. [Google Scholar] [CrossRef]
- Guo, H.; Li, Y.; Li, Y.; Kong, D.; Li, B.; Wang, F. Lessons Learned from ASP Flooding Tests in China. In Proceedings of the SPE Reservoir Characterisation and Simulation Conference and Exhibition, San Antonio, TX, USA, 9–11 October 2017. [Google Scholar]
- Cooke, C.E., Jr.; Williams, R.E.; Kolodzie, P.A. Oil Recovery by Alkaline Waterflooding. J. Pet. Technol. 1974, 26, 1365–1374. [Google Scholar] [CrossRef]
- Volokitin, Y.; Shuster, M.; Karpan, V.; Koltsov, I.; Mikhaylenko, E.; Bondar, M.; Podberezhny, M.; Rakitin, A.; Batenburg, D.W.; Parker, A.R. Results of Alkaline-Surfactant-Polymer Flooding Pilot at West Salym Field. In Proceedings of the SPE EOR Conference at Oil and Gas West Asia, Muscat, Oman, 26 March 2018. [Google Scholar]
- Wang, D.; Zhang, Z.; Cheng, J.; Yang, J.; Gao, S.; Li, L. Pilot Tests of Alkaline/Surfactant/Polymer Flooding in Daqing Oil Field. SPE Reserv. Eng. 1997, 12, 229–233. [Google Scholar]
- Dang, C.T.; Chen, Z.; Nguyen, N.T.; Bae, W.; Phung, T.H. Development of Isotherm Polymer/Surfactant Adsorption Models in Chemical Flooding. In Proceedings of the SPE Asia Pacific Oil and Gas Conference and Exhibition, Jakarta, Indonesia, 20–22 September 2011; p. SPE-147872. [Google Scholar]
- Pitts, M.J.; Dean, E.; Wyatt, K.; Skeans, E.; Deo, D.; Galipeault, A.; Mohagen, D.; Humphry, C. Instow: A Full-Field, Multipatterned Alkaline-Surfactant-Polymer Flood—Analyses and Comparison of Phases 1 and 2. SPE Reserv. Eval. Eng. 2021, 24, 874–888. [Google Scholar]
- Pitts, M.J.; Dowling, P.; Wyatt, K.; Surkalo, H.; Adams, C. Alkaline-Surfactant-Polymer Flood of the Tanner Field. In Proceedings of the SPE Improved Oil Recovery Conference, Tulsa, OK, USA, 22–26 April 2006; p. SPE-100004. [Google Scholar]
- Amitabh, P.; Nitish, K.; Matthew, S.; Upali, W. Results of ASP Pilot in Mangala Field: A Success Story. In Proceedings of the SPE Improved Oil Recovery Conference, Tulsa, OK, USA, 11–13 April 2016. [Google Scholar]
- Delamaide, E.; Corlay, P.; Demin, W. Daqing Oil Field: The Success of Two Pilots Initiates First Extension of Polymer Injection in a Giant Oil Field. In Proceedings of the SPE Improved Oil Recovery Conference, Tulsa, OK, USA, 17–20 April 1994; p. SPE-27819. [Google Scholar]
- Wang, Z.; Pang, R.; Le, X.; Peng, Z.; Hu, Z.; Wang, X. Survey on Injection–Production Status and Optimized Surface Process of ASP Flooding in Industrial Pilot Area. J. Pet. Sci. Eng. 2013, 111, 178–183. [Google Scholar]
- Fenglan, W.; Zhenyu, Y.; Junzheng, W.; Yang, L.; Guangyu, C.; Shukai, P.; Ying, W. Current Status and Prospects of ASP Flooding in Daqing Oil Fields. In Proceedings of the SPE Improved Oil Recovery Conference, Muscat, Oman, 26 March 2018; p. SPE-114343. [Google Scholar]
- Karpan, V.M.; Volokitin, Y.I.; Shuster, M.Y.; Tigchelaar, W.; Chmuzh, I.V.; Koltsov, I.N.; Tkachev, I.V.; Van Batenburg, D.W.; Faber, M.J.; Skripkin, A. West Salym ASP Pilot: Project Front-End Engineering. In Proceedings of the SPE Improved Oil Recovery Conference, Tulsa, OK, USA, 12–16 April 2014; p. SPE-169157. [Google Scholar]
- Skripkin, A.G.; Kuznetsov, I.A.; Volokitin, Y.E.; Chmuzh, I.V. Experimental Studies of Oil Recovery after Alkali-Surfactant-Polymer (ASP) Flooding with West Salym Cores. In Proceedings of the SPE Russian Oil and Gas Exploration and Production Technical Conference and Exhibition, Moscow, Russia, 16–18 October 2012. [Google Scholar]
- Yekeen, N.; Manan, M.A.; Idris, A.K.; Samin, A.M.; Risal, A.R. Experimental Investigation of Minimization in Surfactant Adsorption and Improvement in Surfactant-Foam Stability in Presence of Silicon Dioxide and Aluminum Oxide Nanoparticles. J. Pet. Sci. Eng. 2017, 159, 115–134. [Google Scholar]
- Wu, Y.; Chen, W.; Dai, C.; Huang, Y.; Li, H.; Zhao, M.; He, L.; Jiao, B. Reducing Surfactant Adsorption on Rock by Silica Nanoparticles for Enhanced Oil Recovery. J. Pet. Sci. Eng. 2017, 153, 283–287. [Google Scholar]
- He, Y.; Liao, K.; Bai, J.; Fu, L.; Ma, Q.; Zhang, X.; Ren, Z.; Wang, W. Study on a Nonionic Surfactant/Nanoparticle Composite Flooding System for Enhanced Oil Recovery. ACS Omega 2021, 6, 11068–11076. [Google Scholar]
- Bealessio, B.A.; Alonso, N.A.B.; Mendes, N.J.; Sande, A.V.; Hascakir, B. A Review of Enhanced Oil Recovery (EOR) Methods Applied in Kazakhstan. Petroleum 2021, 7, 1–9. [Google Scholar]
- Sparke, S.J.; Kislyakov, P.Y.; Amirtayev, M.A. Significant Production Enhancement in Uzen Field, Kazakhstan through Surface and Subsurface Optimization. In Proceedings of the SPE Europec featured at EAGE Conference and Exhibition, Madrid, Spain, 13–16 June 2005; p. SPE-94360. [Google Scholar]
- Imanbayev, B.; Kushekov, R.; Sagyndikov, M.; Shyrakbayev, D. Feasibility Study of a Polymer Flood for the Uzen Brownfield Conditions. In Proceedings of the SPE Annual Caspian Technical Conference, Nur-Sultan, Kazakhstan, 15–17 November 2022. [Google Scholar]
- Stoll, W.M.; al Shureqi, H.; Finol, J.; Al-Harthy, S.A.; Oyemade, S.; de Kruijf, A.; van Wunnik, J.; Arkesteijn, F.; Bouwmeester, R.; Faber, M.J. Alkaline/Surfactant/Polymer Flood: From the Laboratory to the Field. SPE Reserv. Eval. Eng. 2011, 14, 702–712. [Google Scholar]
- Li, Y.; Zhang, W.; Kong, B.; Puerto, M.; Bao, X.; Sha, O.; Shen, Z.; Yang, Y.; Liu, Y.; Gu, S.; et al. Mixtures of Anionic/Cationic Surfactants: A New Approach for Enhanced Oil Recovery in Low-Salinity, High-Temperature Sandstone Reservoir. SPE J. 2016, 21, SPE-169051-PA. [Google Scholar]
- Olajire, A.A. Review of ASP EOR (Alkaline Surfactant Polymer Enhanced Oil Recovery) Technology in the Petroleum Industry: Prospects and Challenges. Energy 2014, 77, 963–982. [Google Scholar]
- Yerniyazov, D.; Yesmukhambet, M.; Kenes, R.; Bukayev, A.; Shakeel, M.; Pourafshary, P.; Musharova, D. Polymer Screening for Efficient Water Cut Reduction in a Sandstone Oilfield in Kazakhstan. Polymers 2023, 15, 1969. [Google Scholar] [CrossRef] [PubMed]
- Vargo, J.; Turner, J.; Vergnani, B.; Pitts, M.J.; Wyatt, K.; Surkalo, H.; Patterson, D. Alkaline-Surfactant-Polymer Flooding of the Cambridge Minnelusa Field. SPE Reserv. Eval. Eng. 2000, 3, 552–558. [Google Scholar] [CrossRef]
- Olayiwola, S.O.; Dejam, M. A Comprehensive Review on Interaction of Nanoparticles with Low Salinity Water and Surfactant for Enhanced Oil Recovery in Sandstone and Carbonate Reservoirs. Fuel 2019, 241, 1045–1057. [Google Scholar] [CrossRef]
- Khorram Ghahfarokhi, A.; Dadashi, A.; Daryasafar, A.; Moghadasi, J. Feasibility Study of New Natural Leaf-Derived Surfactants on the IFT in an Oil–Aqueous System: Experimental Investigation. J. Pet. Explor. Prod. Technol. 2015, 5, 375–382. [Google Scholar] [CrossRef]
- Zhao, J.; Torabi, F.; Yang, J. The Role of Emulsification and IFT Reduction in Recovering Heavy Oil during Alkaline-surfactant-Assisted CO2 Foam Flooding: An Experimental Study. Fuel 2022, 313, 122942. [Google Scholar] [CrossRef]
- Kumar, N.; Mandal, A. Surfactant Stabilized Oil-in-Water Nanoemulsion: Stability, Interfacial Tension, and Rheology Study for Enhanced Oil Recovery Application. Energy Fuels 2018, 32, 6452–6466. [Google Scholar] [CrossRef]
- Dashtaki, S.R.M.; Ali, J.A.; Manshad, A.K.; Nowrouzi, I.; Mohammadi, A.H.; Keshavarz, A. Experimental Investigation of the Effect of Vitagnus Plant Extract on Enhanced Oil Recovery Process Using Interfacial Tension (IFT) Reduction and Wettability Alteration Mechanisms. J. Pet. Explor. Prod. Technol. 2020, 10, 2895–2905. [Google Scholar] [CrossRef]
- Saxena, N.; Kumar, A.; Mandal, A. Adsorption Analysis of Natural Anionic Surfactant for Enhanced Oil Recovery: The Role of Mineralogy, Salinity, Alkalinity and Nanoparticles. J. Pet. Sci. Eng. 2019, 173, 1264–1283. [Google Scholar] [CrossRef]
Disclaimer/Publisher’s Note: The statements, opinions and data contained in all publications are solely those of the individual author(s) and contributor(s) and not of MDPI and/or the editor(s). MDPI and/or the editor(s) disclaim responsibility for any injury to people or property resulting from any ideas, methods, instructions or products referred to in the content. |
© 2023 by the authors. Licensee MDPI, Basel, Switzerland. This article is an open access article distributed under the terms and conditions of the Creative Commons Attribution (CC BY) license (https://creativecommons.org/licenses/by/4.0/).