Abstract
The definition of rigid floating piles in engineering applications remains ambiguous. This paper develops a numerical model of piled embankments and the modeling method is verified through engineering cases. Utilizing this model, the critical bearing capacity of the foundation for rigid floating piles is firstly determined to be approximately 150 kPa. Subsequent parametric studies show that soil arching in a rigid floating piled embankment begins to occur when the ratio of the embankment height to the clear pile spacing H/(s − a) ≥ 1.6. However, plastic failure does not occur in rigid floating piled embankments due to the weaker foundation, indicating that soil arching cannot fully develop. Finally, factors of the embankment fill properties are examined and it is shown that the large friction angle and high cohesion greatly enhance soil arching and reduce settlement in the embankment. The vertical stress above the subsoil decreased by 34.9% with an increase in the friction angle from 20° to 40°. Also shown is that the increase in the cohesion from 1 kPa to 7 kPa reduced the settlement on the top of and the base of embankment by approximately 72% and 58%, respectively. It has also been found that rigid floating piles rely on end resistance and skin friction to sustain the superimposed load.
1. Introduction
Piled embankments, as an economically effective ground improvement technique, are widely utilized in constructing highways and railways in areas with soft soils [1,2]. The piles in a piled embankment system typically penetrate through the soft soil stratum and are embedded in a stronger underlying bedrock for load-bearing purposes [3,4,5,6,7]. However, a floating piled embankment is a more cost-effective choice in regions with thicker soft soil. The foundation bearing capacity of the soil stratum at the pile tip is a primary factor distinguishing different pile types [8,9,10]. In previous studies [11,12], floating piles have been classified as flexible or rigid based on the soil stratum where the pile tip is situated. Still, an accurate determination of the critical value for the foundation capacity of rigid floating piles has not been established.
Rigid floating piles are embedded in moderately stiff soil, and research [11] has found that they provide a good balance between cost effectiveness and load-bearing capacity, effectively improving the performance of the supported embankment above. However, there is currently no uniform design guideline specifically for rigid floating piled embankments. Both French [13] and German [14] standards consider that the design methods for end-bearing piles are not applicable to floating piles. Satibi [15] and Van Eekelen et al. [16] have proposed further research on the design of embankments supported by floating piles. Cao et al. [17], as well as Pan et al. [18], conducted field tests to monitor settlement and earth pressure during filling and the post-construction placement stages of embankment supported by floating piles. Model experiments conducted by Phutthananon et al. [19] and full-scale tests conducted by Zhang et al. [20] demonstrated that the pile cap of floating piles significantly improves the differential settlement of embankments and the evolution characteristics of the stress. Pham [21] proposed a design method for embankments supported by floating piles. However, the studies mentioned above did not differentiate the bearing capacity of the soil stratum where the pile tips are located. Despite some comparative studies between floating piles and end-bearing piles (e.g., King et al. [22]; Yadav et al. [23]; Shen et al. [24]; Zhang et al. [25]; Reshma et al. [26]), the load-bearing mechanism of embankments supported by rigid floating piles still requires further investigation.
The soil arching effect is a crucial component of the load transfer mechanism in piled embankments. It was initially confirmed through Terzaghi’s [27] trapdoor test. Various soil arching calculation models have been developed as a result of the continuous development of science and computational technology. Rui et al. [28] categorized the theory models of soil arching into three types: the equal settling plane model presented by Terzaghi [27], the limit equilibrium model presented by Hewlett and Randolph [29], and the wedge and pyramid model described by Carlsson [30] and Guido [31]. Additionally, the theoretical model of soil arching with morphological changes, presented by Iglesia [32,33,34], has also gained increasing attention. However, most of these models focus on end-bearing piles, and few researchers have considered soil arching in embankments supported by floating piles. The conditions under which it occurs remain unclear. Previous studies [11] have qualitatively analyzed the soil arching of rigid floating piles based on engineering cases but have not investigated the influential factors.
In this paper, the differentiation of pile types based on the foundation bearing capacity of the soil stratum at the pile tip has been innovatively proposed. This study aims to quantitatively determine the critical value of the foundation load-bearing capacity that distinguishes between rigid and flexible floating piles using three-dimensional finite element methods. It investigates the development pattern of soil arching in embankments supported by rigid floating piles, identifies the conditions under which the soil arching effect occurs, and analyzes the influential factors. The findings of this study clearly distinguish between flexible floating piles and rigid floating piles, the load transfer mechanism of embankments supported by rigid floating piles is revealed, and a new solution is provided for highway and railroad construction in deep soft soil areas.
2. Numerical Modeling
The finite element analysis was carried out using ABAQUS (version 2020) [35] software. Due to the symmetry of the piled embankment system, the present study employed a three-dimensional columnar model. The finite element model consisted of a 2 × 2 rectangular arrangement of piles to ensure the generation of three-dimensional soil arching effects in space.
2.1. Model Discretization
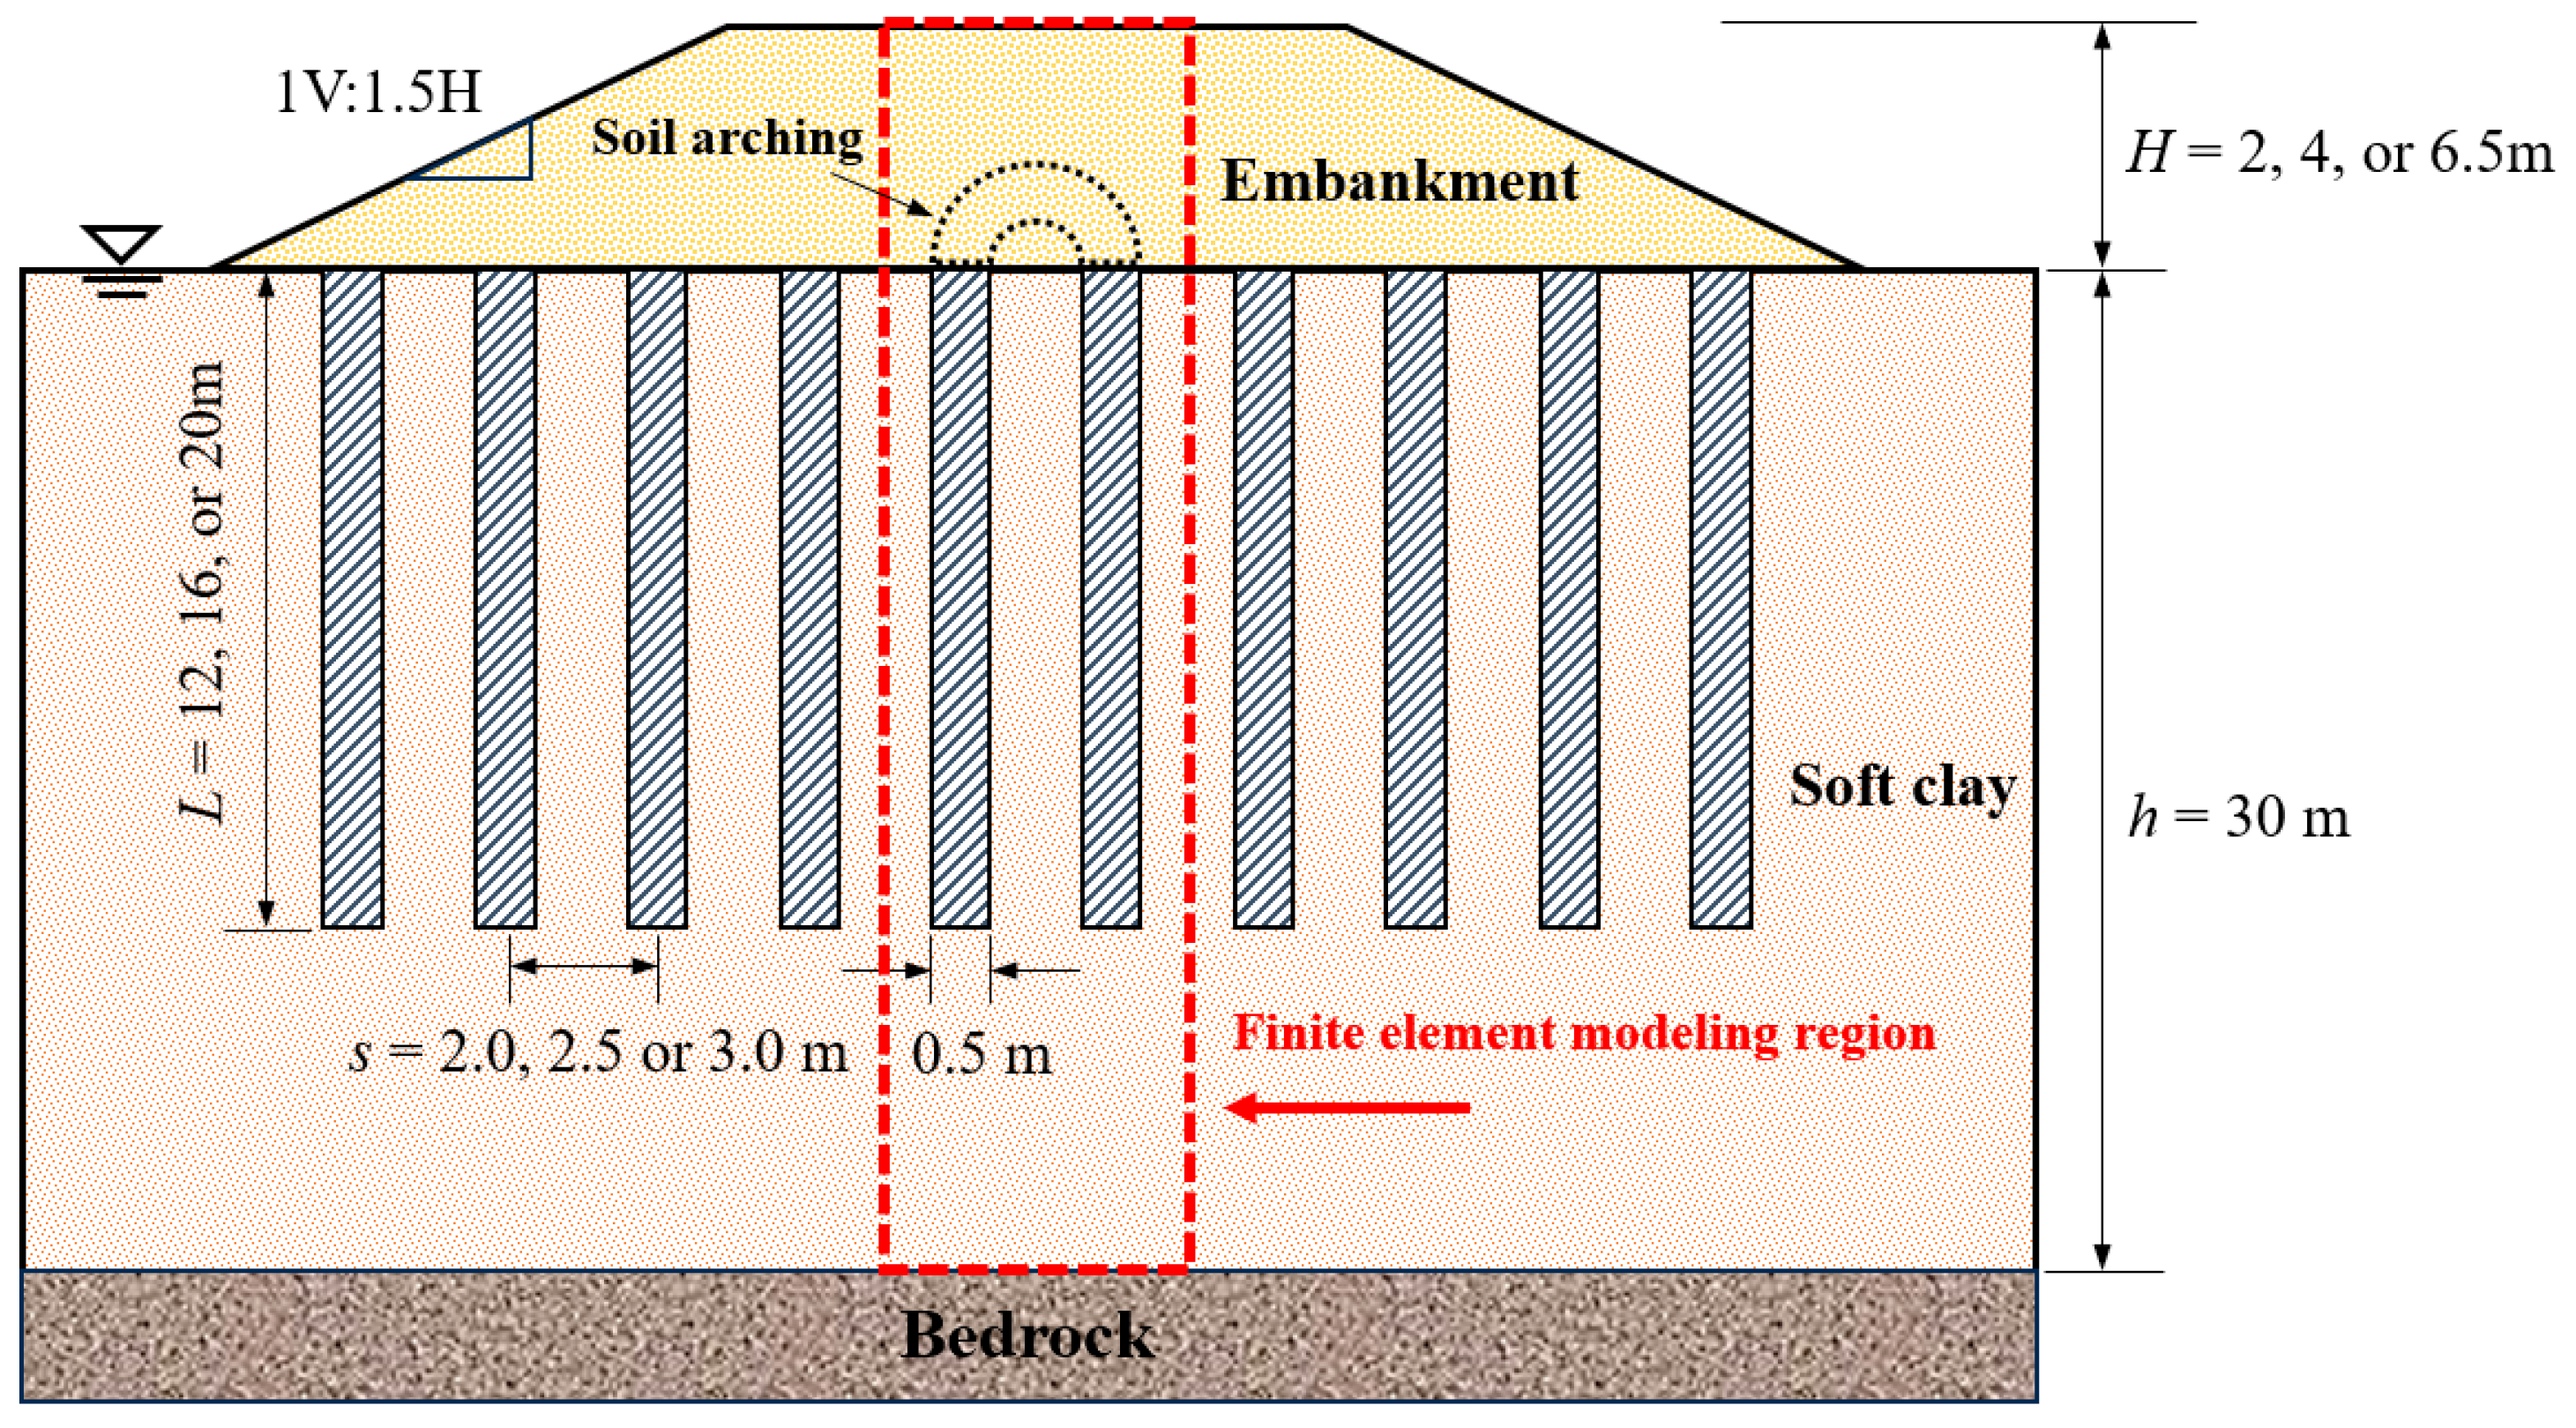
A pile-supported highway embankment with a slope of 1 V:1.5 H is assumed to be constructed on a 30 m thick subsoil (see Figure 1) [36]. The embankment height (H), pile spacing (s), and pile length (L) are considered variables in this paper and have been annotated in the figure. The upper surface of the piles is flush with the subsoil surface, and the diameter (a) of the piles is 0.5 m, arranged in a square arrangement. Taking H = 4 m, s = 2.5 m, and L = 16 m, respectively, as the standard conditions, the material parameters of embankment fill and piles are shown in Table 1.
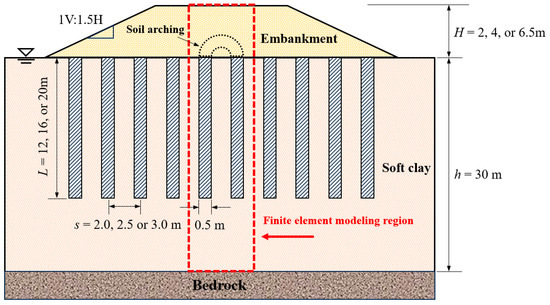
Figure 1.
The profile of a piled embankment.

Table 1.
Parameters of embankment fill and pile.
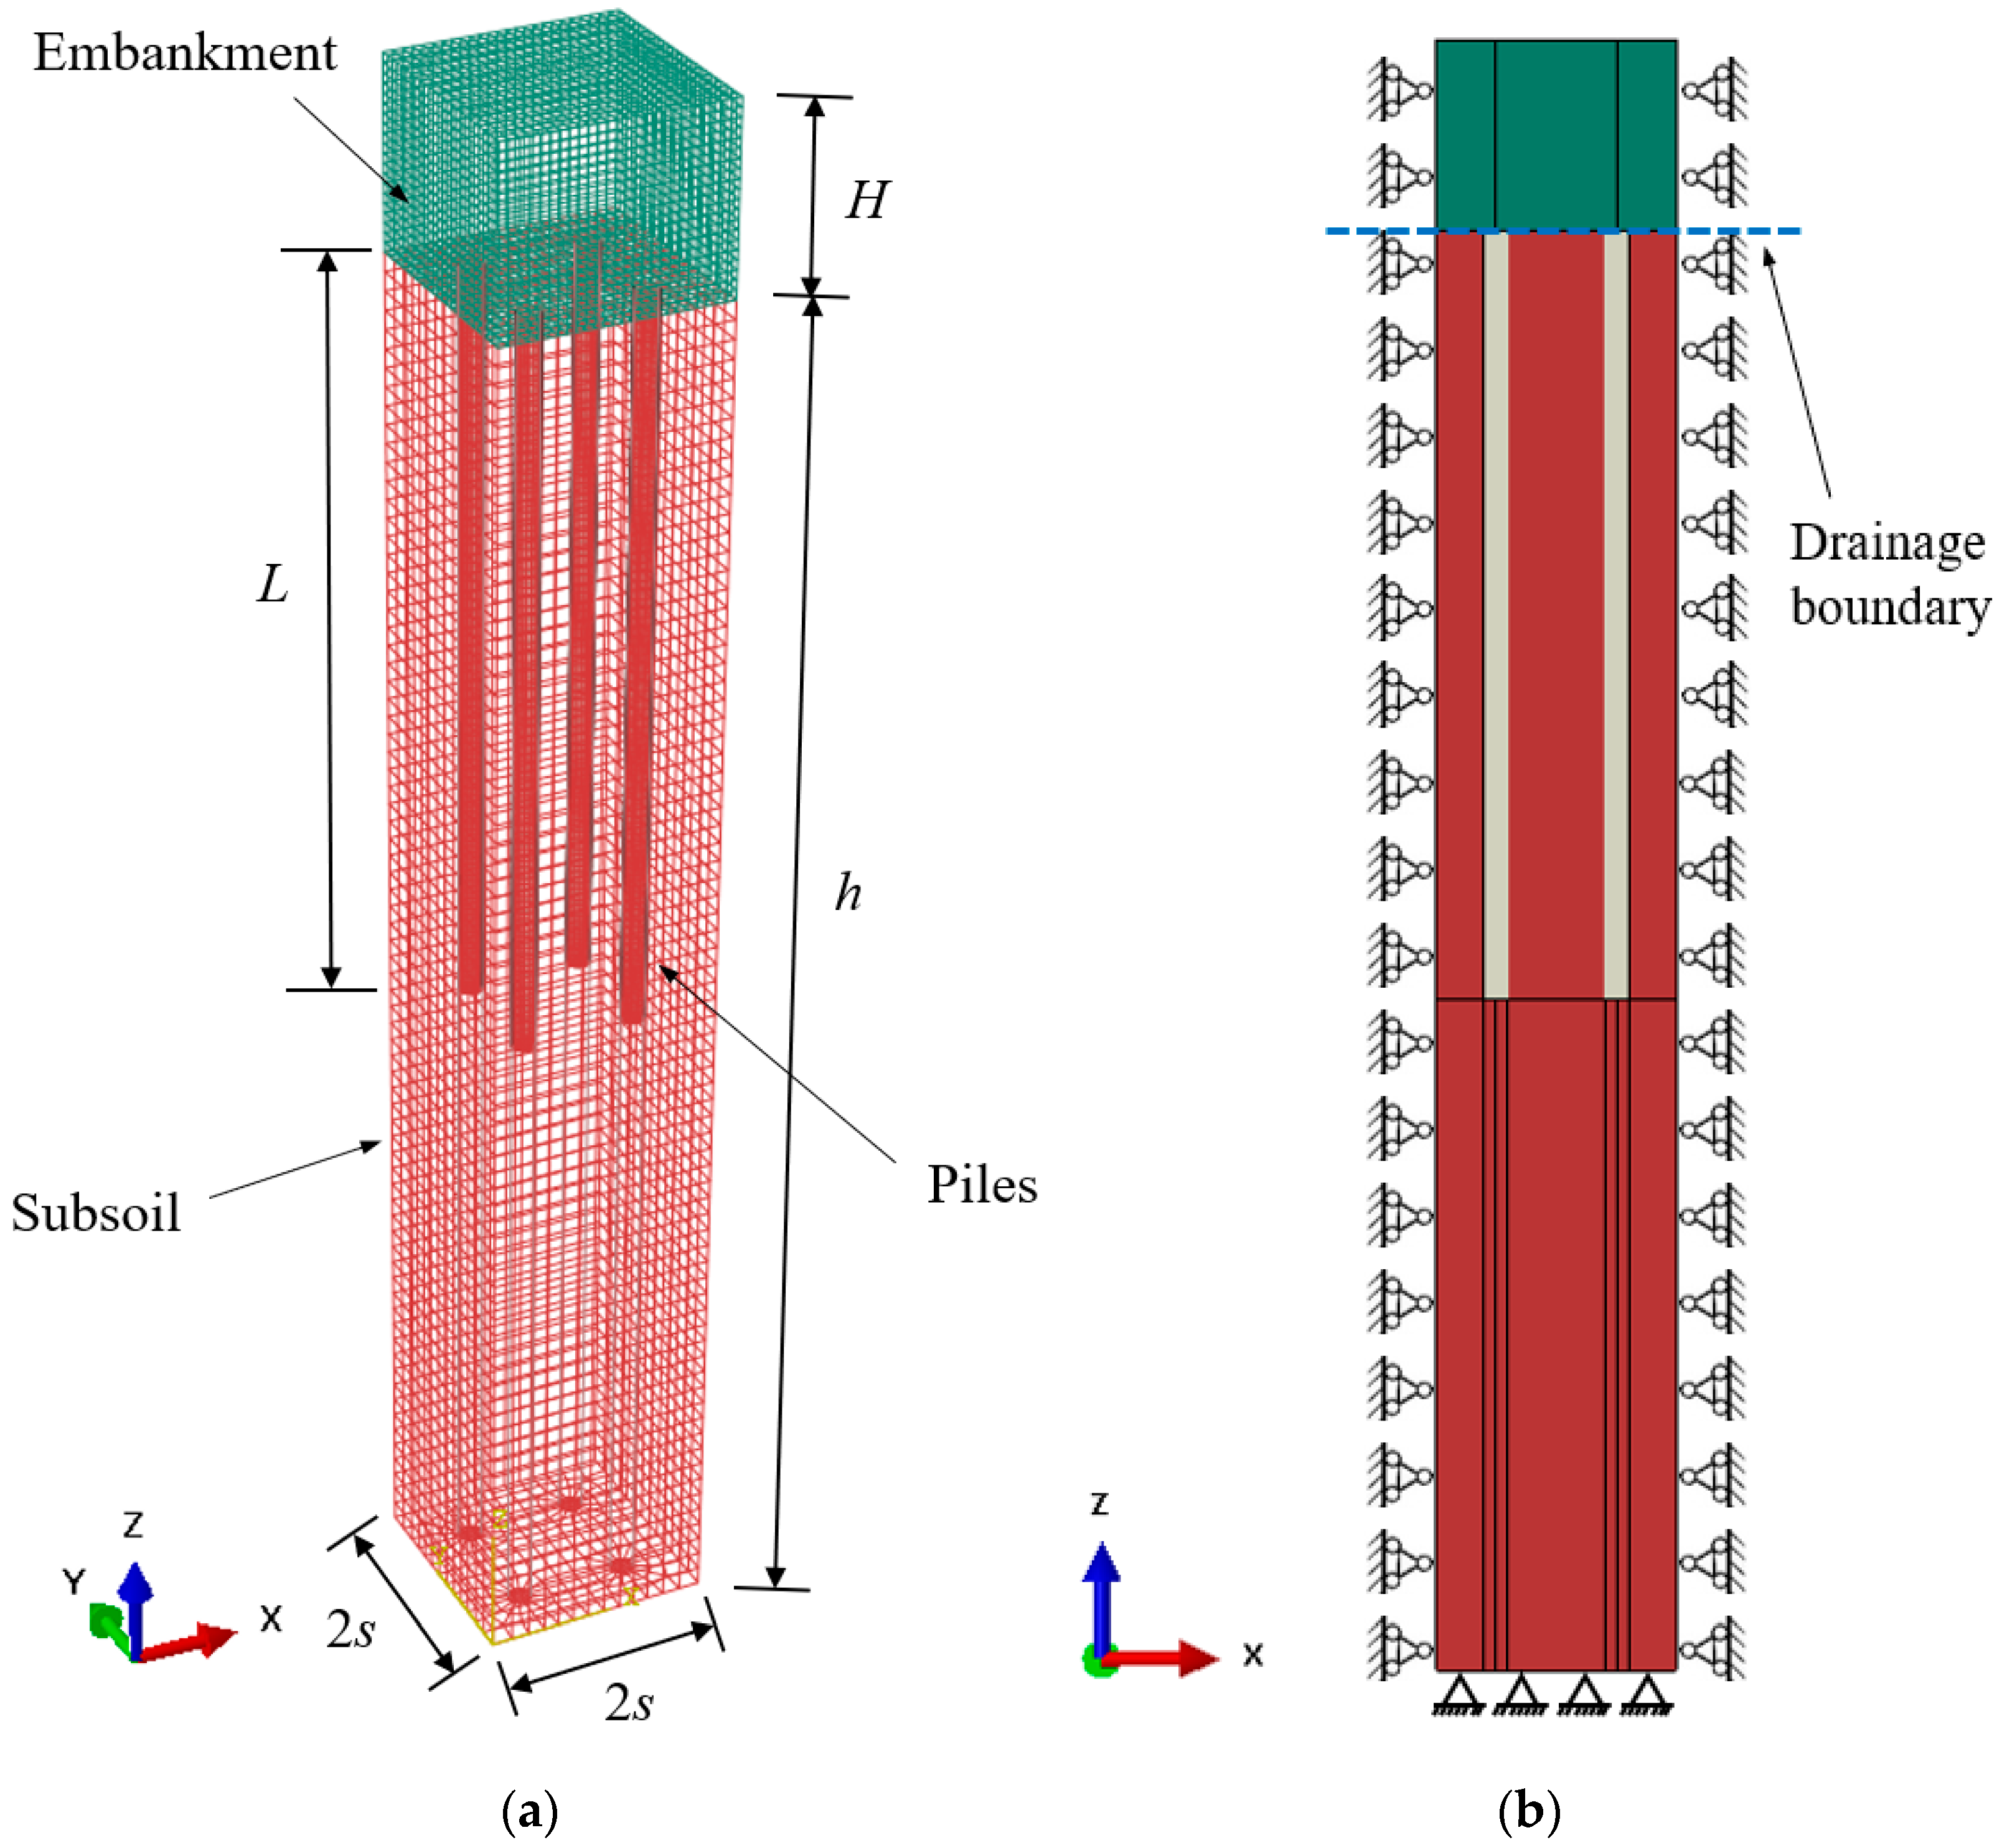
Figure 2a shows the finite element mesh, comprising embankment fill, piles, and subsoil, modeled from the red-boxed region shown in Figure 1. In the finite element model, the piles are assumed to be impermeable and are represented using eight-node linear brick (C3D8) elements. The subsoil and embankment fill are considered permeable, with an initial permeability coefficient assigned using eight-node brick with trilinear displacement and trilinear pore pressure (C3D8P) elements. The groundwater level is situated at the surface of the subsoil. The plastic deformation of the pile is not taken into account, and a linear elastic constitutive model is used for its simulation. The subsoil is considered to undergo consolidation, and the Modified Cam-Clay (MCC) model is adopted. The embankment fill is modeled using the Mohr–Coulomb (MC) model.

Figure 2.
The finite element of piled embankment: (a) mesh; (b) boundary.
2.2. Boundary Condition
In order to minimize the influence of boundary effects, the finite element model employs a width equal to twice the pile spacing 2 s in both horizontal directions (in the direction of traffic and perpendicular to the direction of traffic). At the bottom of the finite element model (z = 0 plane), the displacements in the x, y, and z directions are set to zero. The planes perpendicular to the x-axis and y-axis are fixed in their respective displacement directions. The analysis steps of the model include a geostatic stress balance, embankment construction, and subsoil consolidation. A free drainage model is established for the drainage boundary conditions by imposing zero pore pressure boundary conditions at the groundwater level surface in the consolidation analysis step. The vertical boundaries of the finite element model are defined as impermeable. The detailed boundary conditions are shown in Figure 2b.
2.3. Interaction
The bearing capacity of rigid floating piles depends on lateral skin friction, which is due to the weaker soil stratum where the pile tip is located. Therefore, the pile–soil interaction has a significant effect on the load transfer mechanism of the embankment supported by rigid floating piles. In the model, the contact type of the pile and subsoil is surface-to-surface. The interaction property is defined using Coulomb friction for the tangential behavior and the “hard” contact definition for the normal behavior, with no separation allowed after contact. The friction coefficient is represented by , where is the effective friction angle of the subsoil.
ABAQUS [35] provides an analysis for coupling pore fluid flow and stress to simulate the consolidation of subsoil. In transient analysis, the accuracy of integrating pore pressure over time is crucial. If the initial time step is too small, it can cause abnormal fluctuations in pore pressure, leading to simulation distortion or convergence difficulties. For saturated steady-state seepage, the minimum allowable value for the initial time step is
Assuming that the seepage of pore water in this study follows Darcy’s law and the soil particles are incompressible, the minimum time step can be expressed as
where is the time increment step, s; is the specific weight of the liquid, kN/m3; E is the Young’s modulus of the soil, kPa; k is the permeability coefficient, m/s; is the velocity of the pore fluid, m/s; is the velocity coefficient according to the Forchheimer permeability law; is the bulk modulus of the skeleton, kPa; and is the typical element size, m.
2.4. Model Validation
The proposed modeling approach was validated through two piled embankment engineering cases, utilizing field-measured parameters for the model. A comparison was made between the finite element results and field data, including soil pressures at the pile top and subsoil surface, settlement, and lateral displacement.
2.4.1. A Trial Embankment in Rio de Janeiro
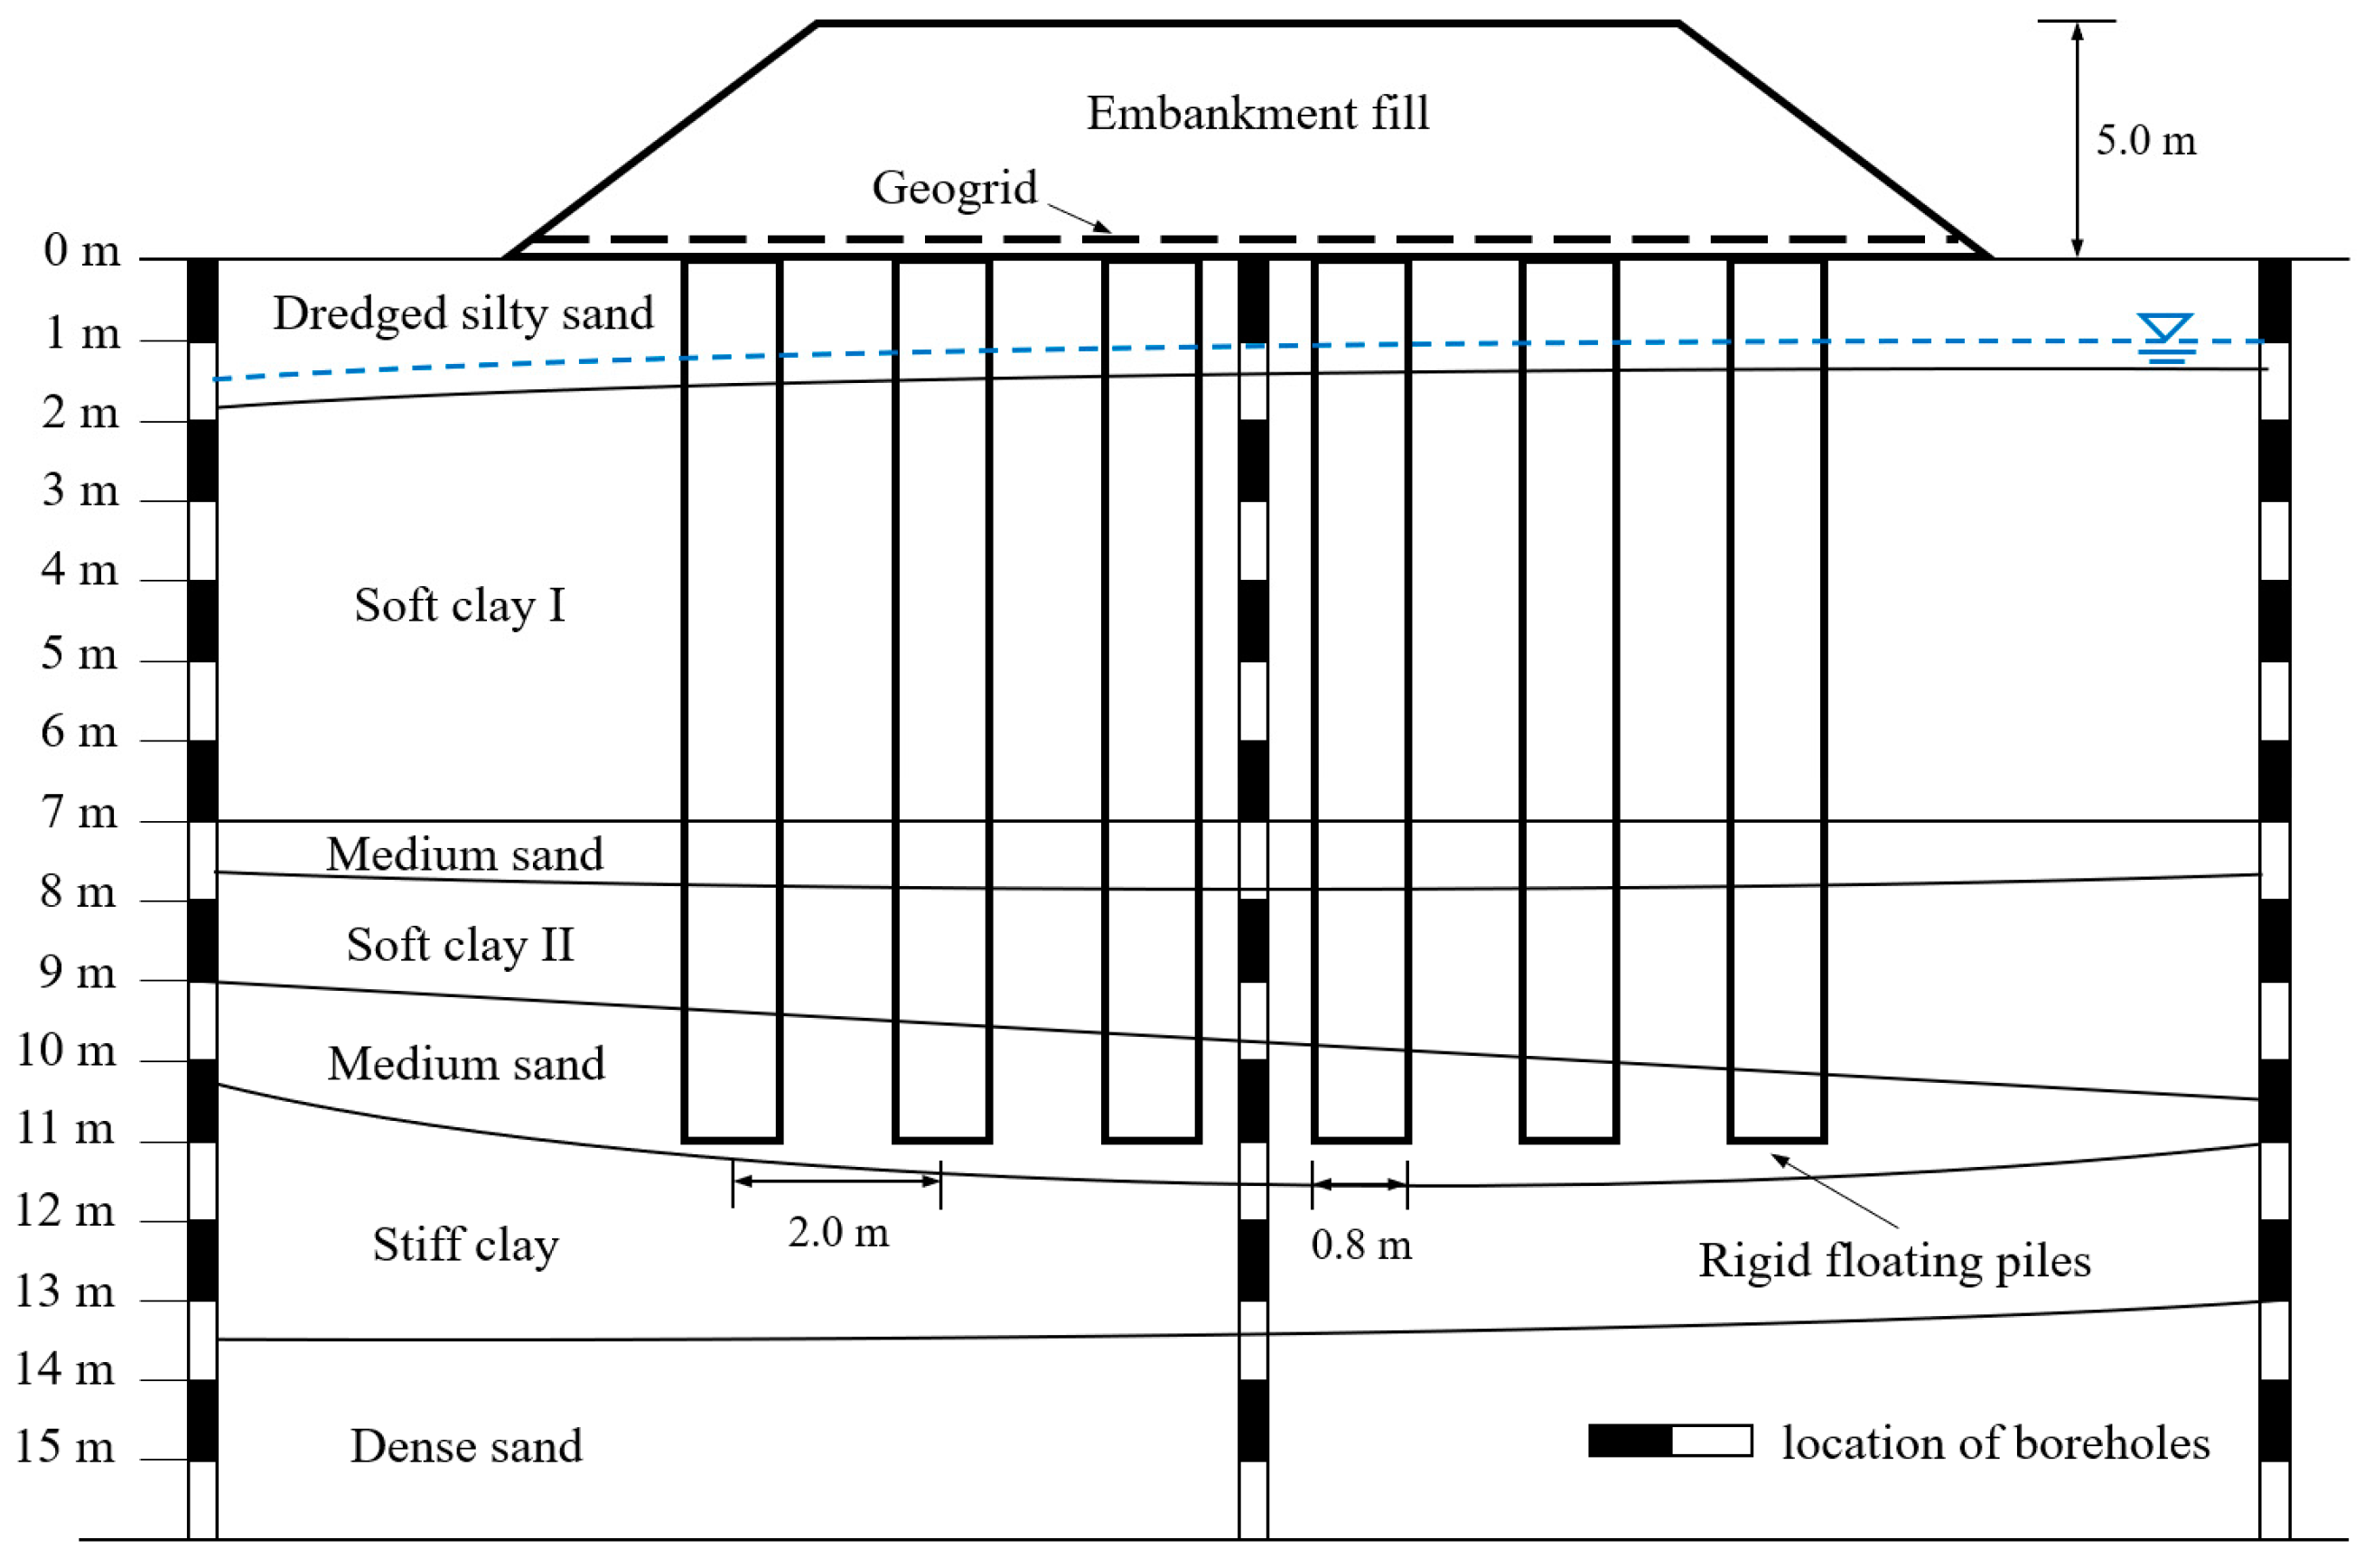
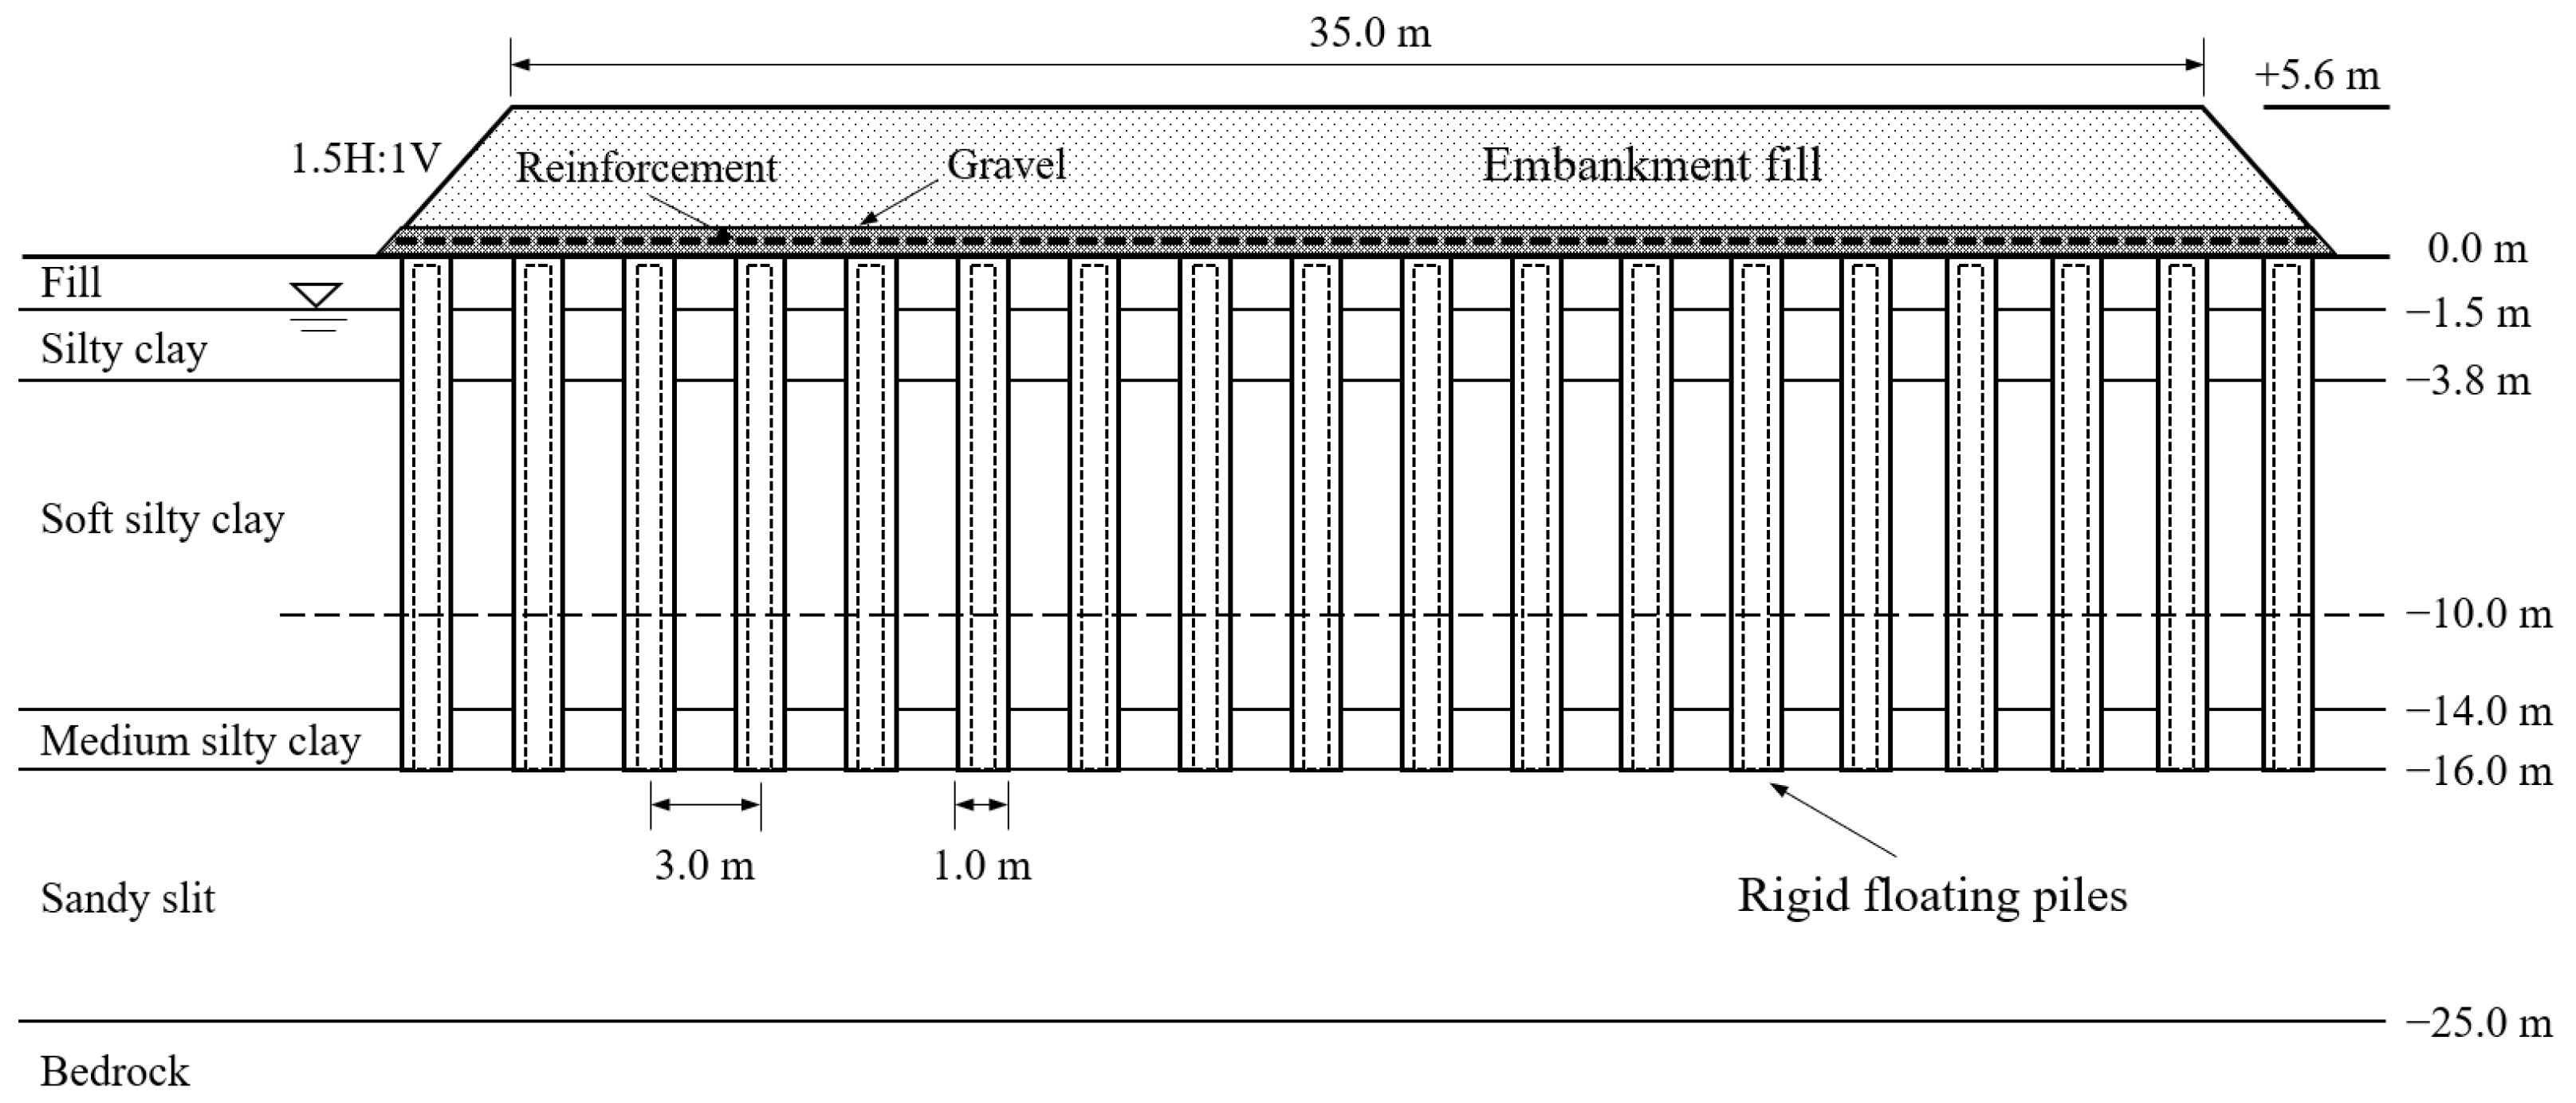
A trial embankment construction was performed at a test area in the stockyard of ThyssenKrupp Company, located in Rio de Janeiro, Brazil. The height of the test embankment was 5.35 m and the total vertical stress produced was approximately 150 kPa. The piles had a diameter of 0.8 m and a length of 11 m and were arranged in a square with a 2 m pile spacing (see Figure 3). The underground conditions of the test area were explored by means of three borings. The subsoil was found to consist of soft clay, medium sand, stiff clay, and dense sand. The pile tip was situated within the medium sand stratum, classifying it as a rigid floating pile. The detailed parameters can be found in Almeida et al. [37].
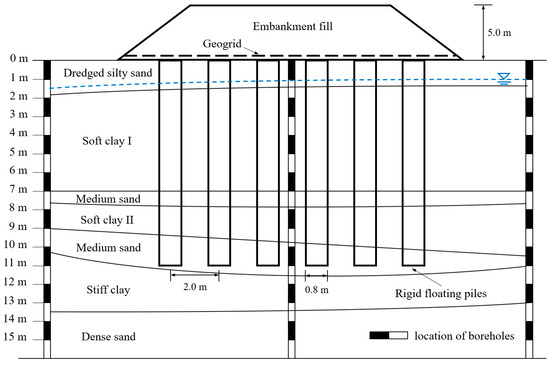
Figure 3.
Profile of the embankment and borehole locations in in situ tests.
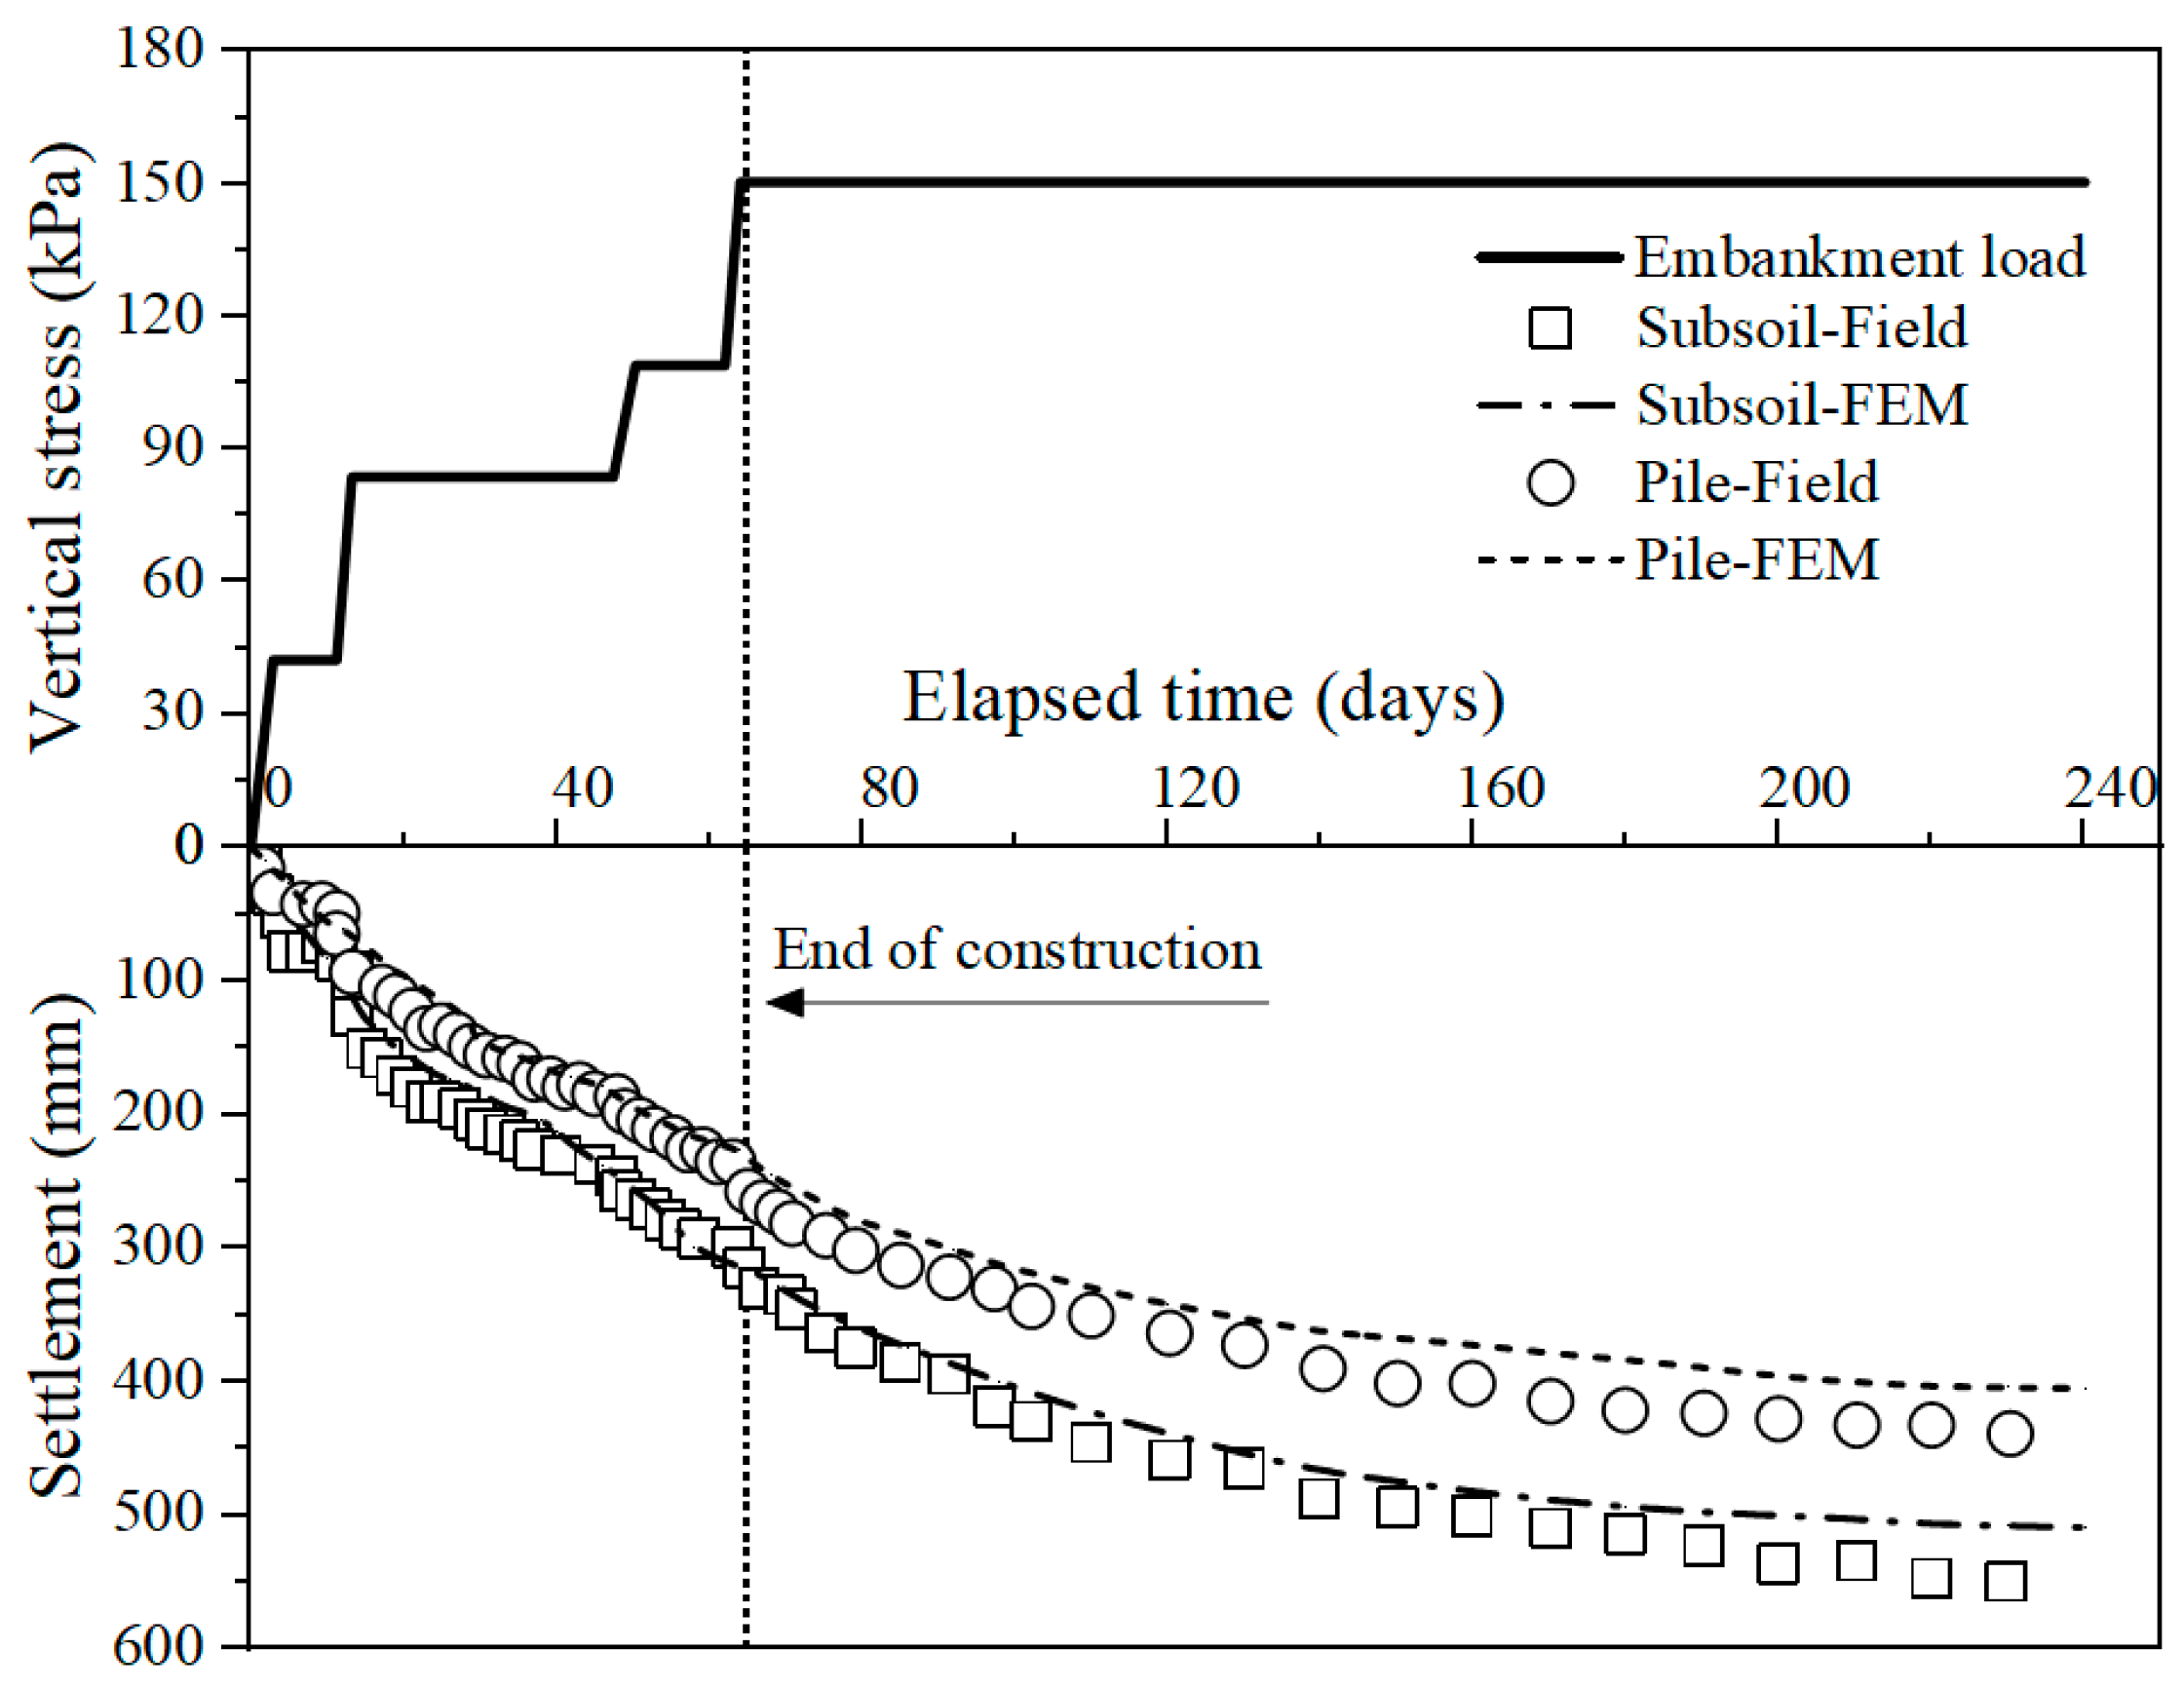
Field monitoring of stress and deformation was conducted for 240 days after the construction of the embankment began. Figure 4 compares the settlement variations over time at the pile top and the surface of the subsoil in the center of the embankment. It has been found that the finite element analysis results show good agreement with the field data. At completion of embankment construction (65 days), the field monitoring recorded settlements of 258 mm and 318 mm at the pile top and the subsoil surface, respectively. In the finite element simulation, these values were 225 mm and 309 mm, with a maximum error of less than 15%.
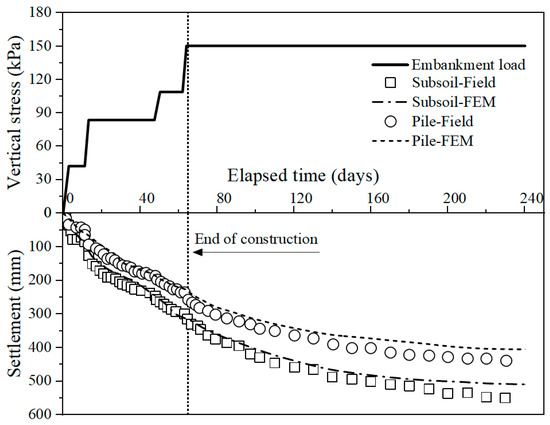
Figure 4.
Settlements on the top of the pile and subsoil surface.
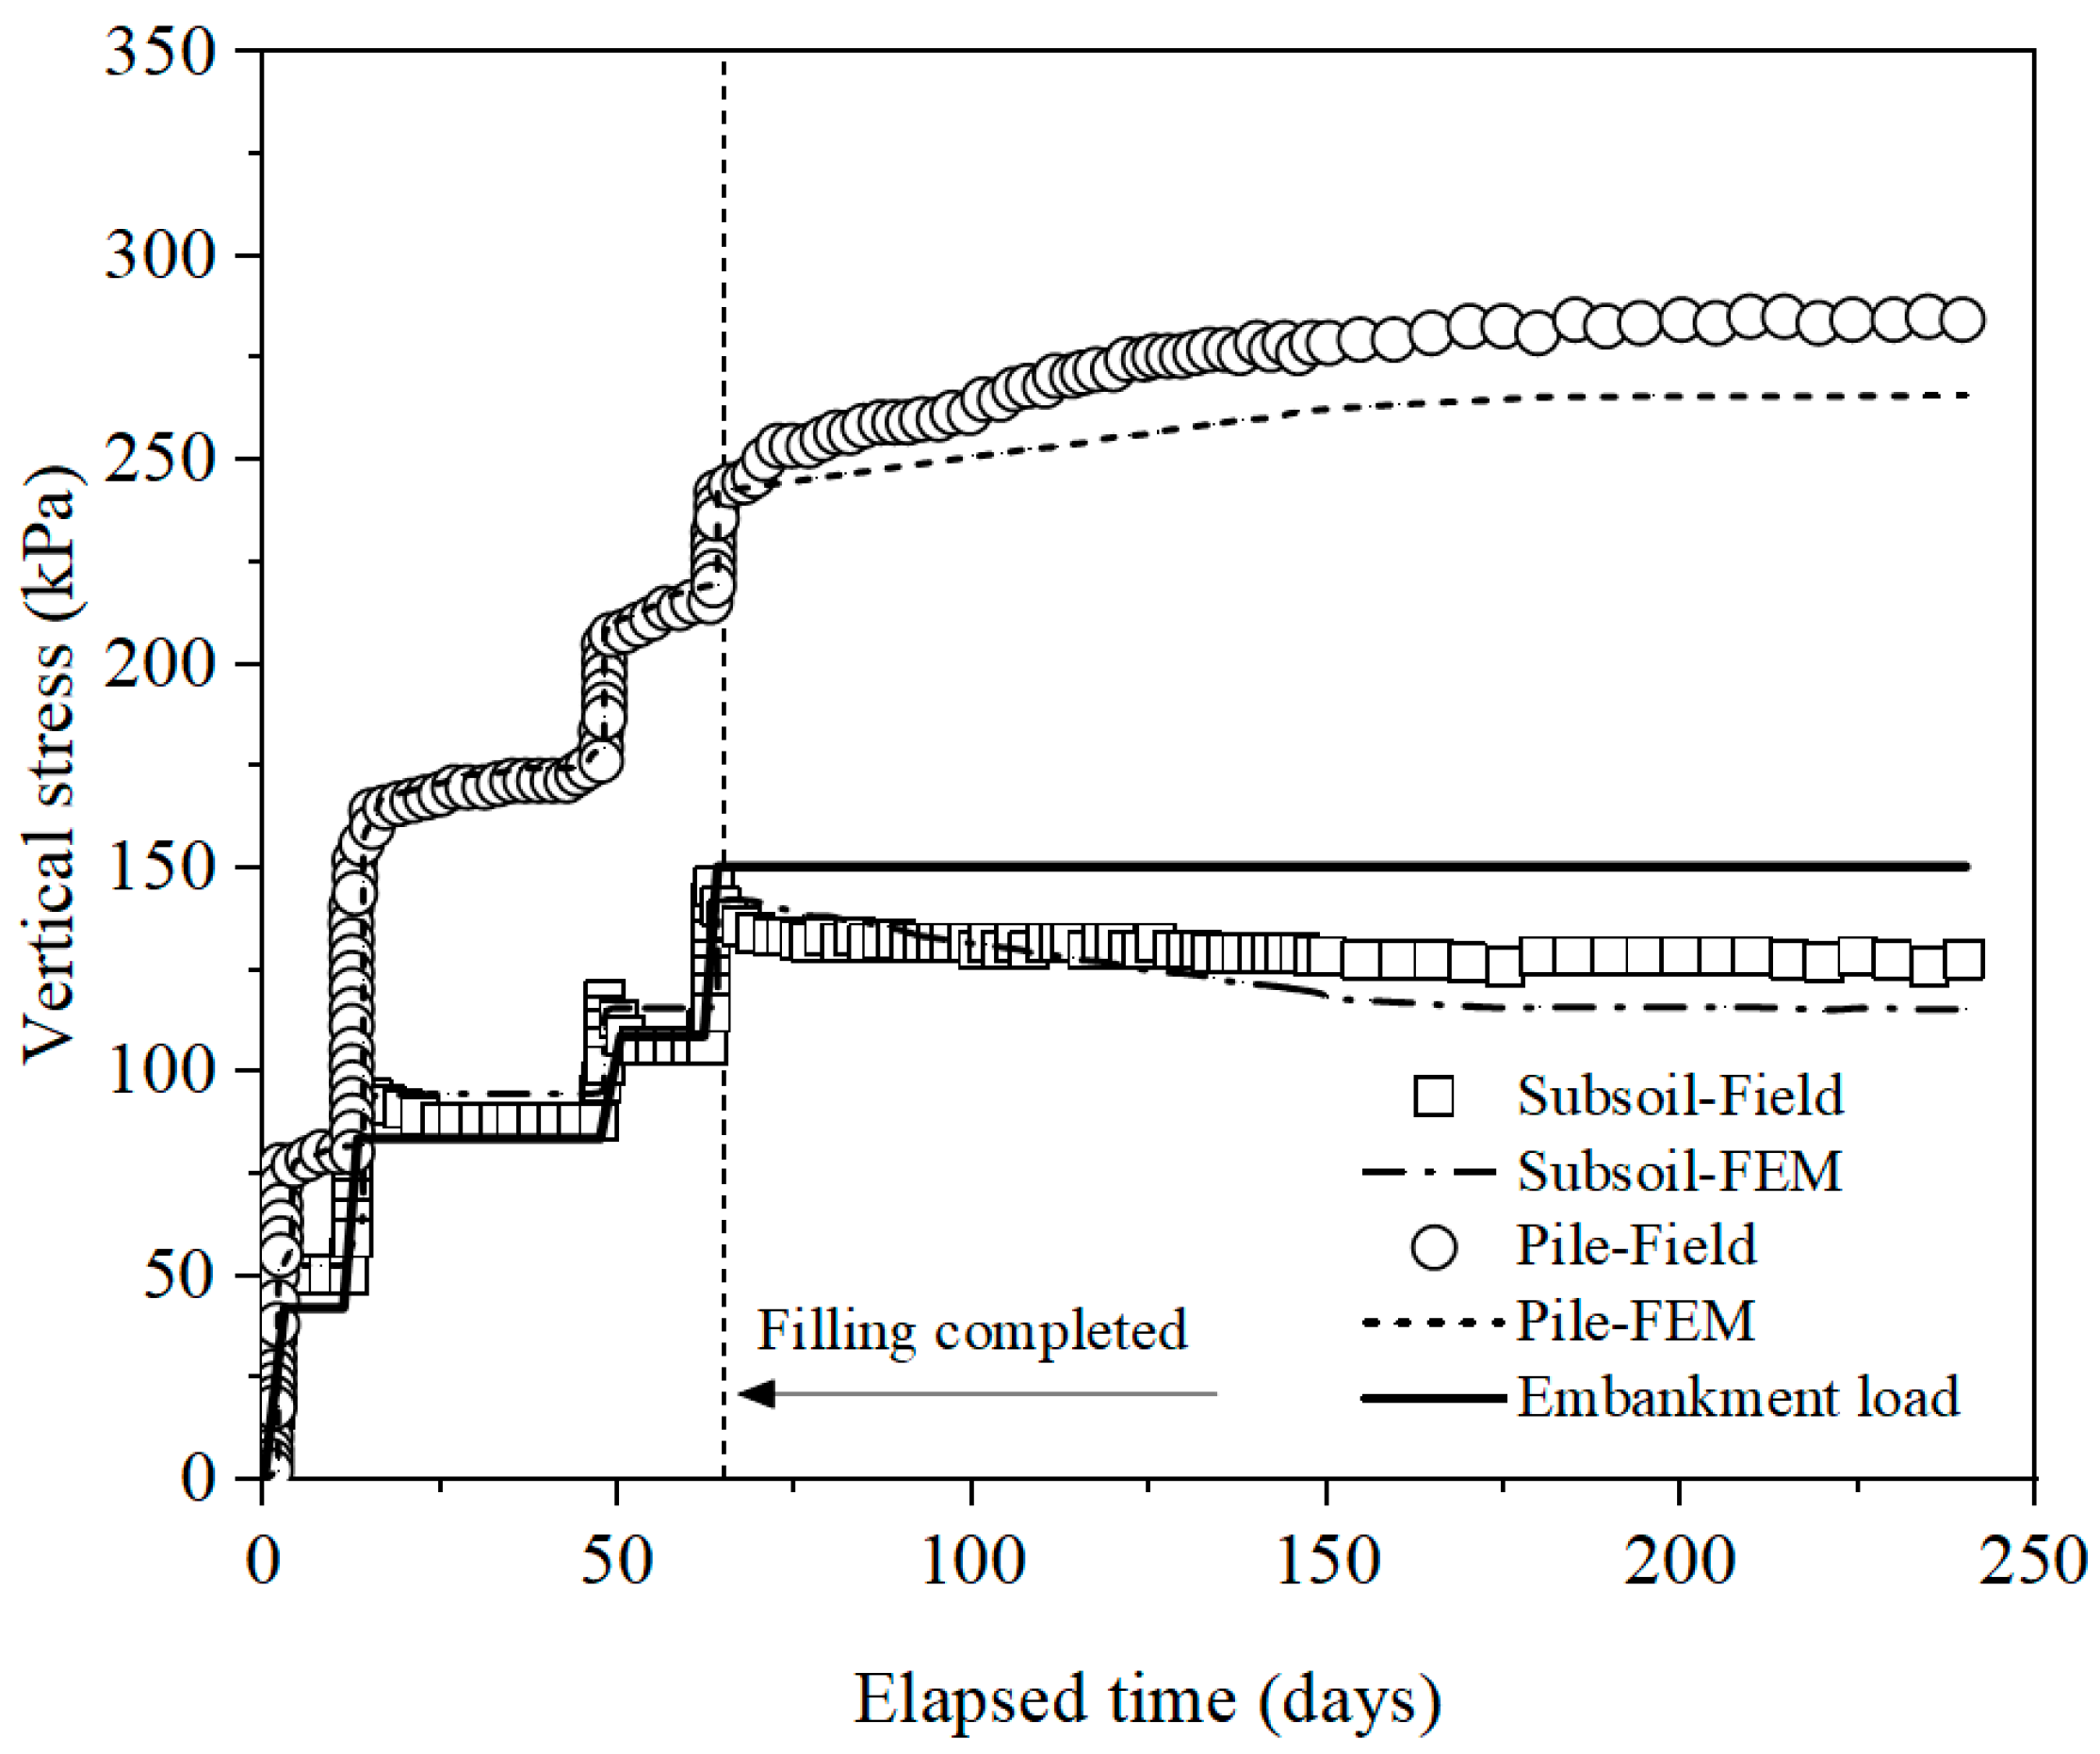
Figure 5 illustrates the temporal evolution of vertical stress at the pile top and subsoil surface in the center of the embankment. It was found that the finite element analysis overestimated the vertical stress above the pile top and at the soil surface during the embankment construction phase, while it underestimated the vertical stress during the consolidation phase after the completion of embankment construction. Nevertheless, the finite element calculations captured the realistic stress growth trend, with a maximum error of only 10.6%.
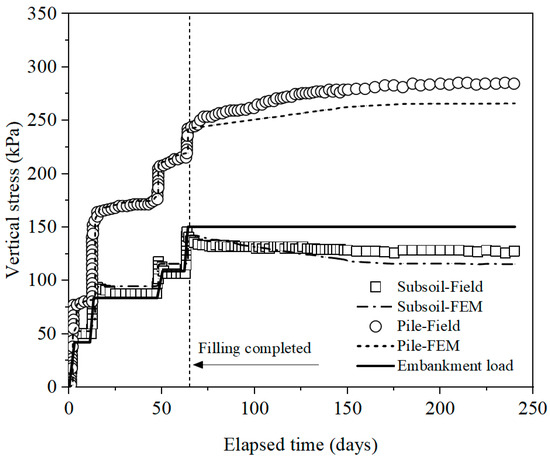
Figure 5.
Vertical stress acting on the top of the pile and subsoil over time.
2.4.2. A Highway Embankment in Shanghai
The piled highway embankment is located in a northern suburb of Shanghai, China. The embankment was 5.6 m high with a 1 V:1.5 H side slope. The fill material consisted mainly of pulverized fuel ash with an average unit weight of 18.5 kN/m3. A profile of the embankment is shown in Figure 6. The embankment is supported by rigid floating piles with 1 m diameter and 16 m length. The Young’s modulus of the pile is 20 GPa, and Poisson’s ratio is 0.2. The pile ends in a medium–stiff sandy silt stratum. The material parameters for each soil stratum can be found in Liu et al. [38].

Figure 6.
Cross section of the embankment.
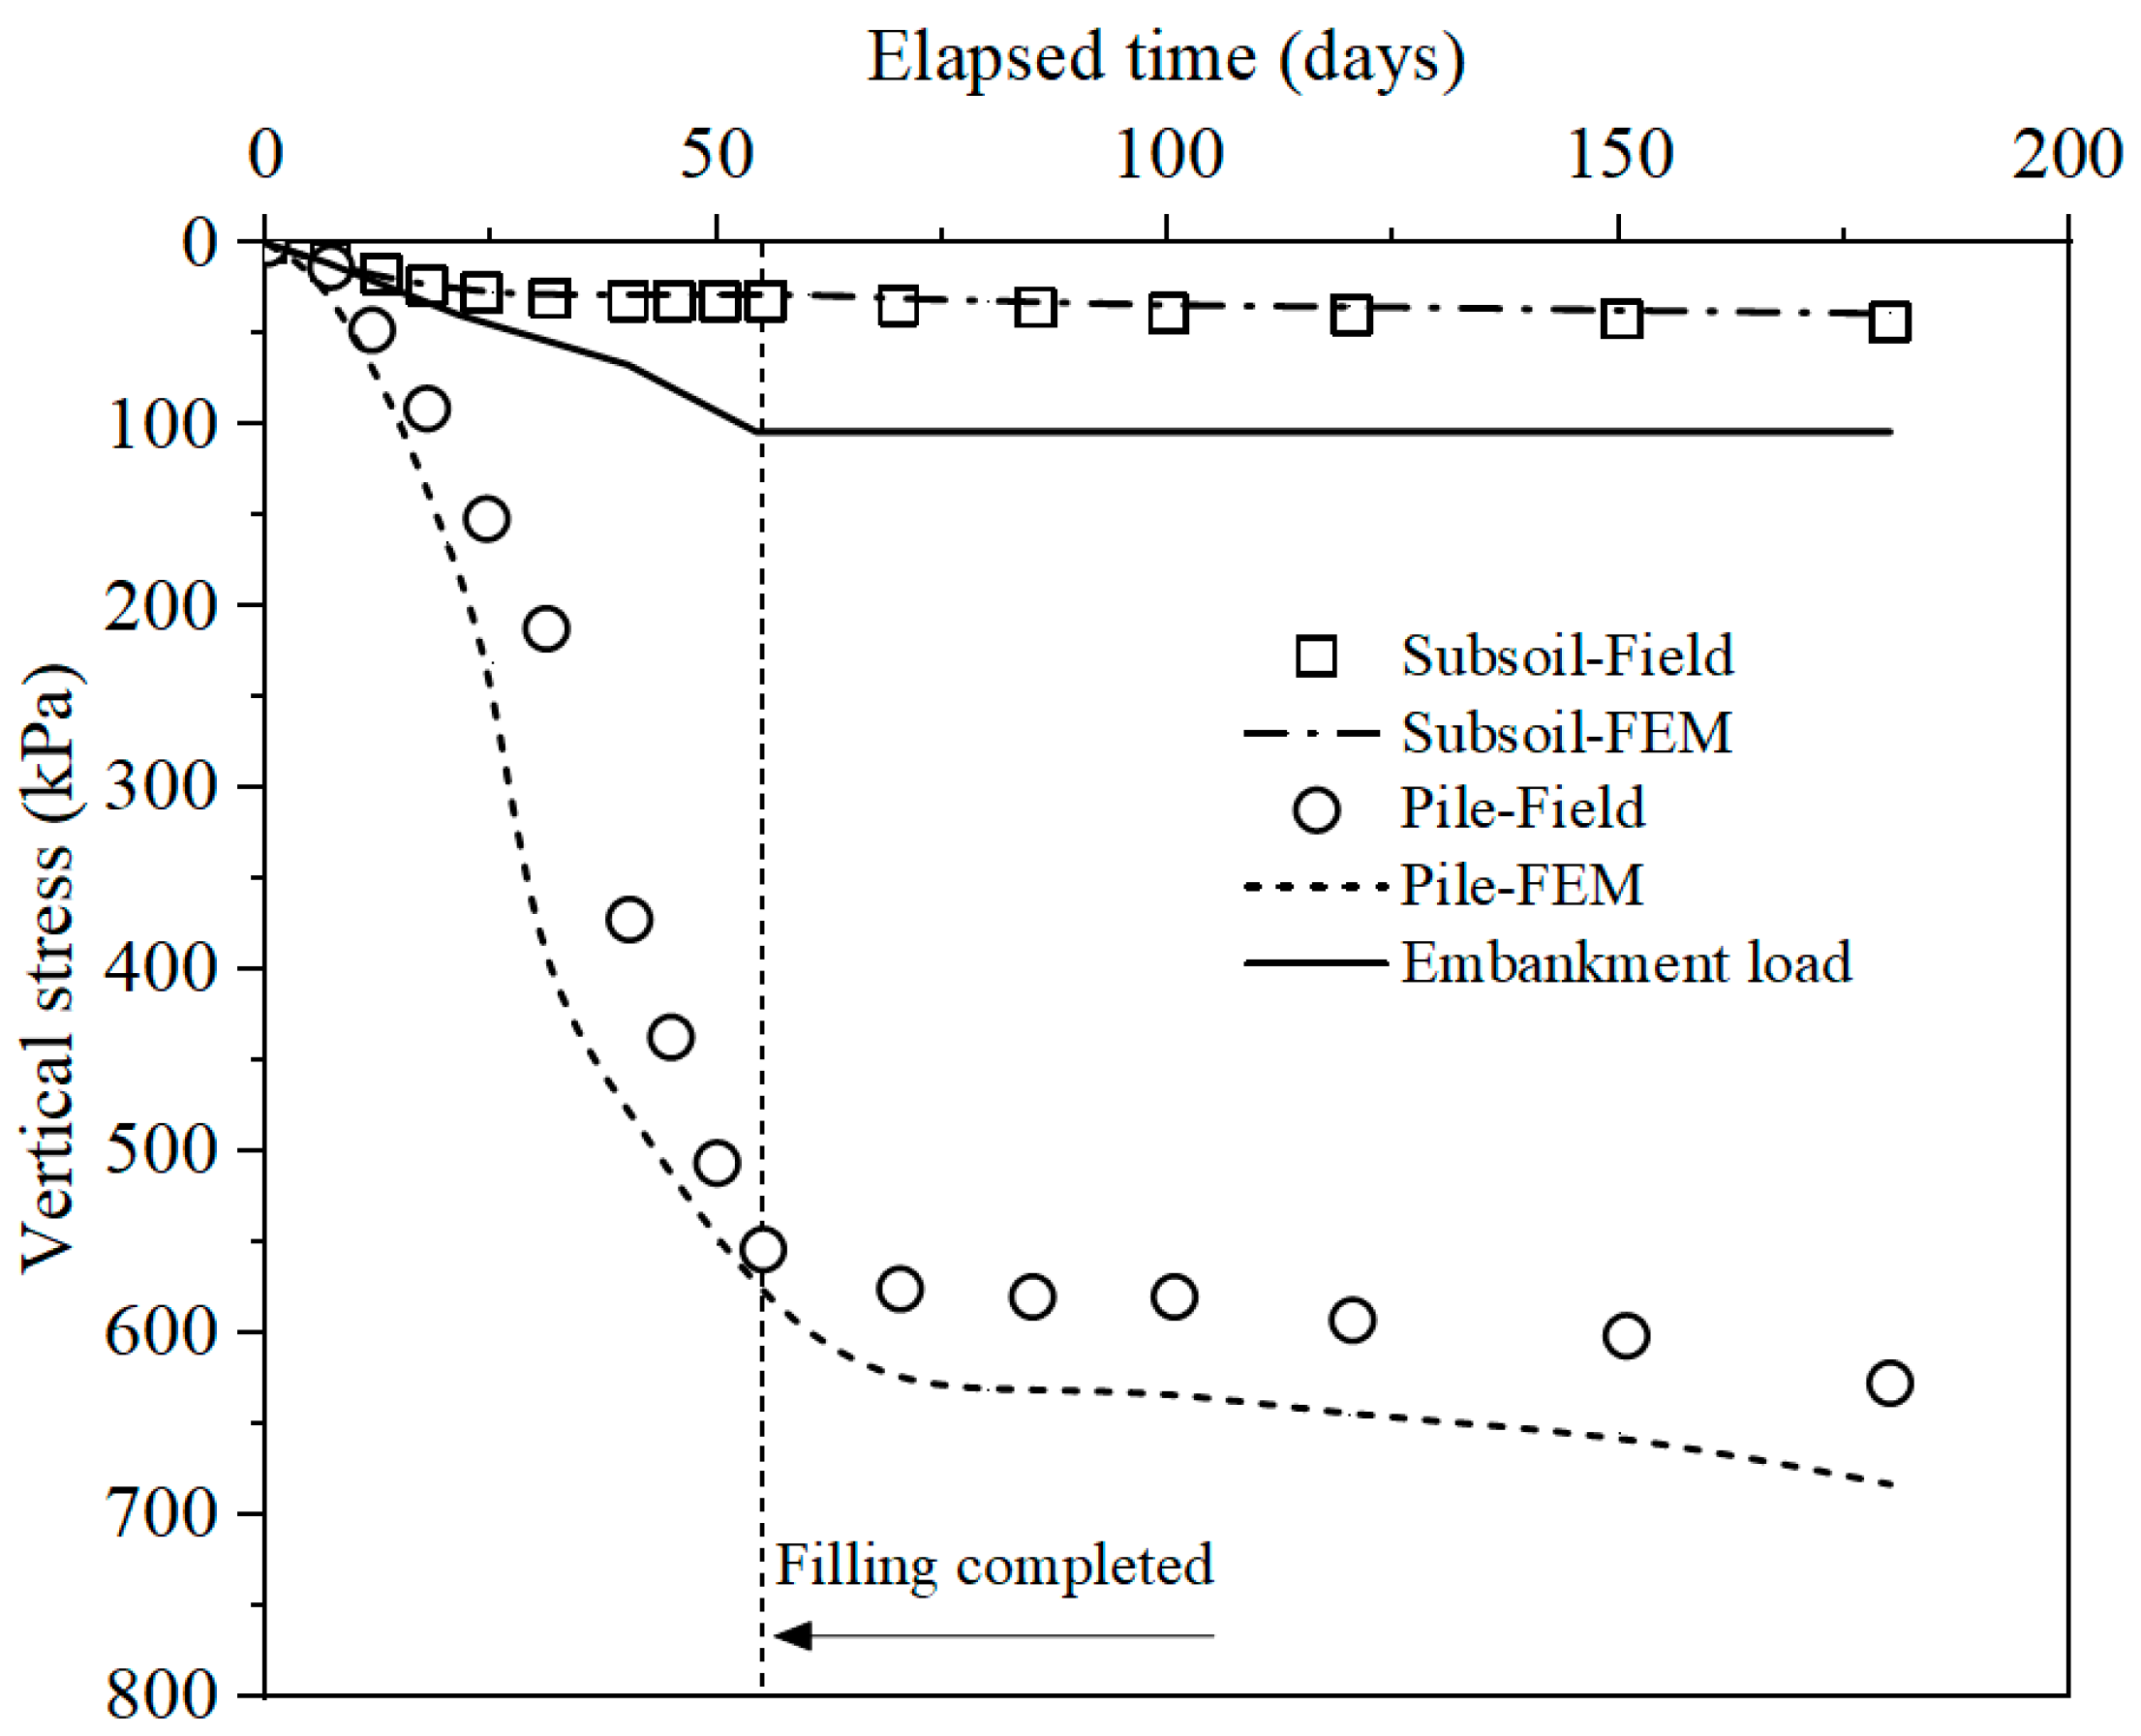
Field experiments were conducted for 125 days after the completion of embankment construction (55 days). Figure 7 shows the vertical stress acting on top of the pile and the subsoil obtained from on-site soil pressure cells, along with the corresponding results from finite element calculations. The embankment load is also included in the figure for reference. It has been found that the actual stress acting on the subsoil is significantly reduced. When the embankment construction was completed (with an embankment load of 104 kPa), the stress acting on the subsoil was 31 kPa, which is only 30% of the embankment load, whereas the load above the pile top at this time was 553 kPa, 5.3 times the embankment load. The finite element results exhibit good agreement with the actual vertical stress at the soil surface, albeit slightly overestimating the vertical stress at the pile top, with a maximum error of 18.6%.
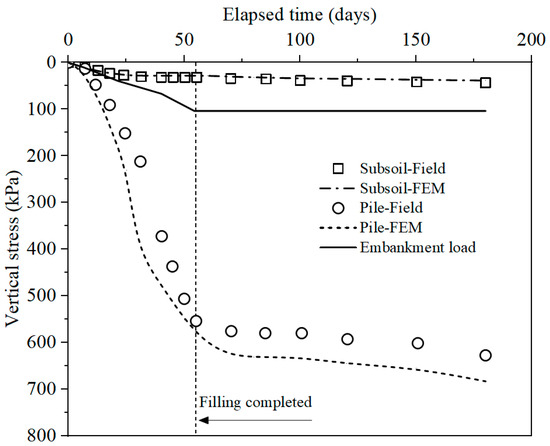
Figure 7.
Vertical stress acting on the top of the pile and subsoil at the center line of the embankment.
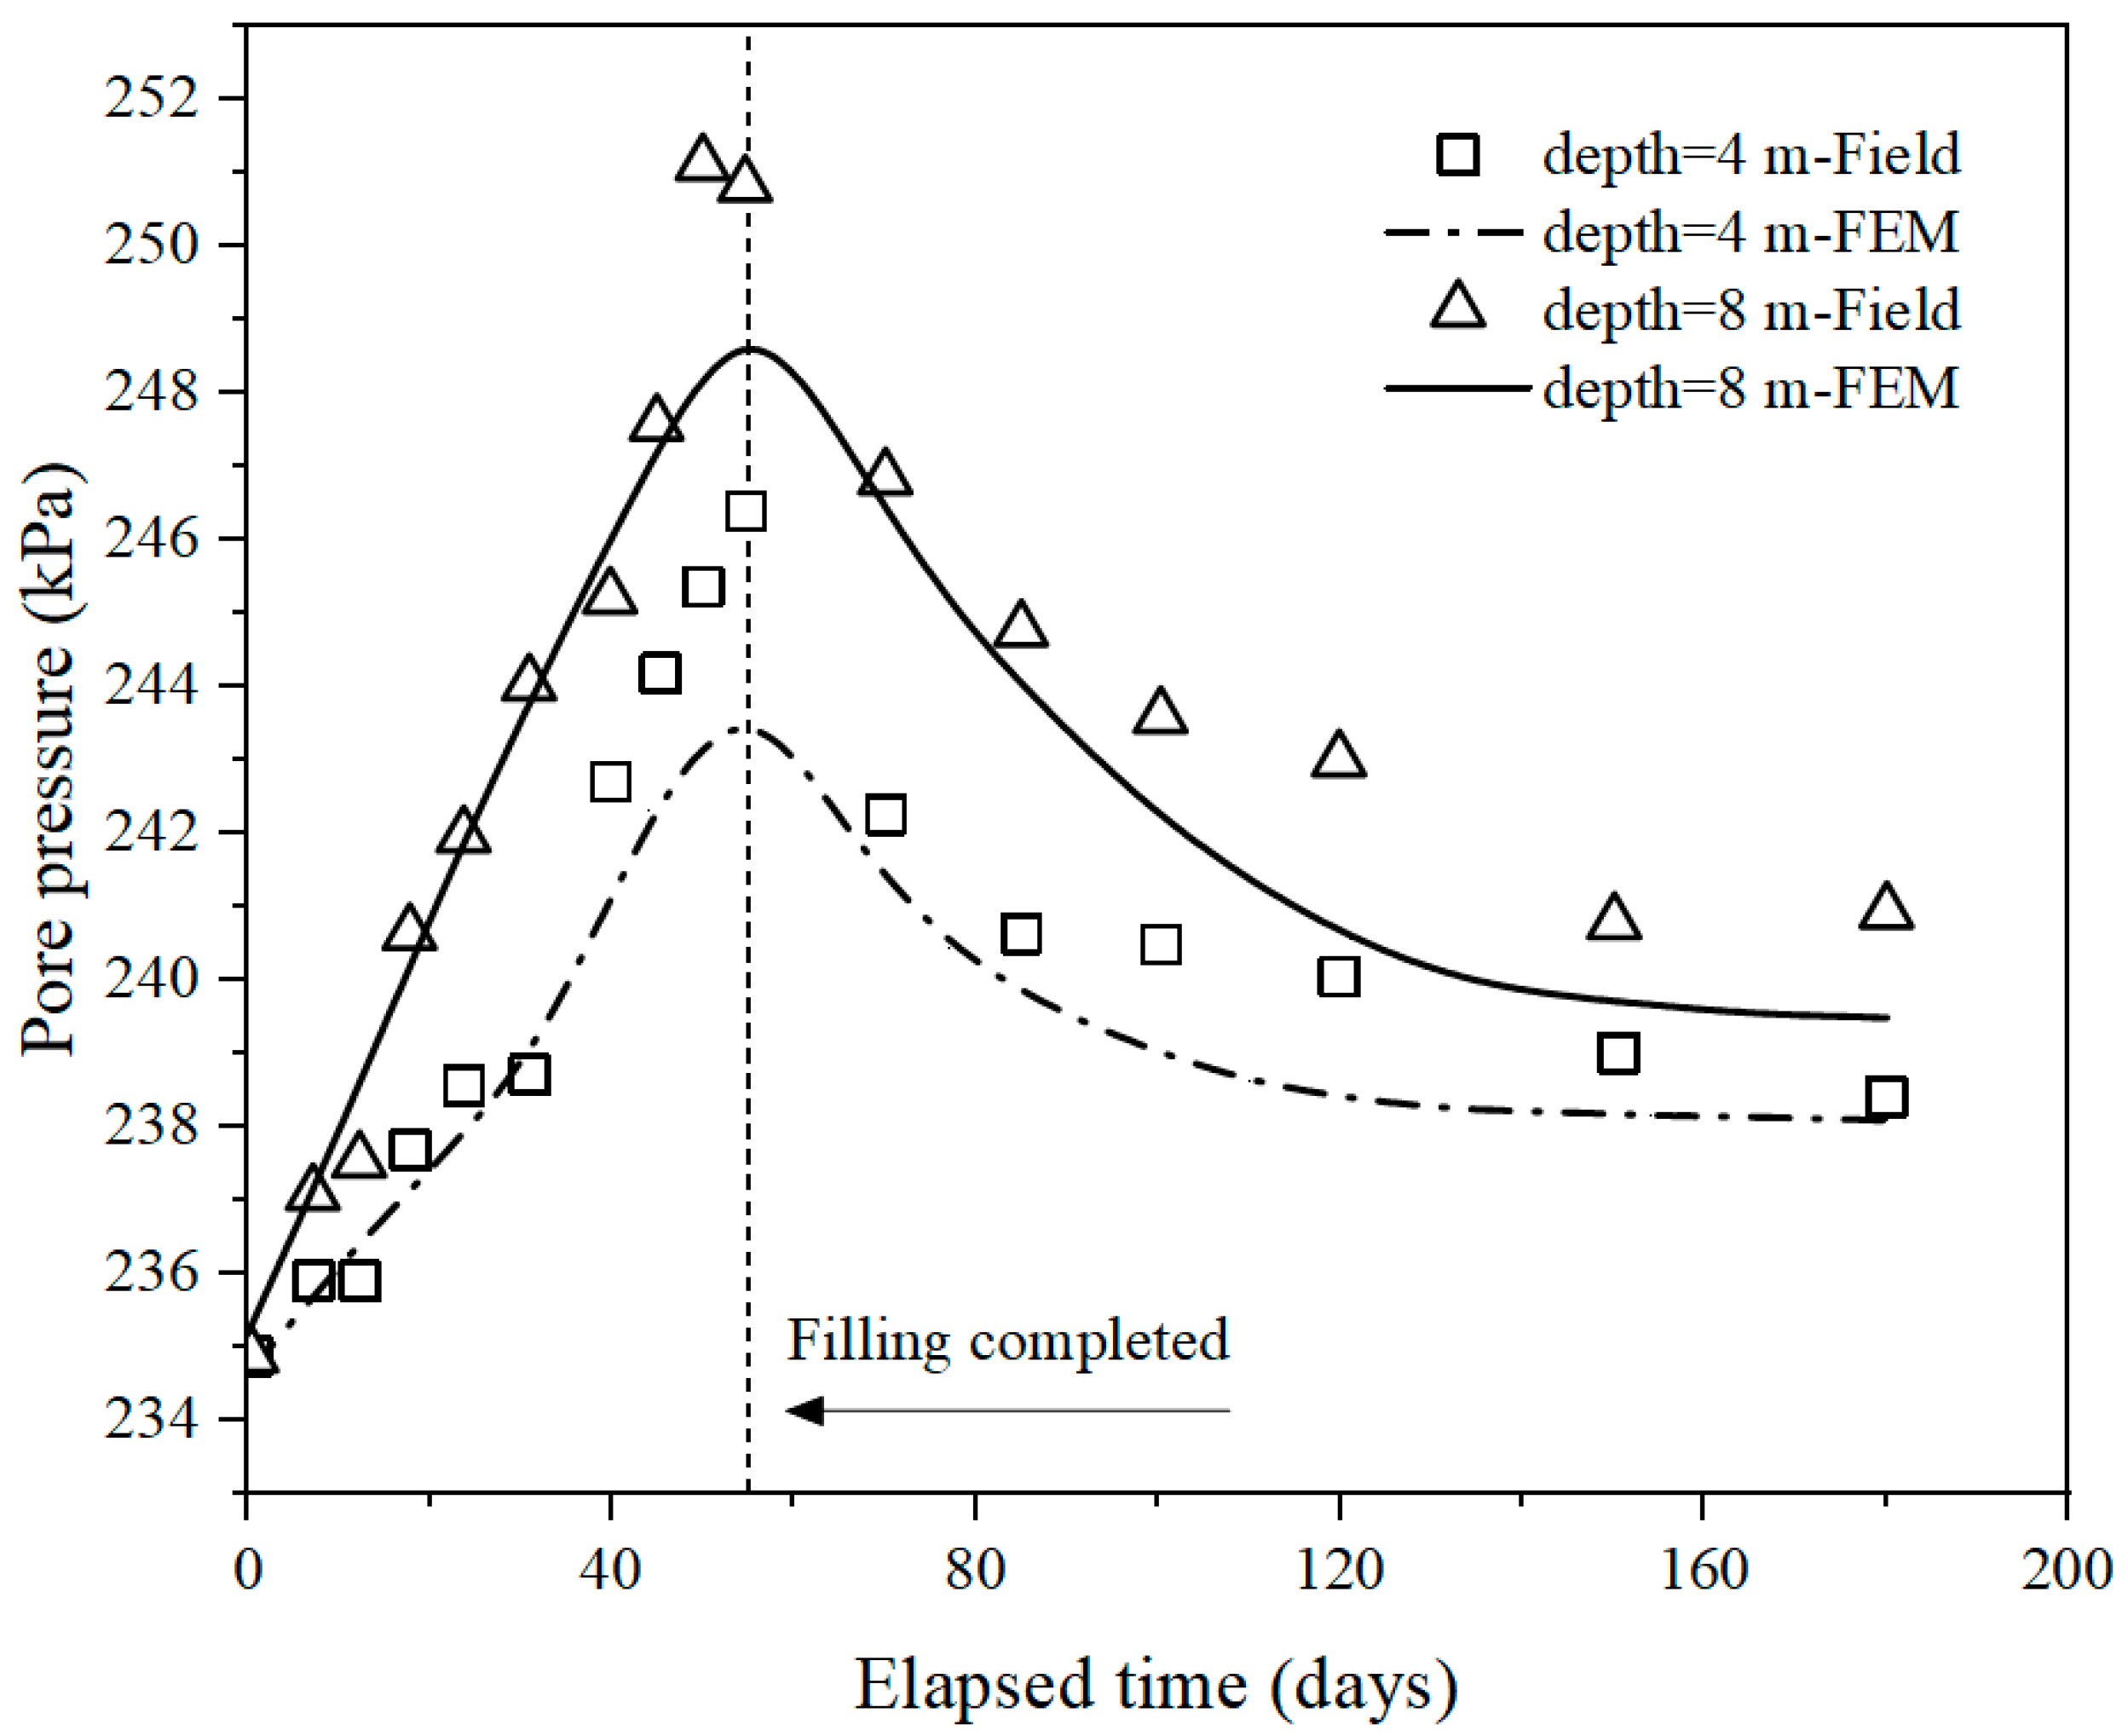
Figure 8 shows the pore pressure at depths of 4 m and 8 m below the interface between the embankment and the subsoil at the center line of the embankment. It has been found that the finite element results capture the overall trend of the pore pressure, with a maximum error of 2 kPa. As expected, both the measured and finite element results illustrate that the pore pressure gradually increases due to an additional load of 104 kPa applied in the embankment construction and subsequently decrease during the consolidation phase after construction until reaching a stable state.
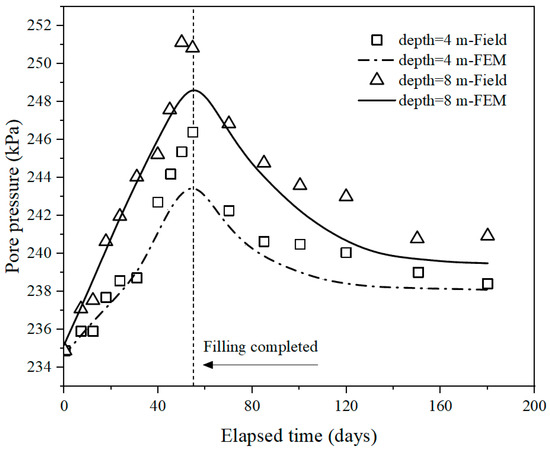
Figure 8.
Pore pressure at the center line of the embankment.
In general, the maximum error between the finite element results and field measurements is less than 20%, indicating that the finite element modeling method is suitable for simulating embankments supported by rigid floating piles.
3. Bearing Capacity of Foundation
The bearing capacity of the foundation is employed to distinguish between rigid floating piles, flexible floating piles, and end-bearing piles. In the preliminary work, piles positioned in a medium–stiff soil stratum were defined as rigid floating piles, but the exact critical value for the bearing capacity of the foundation was not accurately determined. In this study, a calculation method for the bearing capacity of foundations was developed based on Terzaghi’s [27] theory. Numerical analyses were conducted to determine the critical bearing capacity of foundations for rigid floating piles.
3.1. Calculation Methodology
Prandtl [39] first derived the ultimate bearing capacity calculation formula for strip foundations based on limit equilibrium theory in 1920. Prandtl [39] assumed a smooth interface between the foundation base and the soil, and that the soil underneath the foundation had no weight, resulting in a sliding surface composed of two sets of planes and logarithmic spiral surfaces transitioning between them. However, due to the unrealistic assumptions made by Prandtl [39], the results obtained were rough approximations. Subsequently, many scholars made further modifications and developments based on his research. Terzaghi [27] proposed the ultimate bearing capacity formula that considers the weight of the soil underneath the foundation based on Prandtl’s [39] fundamental principles:
where Pu is the ultimate bearing capacity of the foundation, kPa; q is the overload on both sides of the foundation above the footing level, kN/m2; γ is the unit weight of the soil, kN/m3; b is the width of the footing, m; Nc, Nq, Nγ are dimensionless bearing capacity coefficients; c is the cohesion, kPa; and φ is the friction angle, °.
Vanapalli et al. [40] noted that when the rate of foundation loading on fully saturated cohesive soil exceeds the dissipation rate of pore water pressure, Skempton’s [41] concept of φ = 0 is commonly used to explain the bearing capacity. In such cases, the net bearing capacity depends solely on the undrained shear strength (cu) of the soil.
For fully saturated cohesive soil undergoing undrained loading, where φ = 0, the bearing capacity factors according to Terzaghi [27] are Nc = 5.71, Nq = 1, Nγ = 0, and c = cu. Therefore, the ultimate bearing capacity calculation formula for fully saturated cohesive soil is as follows:
where qu is the ultimate bearing capacity, kPa; D is the depth of the foundation, m.
The net bearing capacity of foundation is then
The formula for the undrained shear strength of soil in the Modified Cam-Clay is as follows:
where e1 is the intercept on the isotropic compression consolidation e-lnp curve; e0 is the initial void ratio; λ is the compression index; κ is the rebound index; and M is the critical-state stress ratio.
In addition, the initial void ratio e0 is related to the intercept e1 as
where OCR is the over-consolidation ratio.
3.2. Numerical Analysis
A selection of typical soil strata was chosen from several engineering cases [12,38,42,43], and their bearing capacity of foundation (qu) was calculated using the method mentioned above. The detailed parameters can be found in Table 2. The soil arching of the piled embankment with the pile ends located in soil strata S1–S7 was investigated regarding vertical stresses, the earth pressure coefficient, and settlement.
Table 2.
Detailed parameters of soils.
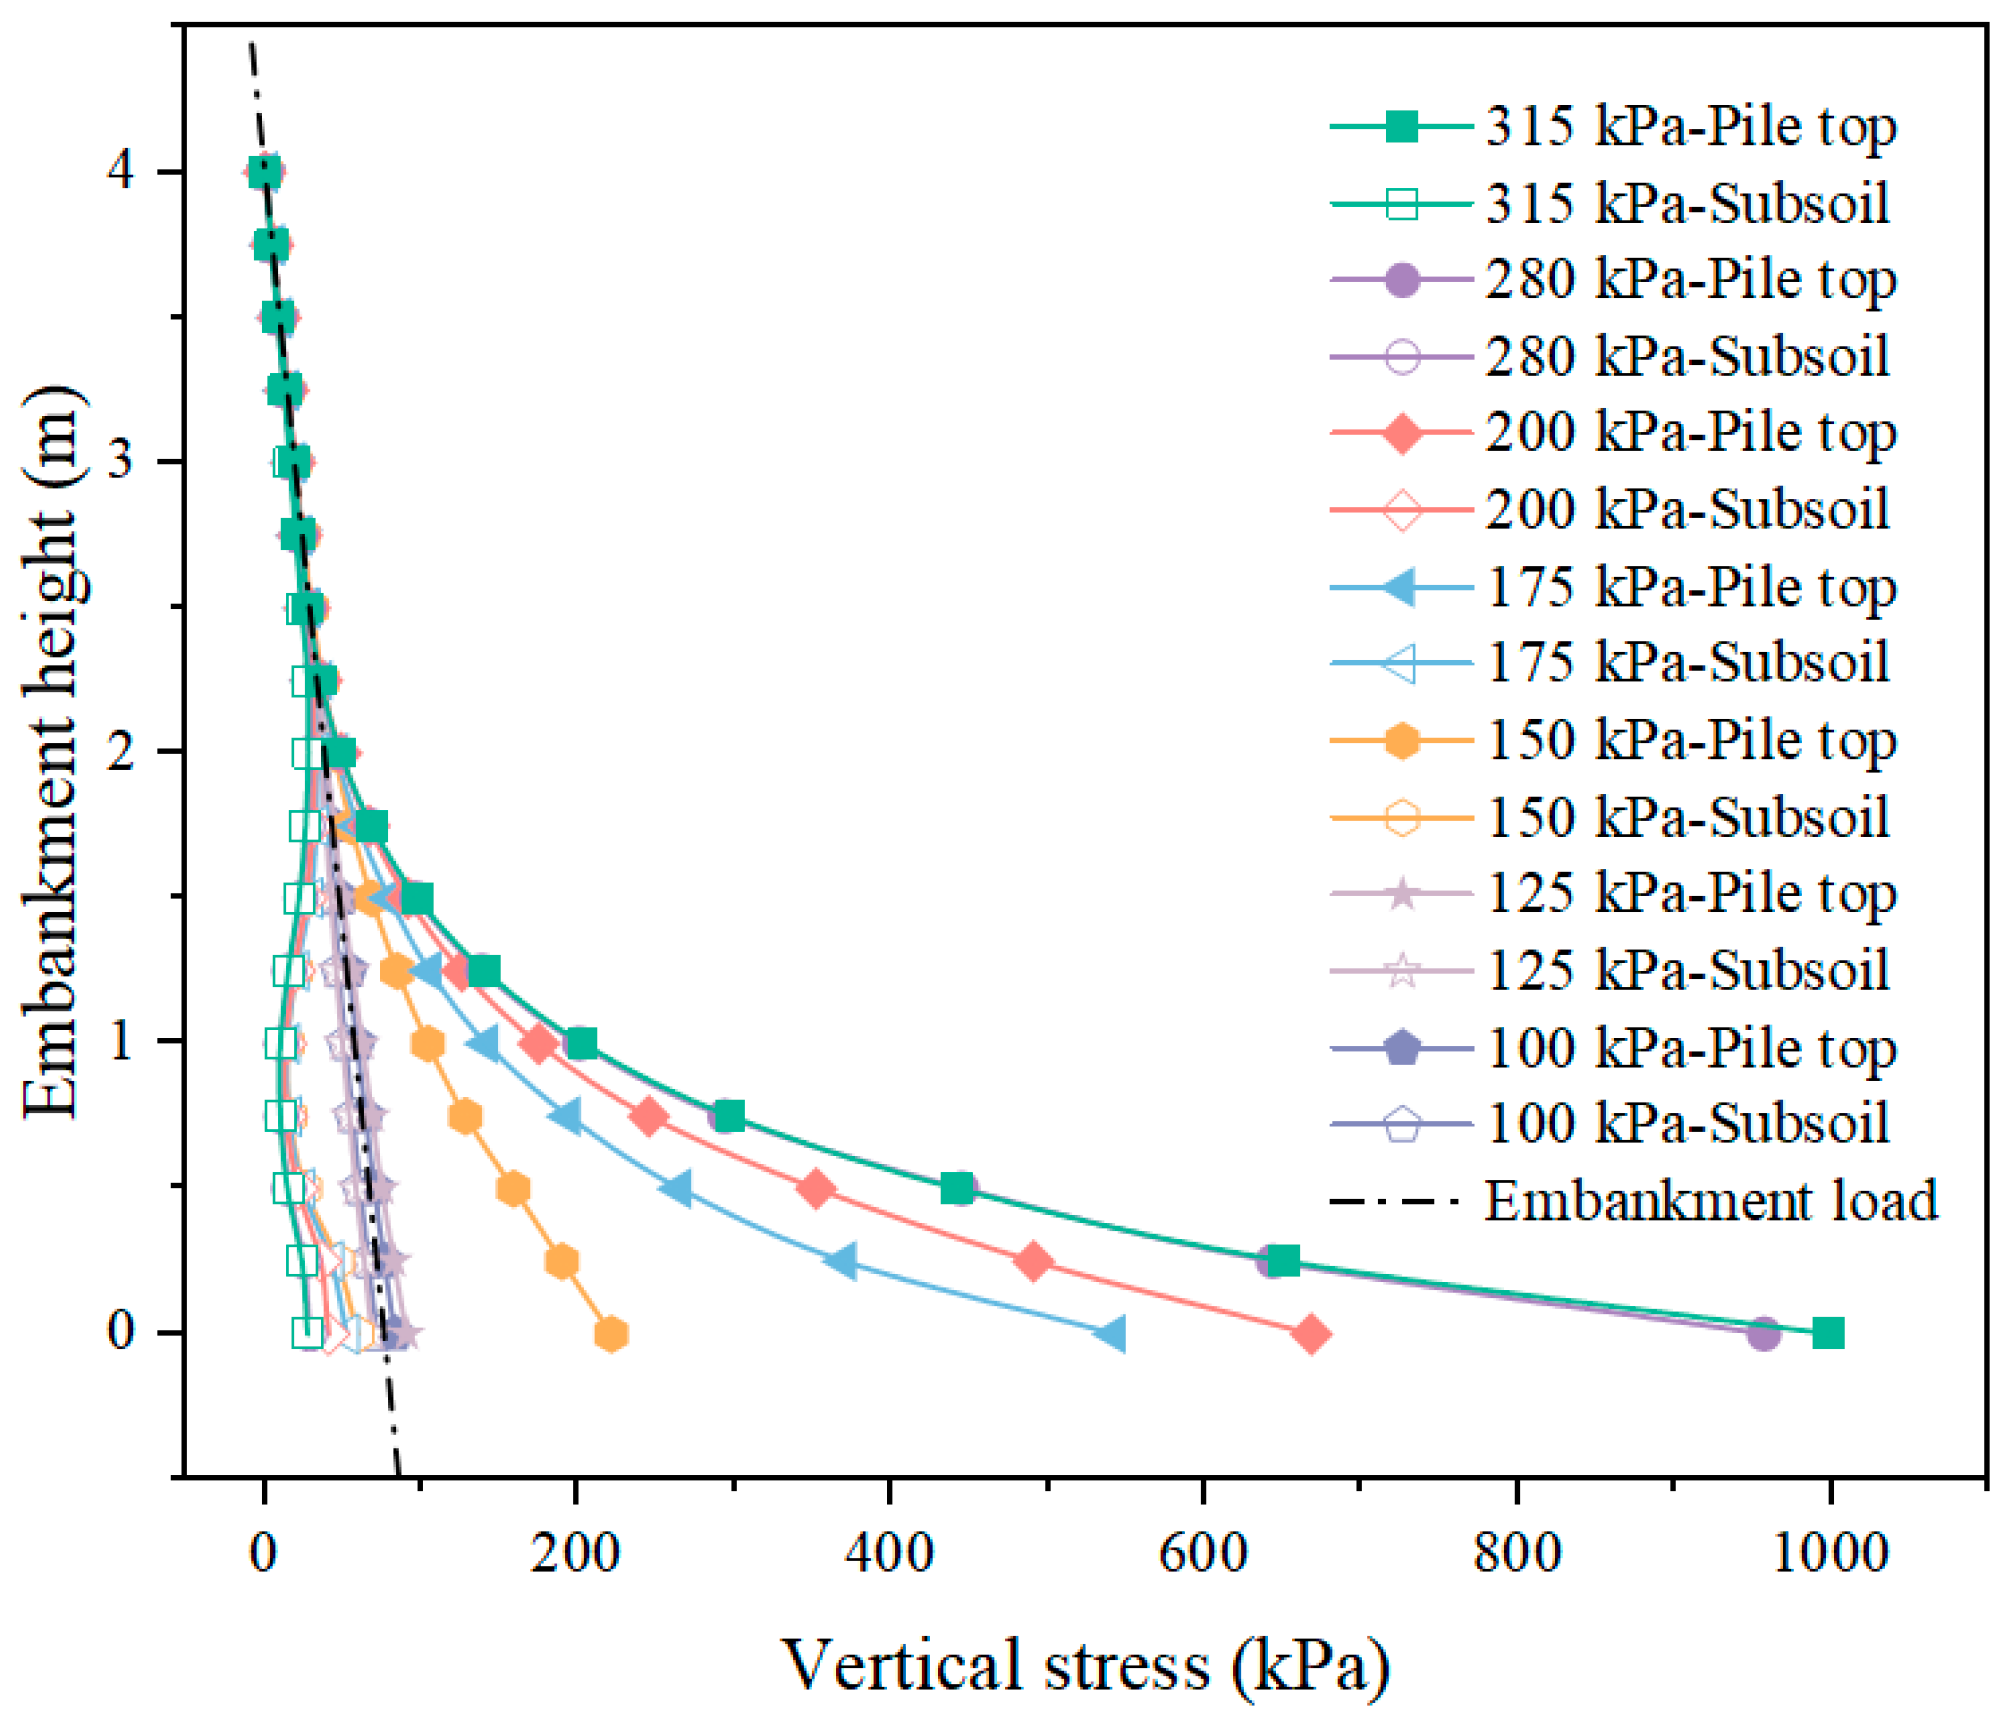
Figure 9 shows the vertical stress distribution along the height of the embankment above the subsoil and the pile cap. The results of the finite element analysis are in good agreement with the stress distribution predicted by Hewlett and Randolph [29]. At the top of the embankment, the vertical stress above the subsoil and the pile top is equal to the self-weight stress of the embankment. As the embankment depth increases to a certain level (2 m), the vertical stress above the subsoil begins to decrease while the vertical stress above the pile top increases. This first inflection point corresponds to the height of the external arching. With a further increase in embankment depth, another inflection point appears in the vertical stress distribution above the subsoil, corresponding to the height of the internal arching. Subsequently, the stress above the subsoil increases with depth. On the other hand, the stress above the pile top continues to increase continuously until the bottom of the embankment.
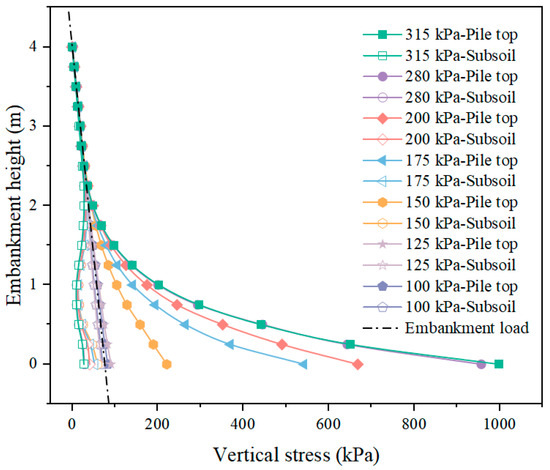
Figure 9.
Variation in vertical stress with embankment height for different bearing capacities of subsoil.
It has been found that the vertical stress above the subsoil gradually decreases while the vertical stress above the pile increases as the bearing capacity of the subsoil increases. When the bearing capacity of a foundation reaches 280 kPa, the stress variation becomes less significant, indicating the complete development of soil arching. Additionally, the pile–soil stress ratio increases with the bearing capacity of the foundation. When the bearing capacity of the foundation is 100 kPa, the stress ratio of the pile soil is 1.17, which increases to 3.75 when it is 150 kPa, and finally reaches 34.14 at the bearing capacity of the foundation of 280 kPa. It can be concluded that the increase in bearing capacity of the foundation enhances the transfer of stress to the pile, thereby reflecting the strengthening of the soil arching effect with increasing bearing capacity of the foundation. The complete manifestation of the soil arching effect is achieved when the bearing capacity reaches 280 kPa.
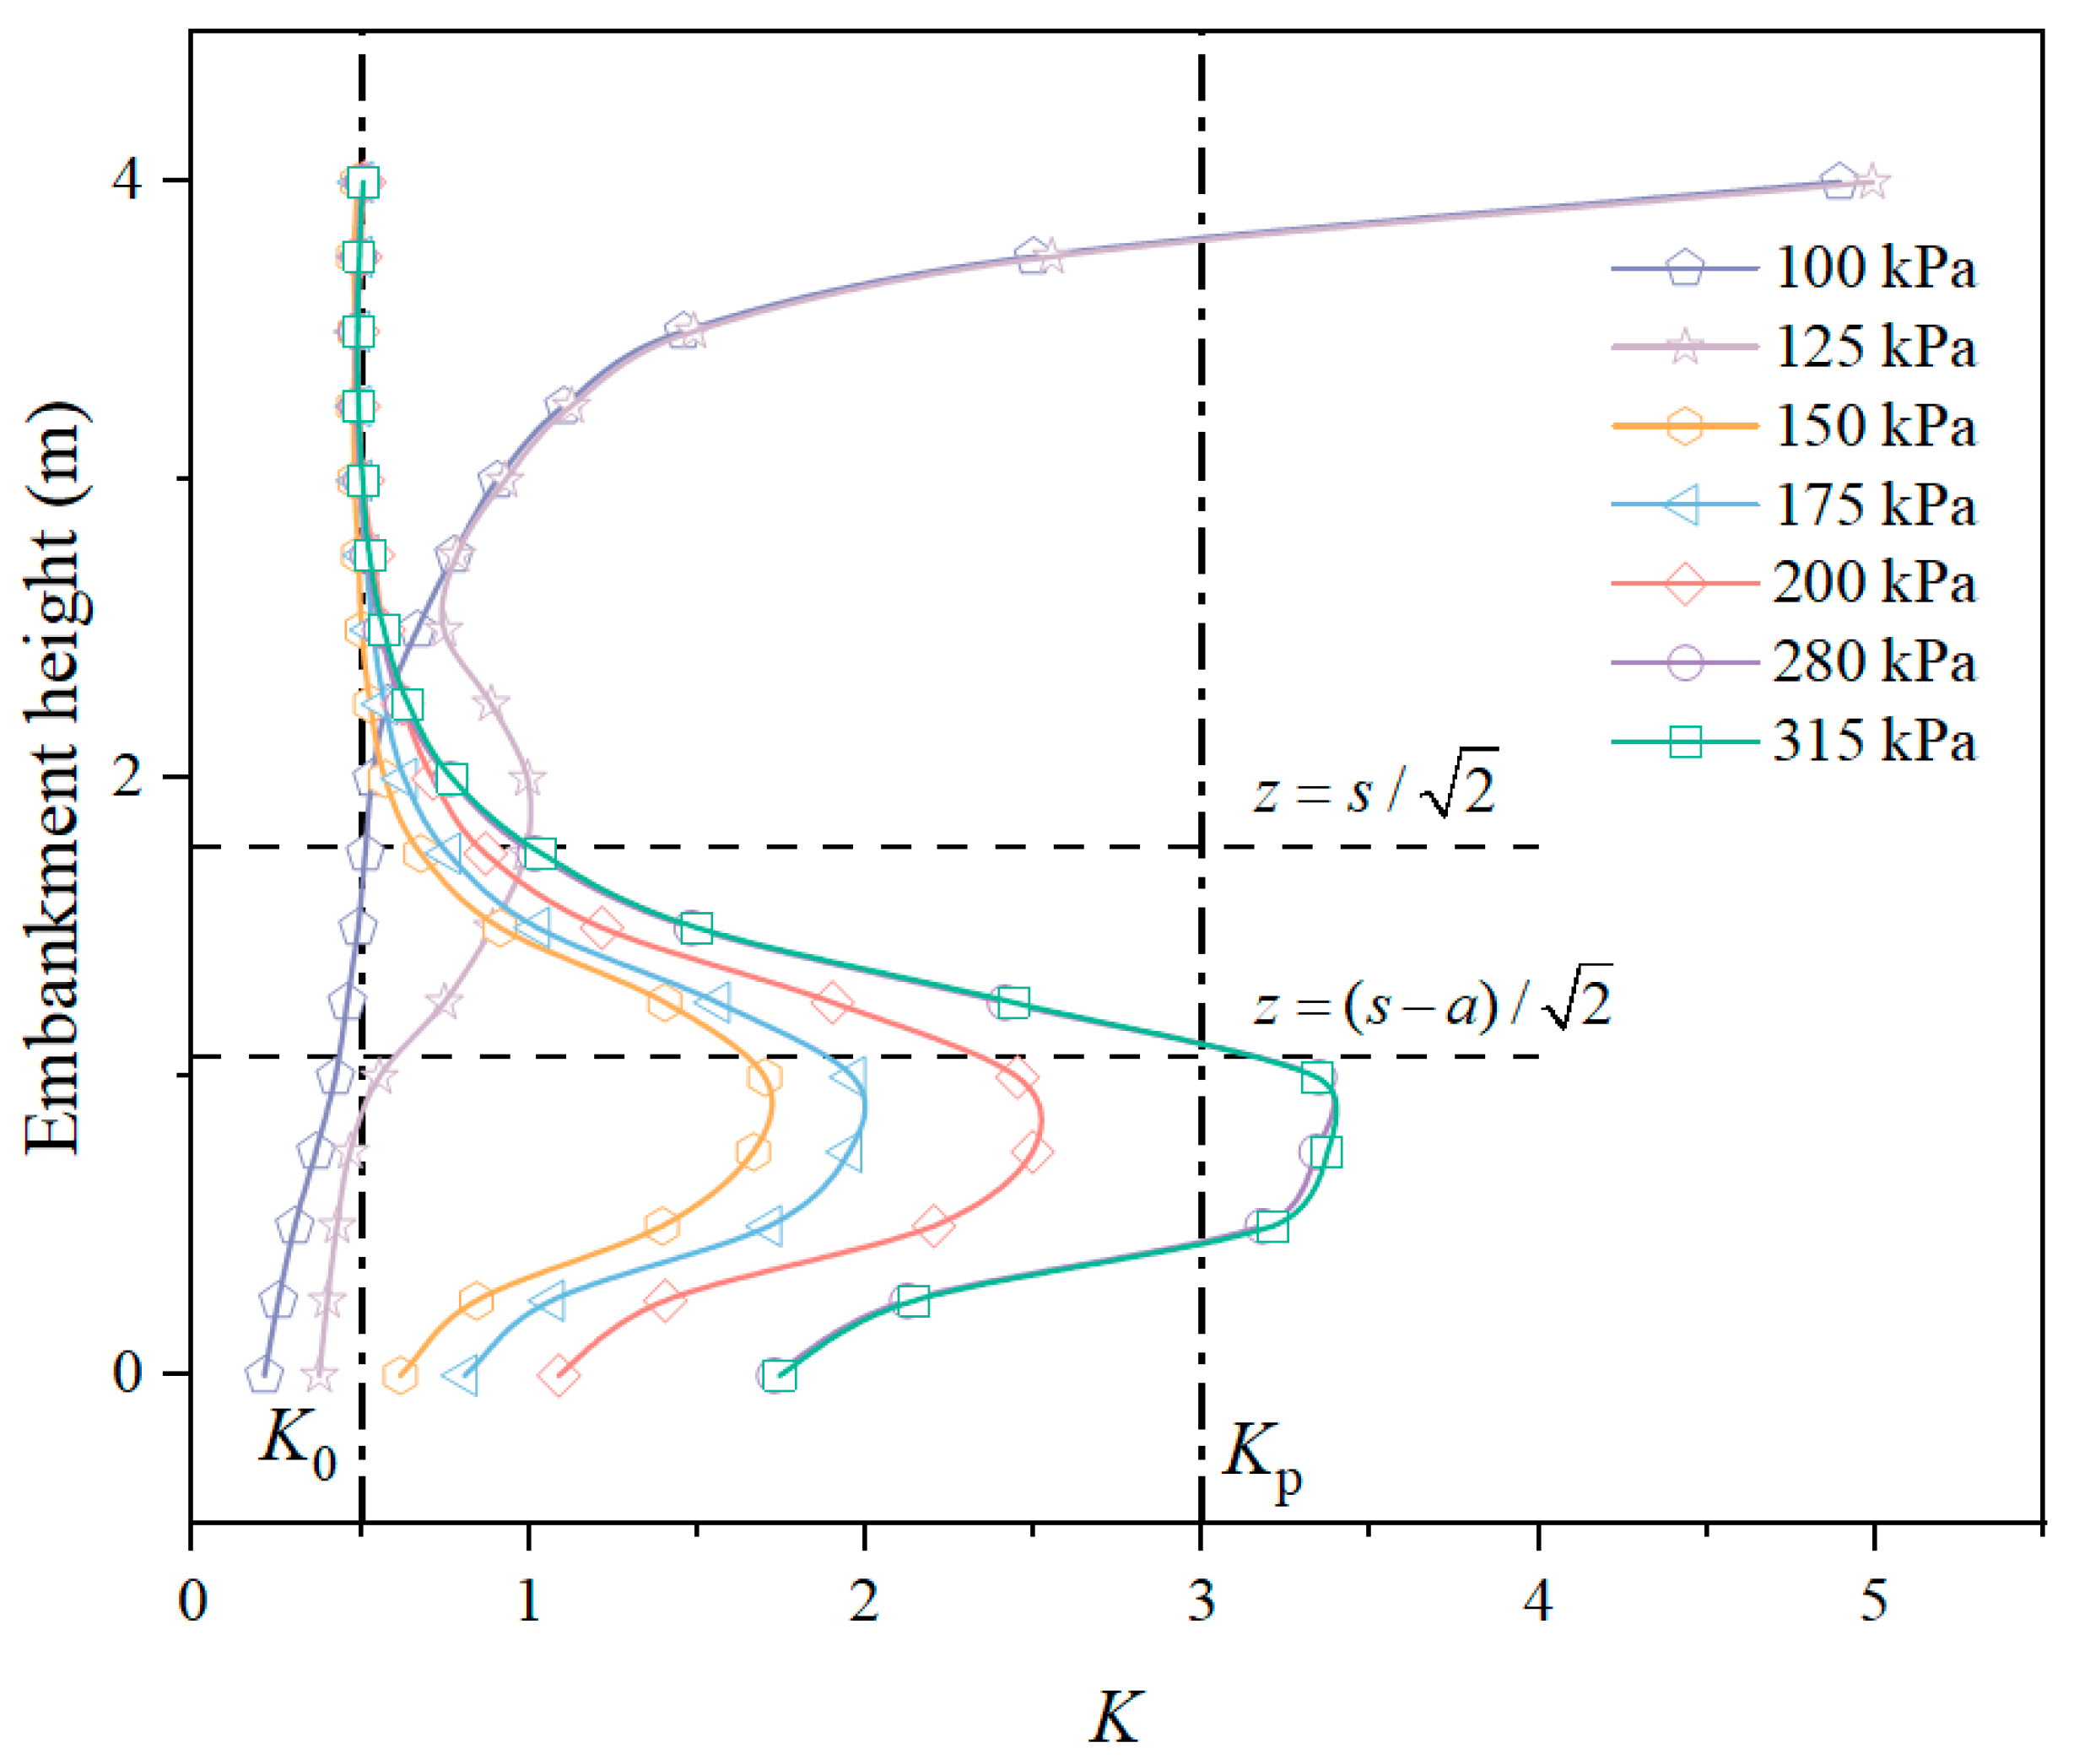
The earth pressure coefficient (K) is the most straightforward parameter to quantify the soil arching effect in a piled embankment. It is defined as the ratio of the horizontal stress to the vertical stress at a specific location within the embankment. The horizontal stress is considered to be independent of direction:
Figure 10 illustrates the variation in the coefficient (K) with the height of the embankment supported by piles on different bearing capacities of subsoil. Values of and are also indicated in the figure, corresponding to the outer and inner radius of a three-dimensional soil arch as proposed by Hewlett and Randolph [29], where z is the height above the base of the embankment. It has been found that when the bearing capacity of the subsoil ranges from 150 to 200 kPa, K tends to approach the static earth pressure coefficient (K0) at the top of the embankment. As the depth of the embankment increases, K rapidly increases, reaches a peak value, and then monotonically decreases along the depth of the embankment. It shows the presence of soil arching in the embankment, but the arching is not fully developed and falls within the category of rigid floating piles. When the bearing capacity reaches 280 kPa, the peak value of K exceeds the passive earth pressure coefficient (Kp), indicating the occurrence of plastic failure within the embankment. It suggests the complete manifestation of the soil arching, placing it under the category of end-bearing piles. However, when the bearing capacity of the subsoil is less than 150 kPa, K decreases monotonically with the depth of the embankment, indicating the absence of soil arching and falling into the category of flexible floating piles.
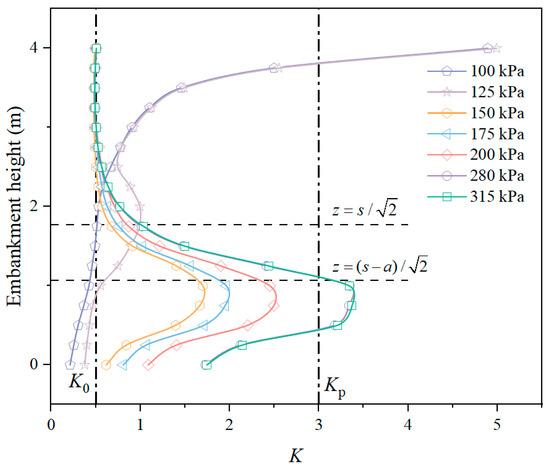
Figure 10.
Variation in earth pressure coefficient with embankment height for different bearing capacities of subsoil.
With the increasing bearing capacity of the subsoil, the peak value of K at the bottom of the embankment gradually increases. For a bearing capacity of 200 kPa, K increases from 1.70 (qu = 150 kPa) to 2.49 and further reaches 3.34 when the bearing capacity is 280 kPa, after which it tends to stabilize. It implies that the soil arching effect becomes increasingly prominent, obtaining its full manifestation when the bearing capacity reaches 280 kPa.
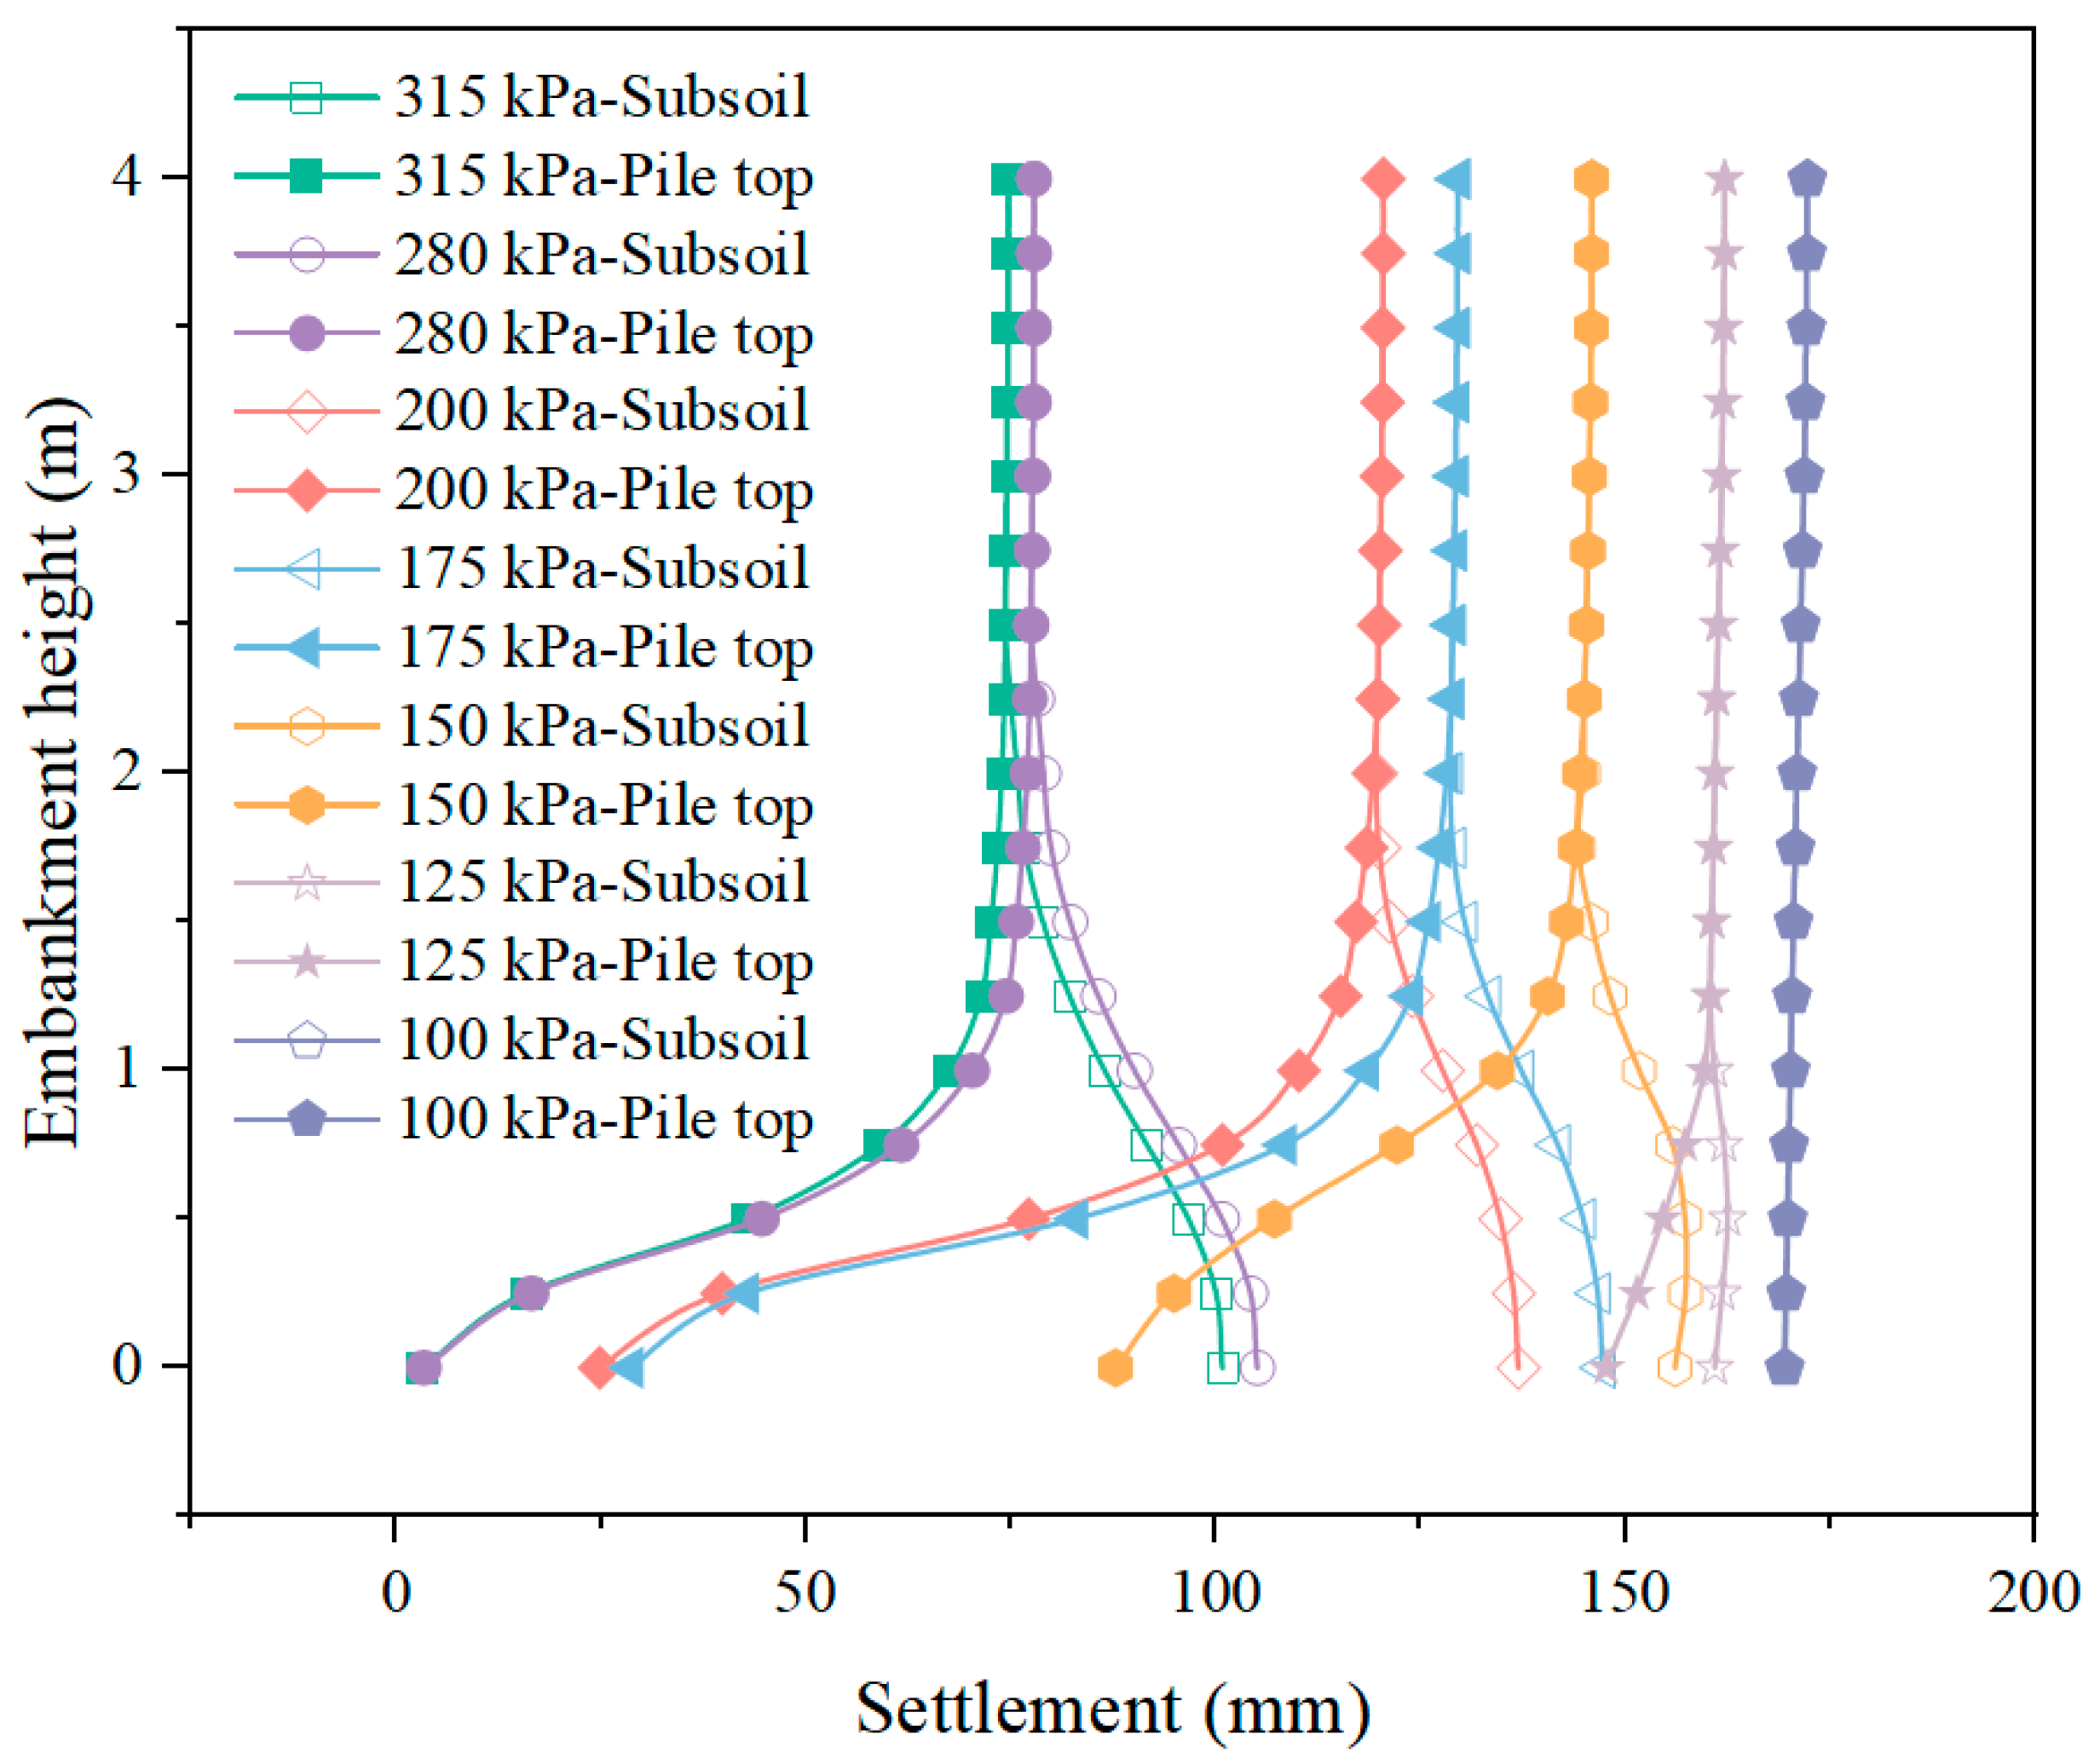
Figure 11 presents the settlement distribution above the subsoil and pile top in an embankment on soil strata with different bearing capacities. It has been found that the settlement above the piles in the upper portion of the embankment is equal to the settlement in the overlying subsoil. With the increasing depth of the embankment, the settlement above the subsoil beneath the equal settlement plane increases, while the settlement above the pile top decreases, reaching maximum and minimum values at the bottom of the embankment, respectively. However, when the bearing capacity is 100 kPa, the settlement in the subsoil and above the piles is equal due to the smaller bearing capacity, which prevents differential settlement between the piles and soil. When the bearing capacity of the subsoil exceeds 280 kPa, the settlement at the pile top tends towards 0 mm due to the higher end-bearing capacity and the larger elastic modulus of the piles, resulting in minimal deformation under the embankment load.
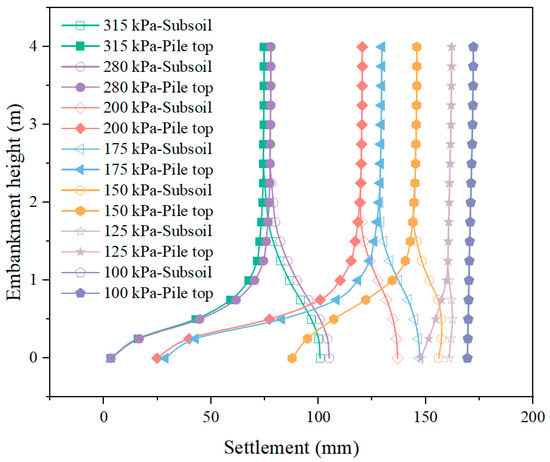
Figure 11.
Variation in settlement with embankment height for different bearing capacities of subsoil.
As the bearing capacity of the subsoil decreases, the settlement at the embankment surface gradually increases, from 74 mm at 315 kPa to 172 mm at 100 kPa, representing a 132% increase. The settlement at the surface of the subsoil increases from 100 mm at 315 kPa to 169 mm. The settlement at the pile top also increases with decreasing bearing capacity, but the differential settlement between the piles and soil initially increases and then decreases. It cannot be assumed that the increase in differential settlement and the weakening of the soil arching are directly related because the arching effect is essentially caused by differential settlement.
It has been found that when the bearing capacity of the subsoil reaches 280 kPa, the settlement distribution within the embankment becomes stable, and the settlement at the pile top tends towards 0 mm, indicating that the piles in this scenario are considered end-bearing piles. When the bearing capacity decreases to 125 kPa, the differential settlement between the piles and soil rapidly decreases and tends towards 0 mm. It is insufficient to induce soil arching, and the piles function as flexible floating piles. Upon considering stress analysis, it is found that when the bearing capacity of the foundation reaches 150 kPa, the piles function as rigid floating piles. When the bearing capacity reaches 280 kPa, the piles meet the criteria for end-bearing piles.
4. Parametric Studies
An analysis of the factors influencing the soil arching effect in rigid floating-pile-supported embankments was conducted through numerical simulations. The impact of embankment height, pile spacing, embankment fill properties, and pile length on the soil arching effect and stability was investigated. The model with a bearing capacity of 175 kPa was defined as the standard condition.
4.1. Embankment Height and Pile Spacing
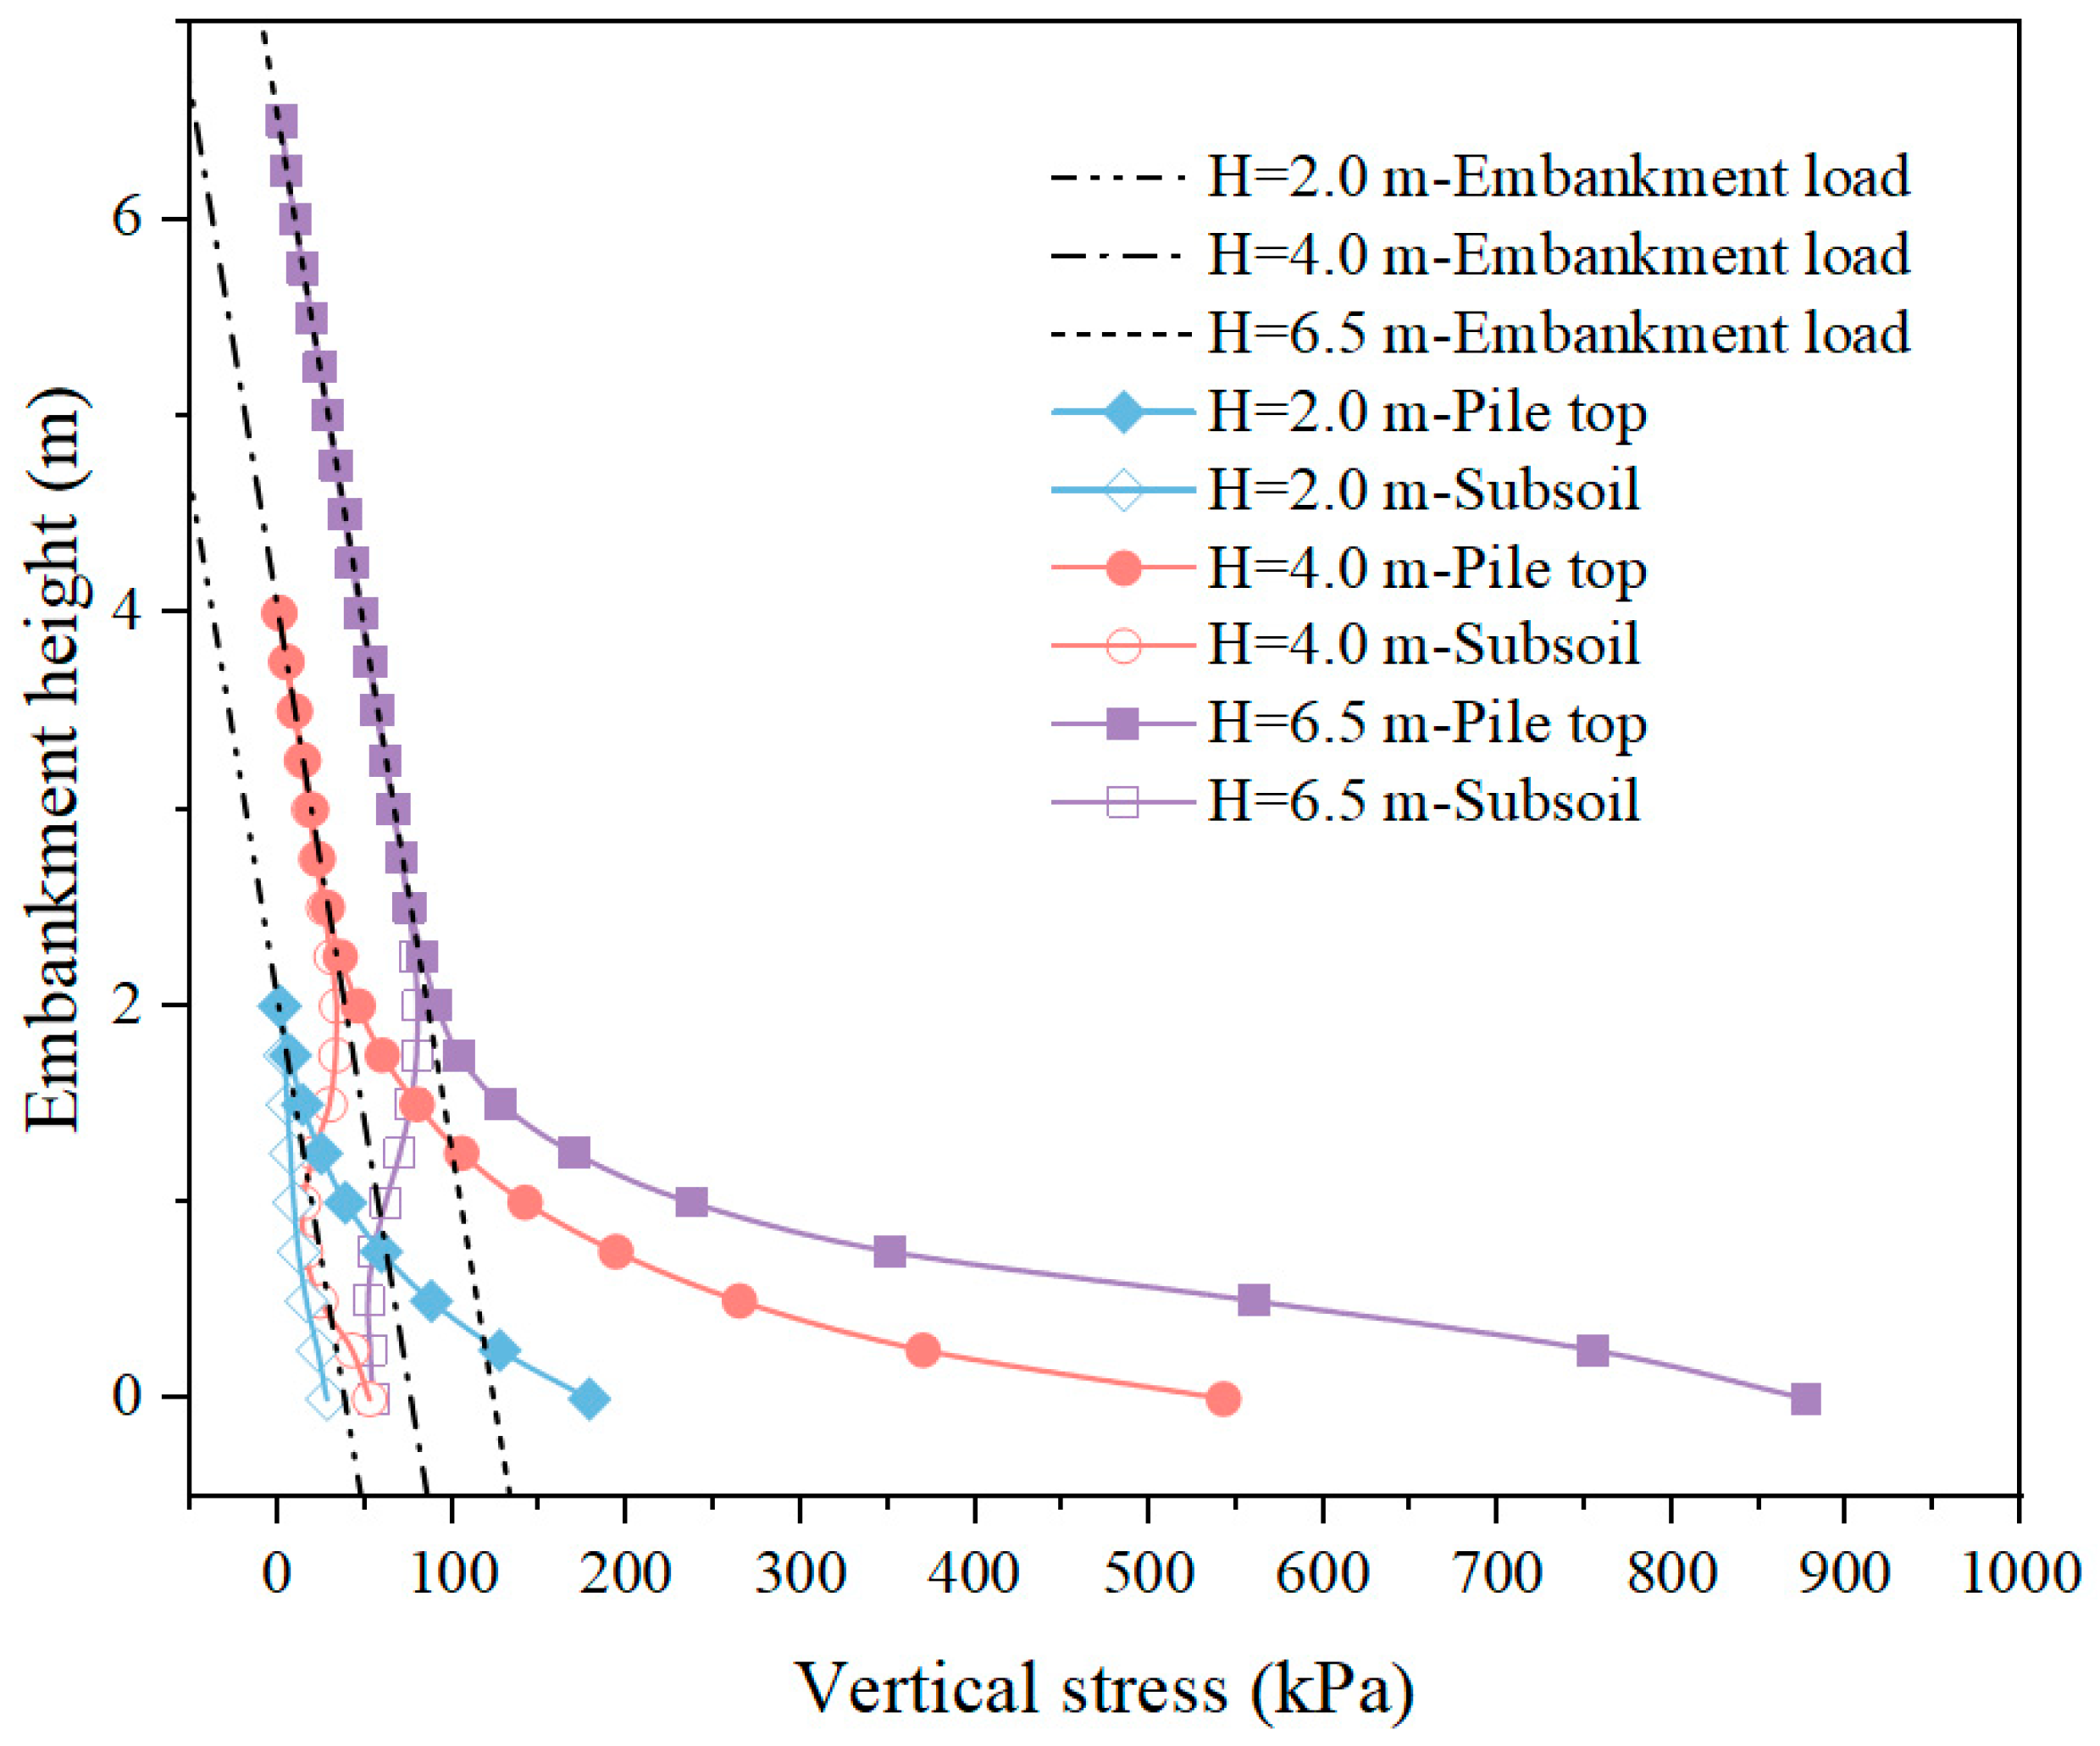
Figure 12 shows the vertical stress distribution on rigid floating piles with a pile spacing of 2.5 m under embankments of heights 2.0 m, 4.0 m, and 6.5 m. It has been observed that as the embankment height increases, the self-weight stress of the embankment continuously increases, leading to a corresponding increase in the vertical stress within the embankment. With the increase in embankment height from 2.0 m to 6.5 m, both the outer and inner arch heights of the soil arch increase, accompanied by an increase in the thickness of the soil arch. The stress above the piles increases by 392%, and the pile–soil stress ratio increases from 6.59 to 16.2, highlighting the enhanced soil arching effect.
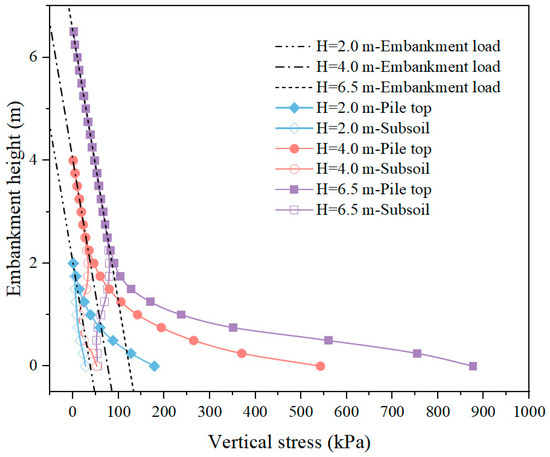
Figure 12.
Variation in vertical stress with different embankment heights.
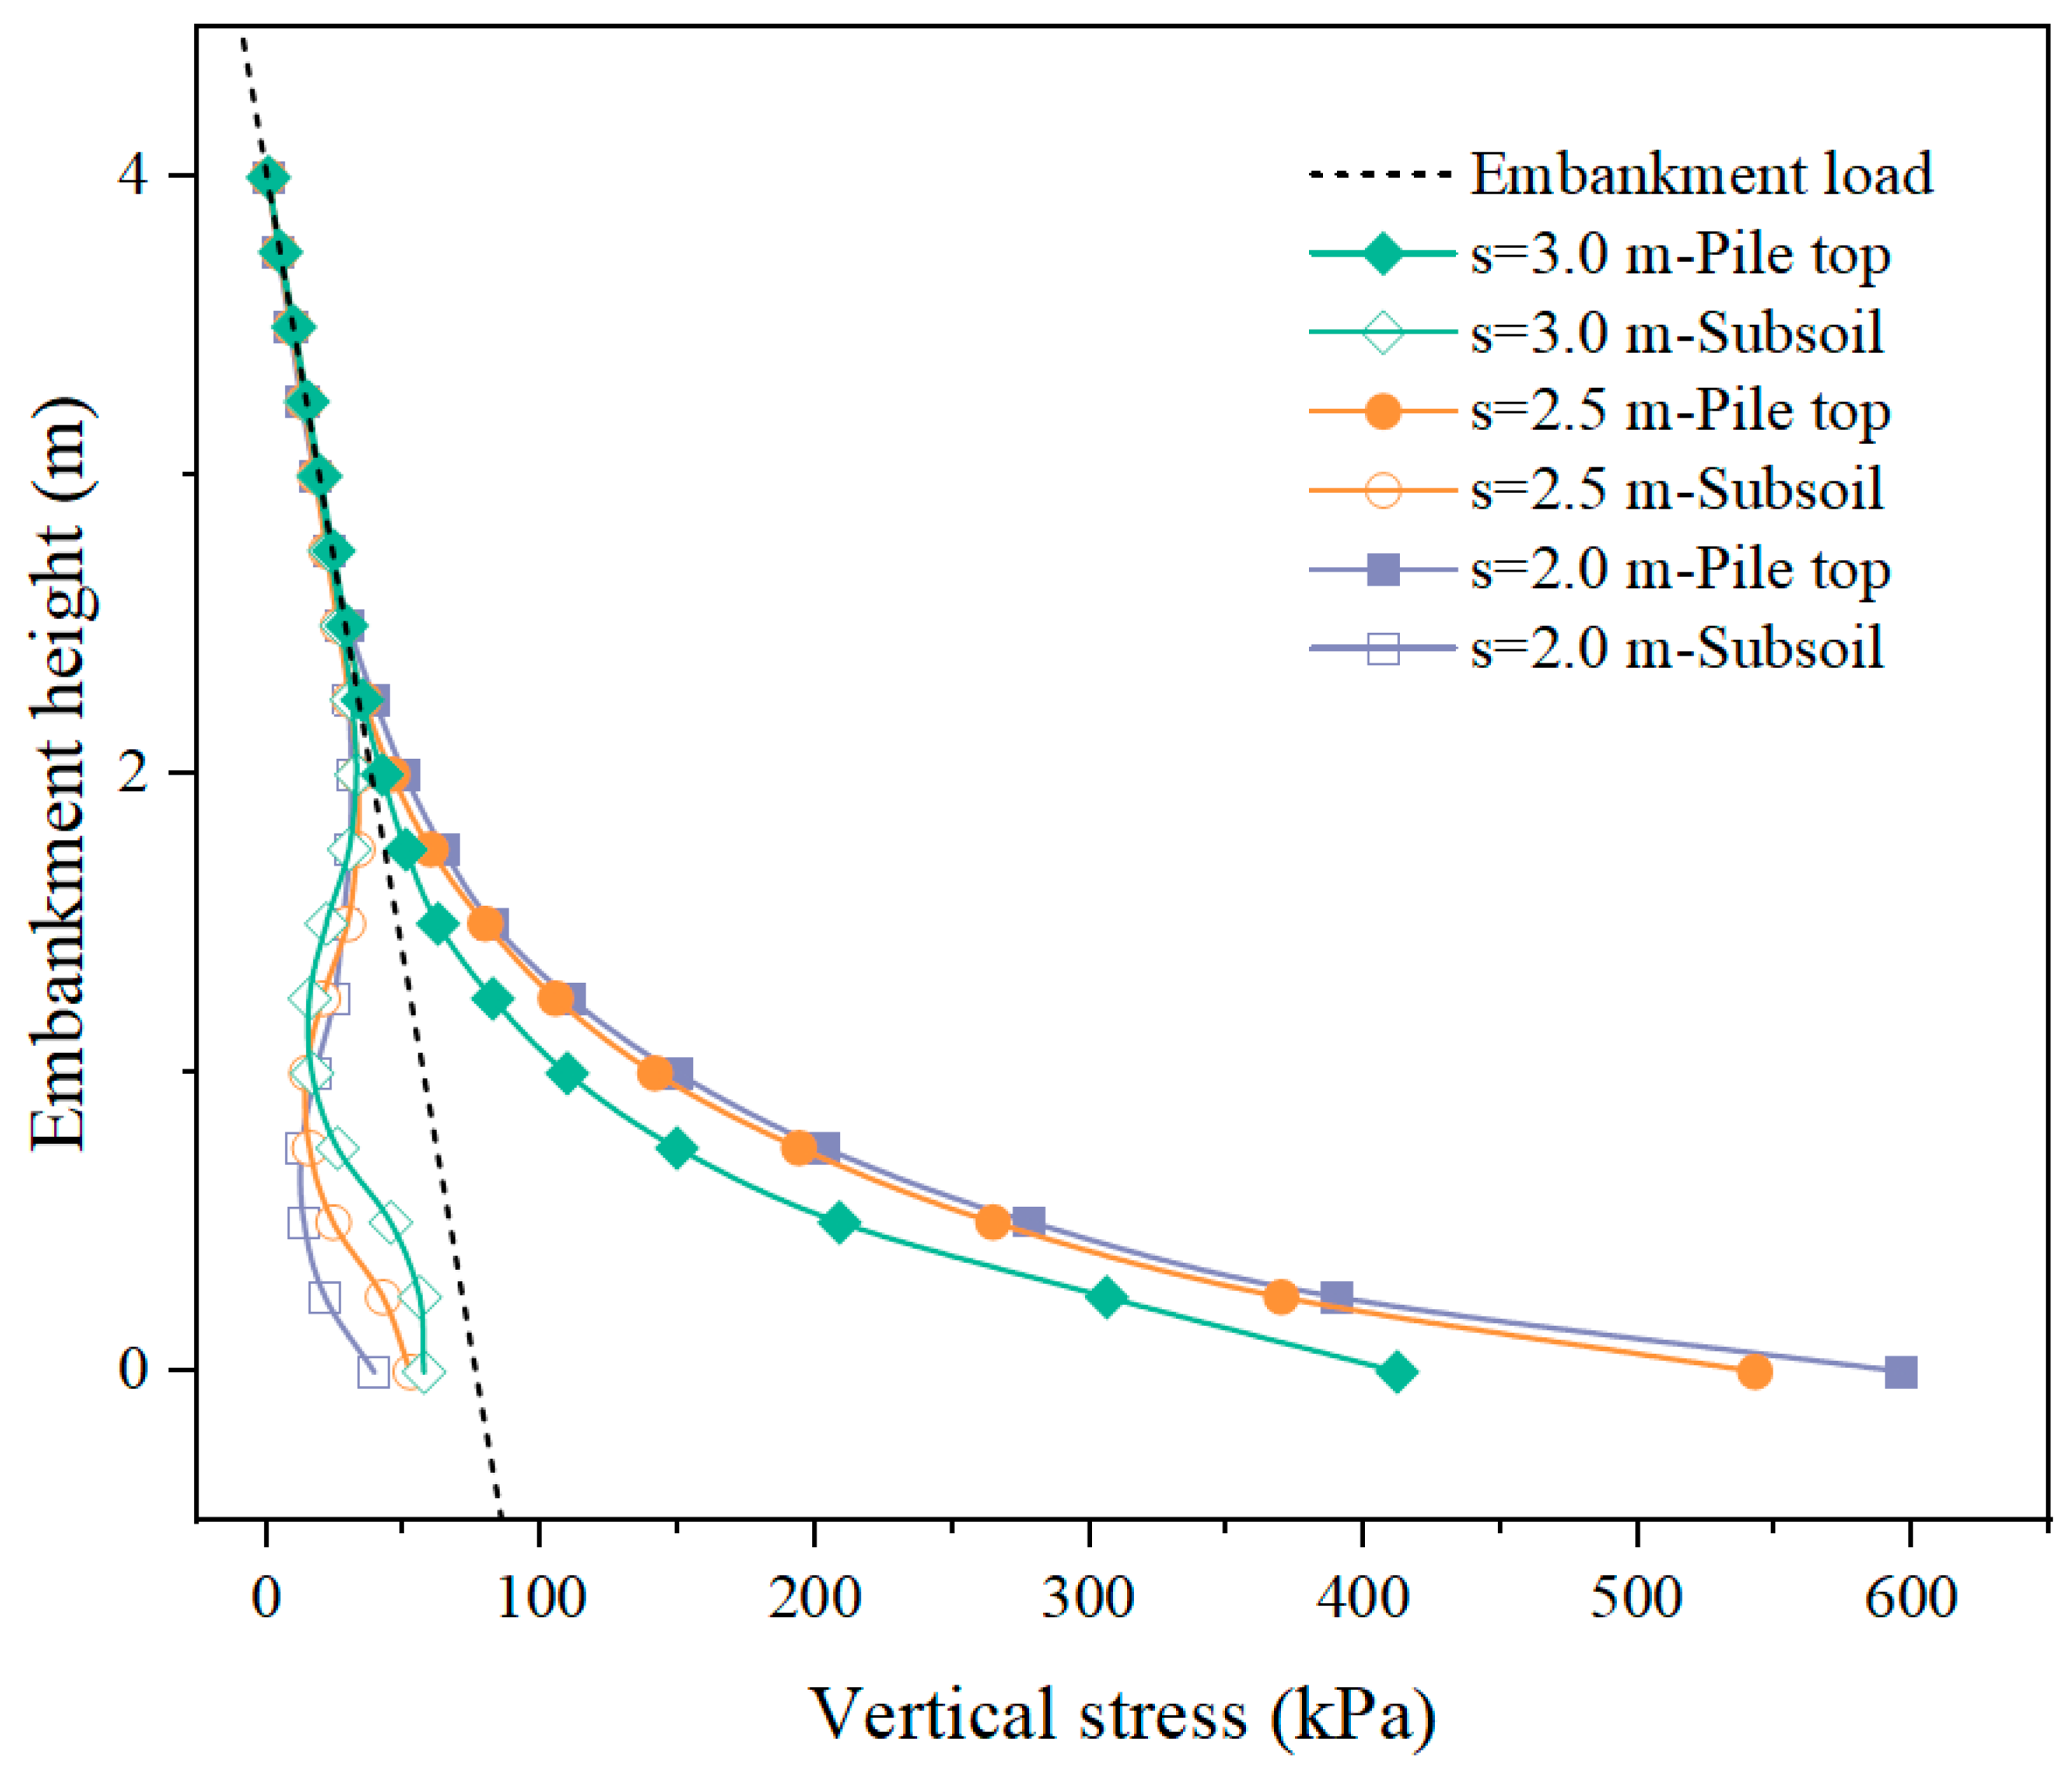
As shown in Figure 13, there is no variation in the stress distribution in the upper area of the embankment as the pile spacing increases, which is equal to the embankment load. It signifies that the upper soil of the embankment remains undisturbed. However, the vertical stress above the piles gradually decreases at the bottom of the embankment, while the vertical stress above the subsoil gradually increases. With an increase in pile spacing from 2.0 m to 3.0 m, the pile top stress decreases from 596 kPa to 412 kPa, and the surface stress of the subsoil increases from 39.05 kPa to 57.24 kPa. Furthermore, as the pile spacing increases, the height of the soil arch progressively increases. However, the pile–soil stress ratio decreases from 15.26 to 7.21, reducing load transfer to the piles.
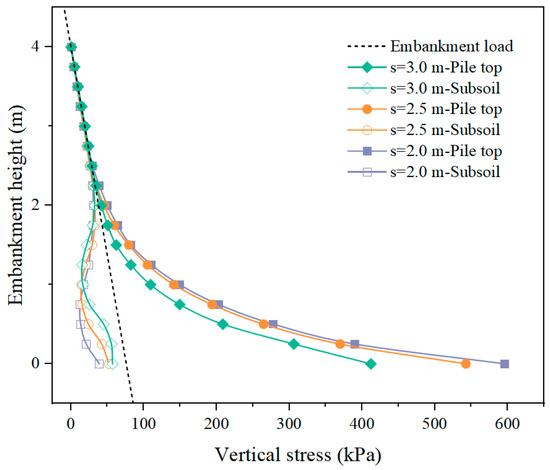
Figure 13.
Variation in vertical stress with different amounts of pile spacing.
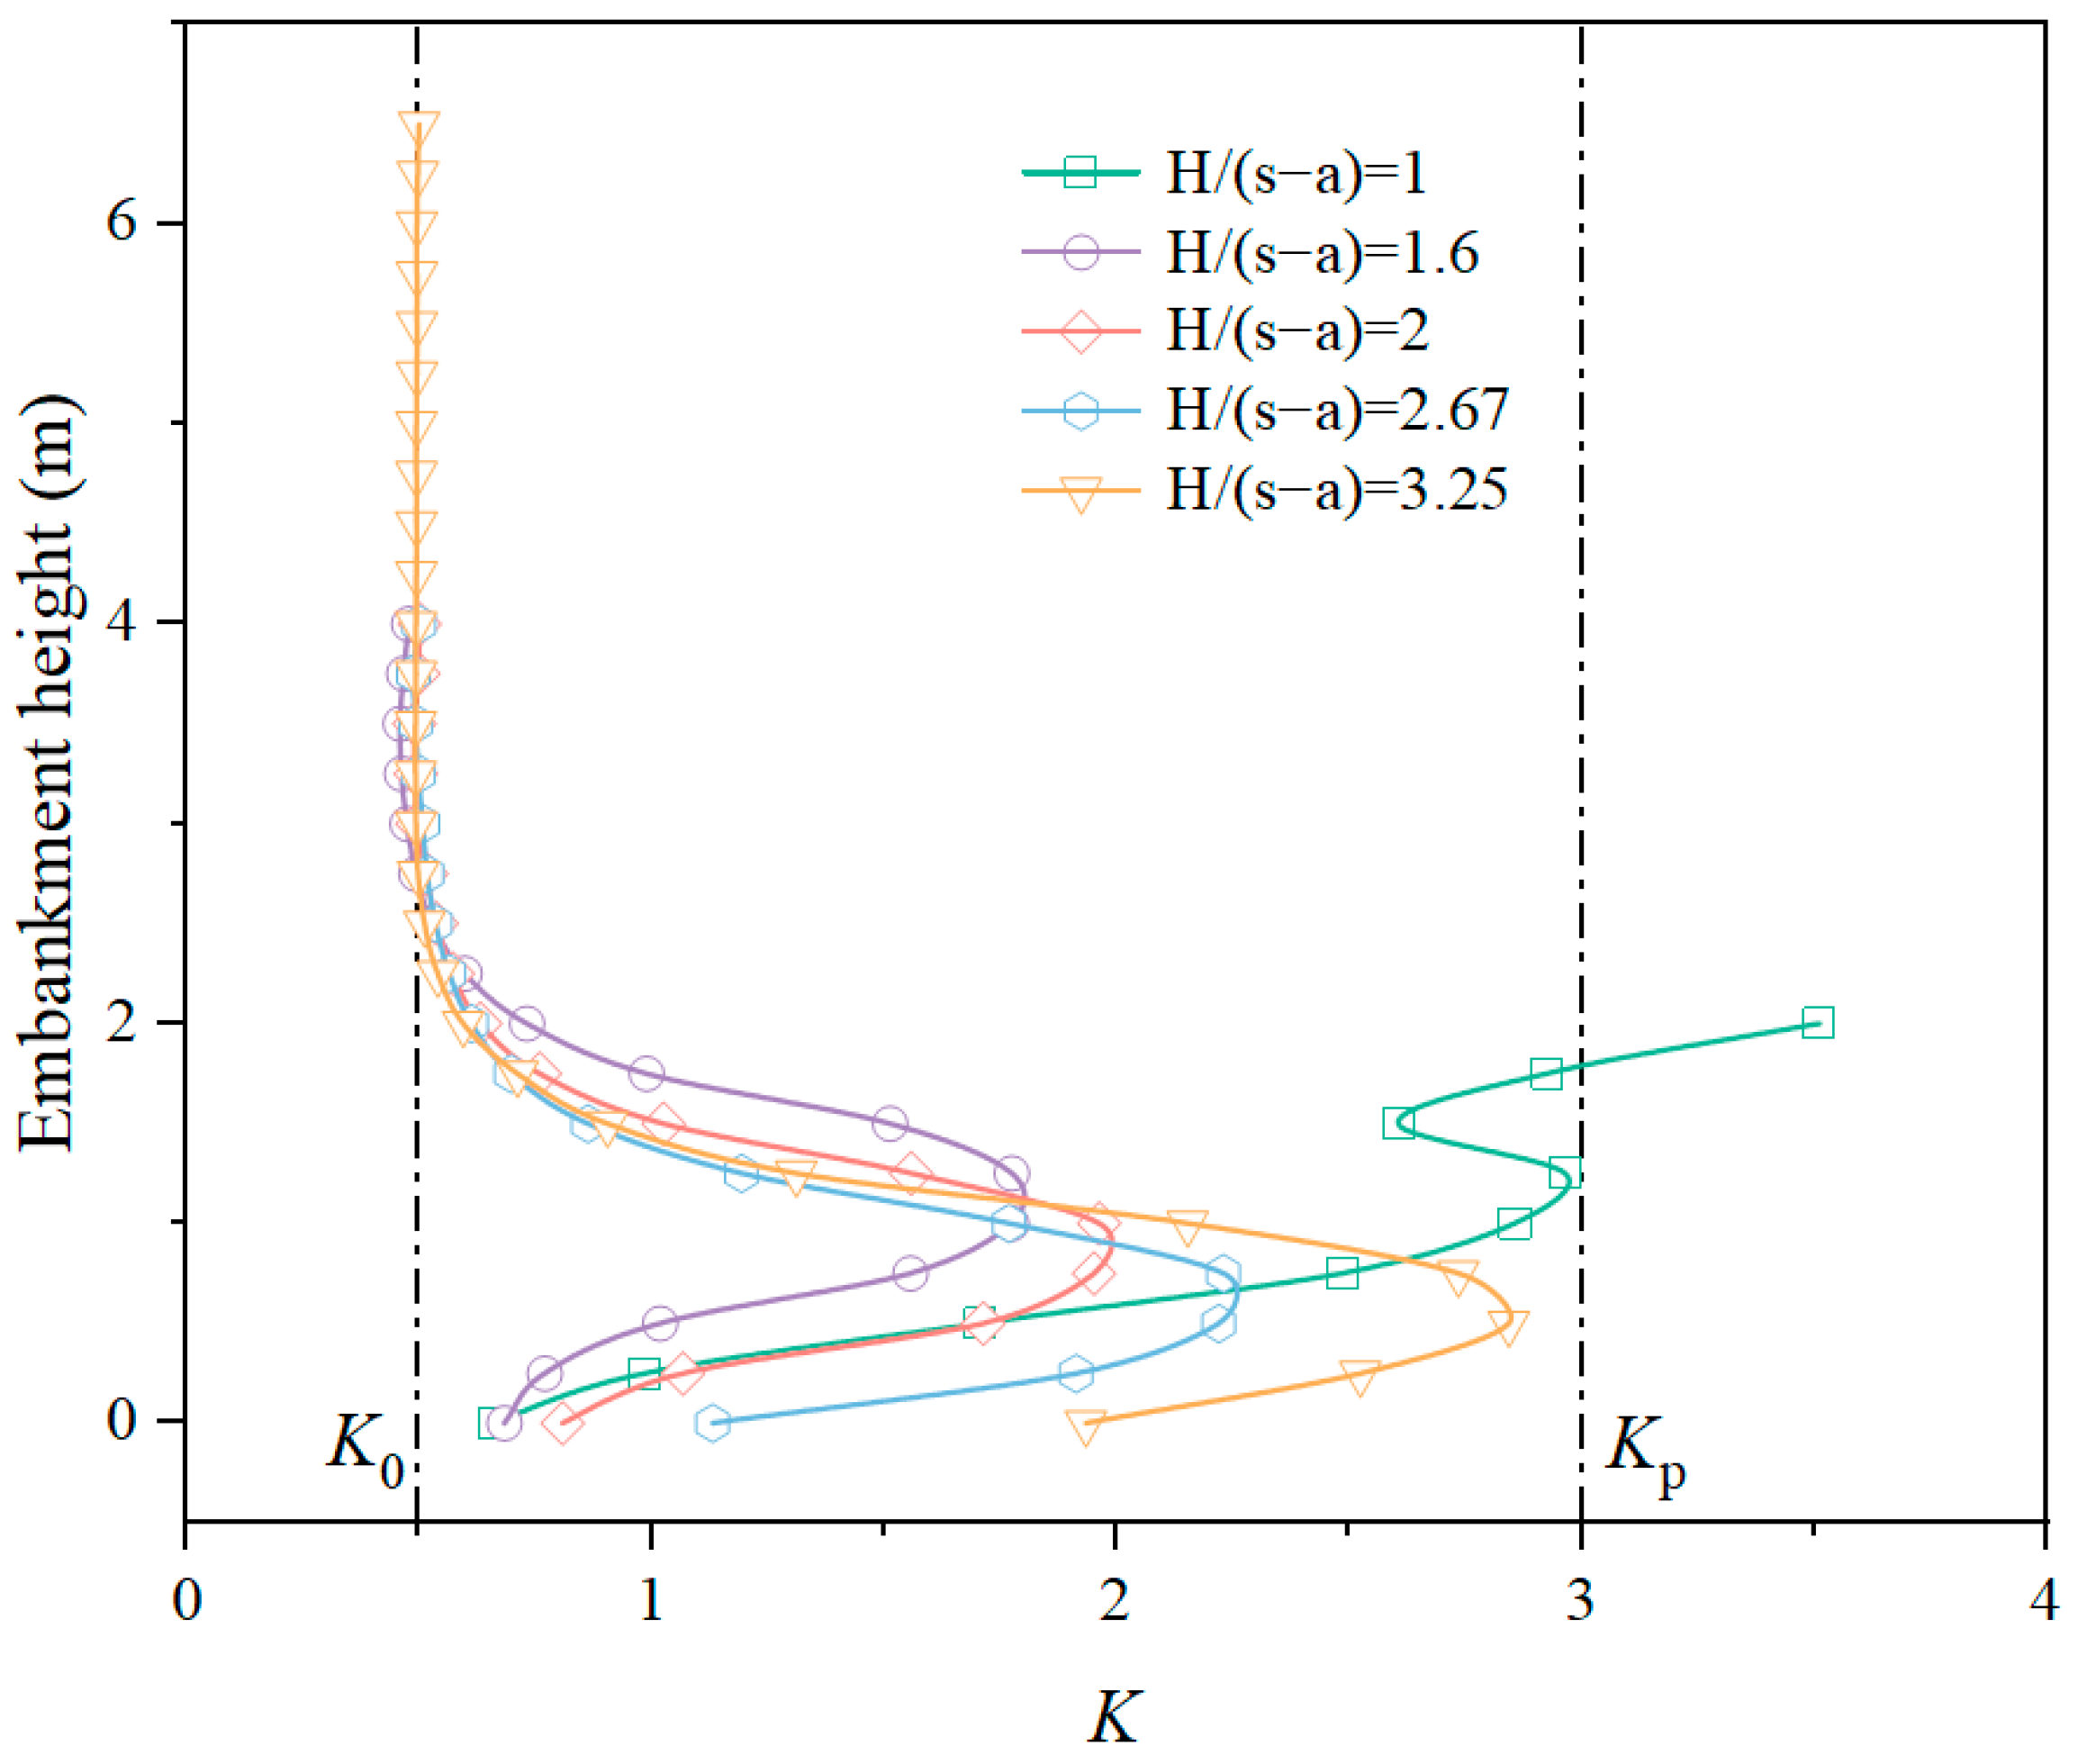
Figure 14 presents the variation in the earth pressure coefficient in the embankment as a function of the embankment height normalized by the net pile spacing (s − a). It has been found that when H/(s − a) ≥ 1.6, the earth pressure coefficient at the top of the embankment still approaches K0, indicating the onset of the soil arching effect. Even if the H/(s − a) reaches 3.25, the maximum value of K at the bottom of the embankment does not reach Kp, implying the absence of plastic failure. It has been concluded that the soil arching effect in the embankment supported by rigid floating piles does not fully develop due to the weaker foundation. With an increase in H/(s − a), the value of K gradually increases. When H/(s − a) is 3.25, the peak value of K in the embankment reaches 2.84, representing a 60% increase compared to H/(s − a) = 1.6. For the embankment with H/(s − a) = 1, however, the variation in K along the height of the embankment follows an “s” shape without the occurrence of soil arching. Additionally, it has been found that with an increase in pile spacing, both the inner and outer arch heights in the embankment gradually increase.
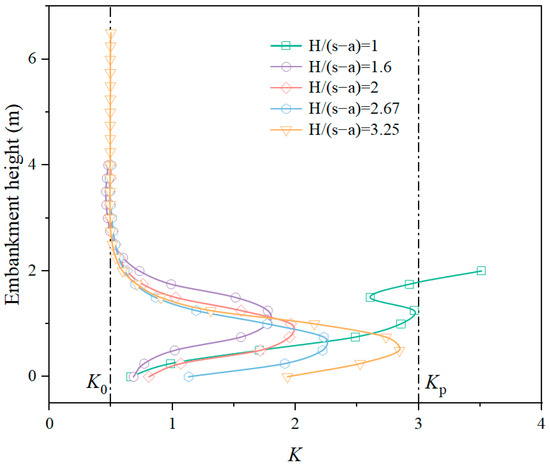
Figure 14.
Variation in K with normalized embankment heights.
4.2. Properties of Embankment Fill
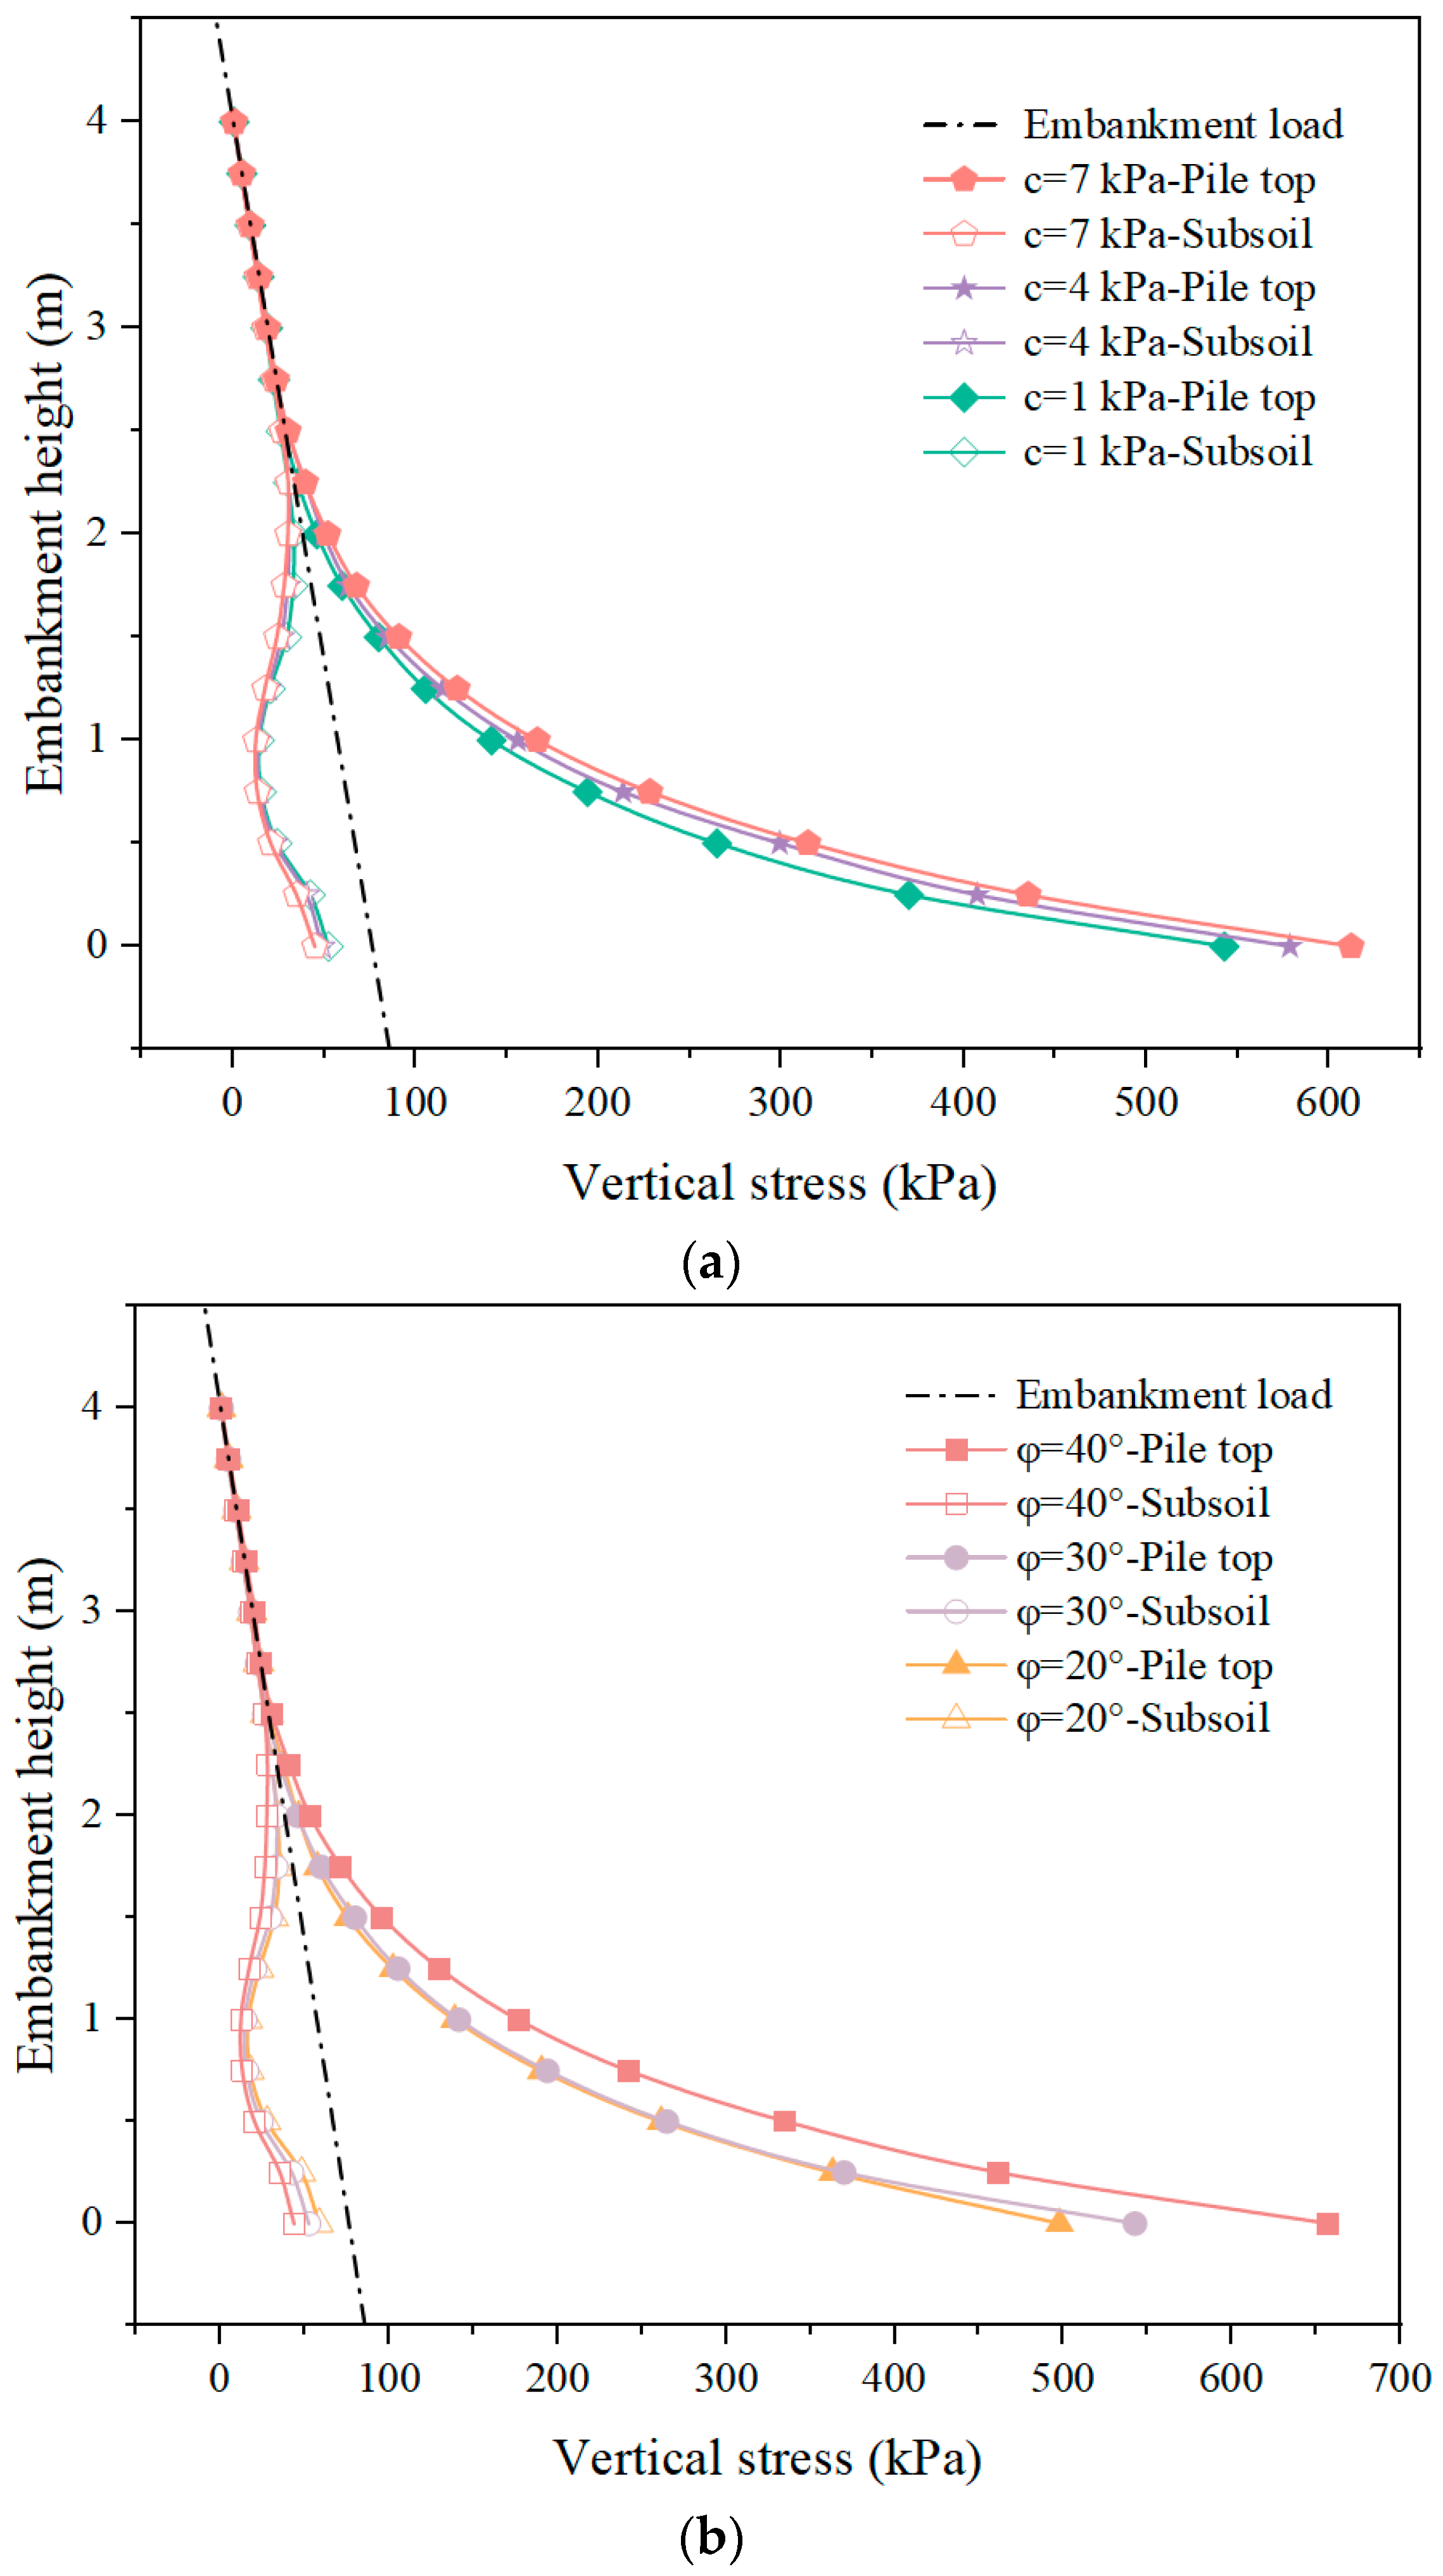
The cohesion and friction angle of the fill have a significant effect on the load transfer of piled embankments. Figure 15 shows the distribution of vertical stresses in the embankment with varying embankment heights under different conditions of fill cohesion and friction angle. As the cohesive strength and friction angle increase, the load transfer to the piles is gradually enhanced. However, the influence of cohesion is much less significant than the friction angle. With an increase in the friction angle from 20° to 40°, the vertical stress on the piles increases by 32.2%, while the vertical stress above the subsoil decreases by 34.9%. On the other hand, with an increase in cohesion from 1 kPa to 7 kPa, the vertical stress on the piles only increases by 12.7%, and the load above the subsoil decreases by only 18.2%. Moreover, it has been found that with an increase in the friction angle, there is a slight decrease in the soil arch height. However, with an increase in cohesion, the soil arch height remains relatively unchanged.
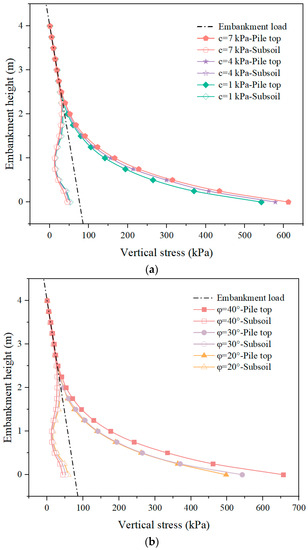
Figure 15.
Variation in vertical stress with different properties of embankment fill: (a) cohesion; (b) friction angle.
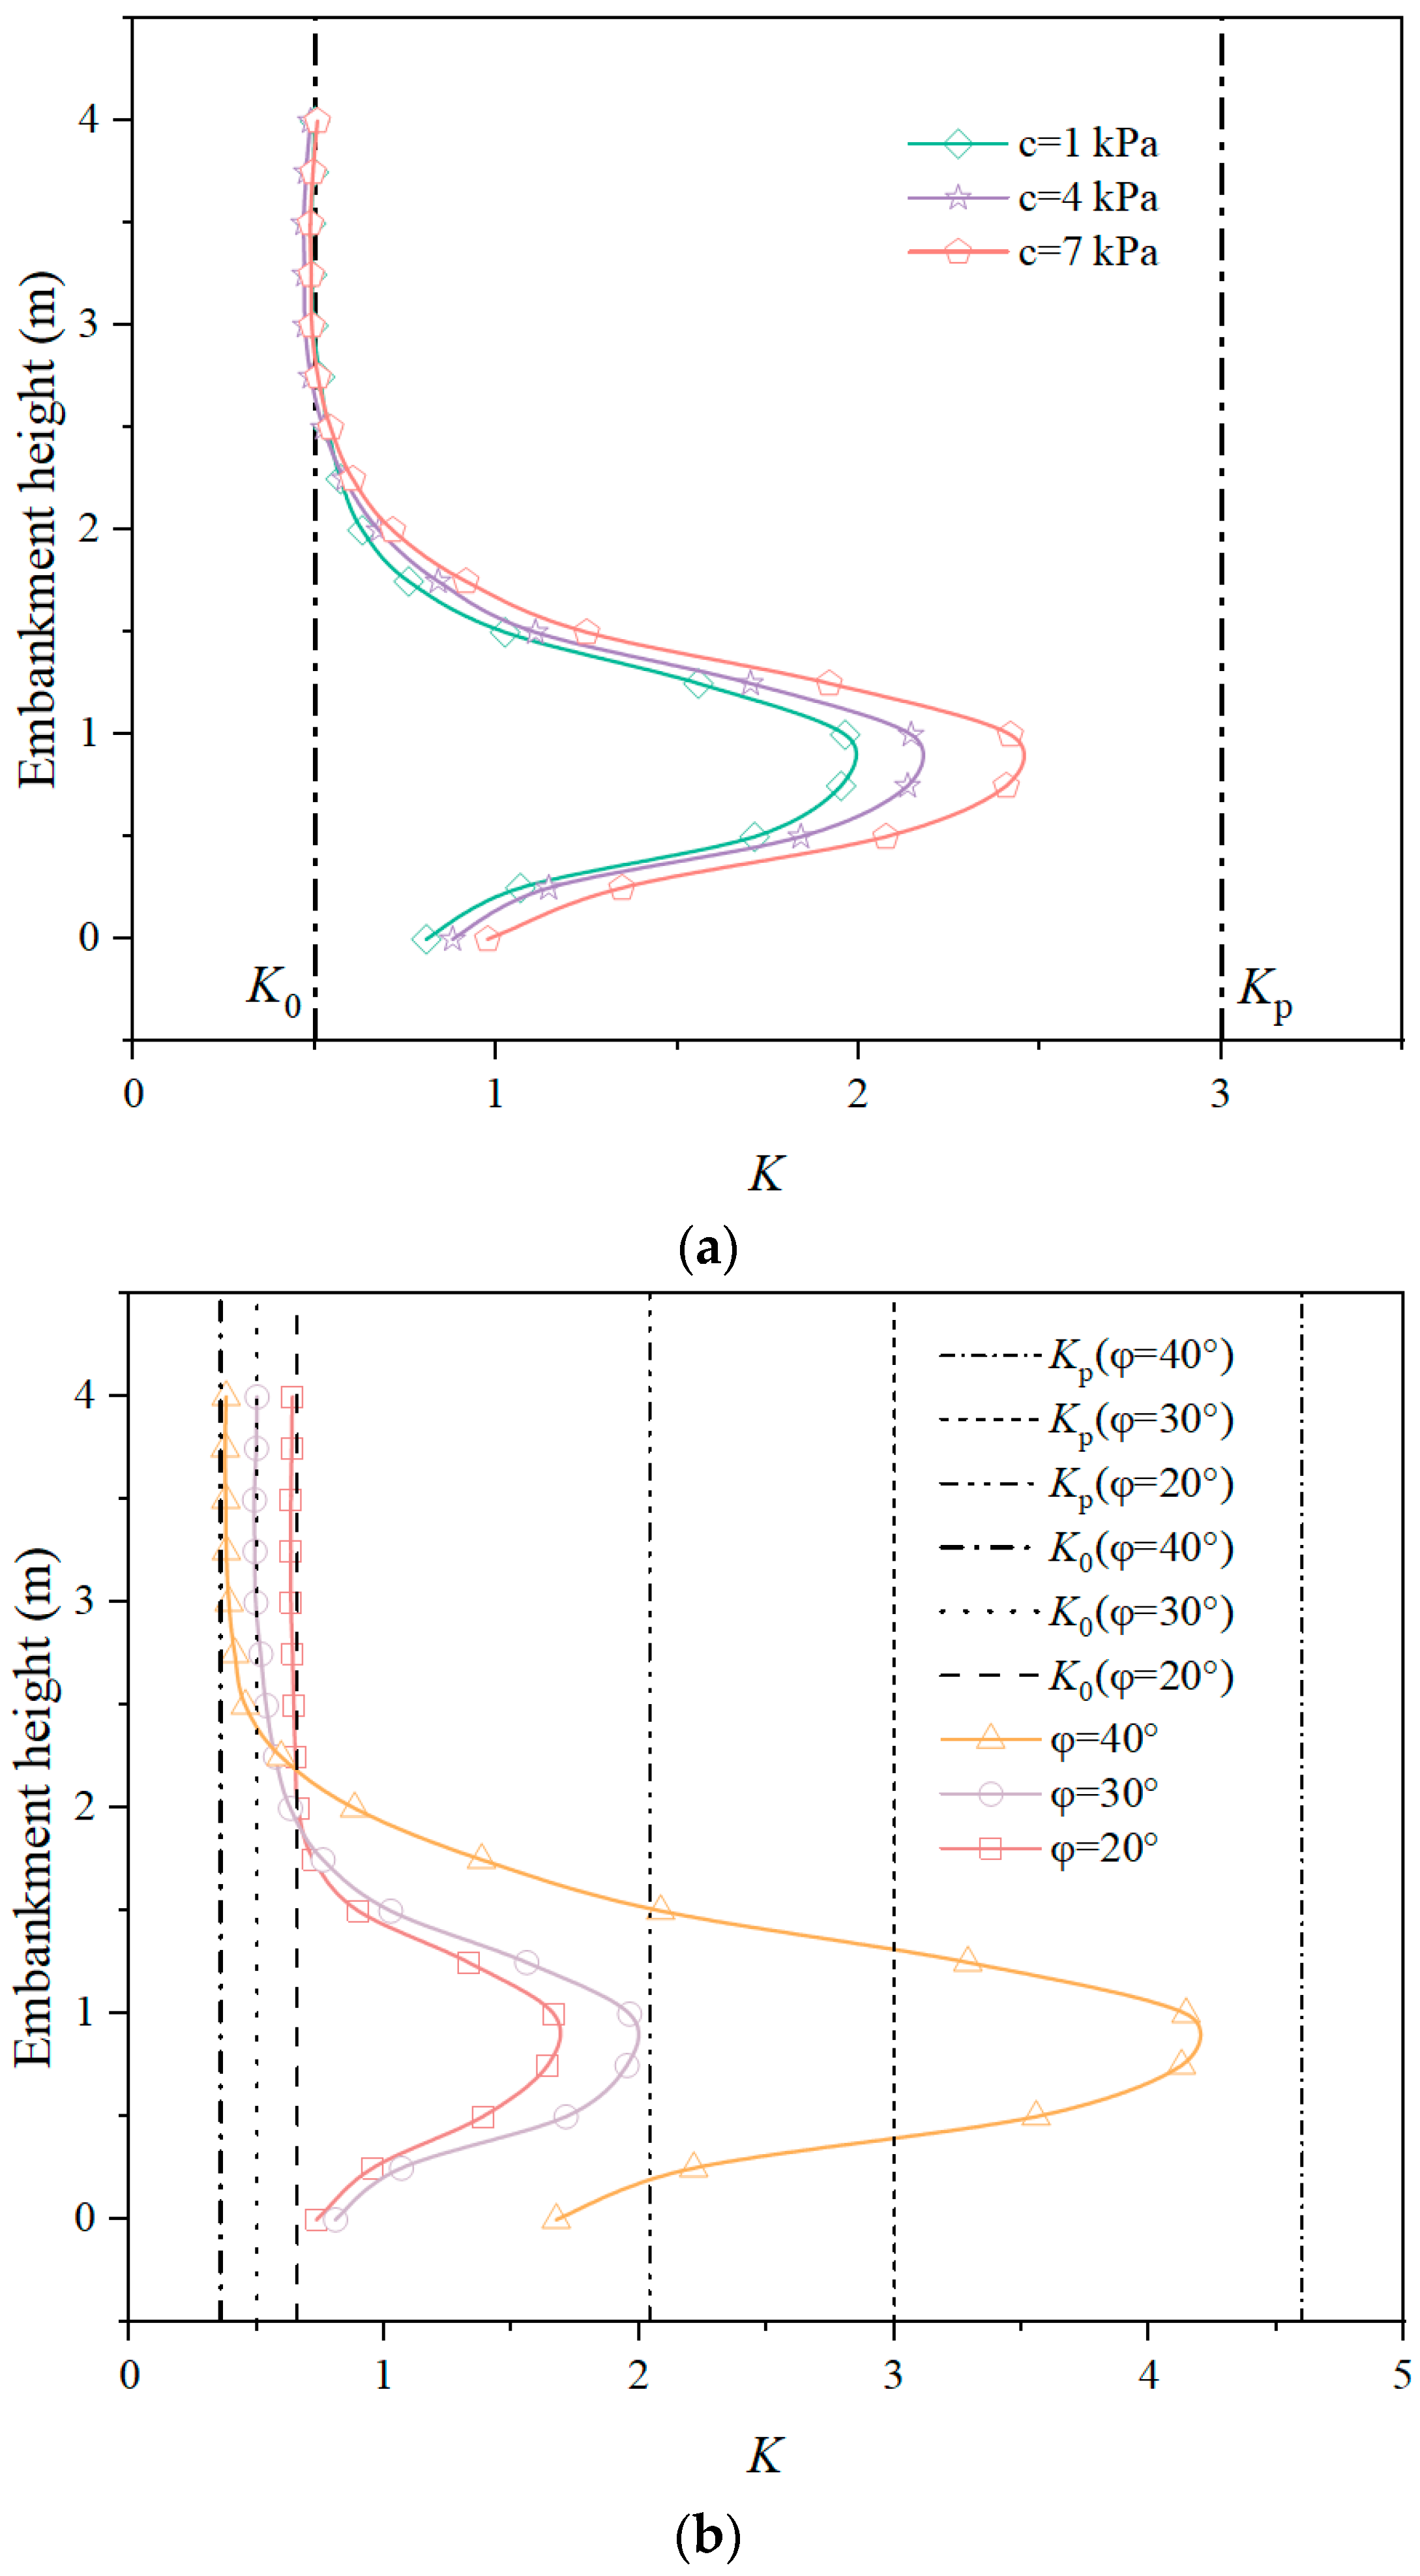
Figure 16a presents the distribution patterns of the earth pressure coefficient in the embankment for different amounts of fill cohesion and friction angles. It has been found that the K in the embankment continuously increases as the cohesion increases. Especially at c = 7 kPa, the K value reaches 2.42, indicating a seemingly more mature soil arching effect. However, it should be noted that the calculation of the Kp in Rankine theory does not consider soil cohesion. It is only applicable to soils with low cohesion. The calculated value of Kp is underestimated when the fill cohesion reaches 7 kPa. Therefore, it is impossible to conclude whether the soil arching strengthens with increased cohesion.
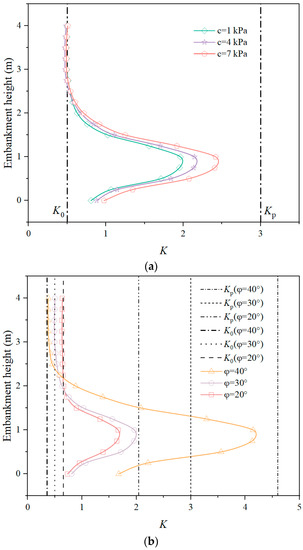
Figure 16.
Variation in K with different properties of embankment fill: (a) cohesion; (b) friction angle.
Figure 16b illustrates the variation in K values in the embankment with different fill friction angles, along with the corresponding K0 and Kp values. It has been found that the K value in the embankment continues to increase as the friction angle of the fill material increases, indicating a stronger arching effect, but the peak value of K remains below Kp, and the soil arching is not fully developed. Therefore, selecting fill materials with higher friction angles can enhance the soil arching effect in the embankment supported by rigid floating piles, but does not cause plastic failure to occur.
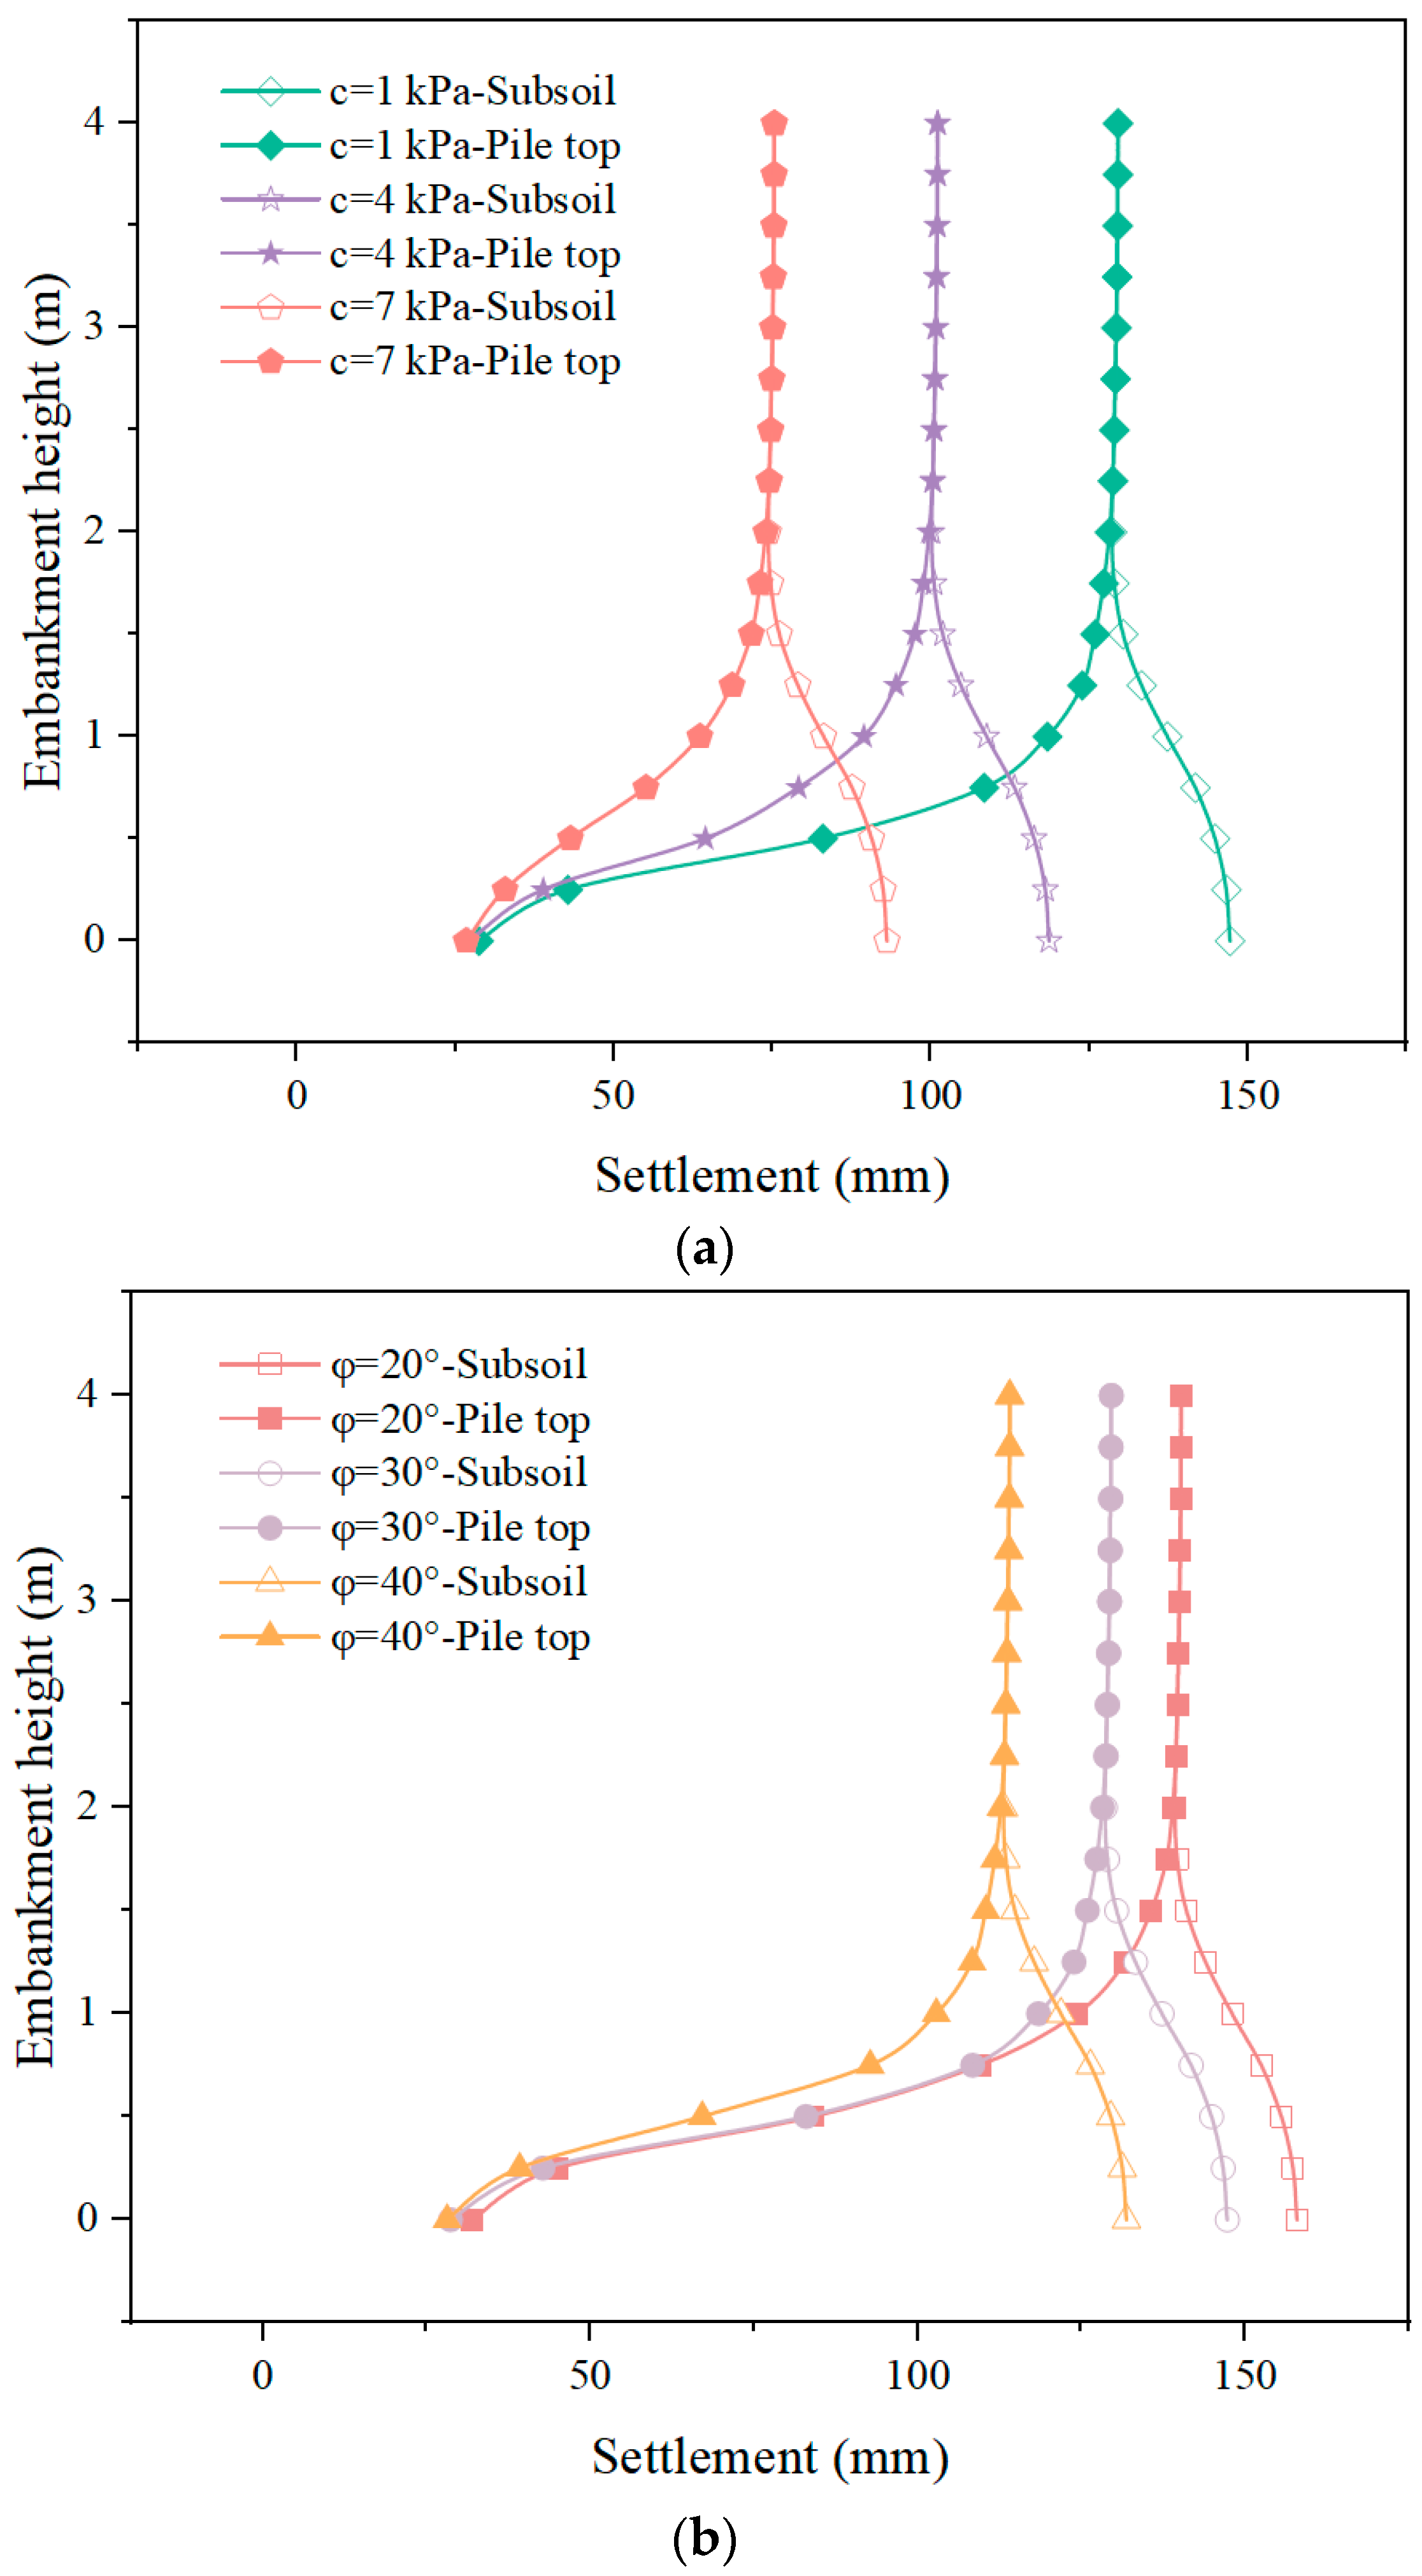
As shown in Figure 17, increasing both the cohesion and friction angle of the fill material is beneficial for reducing the settlement of the embankment. Compared to the friction angle, increasing cohesion leads to higher efficiency in settlement control. When the cohesion increases from 1 kPa to 7 kPa, the surface settlement of the embankment decreases by 72%, and the settlement of the subsoil reduces by 58%. On the other hand, when the friction angle increases from 20° to 40°, the surface settlement of the embankment decreases by 22.8%, and the settlement of the subsoil decreases by 19.8%. During this process, the settlement at the pile top remains unchanged, indicating that increasing the cohesion and friction angle reduces differential settlements between the pile and the surrounding subsoil. Furthermore, the increase in cohesion and friction angle does not cause significant changes in the equal settlement plane. For embankments supported by rigid floating piles, the rational selection of fill materials with higher cohesion and friction angle is advantageous in reducing differential and surface settlement.
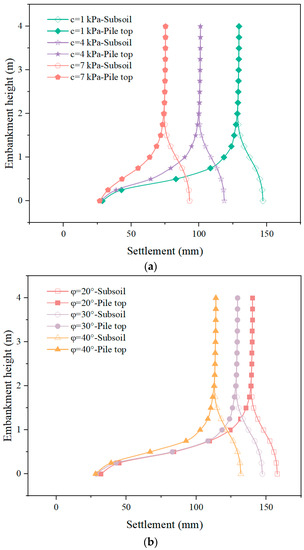
Figure 17.
Variation in settlement with different properties of embankment fill: (a) cohesion; (b) friction angle.
4.3. Pile Length
The bearing capacity of the foundation is related to the imposed load on the base, which is proportional to the pile length (i.e., the thickness of the subsoil). Therefore, an increase in pile length signifies an enhancement in the bearing capacity of the foundation, and its effect on soil arching will not be repeated. Bhasi and Rajagopal [44] have found that floating piles rely on end resistance and skin friction to sustain the embankment load. When the settlement of the subsoil exceeds that of the pile, negative skin friction occurs, whereas positive skin friction occurs when the settlement of the pile exceeds that of the surrounding soil. Changes in pile length led to variations in the distribution of end resistance and skin friction, thereby influencing the development of soil arching.
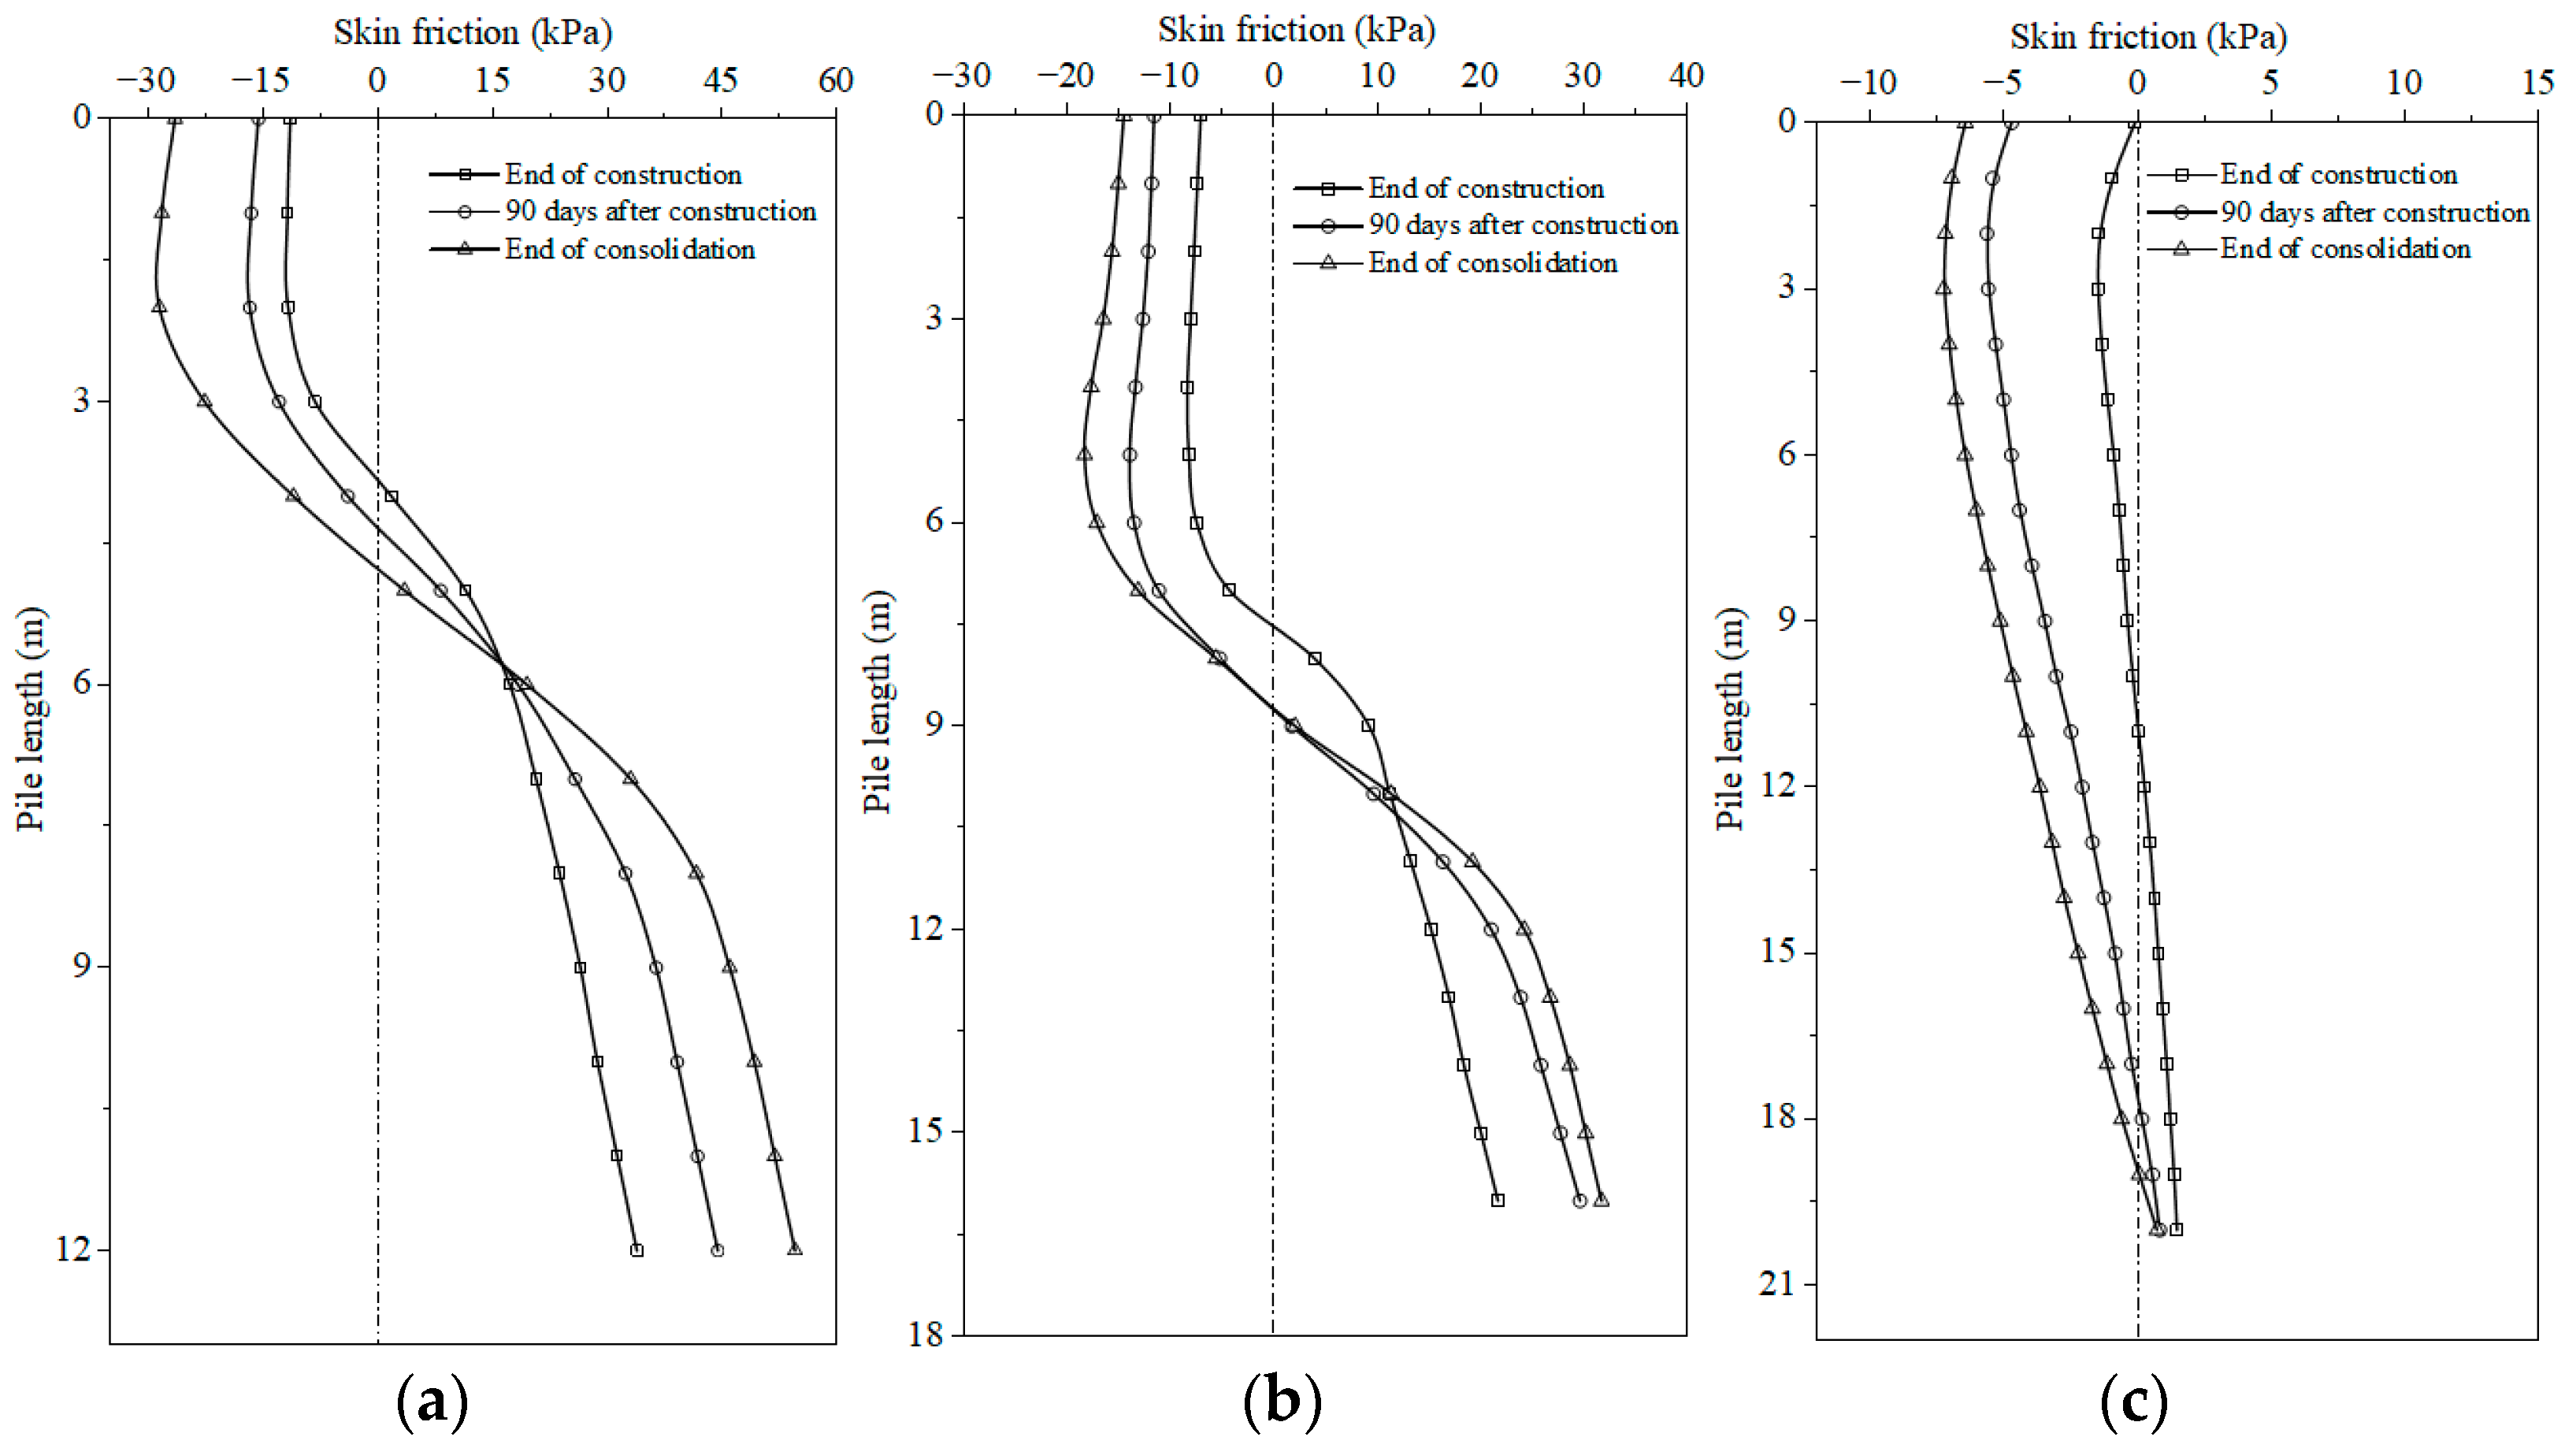
Figure 18 and Figure 19 show the distribution of pile axial forces and skin friction along the pile for different pile lengths. It has been found that the 12 m pile exhibits the highest skin friction, which is 56% greater than that of the 16 m pile and three times that of the 20 m pile. As soil consolidation progresses, the skin friction for three lengths of piles gradually increases. The neutral plane (where skin friction is zero) gradually moves downward. After consolidation, the neutral plane for the 12 m pile is located at a depth of 5 m, while for the 16 m pile, it reaches a depth of 9 m. For the 20 m pile, positive skin friction is almost negligible along the entire pile length, and the neutral plane appears at the pile tip when soil consolidation is accomplished.
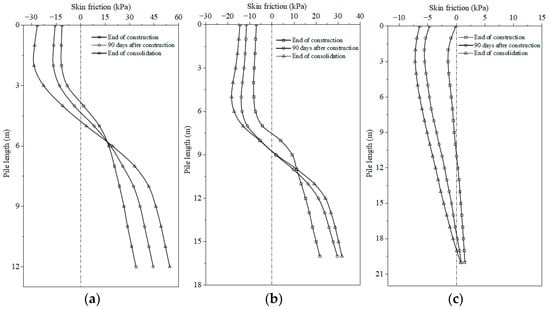
Figure 18.
Skin friction distributions with depth for different lengths of the pile: (a) 12 m; (b) 16 m; (c) 20 m.
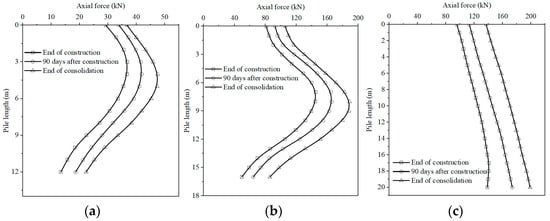
Figure 19.
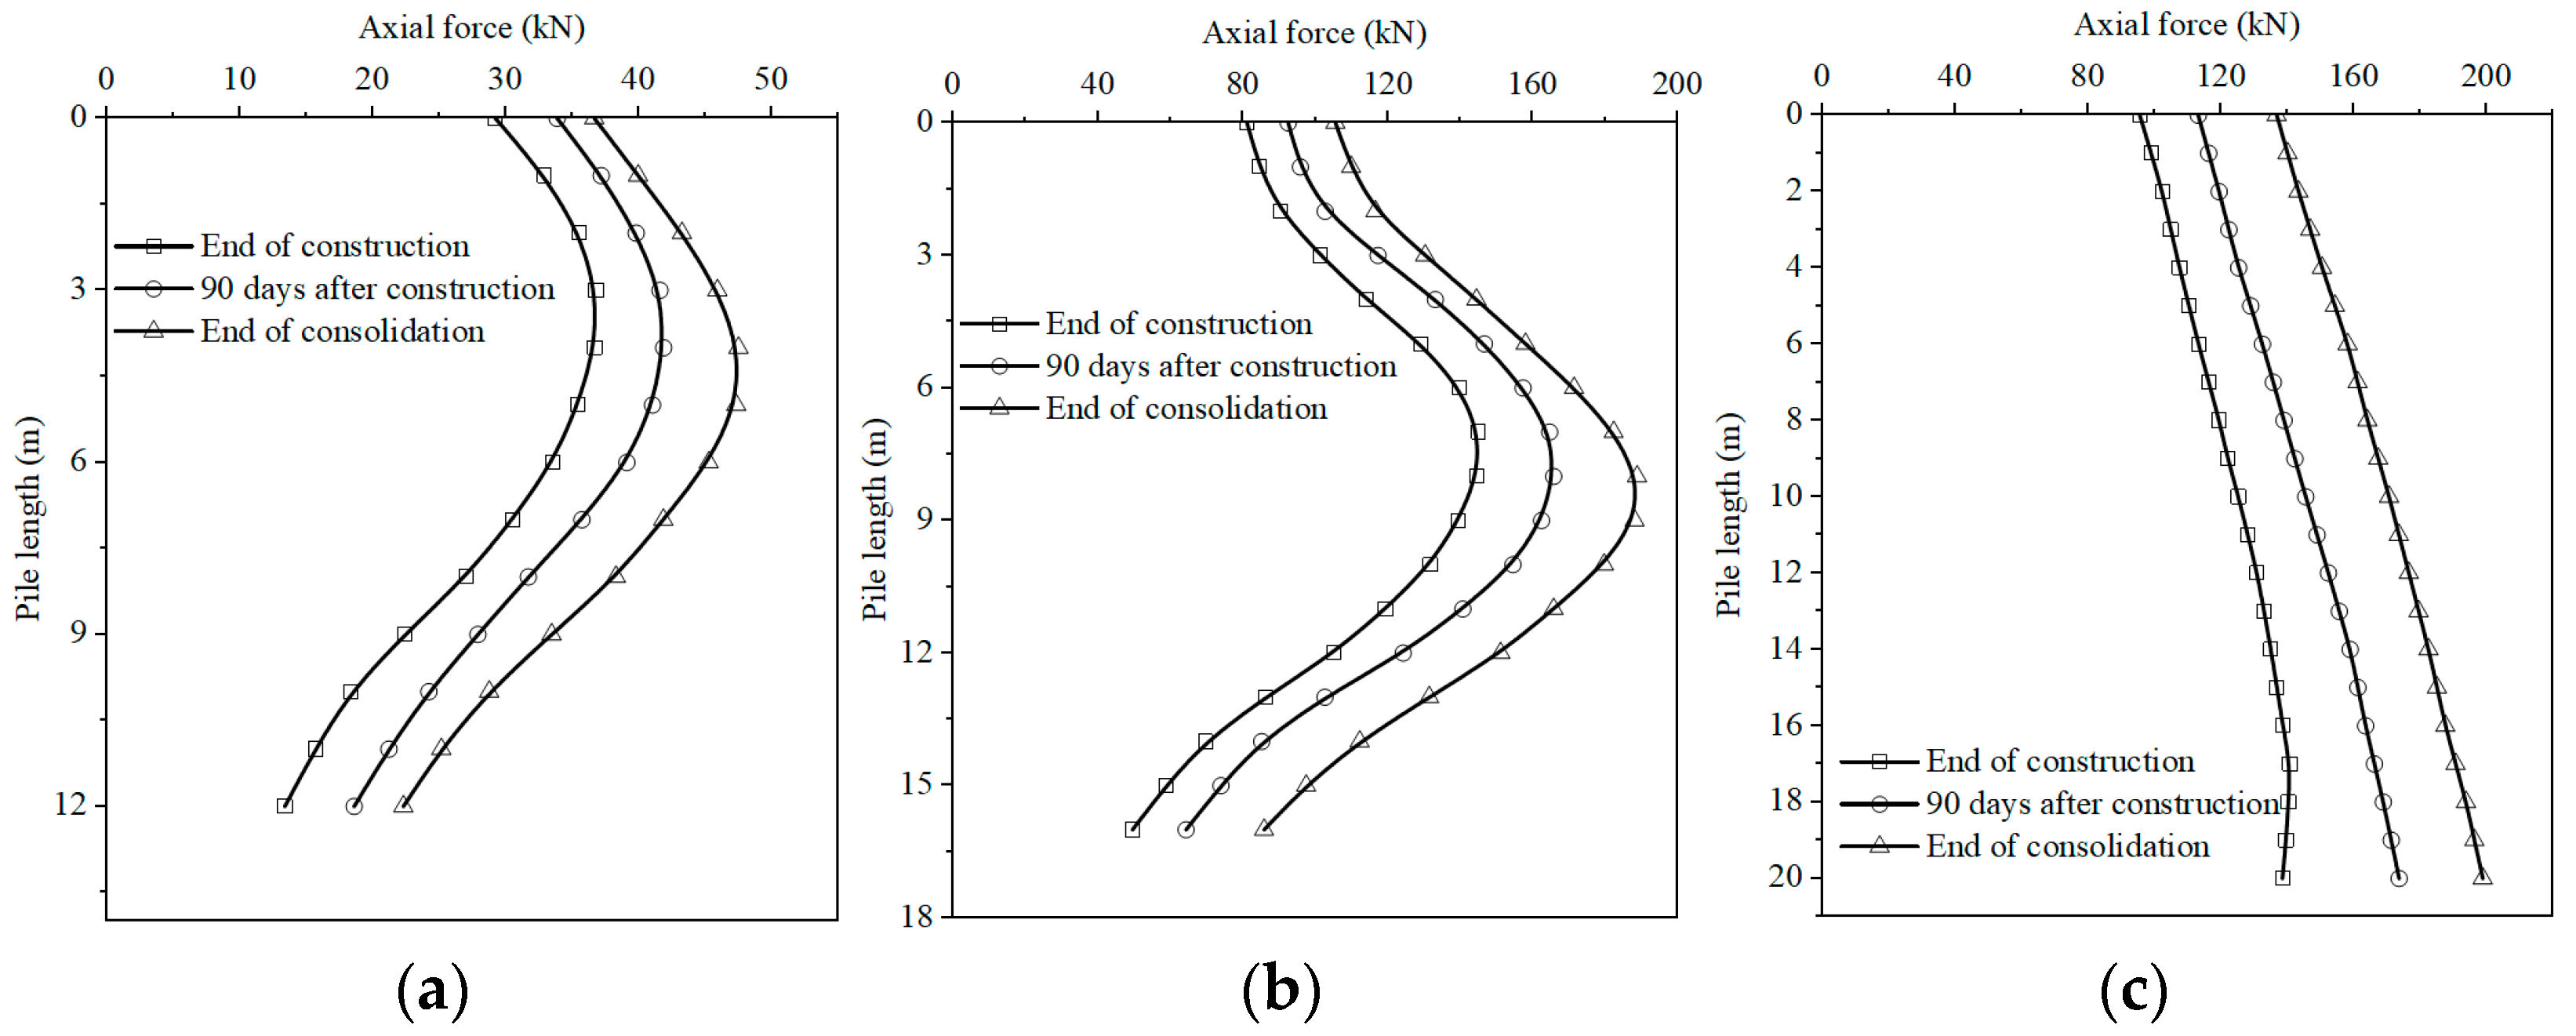
Axial force distribution along the pile with time for different lengths of the pile: (a) 12 m; (b) 16 m; (c) 20 m.
The axial force increases with soil consolidation for three piles, as shown in Figure 19. It exhibits a trend of initially increasing and then decreasing along the pile length, reaching its maximum value at the neutral plane. The 12 m pile exhibits the lowest axial force, being only 25% of that of the 20 m pile. It has been observed that rigid floating piles rely on end resistance and skin friction to sustain the superimposed load. Moreover, as the pile length increases, the skin friction decreases continuously while the axial force on the pile gradually increases.
5. Conclusions
In this paper, a three-dimensional finite element model was developed. The critical bearing capacity of subsoil for distinguishing flexible and rigid floating piles was determined. Two typical engineering cases were used to validate the accuracy and practicality of the modeling method, with a maximum error of less than 20%. Furthermore, an analysis of the factors influencing soil arching in embankments supported by rigid floating piles was conducted. The main conclusions are as follows:
- (1)
- Soil arching in the embankment begins to occur when the bearing capacity of the foundation reaches 150 kPa, at which point the pile will function as a rigid floating pile. When the bearing capacity of the foundation reaches 280 kPa, plastic failure occurs at the bottom of the embankment, and the soil arching is fully developed, aligning with the criteria for end-bearing piles.
- (2)
- It has been found that the soil arching in the embankment supported by rigid floating piles does not fully develop due to an insufficient bearing capacity of the foundation. When H/(s − a) ≥ 1.6, the earth pressure coefficient at the top of the embankment still approaches K0, indicating the onset of soil arching. Even if the H/(s − a) reaches 3.25, no plastic failure occurs in the embankment. As the pile spacing increases, the height of both the inner and outer arches in the embankment increases.
- (3)
- Selecting an embankment fill with a higher friction angle was beneficial for the development of soil arching. A larger fill cohesion can effectively reduce the differential settlement in the embankment. With an increase in the friction angle from 20° to 40°, the vertical stress above the subsoil decreased by 34.9%. It was found that the increase in cohesion from 1 kPa to 7 kPa reduced the settlement on top of the embankment and surface of subsoil by approximately 72% and 58%, respectively.
- (4)
- It was also revealed that rigid floating piles rely on end resistance and skin friction to sustain the overlying load. The skin friction of the pile increases and the neutral plane gradually moves downward as soil consolidation progresses. With increasing pile length from 12 m to 20 m, the skin friction decreased by 66.7% while the axial force along the pile increased by 300%.
Author Contributions
Conceptualization, Y.Z.; methodology, Y.Z. and S.H.; software, S.H.; writing—original draft preparation, Y.Z.; writing—review and editing, S.H.; validation, H.F.; formal analysis, H.F.; data curation, Y.Z.; visualization, S.H. and H.F.; supervision, Y.Z.; funding acquisition, Y.Z. All authors have read and agreed to the published version of the manuscript.
Funding
The financial support of the National Natural Science Foundation for General Program of China (Grant No. 52178316) and the National Science Foundation for Excellent Young Scholars of China (Grant No. 51922029) is acknowledged.
Institutional Review Board Statement
Not applicable.
Informed Consent Statement
Not applicable.
Data Availability Statement
The data presented in this study are available upon request from the corresponding author.
Conflicts of Interest
The authors declare no conflict of interest.
References
- Dolati, S.S.K.; Mehrabi, A. Review of available systems and materials for splicing prestressed-precast concrete piles. Structures 2021, 30, 850–865. [Google Scholar] [CrossRef]
- Dolati, S.S.K.; Mehrabi, A. Alternative systems and materials for splicing prestressed-precast concrete piles. Transp. Res. Rec. 2021, 03611981211052949. [Google Scholar] [CrossRef]
- Nguyen, V.; Luo, Q.; Xue, Y.; Wang, T.F.; Zhang, L.; Zhang, D.Q. Extended concentric arches model for piled beam-supported embankments. Comput. Geotech. 2023, 160, 105517. [Google Scholar] [CrossRef]
- Mangraviti, V.; Flessati, L.; di Prisco, C. Mathematical modelling of the mechanical response of geosynthetic-reinforced and pile-supported embankments. Int. J. Numer. Anal. Methods Geomech. 2023, 47, 2438–2466. [Google Scholar] [CrossRef]
- Lang, R.Q.; Ma, C.H.; Cheng, X.L.; Sun, L.Q.; Zhou, L.; Zhang, J.X.; Feng, S.Z.; Li, D. Numerical analysis of dynamic behavior of piled embankment under train loading. Comput. Geotech. 2023, 155, 105243. [Google Scholar] [CrossRef]
- Nguyen, V.; Luo, Q.; Wang, T.F.; Liu, K.W.; Zhang, L.; Nguyen, T.P. Load Transfer in Geosynthetic-Reinforced Piled Embankments with a Triangular Arrangement of Piles. J. Geotech. Geoenviron. Eng. 2023, 149, 04022131. [Google Scholar] [CrossRef]
- Liu, K.F.; Xue, K.R.; Wen, M.J.; Wang, L. Investigation on the long-term strain of geogrid in GRPS embankment under cyclic loading. Geosynth. Int. 2023. [Google Scholar] [CrossRef]
- Eidgahee, D.R.; Soleymani, A.; Hasani, H.; Kontoni, D.-P.N.; Jahangir, H. Flexural capacity estimation of FRP reinforced T-shaped concrete beams via soft computing techniques. Comput. Concr. 2023, 32, 1. [Google Scholar]
- Kumar, M.; Kumar, V.; Rajagopal, B.G.; Samui, P.; Burman, A. State of art soft computing based simulation models for bearing capacity of pile foundation: A comparative study of hybrid ANNs and conventional models. Model. Earth Syst. Environ. 2022, 9, 2533–2551. [Google Scholar] [CrossRef]
- Nguyen Van, C.; Keawsawasvong, S.; Nguyen, D.K.; Lai, V.Q. Machine learning regression approach for analysis of bearing capacity of conical foundations in heterogenous and anisotropic clays. Neural Comput. Appl. 2022, 35, 3955–3976. [Google Scholar] [CrossRef]
- Hu, S.; Zhuang, Y.; Wu, Y.; Zhang, X.; Dong, X. Numerical Study of Bearing Capacity of the Pile-Supported Embankments for the Flexible Floating, Rigid Floating and End-Bearing Piles. Symmetry 2022, 14, 1981. [Google Scholar] [CrossRef]
- Jamsawang, P.; Yoobanpot, N.; Thanasisathit, N.; Voottipruex, P.; Jongpradist, P. Three-dimensional numerical analysis of a DCM column-supported highway embankment. Comput. Geotech. 2016, 72, 42–56. [Google Scholar] [CrossRef]
- Berthelot, P.; Bret, T. Recommendations for the Design, Construction and Control of Rigid Inclusion Ground Improvements; Presses des Ponts: Paris, France, 2012; p. 316. [Google Scholar]
- GGS. Recommendations for Design and Analysis of Earth Structures Using Geosynthetic Reinforcements—EBGEO; John Wiley & Sons: Hoboken, NJ, USA, 2011. [Google Scholar]
- Satibi, S. Numerical Analysis and Design Criteria of Embankments on Floating Piles; Institut für Geotechnik der Universität Stuttgart IGS: Stuttgart, Germany, 2009. [Google Scholar]
- Van Eekelen, S.J.M.; Bezuijen, A.; van Tol, A.F. Analysis and modification of the British Standard BS8006 for the design of piled embankments. Geotext. Geomembr. 2011, 29, 345–359. [Google Scholar] [CrossRef]
- Cao, W.Z.; Zheng, J.J.; Zhang, J.; Zhang, R.J. Field test of a geogrid-reinforced and floating pile-supported embankment. Geosynth. Int. 2016, 23, 348–361. [Google Scholar] [CrossRef]
- Pan, G.; Liu, X.; Yuan, S.; Wang, Y.; Sun, D.; Feng, Y.; Jiang, G. A Field Study on the Arching Behavior of a Geogrid-Reinforced Floating Pile-Supported Embankment. Transp. Geotech. 2022, 37, 100795. [Google Scholar] [CrossRef]
- Phutthananon, C.; Jongpradist, P.; Jamsawang, P. Influence of cap size and strength on settlements of TDM-piled embankments over soft ground. Mar. Georesour. Geotechnol. 2019, 38, 686–705. [Google Scholar] [CrossRef]
- Zhang, C.; Su, L.; Jiang, G. Full-scale model tests of load transfer in geogrid-reinforced and floating pile-supported embankments. Geotext. Geomembr. 2022, 50, 896–909. [Google Scholar] [CrossRef]
- Pham, T.A. Design and analysis of geosynthetic-reinforced and floating column-supported embankments. Int. J. Geotech. Eng. 2021, 16, 1276–1292. [Google Scholar] [CrossRef]
- King, L.; Bouazza, A.; Gaudin, C.; O’Loughlin, C.D.; Bui, H.H. Behavior of Geosynthetic-Reinforced Piled Embankments with Defective Piles. J. Geotech. Geoenviron. Eng. 2019, 145, 04019090. [Google Scholar] [CrossRef]
- Yadav, S.K.; Ye, G.-l.; Khalid, U.; Fukuda, M. Numerical and centrifugal physical modelling on soft clay improved with floating and fixed sand compaction piles. Comput. Geotech. 2019, 115, 103160. [Google Scholar] [CrossRef]
- Shen, P.; Xu, C.; Han, J. Geosynthetic-reinforced pile-supported embankment: Settlement in different pile conditions. Geosynth. Int. 2020, 27, 315–331. [Google Scholar] [CrossRef]
- Zhang, H.; Wang, H.; Li, X.; Li, W.; Wu, J.; Lv, C.; Song, X.; Liu, M. An Analysis of Floating Geogrid-Reinforced Pile-Supported Embankments Containing Deep Softened Soil. Arab. J. Sci. Eng. 2021, 46, 10855–10868. [Google Scholar] [CrossRef]
- Reshma, B.; Rajagopal, K.; Viswanadham, B.V.S. Centrifuge model studies on the settlement response of geosynthetic piled embankments. Geosynth. Int. 2020, 27, 170–181. [Google Scholar] [CrossRef]
- Terzaghi, K.T. Theoretical Soil Mechanics; Wiley: Hoboken, NJ, USA, 1943. [Google Scholar]
- Rui, R.; van Tol, A.F.; Xia, Y.Y.; van Eekelen, S.J.M.; Hu, G. Investigation of Soil-Arching Development in Dense Sand by 2D Model Tests. Geotech. Test. J. 2016, 39, 415–430. [Google Scholar] [CrossRef]
- Hewlett, W.J.; Randolph, M.F. Analysis of piled embankments. Ground Eng. 1988, 21, 12–18. [Google Scholar]
- Carlsson, B. Reinforced Soil, Principles for Calculation; Terratema AB: Linköping, Sweden, 1987. (In Swedish) [Google Scholar]
- Guido, V. Plate loading tests on geogrid-reinforced earth slab. In Proceedings of the Geosynthetic’87 Conference, New Orleans, LA, USA, 24–25 February 1987; pp. 216–225. [Google Scholar]
- Iglesia, G.R.; Einstein, H.H.; Whitman, R.V. Investigation of Soil Arching with Centrifuge Tests. J. Geotech. Geoenviron. Eng. 2014, 140, 04013005. [Google Scholar] [CrossRef]
- Iglesia, G.R.; Einstein, H.H.; Whitman, R.V. Validation of centrifuge model scaling for soil systems via trapdoor tests. J. Geotech. Geoenviron. Eng. 2011, 137, 1075–1089. [Google Scholar] [CrossRef]
- Iglesia, G.R.; Einstein, H.H.; Whitman, R.V. Determination of vertical loading on underground structures based on an arching evolution concept. In Geo-Engineering for Underground Facilities; American Society of Civil Engineers: Reston, VA, USA, 1999; pp. 495–506. [Google Scholar]
- SIMULIA. ABAQUS/CAE User’s Manual; Dassault: Pawtucket, RI, USA, 2020. [Google Scholar]
- Zhuang, Y.; Wang, K. Finite-element analysis of arching in highway piled embankments subjected to moving vehicle loads. Géotechnique 2018, 68, 857–868. [Google Scholar] [CrossRef]
- Almeida, M.S.S.; Hosseinpour, I.; Riccio, M.; Alexiew, D. Behavior of Geotextile-Encased Granular Columns Supporting Test Embankment on Soft Deposit. J. Geotech. Geoenviron. Eng. 2015, 141, 04014116. [Google Scholar] [CrossRef]
- Liu, H.L.; Ng, C.W.W.; Fei, K. Performance of a Geogrid-Reinforced and Pile-Supported Highway Embankment over Soft Clay: Case Study. J. Geotech. Geoenviron. Eng. 2007, 133, 1483–1493. [Google Scholar] [CrossRef]
- Prandtl, L. About the hardness of a plastic body. Nachr. Ges. Wiss. Göttingen Math-Phys. Kl. 1920, 74–85. [Google Scholar]
- Vanapalli, S.K.; Oh, W.T.; Puppala, A.J. Determination of the bearing capacity of unsaturated soils under undrained loading conditions. In Proceedings of the 60th Canadian Geotechnical Conference, Ottawa, ON, Canada, 21–24 October 2007; pp. 21–24. [Google Scholar]
- Skempton, A.W. The φu = 0 analysis for stability and its theoretical basis. In Proceedings of the 2nd International Conference of Soil Mechanics and Foundation Engineering, Rotterdam, The Netherlands, 21–30 June 1948; Volume 1, pp. 72–77. [Google Scholar]
- Rowe, R.K.; Liu, K.W. Three-dimensional finite element modelling of a full-scale geosynthetic-reinforced, pile-supported embankment. Can. Geotech. J. 2015, 52, 2041–2054. [Google Scholar] [CrossRef]
- King, D.J.; Bouazza, A.; Gniel, J.R.; Rowe, R.K.; Bui, H.H. Serviceability design for geosynthetic reinforced column supported embankments. Geotext. Geomembr. 2017, 45, 261–279. [Google Scholar] [CrossRef]
- Bhasi, A.; Rajagopal, K. Numerical study of basal reinforced embankments supported on floating/end bearing piles considering pile–soil interaction. Geotext. Geomembr. 2015, 43, 524–536. [Google Scholar] [CrossRef]
Disclaimer/Publisher’s Note: The statements, opinions and data contained in all publications are solely those of the individual author(s) and contributor(s) and not of MDPI and/or the editor(s). MDPI and/or the editor(s) disclaim responsibility for any injury to people or property resulting from any ideas, methods, instructions or products referred to in the content. |
© 2023 by the authors. Licensee MDPI, Basel, Switzerland. This article is an open access article distributed under the terms and conditions of the Creative Commons Attribution (CC BY) license (https://creativecommons.org/licenses/by/4.0/).