Article

Aircraft Target Interpretation Based on SAR Images

1
College of Electrical and Information Engineering, Changchun University of Science and Technology, Changchun 130022, China
2
College of Electrical and Information Engineering, Beihua University, Jilin City 132013, China
*
Author to whom correspondence should be addressed.
Appl. Sci. 2023, 13(18), 10023; https://doi.org/10.3390/app131810023
Submission received: 8 August 2023 / Revised: 3 September 2023 / Accepted: 4 September 2023 / Published: 5 September 2023

Abstract

:
The focus of the current research is how to effectively identify aircraft targets in SAR images. There are only 2000 SAR images and 6556 aircraft instances in our dataset. SAR images have complex backgrounds, and the sizes of aircraft targets are multi-scale. How to improve the detection accuracy of aircraft targets is the research topic of this paper, especially for small target detection. We proposed four improved methods based on YOLOv5s. Firstly, this paper proposed the structure of the multi-scale receptive field and channel attention fusion. It is applied at the shallow layer of the backbone of YOLOv5s. It can adjust the weights of the multi-scale receptive field during the training process to enhance the extraction ability of feature information. Secondly, we proposed four decoupled detection heads to replace the original part in YOLOv5s. It can improve the efficiency and accuracy of SAR image interpretation for small targets. Thirdly, in the case of the limited amount of SAR images, this paper proposed multiple data-augmentation methods, which can enhance the diversity and generalization of the network. Finally, this paper proposed the K-means++ to replace the original K-means to improve the network convergence speed and detection accuracy. Experiments demonstrate that the improved YOLOv5s can enhance the accuracy of SAR image interpretation by 9.3%, and the accuracy of small targets is improved more obviously, reaching 13.1%.

1. Introduction

SAR has developed since the 1950s. Due to unique imaging features, SAR has been widely used in the fields of military and civilian life [1,2]. In the military aspect, SAR can be used for global strategic reconnaissance all day, which can play a crucial role in the victory in war. In the civilian aspect, SAR plays an active role in mineral resource detection, disaster detection, and prevention. Due to the unique performance of SAR, the interpretation technology of SAR images has been taken seriously by various countries. Aircraft are a crucial target in both military and civilian fields, which makes it very important to realize the rapid detection and recognition of aircraft targets in SAR images. The detection and recognition method of vehicle and ship targets have formed a relatively mature system, but the development of aircraft targets is still relatively backward due to two factors, Firstly, the characteristics of aircraft targets are more complex than those of vehicle and ship targets, there are many parts with different scattering characteristics in the fuselage, and the brightness of each part of the SAR image varies. Secondly, the number of available SAR images is limited, and the acquisition cost is high. These factors limit the development of detection and recognition algorithms for aircraft targets of SAR images.
The traditional interpretation process of SAR images contains three stages. Firstly, all suspicious objects should be detected, and the universal algorithm contains the constant false alarm rate (CFAR). On this basis, scholars have proposed a variety of improved CFARs, such as cell average constant false alarm rate (CA-CFAR), smallest of cell average constant false alarm rate (SOCA-CFAR), greatest of cell average constant false alarm rate (GOCA-CFAR), ordered statistic constant false alarm rate (OS-CFAR), and variability index constant false alarm rate (VI-CFAR). Secondly, the detector can take advantage of the characteristics of targets to eliminate false alarms, and the common characteristics include contour, size, texture, scatter center, etc. [3,4,5,6]. Finally, the recognizer can classify the object of targets, and the universal algorithm contains template-based methods, mathematical model-based methods, and machine learning-based methods [7,8]. Based on these, scholars have proposed improved methods [9,10,11]. Although these methods can shorten detection time and improve detection precision to a certain extent, the traditional interpretation methods can not satisfy the needs of detection speed and accuracy, and their generalization ability is poor, which is greatly affected by the datasets.
In recent years, driven by artificial intelligence technology, deep learning algorithms have been applied to the following fields: facial recognition, natural language recognition, vehicle detection, and so on. All of these applications have achieved fruitful results. The deep learning algorithms consist of complex network structures, which can extract deeply abstract semantic information. The detection and recognition performance based on deep learning algorithms has already exceeded that of the traditional interpretation method. More and more excellent algorithms have been proposed. The existing deep learning algorithm for detection and recognition divides into one-stage and two-stage detection. The two-stage detection includes regions with convolutional neural network (R-CNN) [12], Fast R-CNN [13], Faster R-CNN [14], and Mask R-CNN [15]. They used the region proposal network (RPN) to generate candidate boxes, then perform regression and classification on the candidate boxes. The one-stage detector includes SSD [16], Retina-Net [17], and YOLO [18,19,20]. The algorithms of the YOLO series are generally faster than others, and it has a good performance for small objects, so it has been widely applied in computer vision and pattern recognition recently. Many scholars have conducted research based on the YOLOv5 version, and proposed many improved methods. Zheng et al. [21] proposed a multi-scale detection RebarNet network with an embedded attention mechanism based on YOLOv5 to solve the problem of missed and false detection in dense small-object detection. Hou et al. [22] proposed integrating coordinate attention (CA) into the backbone of the deep network, enhancing the expression ability of features and the precision of detection and recognition. Tan et al. [23] proposed adding one more detection branch based on the YOLOv5 structure, which can improve the efficiency of detection and recognition for small targets. Yuan et al. [24] proposed the feature fusion method of multi-scale adaptive, which can retain more useful feature information. It can improve the precision of detection and recognition for multi-scale targets. Huang et al. [25] created a SAR-optical fusion dataset (QXS-SAROPT), which contains 20,000 pairs of SAR-optical image patches. Meanwhile, the author presented an application of SAR ship detection based on QXS-SAROPT datasets. The average precision (AP) of SAR ship detection has improved by cross-modal information from optical images. The methods used in the literature have not applied to the aircraft target interpretation of SAR images. Based on the features of SAR images, we transferred these methods to SAR image interpretation and achieved good recognition results.
SAR images of aircraft usually cover multi-scale targets, which contain lots of background noise. The accuracy of detection and recognition of existing algorithms has a great development potential, especially for small aircraft targets. This paper focused on the problem of how to enhance the precision of small aircraft targets and how to suppress the background noise from scattering spots of ground-interfering objects. The task of this study was to recognize the seven categories of aircraft in our SAR image datasets (Boeing 787, A330, Boeing 737-800, A320/321, ARJ21, A220, and others). It not only needs to mark the bounding box of the aircraft, but also needs to identify the type of aircraft. Currently, there were few cases of applying deep learning algorithms to the field of SAR image aircraft target interpretation, so this paper selected YOLOv5s as the baseline. We proposed an improved model to resolve the above mentioned problems. There are four primary differences compared with the original YOLOv5s.
(1)
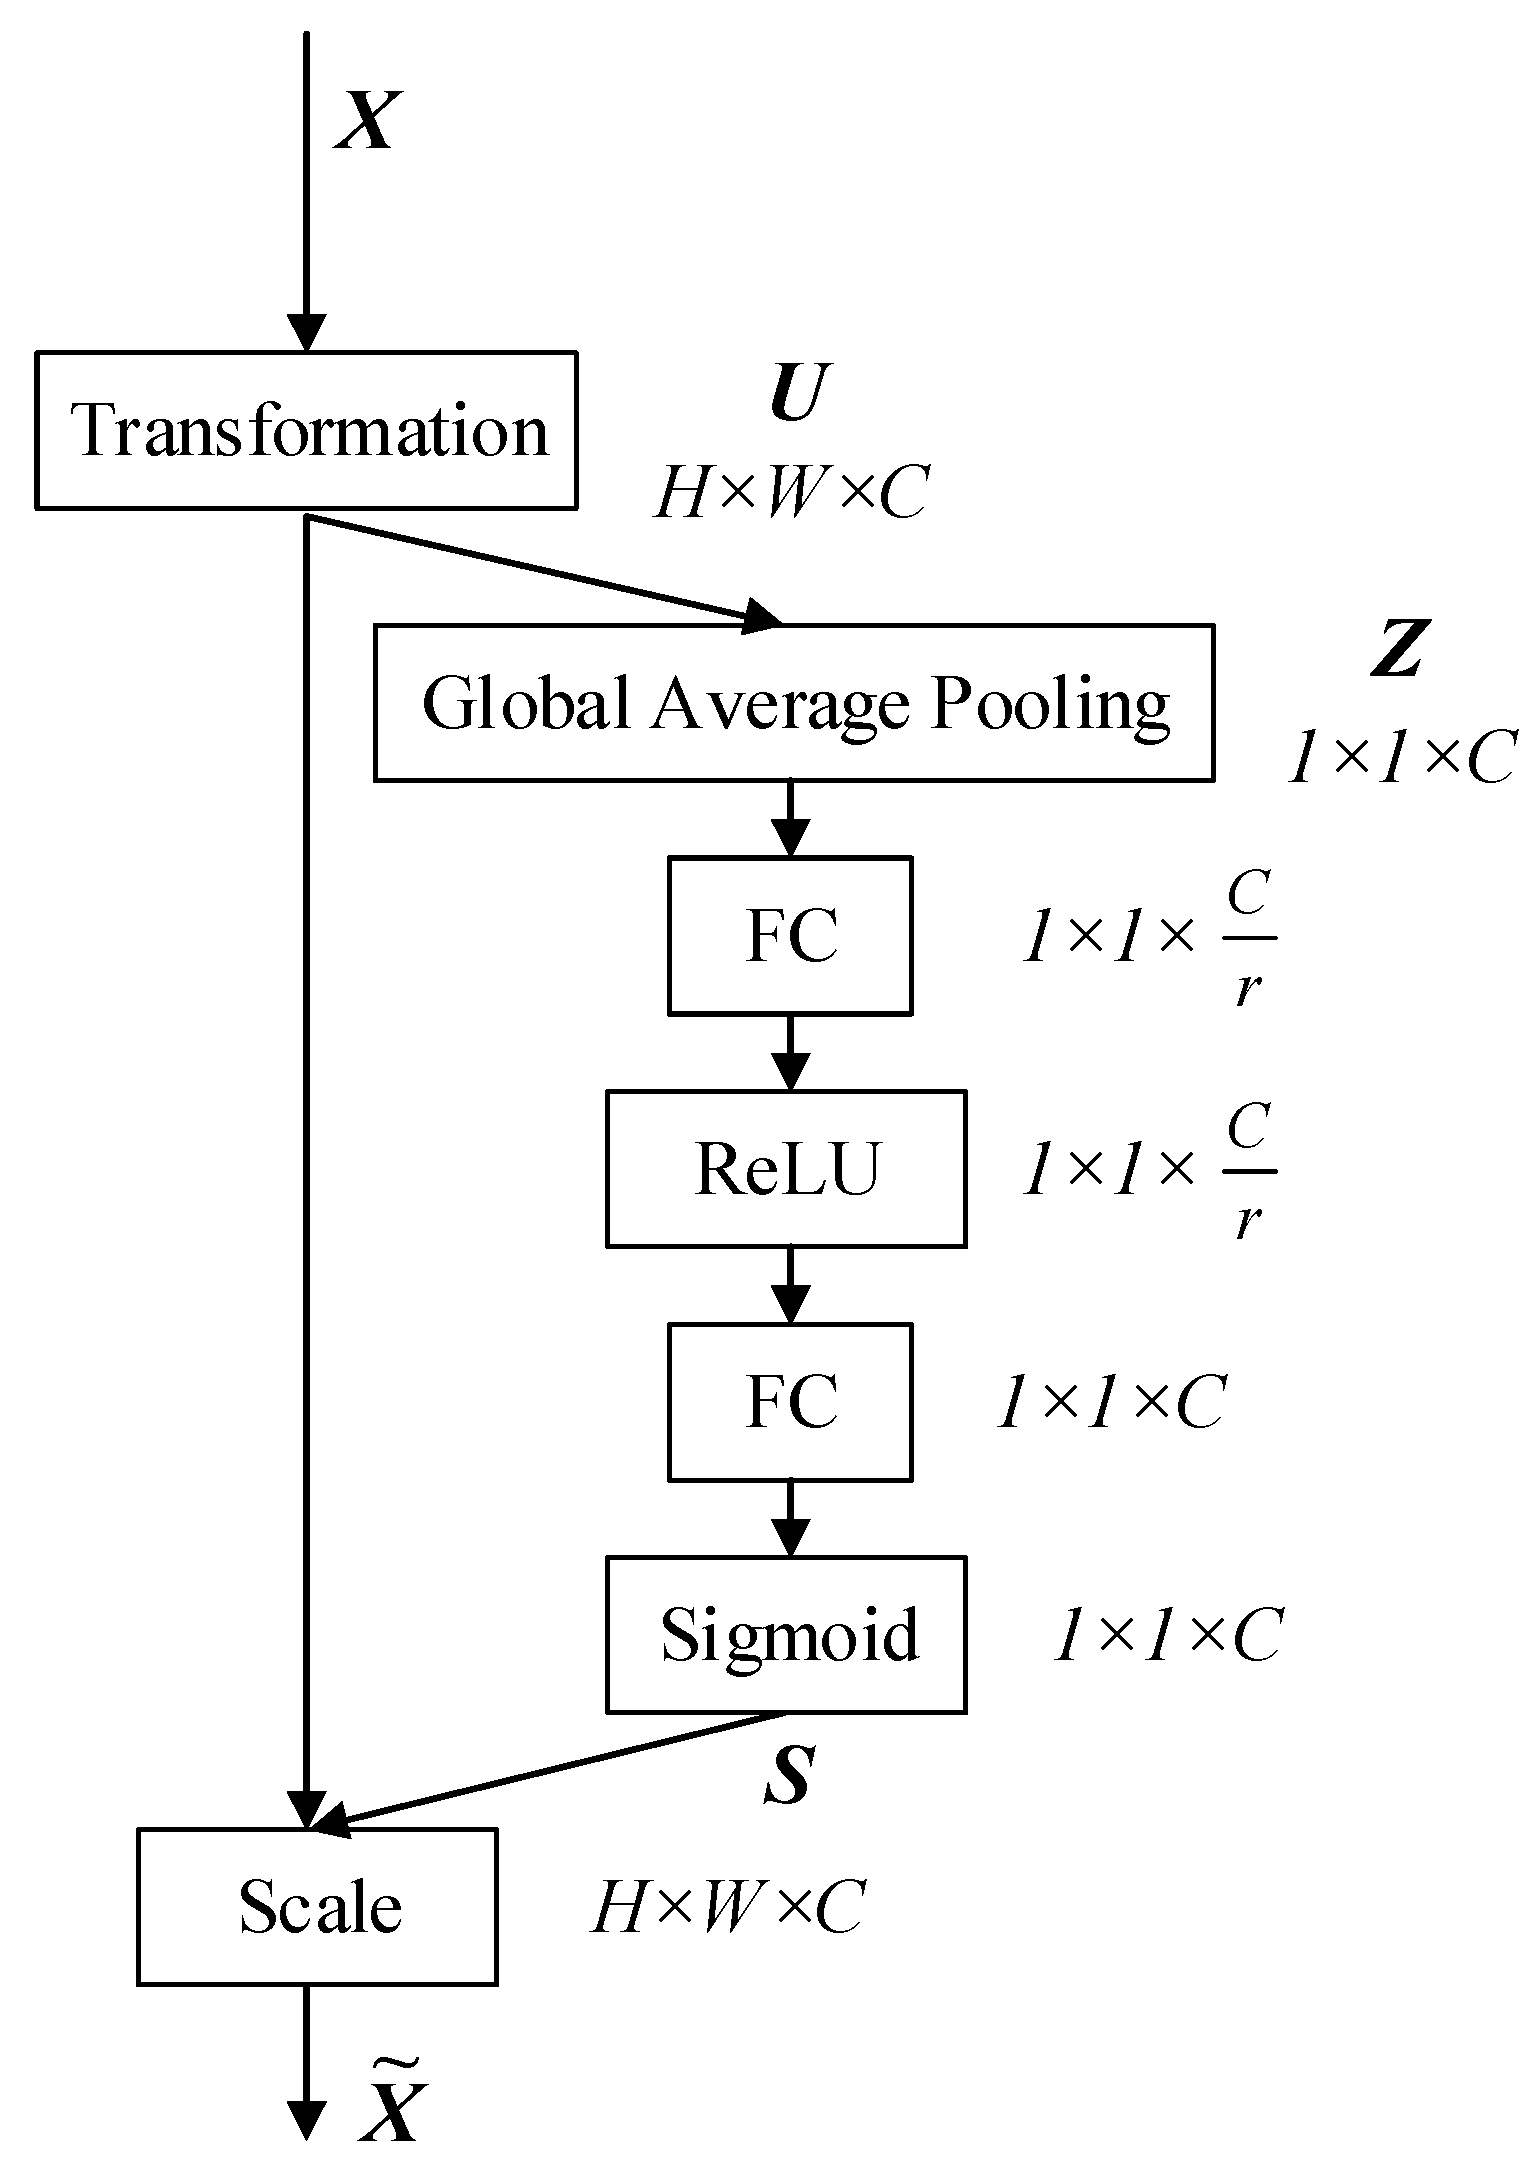
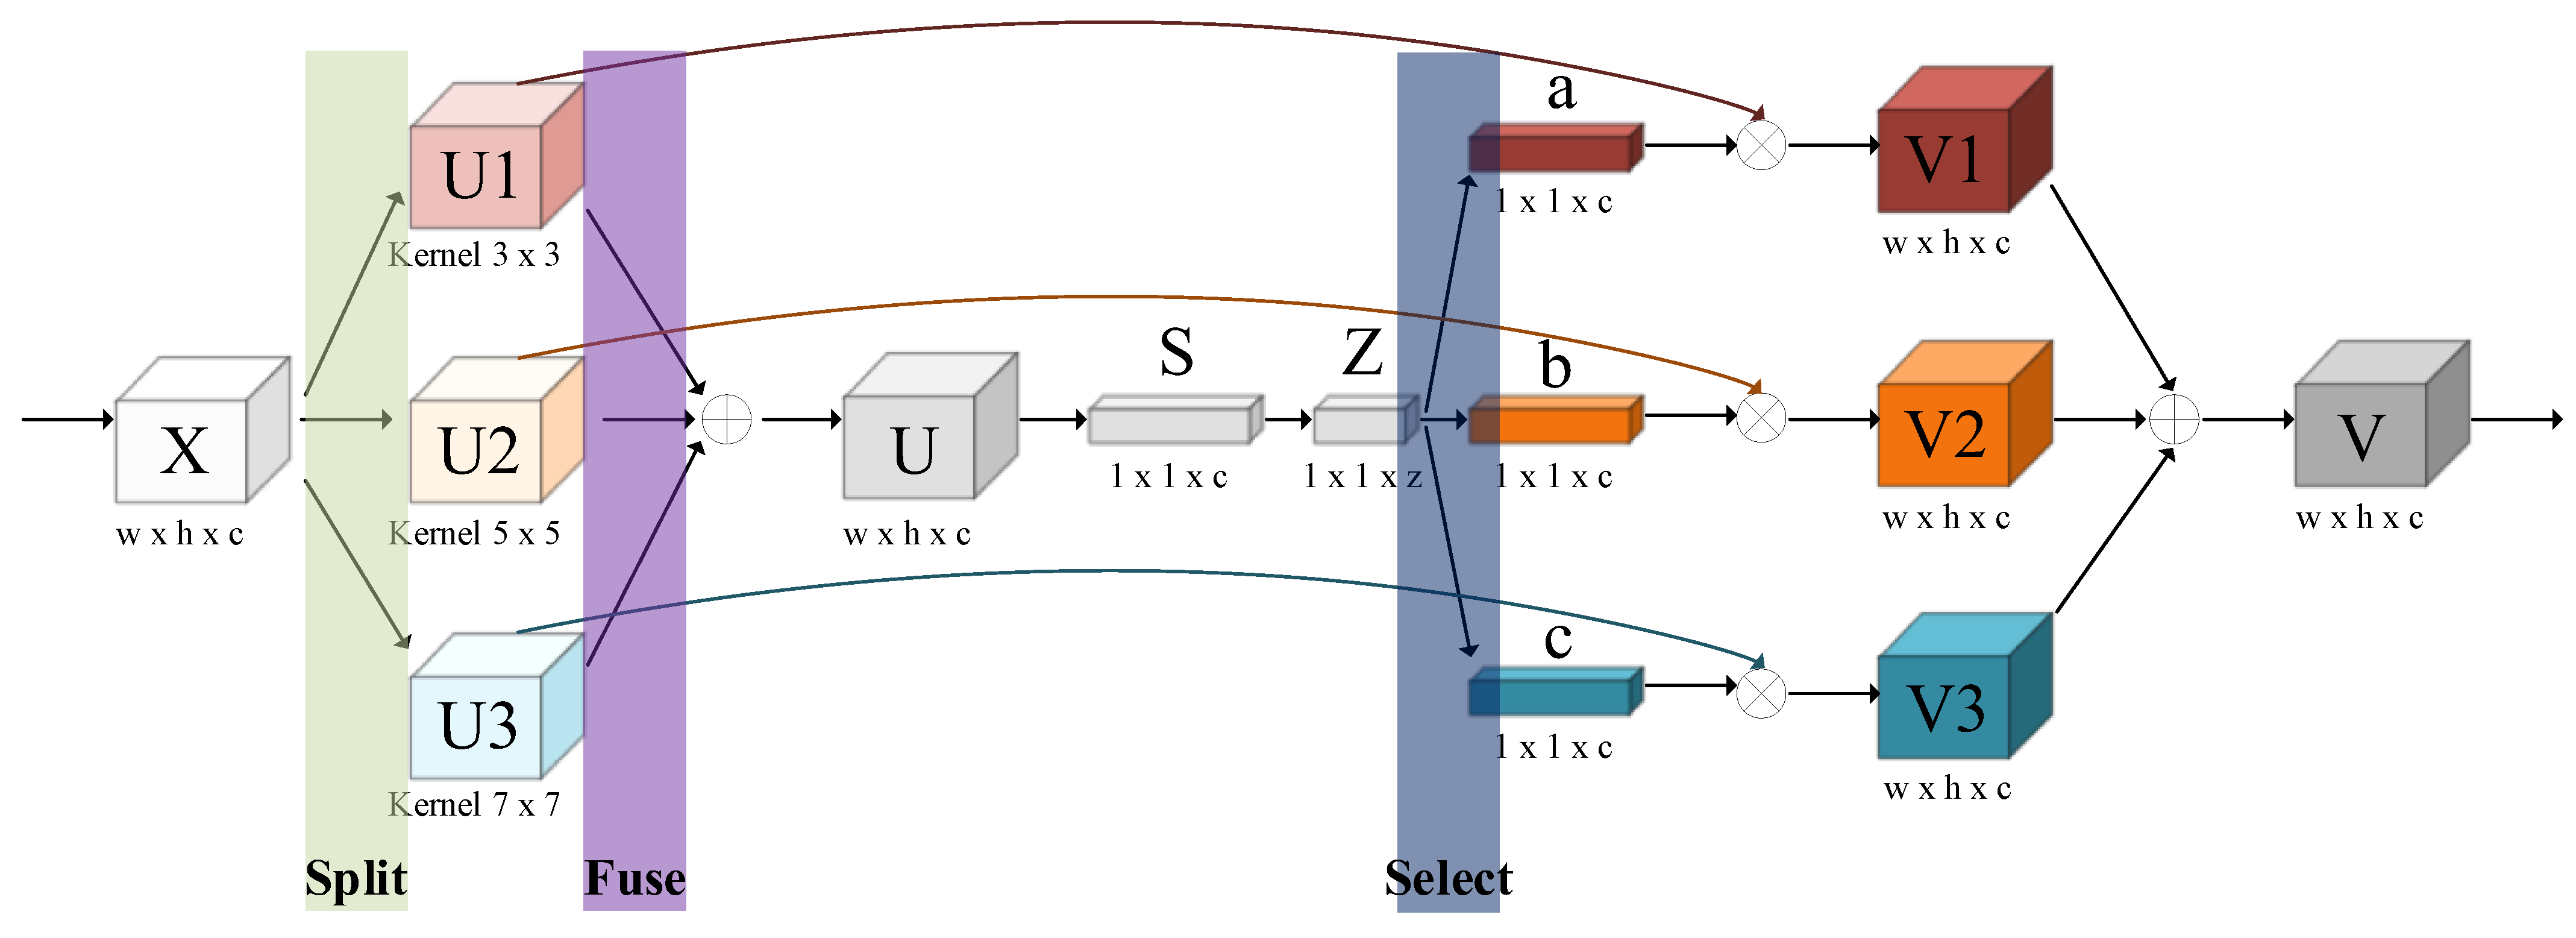
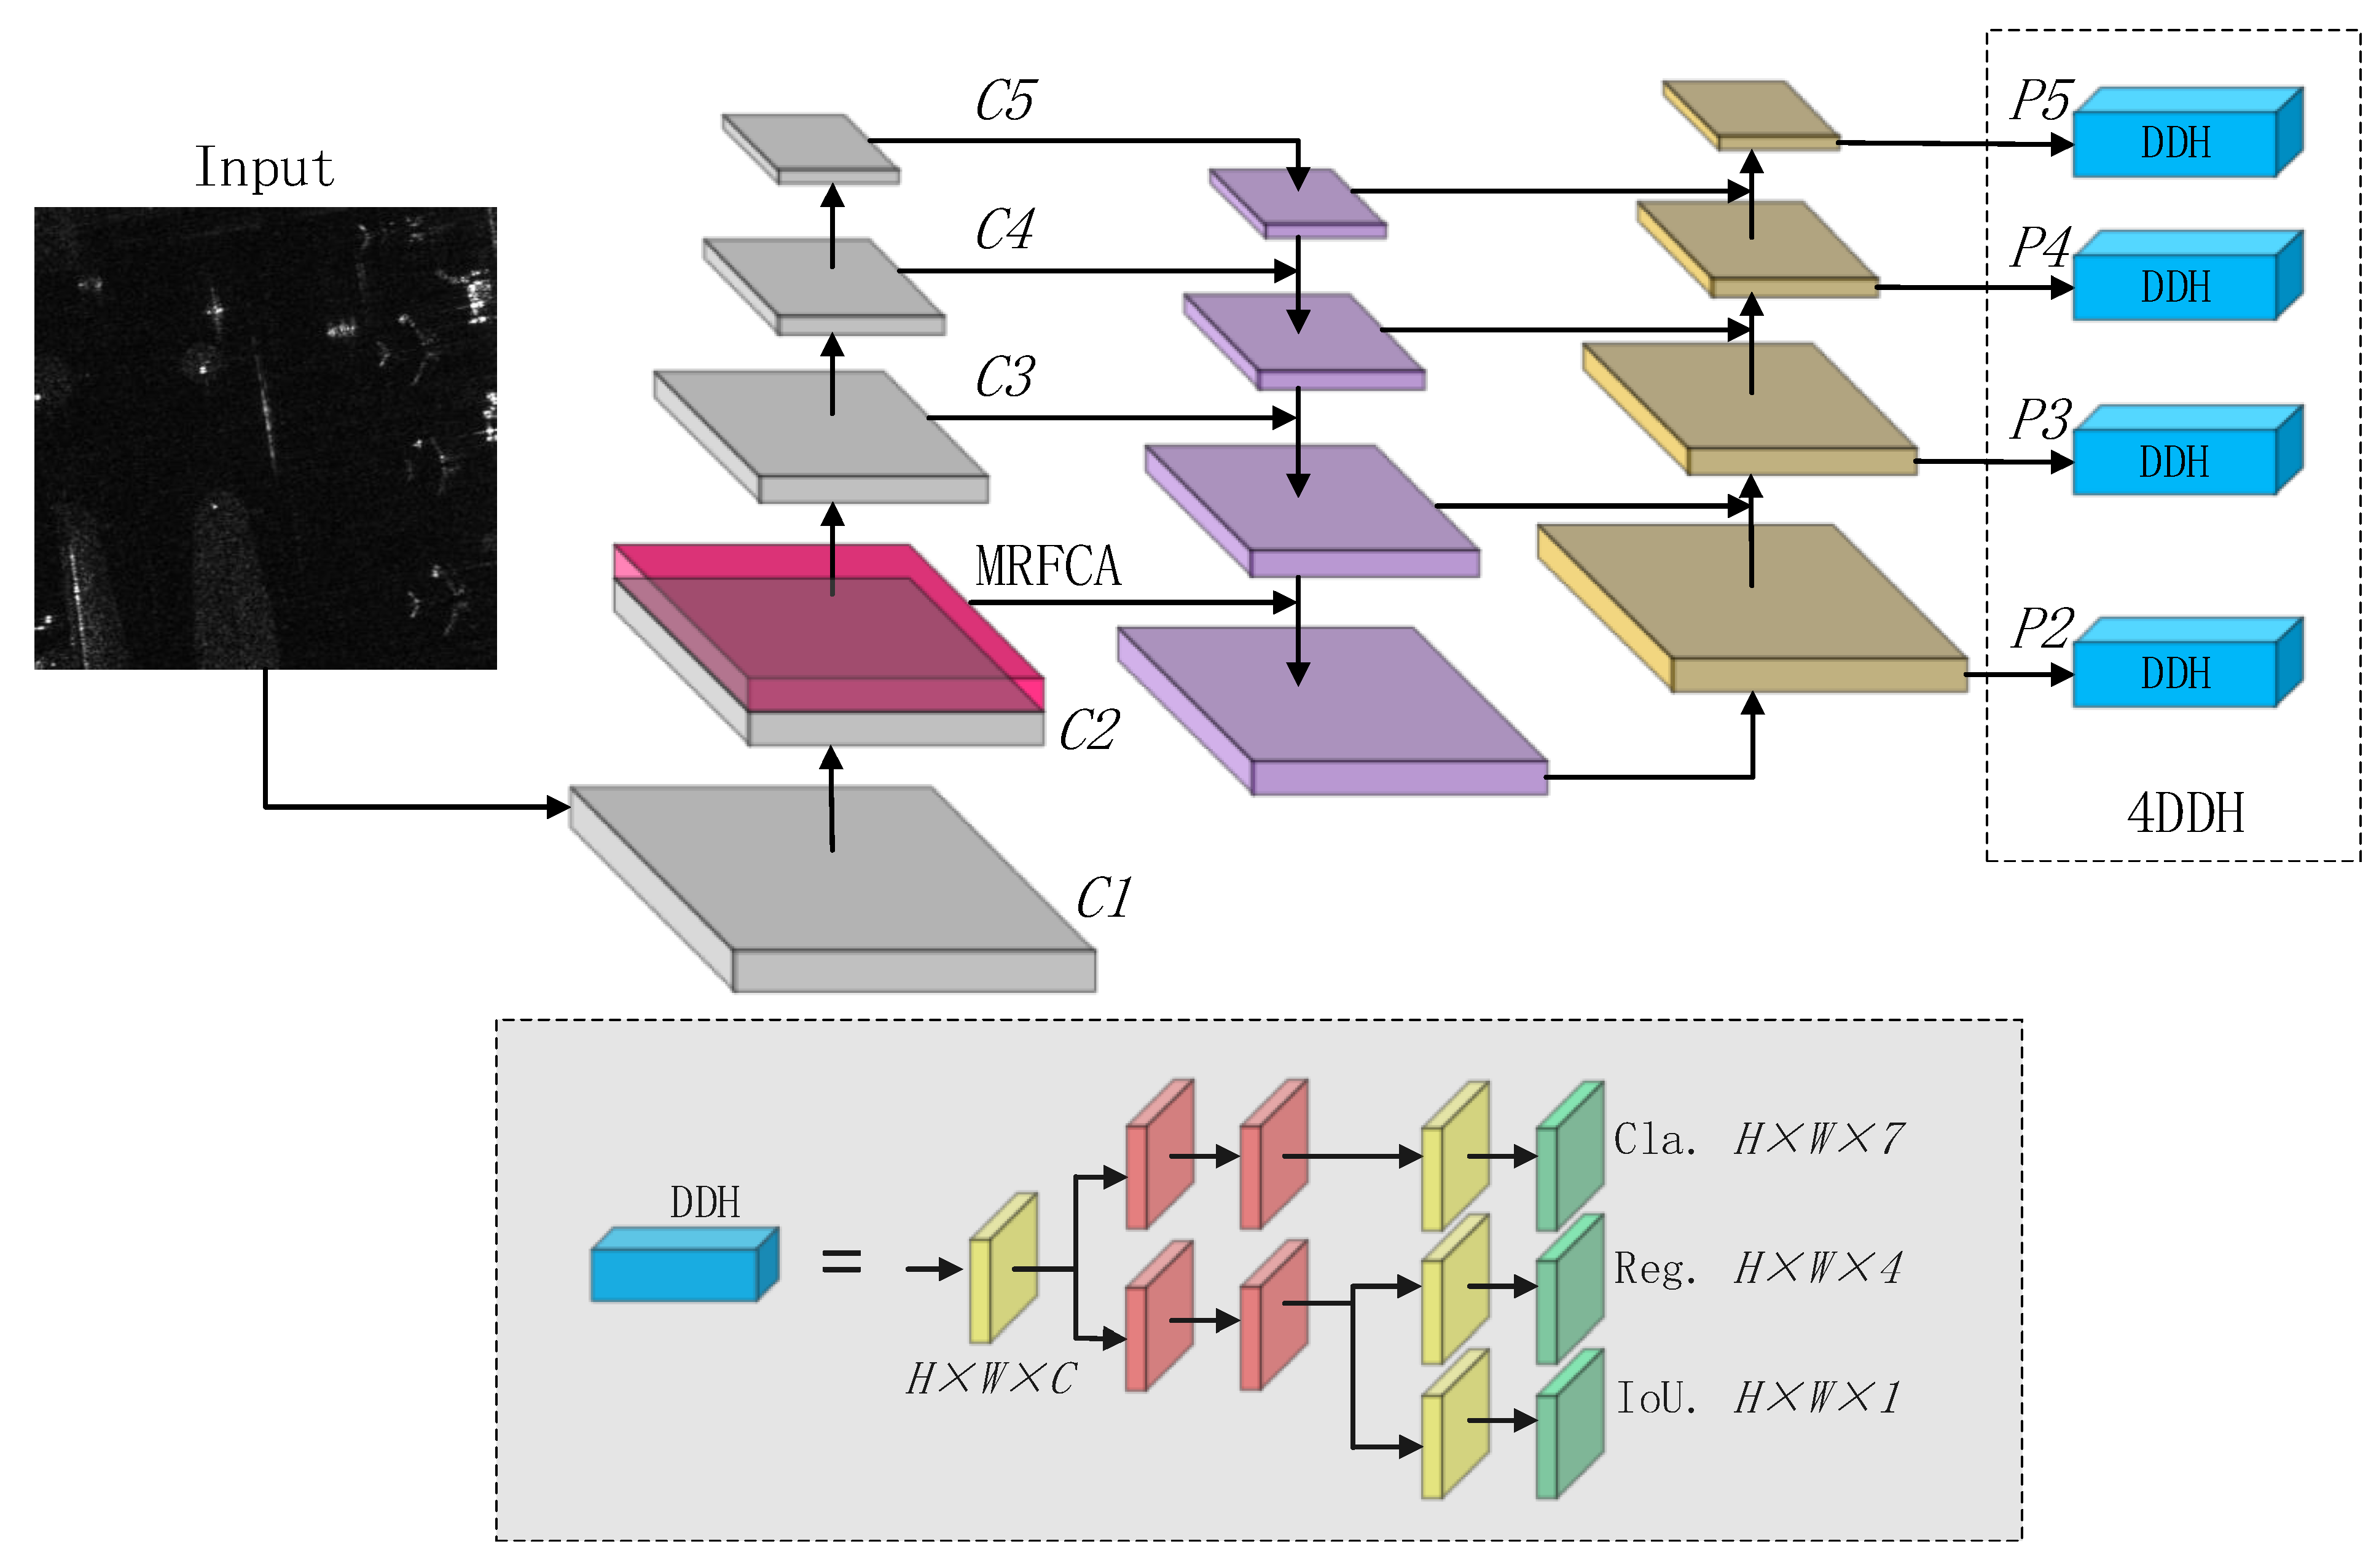
This paper proposed the multi-scale receptive field and channel attention (MRFCA) module based on SENet [26] and the inception network [27]. The MRFCA module was integrated into the backbone of YOLOv5s, which can change the adaptively receptive field for the multi-scale targets and capture more relevant information and critical features.
(2)
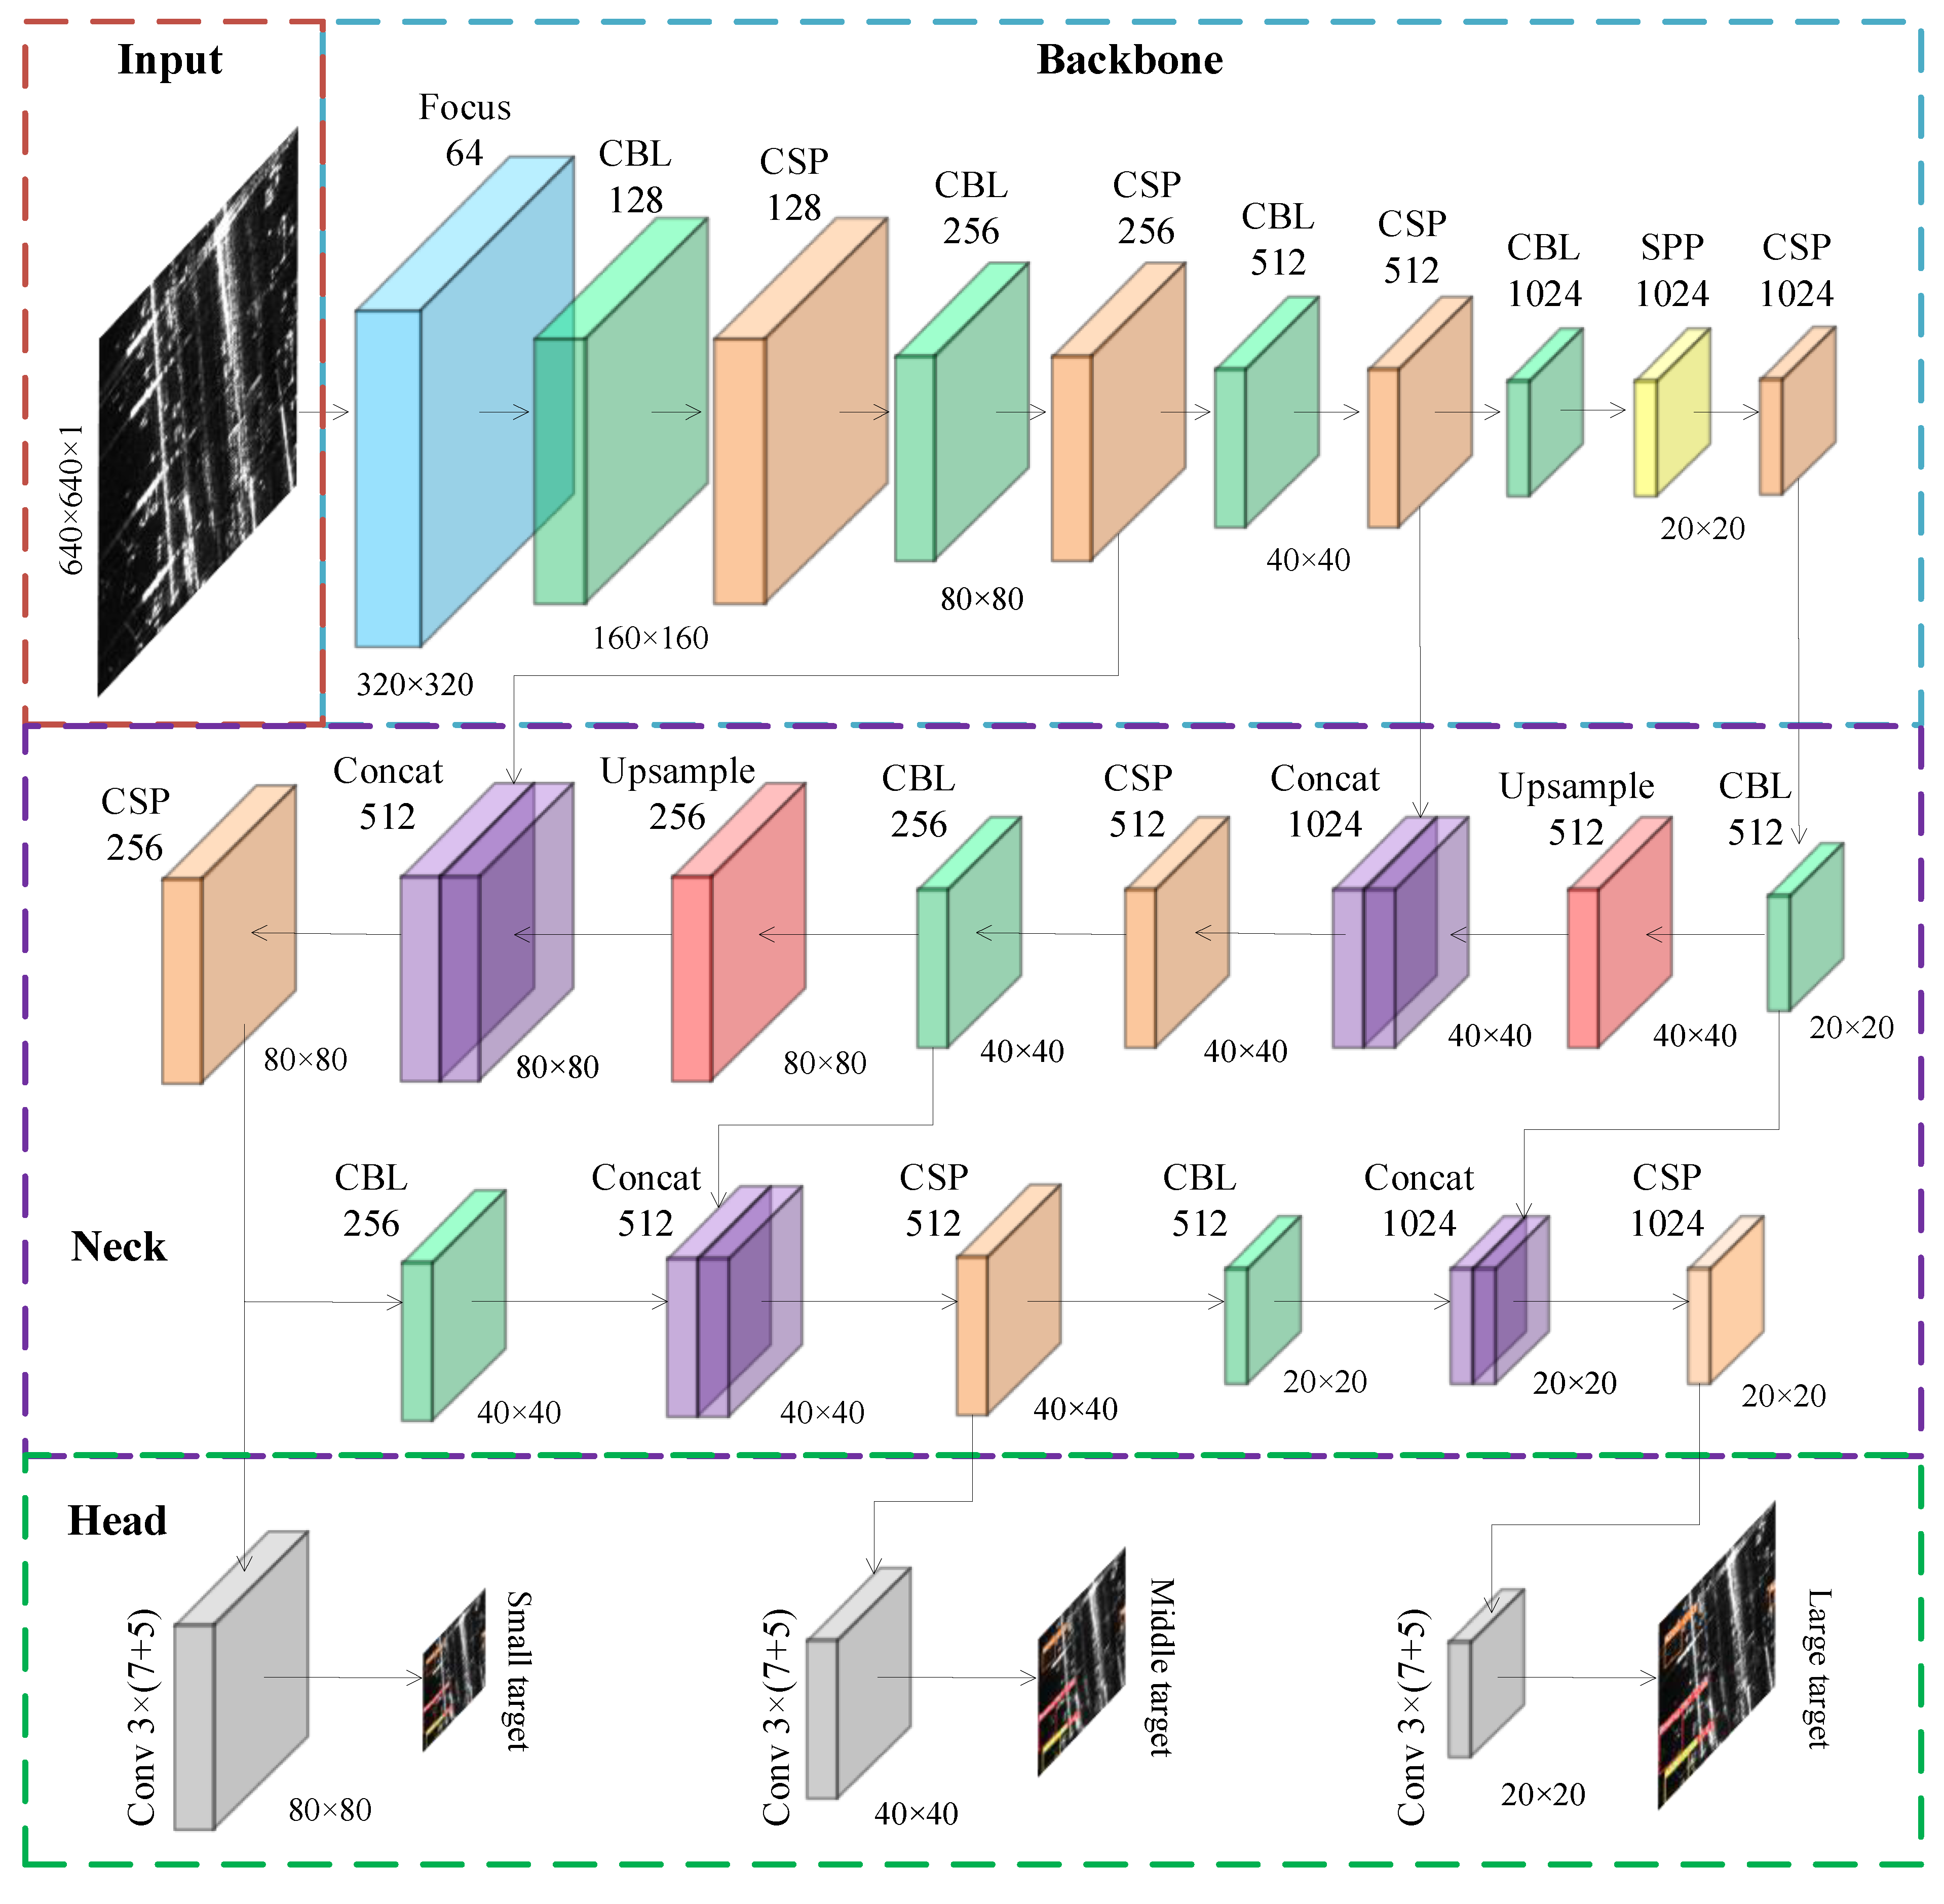
An additional detector was integrated into the YOLOv5s. All the detect heads adopt decoupled operations. The new four decoupled detection heads (4DDH) structure can improve detectability for multi-scale targets and enhance detection precision for small targets.
(3)
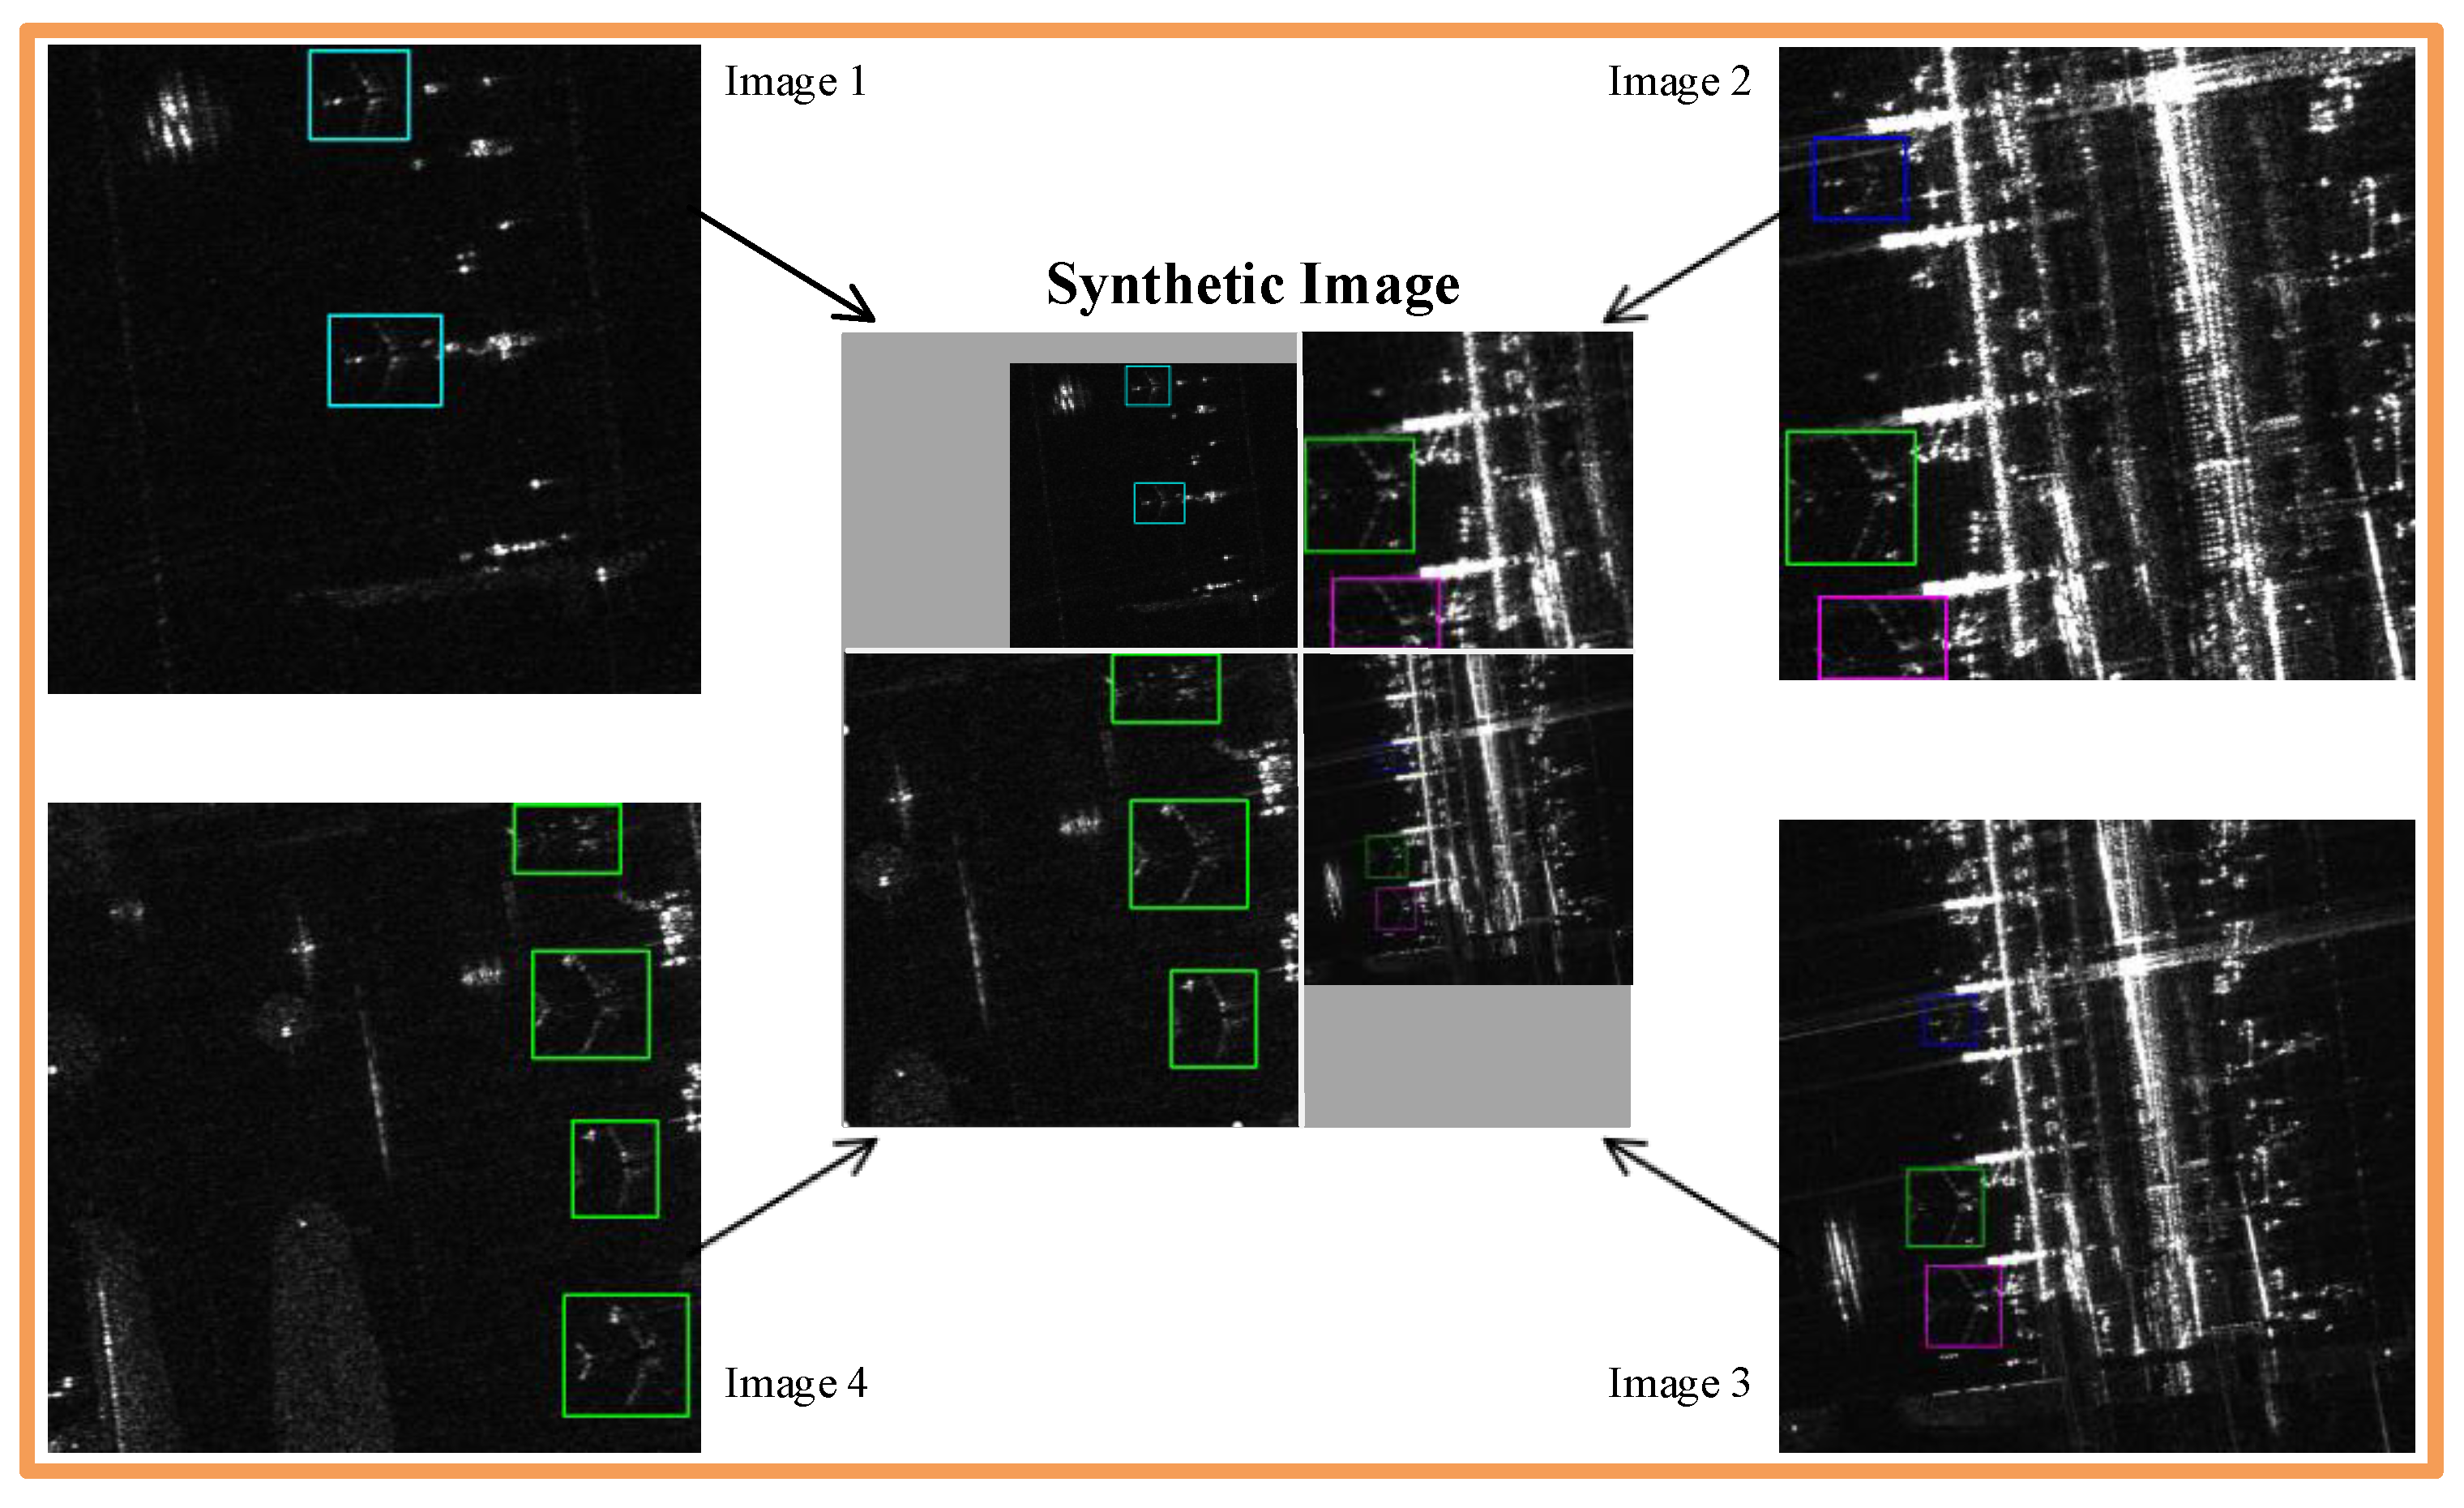
Flip, scaling, and mosaic data augmentation methods were fused to enhance the diversity of datasets and the generalization ability of the model and prevent overfitting [28].
(4)
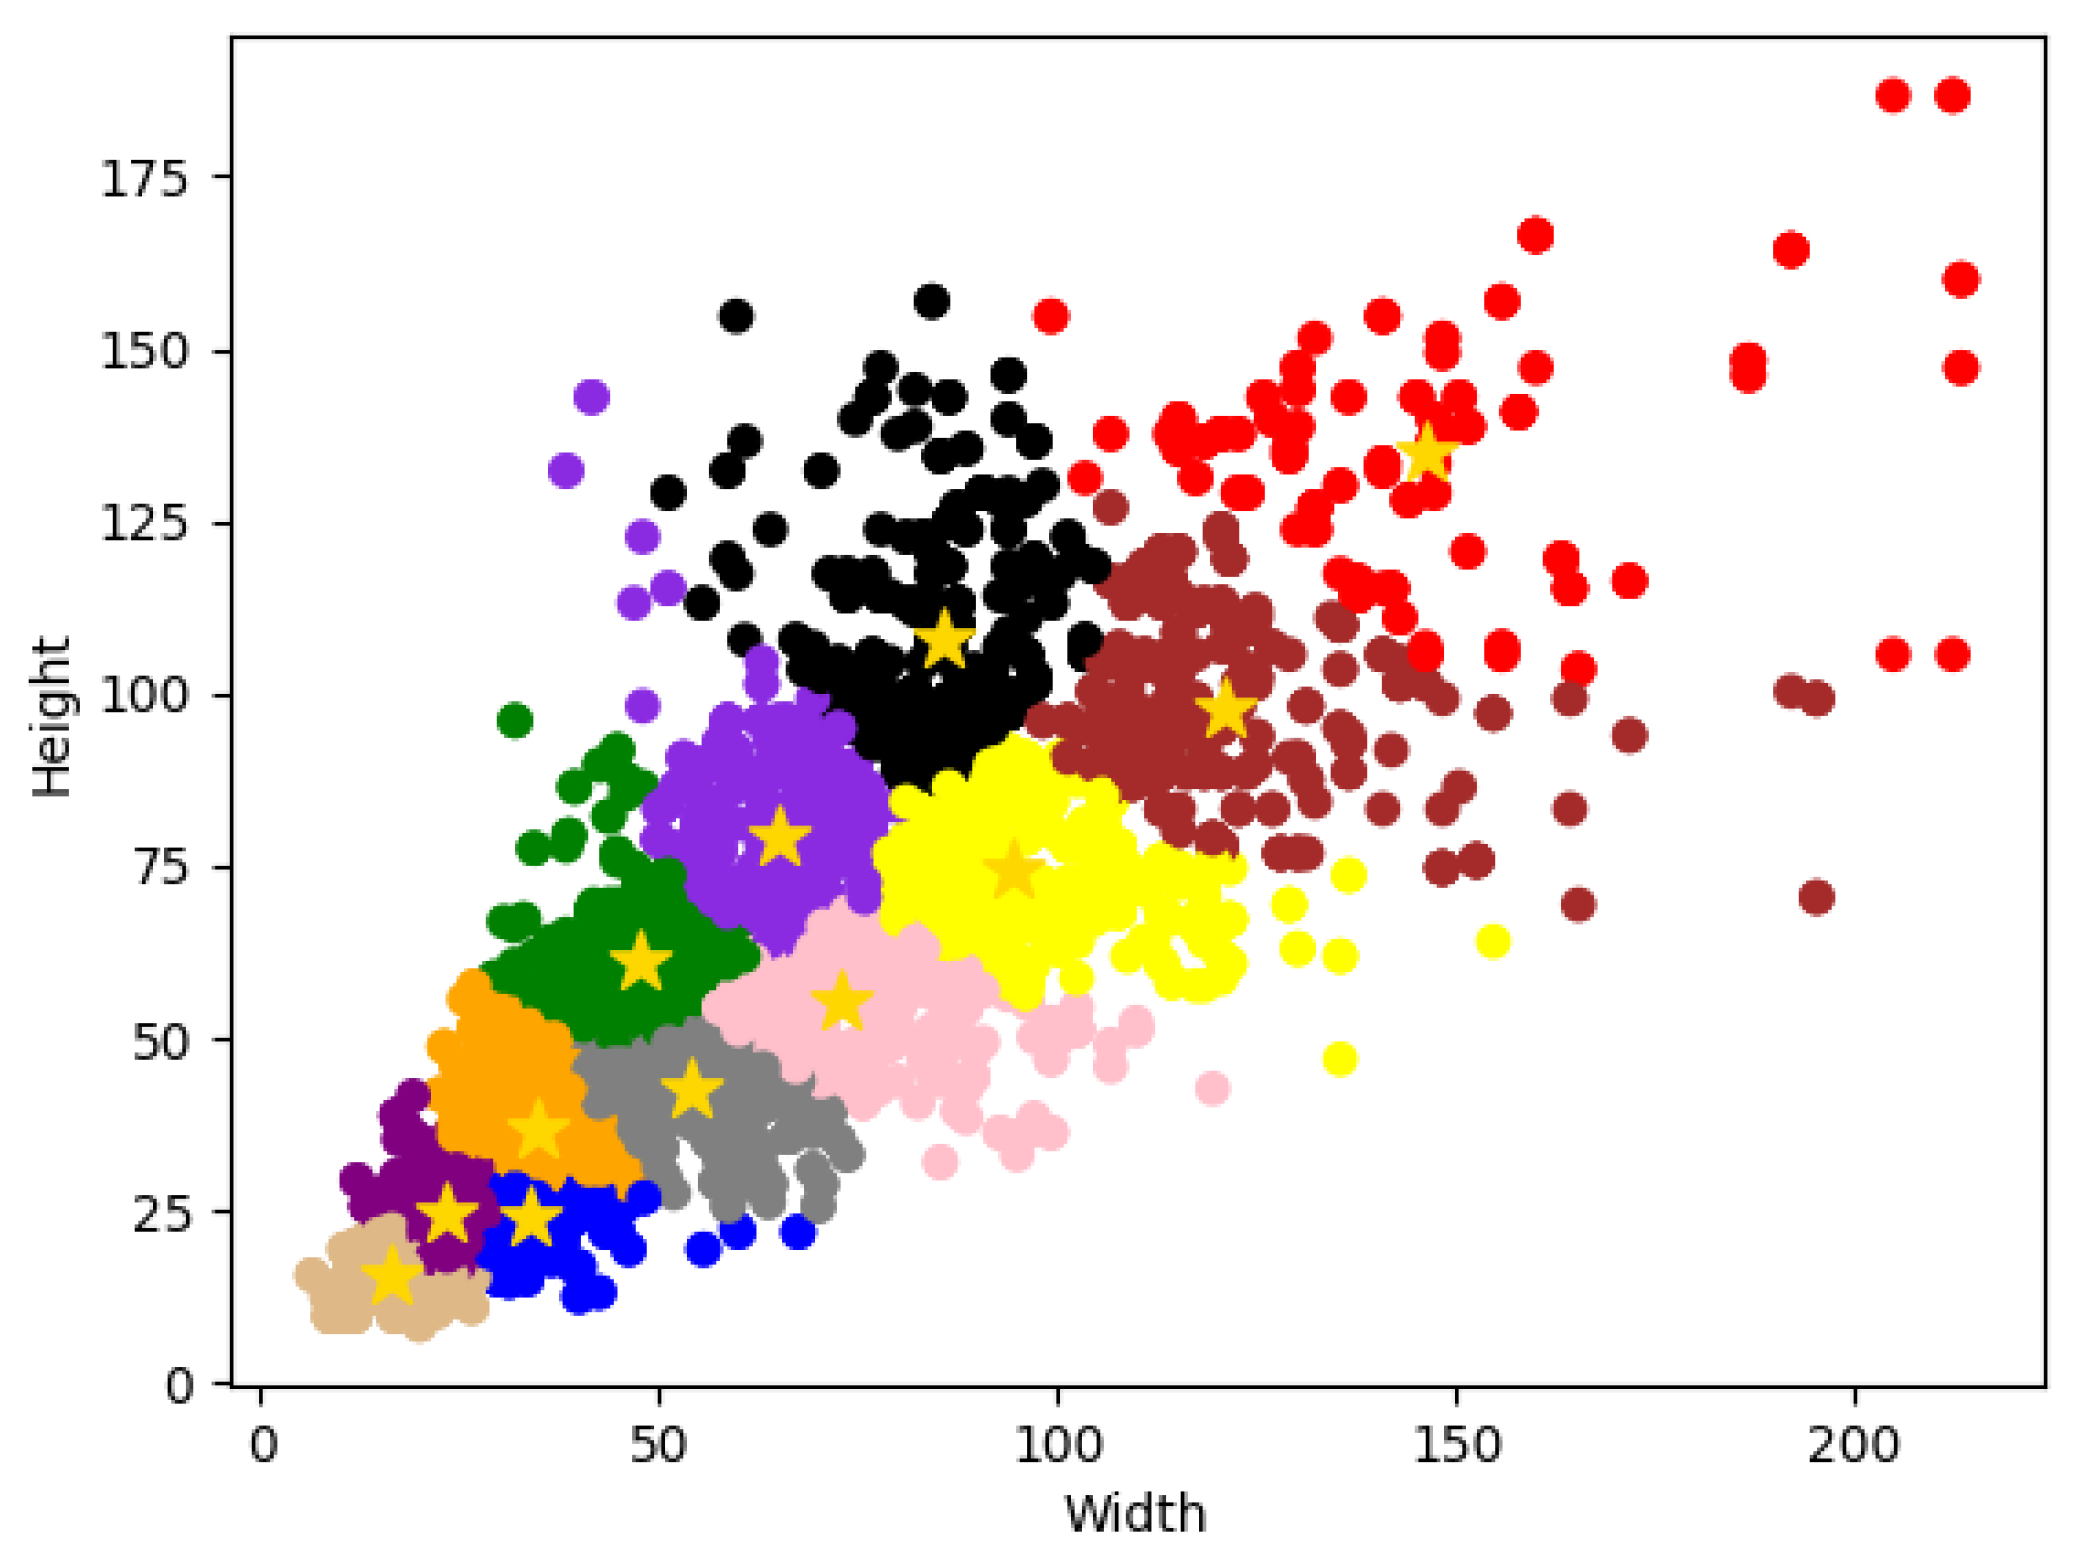
This paper adopted the K-means++ to replace the original K-means algorithm to improve the network convergence speed and detection accuracy [29].
The experiment showed that the mean average precision (mAP) of the SAR image interpretation based on our improved YOLOv5s algorithm is higher than the original YOLOv5s algorithm and other algorithms (Faster-RCNN, Retina-Net, SSD, YOLOv3), especially for small aircraft targets. It demonstrated that our improved YOLOv5s model has powerful feature extraction and background noise suppression ability.

2. Related Work

This section includes three parts. Section 2.1 describes the YOLOv5s network. Section 2.2 introduces the SENet network. Section 2.3 introduces the Inception network.

2.1. YOLOv5s Network

YOLOv5 was proposed in June 2020 and provided four models with different parameters, YOLOv5s, YOLOv5m, YOLOv5l, and YOLOv5x. YOLOv5s is the lightest model. It runs fast, but the precision is lower than the other three models. YOLOv5s consists primarily of input, backbone, neck, and head. The YOLOv5s architecture is shown in Figure 1. Our improvement method is based on YOLOv5s.
The input section is responsible for data augmentation. The data augmentation method can generate new images by processing input images, which can enhance the diversity of the datasets and generalization ability, enrich the background information of input images, and improve the convergence speed of the network. The backbone section is used to extract image features. It contains Focus, CBL, CSP, and SPP structures. Focus can increase the feature dimension of the channel by slicing input images, and it can realize down-sampling without information loss; CBL can further extract the image feature by convolution, batch normalization, and leaky-ReLU operations; CSP can reduce information loss during feature transmission, improve learning ability, and reduce the amount of computation; SPP can convert the feature map of arbitrary size into a feature map of fixed size so that the network can input images of arbitrary scale. The neck section is used for feature fusion of different reception fields. It adopts the PANET structure [30], which is designed based on the feature pyramid network (FPN) structure [31]. It integrates down–top and top–down bidirectional information transmission paths and merges the feature map of different reception fields. Each feature layer can obtain rich semantic and detailed information, and it can enhance the feature expression ability of the network. The head section has three detectors, which are used to predict classes, confidence, and anchor boxes of targets of different scales.

2.2. Channel Attention Mechanism

In order to enhance the feature expression ability of the convolutional neural network, some types of attention mechanisms have been proposed, such as SENet, CBAM [32], and SKNet [33]. The visual saliency of SAR images is different from that of natural images. Aircraft targets of SAR images show complex scattering spots and background noise. The network can more easily capture the feature region with significant contribution by integration attention mechanism. Different weights can automatically be assigned to each channel of the feature map by network learning, which can improve the expression ability of network features. SENet is the winner of the ImageNet2017 classification competition. The module is shown in Figure 2. It can learn the relationship between different channels, keep the attention of the network to channel information, evaluate the scores, and obtain weights of each channel adaptively.
Where X is the input feature map, and UR (H × W × C) is obtained based on the transformation of X, such as convolution, inception, or residual operation. U is squeezed along the spatial dimension by global average pooling operation to obtain ZR (1 × 1 × C). Each spatial dimension of the feature map is compressed into one pixel, which has a global receptive field of each spatial dimension. The output Z c is expressed as follows:
Z c = F s q ( U c ) = 1 H × W i = 1 H j = 1 W U c ( i , j )
where U c represents the c-th channel of the feature map; U c i , j represents the pixel of the i-th row and j-th column of the U c ; and F s q represents the global average pooling operation. To reduce the complexity of the module, a fully connected (FC) operation is used to reduce the channel dimension to obtain R (1 × 1 × C/r). The length of the channel dimension is compressed by r times, then performs the ReLU activation function, and performs FC operation again to restore the channel dimension R (1 × 1 × C); finally, it is activated by the sigmoid function to generate the weights for each channel, The output S of the sigmoid function is expressed as follows:
S = F e x Z , W = σ W 2 δ W 1 Z
where F e x is the feature excitation and reweight function; W 1 and W 2 are two FC operations, but the dimension of their input and output channel is different; δ is the ReLU activation function; σ is the sigmoid activation function; and S is the weight matrix for each channel. The output X c ~ is expressed as follows:
X c ~ = F s c a l e ( U c , S c ) = S c · U c
where S c is the weight of c-th channel; and X c ~ is the final output with the weight information of each channel. After the integration of the SENet module, the extraction ability of useful features is enhanced.

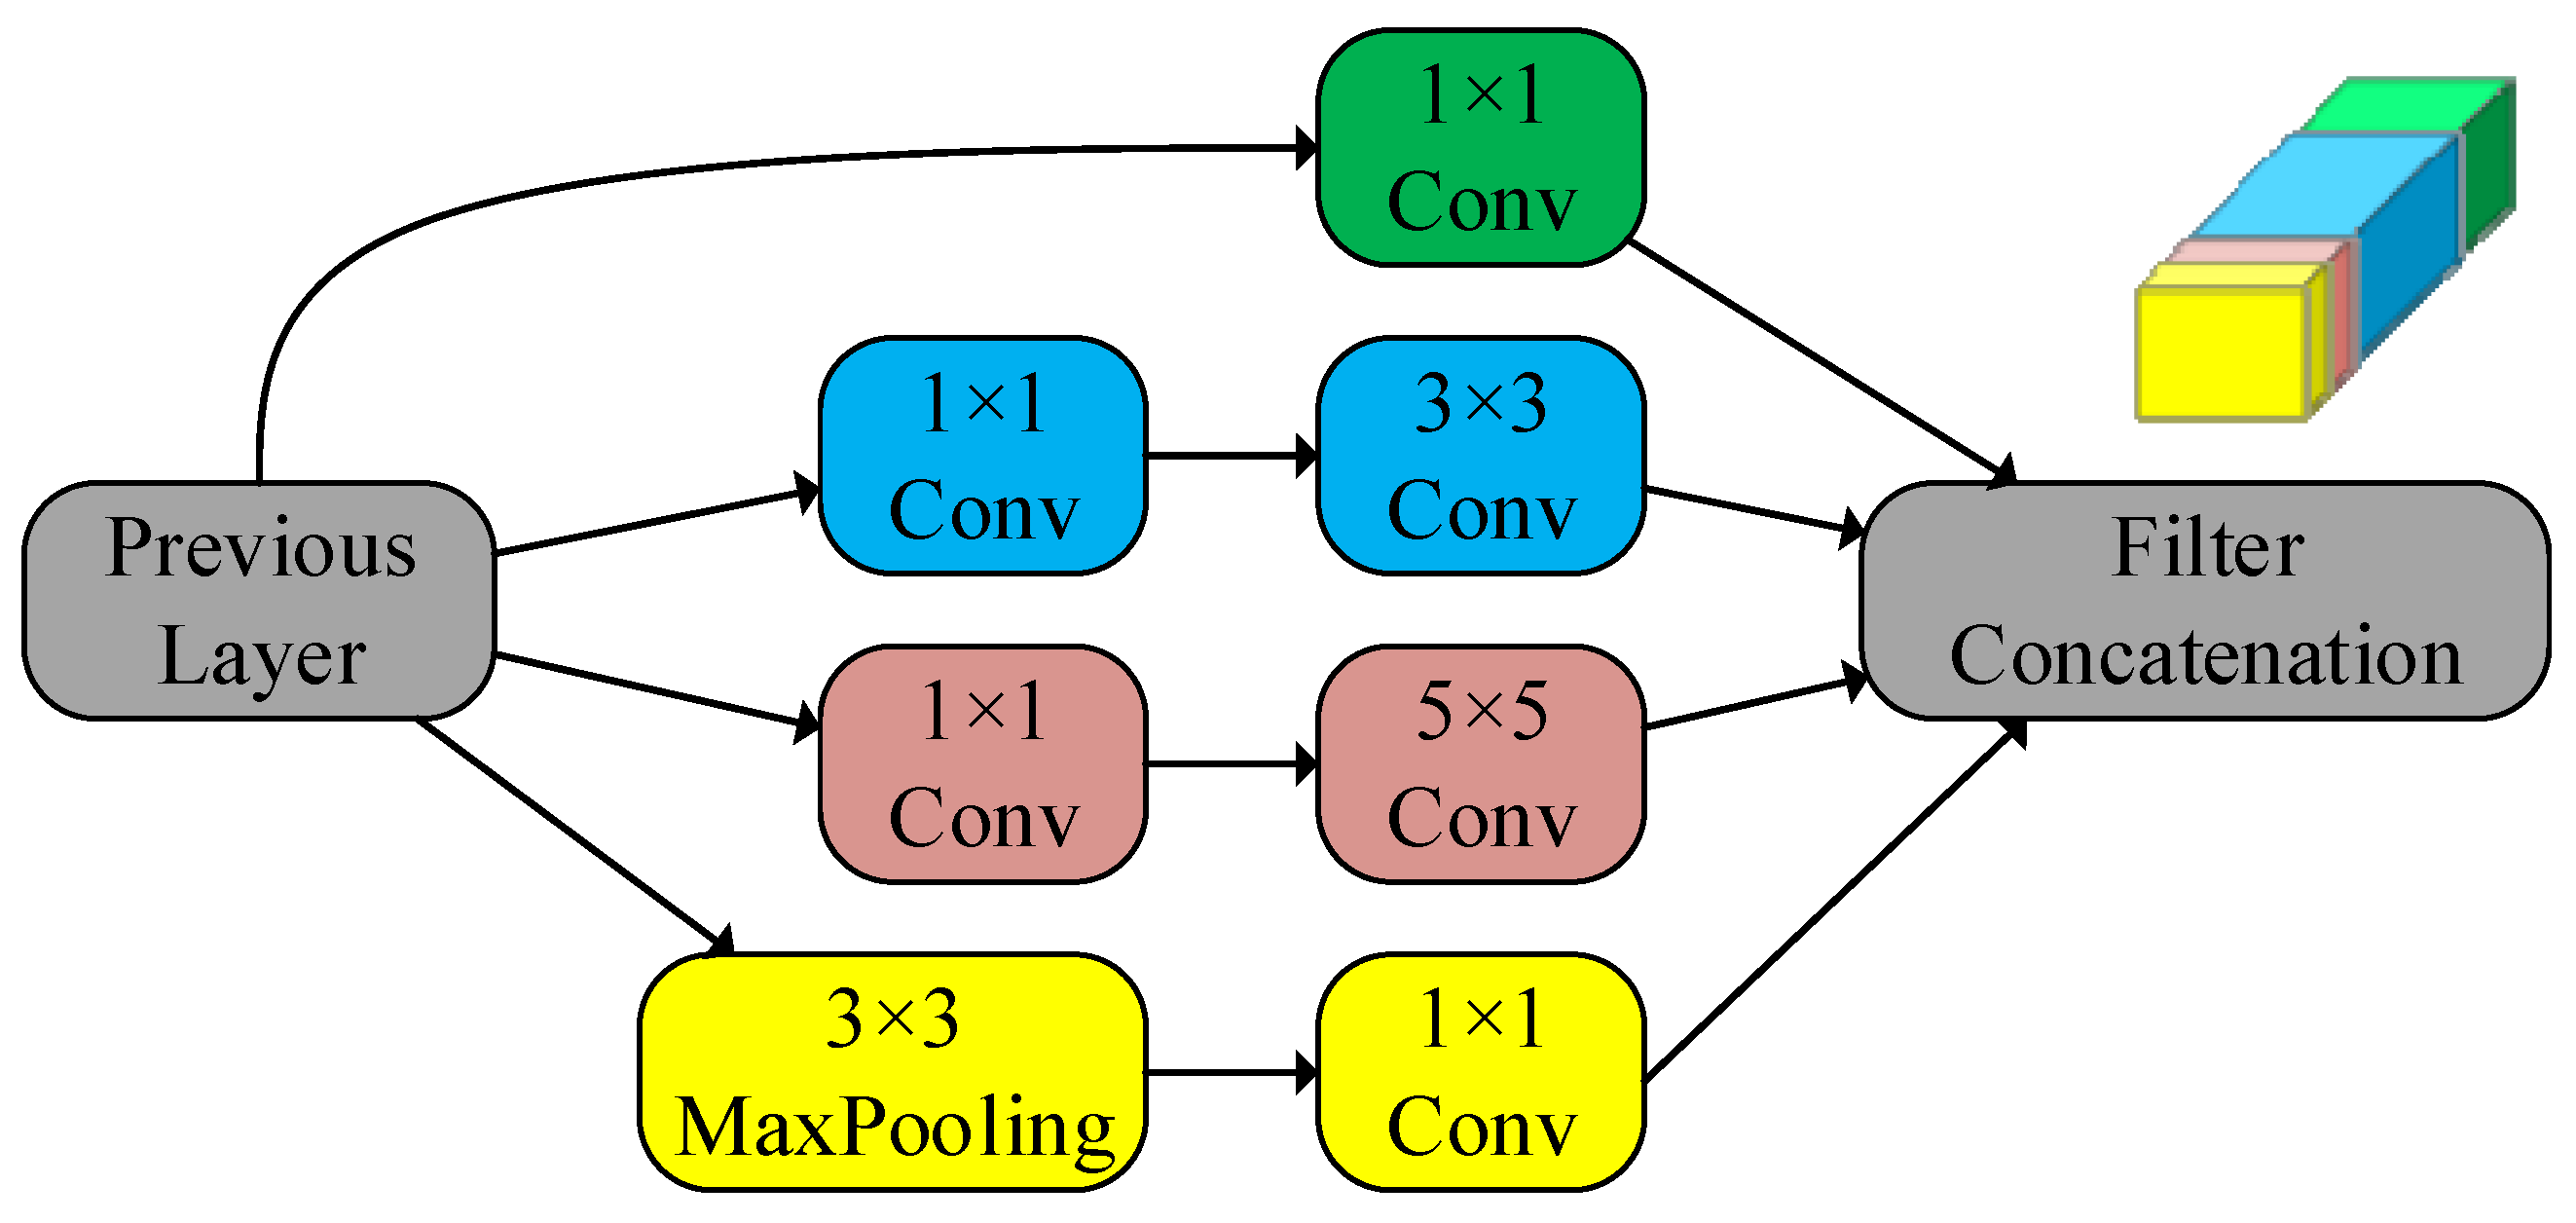
2.3. Inception Network

The inception network is a milestone in the development of convolutional neural networks. Before, the network often increased the depth to achieve better performance, but in this way, the model is easier to overfit and brings lots of computation. Inception is used to solve the problem of convolutional layer stacking. It sets up multiple channels in the same layer, which are obtained by operation with convolution kernels of different sizes, and it expands the width of the network. Inception structure can avoid redundant computation, reduce the number of parameters, and extract high dimensional features of SAR images more effectively. Inception structure can enhance the generalization ability and feature expression ability of the network, and the feature learning ability of the convolutional neural network is greatly improved.
The inception structure performs multiple convolution operations with different scale kernels at the input feature map in parallel to obtain four branches. All the branches are concatenated into one feature map in the output section. Figure 3 shows the architecture of the inception network. It contains three convolution kernels with different scales and one maximum pooling layer. Each branch performs its convolutional operations, which can extract much richer features and reduce computational complexity. Inception structure can fuse the different scale features of the SAR image, obtain receptive fields of different scales, and improve performance.

3. Method

Compared with traditional optical images, SAR images are complex, diverse, and contain background noise. The precision of detection and recognition is not satisfactory when using the YOLOv5s module directly, which always leads to the loss of small object targets. The following four improved methods were proposed based on the YOLOv5s module to solve this problem.

3.1. Multi-Scale Receptive Field and Channel Attention Fusion (MRFCA)

There are significant differences in the size of aircraft targets in our datasets, and the YOLOv5s algorithm has a weak feature extraction ability for multi-scale targets, especially in the case of complex backgrounds and lots of noise. Moreover, the YOLOv5s algorithm is more likely to miss small aircraft targets in the detection and recognition process. This paper proposed an MRFCA module, which combines the inception network and channel attention mechanism. It has better stability of detection and recognition for the targets with different scales, and it can adaptively adjust the weights of different receptive fields according to the input information.
As the expression of Section 2.3, the inception network can expand the width of the network to achieve better performance. We proposed to create three branches to extract the feature information of different receptive fields. In order to improve the calculation speed and reduce the number of parameters, we adopted the dilated convolution method [34]. However, after the training process is completed, the parameters of the inception network are fixed, and the weights of different receptive fields are not dynamically adjusted. As the expression of Section 2.2, the SENet attention mechanism can improve the expression ability of the feature map. This paper proposes to incorporate the SENet network into our improved inception network. It not only considers the relationship between channels but also considers the importance of different receptive fields. With different image inputs, the weights are dynamically adjusted. The MRFCA network is shown in Figure 4. It contains split, fuse, and select.
Where XR (h × w × c) is the input feature map, X is split into 3 branches U1, U2, and U3, which are separately convolved operations with kernels of different sizes. U1 ∈ R (h × w × c) is the convolution of X and kernel (3 × 3), U2 ∈ R (h × w × c) is the convolution of X and kernel (5 × 5), U3 ∈ R (h × w × c) is the convolution of X and kernel (7 × 7). The kernel (3 × 3), kernel (5 × 5) and kernel (7 × 7) adopt the dilated convolution method. The fuse operation is an element-wise summation of U1, U2, and U3, UR (h × w × c) is the feature map of fusion, it contains the feature information with different receptive fields, and the operation is expressed as:
U = U 1 + U 2 + U 3
where SR (1 × 1 × c) is the feature vector of the global average pooling operation at the dimensions w and h of U; the dimension of each channel is composed into one pixel, which has a global receptive field of each channel. To further improve the efficiency of the network and reduce the number of parameters, S carries out cross-channel information interaction through the FC operation to obtain ZR (1 × 1 × z), the dimension is squeezed to z. At select section, Z performs three FC operations, respectively, to obtain three new feature vectors of dimension c, then performs softmax function to predict the weights of the different receptive fields, the weight vectors {a, b, cR (1 × 1 × c)} are expressed as follows:
a = e A Z e A Z + e B Z + e C Z ,   b = e B Z e A Z + e B Z + e C Z ,   c = e C Z e A Z + e B Z + e C Z
where e is the natural logarithm; A, B, and CR (c × z) is a two-dimensional operational matrix, whose values are constantly corrected as the input image changes. The feature map of final output V is expressed as follows:
V = V 1 + V 2 + V 3 = a U 1 + b U 2 + c U 3
MRFCA is a plug-and-play module integrated behind the first C2 layer in the backbone of YOLOv5s. It can improve the feature extraction ability of YOLOv5s for multi-scale targets.

3.2. Four Decoupled Detection Heads (4DDH)

The backbone of YOLOv5s uses the three-scale feature map {C3, C4, C5} of 8 times, 16 times, and 32 times down-sampling to predict the targets of the small, medium, and large scales. There are some small targets in our dataset. The experiment demonstrates that the three-scale feature maps make it difficult to detect these small targets. In order to further extract abundant feature information and improve the detection precision for small targets, this paper proposes the four-scale feature map {C2, C3, C4, C5}. After the fusion of feature information in the neck section of YOLOv5s, new four-scale feature maps {P2, P3, P4, P5} are generated as the input of YOLOv5s head to complete the detection and recognition for aircraft targets in the SAR images.
At the YOLOv5s head section, the channel dimension of the input feature map is squeezed by a convolution operation. The squeezed feature map contains anchor coordinates, confidence, and aircraft category. The feature map is used to complete the task of detection and recognition. The two tasks share one feature map, but the two tasks focus on different feature information, the one feature map is usually not suitable for two tasks. The images from the GF-3 satellite have a large area of complex background and interference from various types of objects; this makes the task of identifying small targets more challenging. To further enhance the extraction ability of feature information and improve the precision, the detector adopts decoupled processing to complete the detection and recognition; the 4DDH network is shown in Figure 5.
DDH squeezes the input channel dimension by 1 × 1 convolution first, which is used to decrease the number of parameters and increase operation speed; then, the output is divided into two branches. The top branch is responsible for the recognition task, and first extracts the feature information through two 3 × 3 convolution operations, and another 1 × 1 convolution operation is used to adjust the channel dimension of the feature map to the number of categories of predicted aircraft; there are seven types of aircraft in our datasets. The bottom branch is responsible for the detection task, and first extracts the feature information through two 3 × 3 convolution operations. The feature map is divided into two more, the top one is used to predict the anchor coordinates by 1 × 1 convolution operation, and another is used to predict the confidence by 1 × 1 convolution operation. 4DDH can improve the efficiency and precision of detection and recognition, especially for small targets.

3.3. Data Augmentation Method

Our dataset has only 2000 SAR images and 6556 aircraft instances. The diversity of aircraft targets in SAR images is limited. The proportion of small targets is small and the detection and recognition precision for small targets is low. This paper proposed the following three data augmentation methods to resolve the problem: flip, scaling, and mosaic.
Flip and scaling are basic data augmentation methods, the input images are transformed geometrically to generate new images, and they are a simple and effective method to expand datasets. Mosaic obtains any four images from the dataset; then, they are randomly cropped, rotated, and scaled to synthesize an image. It can enrich the background of the SAR images, and increase the batch size and sample diversity in a single training process; the synthetic image is shown in Figure 6. Large samples are randomly scaled into small samples, increasing the number of small targets, Mosaic is very suitable for the datasets with a small number of small targets, it greatly improves the convergence speed of the model, and enhances the precision of detection and recognition.

3.4. Optimization Method of Adaptive Anchor Box

In the process of network inference, an appropriately sized initial anchor box helps to accelerate network convergence. The network outputs some prediction boxes based on the initial anchor boxes. Compare the predicted box with the true box, calculate the difference between the two bounding boxes, then update and iterate the network parameters in reverse. The YOLOv5s uses the K-means algorithm to cluster anchor boxes in the dataset and obtain k clustering anchor boxes. The detailed steps are as follows:
  • Randomly selected k initial clustering anchor boxes C k ( w k , h k ) from the dataset. ( w is the width of the anchor box, h is the height of the anchor box).
  • Calculate the distance from all bounding boxes B i ( w i , h i ) to C k ( w k , h k ) as follows: ( i represents the total number of all bounding boxes)
    D i s t a n c e B i ,   C k = 1 I o U ( B i ,   C k )
  • Classify bounding boxes B i ( w i , h i ) into the relevant clusters based on the principle of nearest distance. Finally, classify all bounding boxes into k clusters.
  • Recalculate the new clustering center boxes C k ( w k , h k ) , then repeat steps two, three, and four until the clustering anchor boxes remain unchanged.
When selecting k initial clustering anchor boxes, the distance between anchor boxes should be as large as possible. Based on this concept, the paper proposed the K-means++ algorithm to optimize step one in the K-means algorithm. First, randomly select the first clustering anchor box, and calculate the distance from all bounding boxes to their nearest clustering anchor box to further calculate the probability of becoming a new clustering anchor box. Second, select a new clustering anchor box by the roulette wheel method at non-clustering samples. The further away the sample is from the original clustering anchor boxes, the more likely it is to become the next clustering center. Repeat this process until k cluster anchor boxes are selected. Because this paper adopted the 4DDH method, the value of k is 12. The distribution of initial anchor boxes is shown in Figure 7. There are a total of 12 color regions, which represent different clusters. There are a total of 12 golden stars, which represent the size of the center anchor box of each cluster.
Table 1 shows the detailed size of the initial anchor boxes between the original YOLOv5s and our improved YOLOv5s. P2, P3, P4, and P5 represent the detection layers.

4. Experimental Results and Analysis

4.1. Experimental Environment

The datasets used in this paper are from the 2021 GF challenge on Automated High-Resolution Earth Observation Image Interpretation [35]. These images in our datasets were collected from the GF-3 satellite, which is single polarization (HH) and spotlight imaging mode with 1m spatial resolution. The scene includes multi-temporal images of several common airports around the world. The datasets contain 2000 SAR images ranging in size from 600 × 600 pixels to 2048 × 2048 pixels and 6556 aircraft instances; there are seven different types of aircraft, as shown in Figure 8 [36]. The datasets are divided into the training set, validation set, and test set according to the proportion of 8:1:1.
The deep learning program runs on a 64-bit Windows 10 computer system, and Table 2 shows the software environment configuration. The number of training iterations is 200, the batch size is 32, and the initial learning rate is 0.01.

4.2. Experimental Evaluation

To accurately evaluate the detection performance, this paper uses the average precision (AP) and the mean average precision (mAP) as the evaluation indicators. AP can reflect the detection performance of a single target category, and mAP can reflect the comprehensive detection performance of all categories. AP is calculated by precision and recall. The precision and recall are expressed as follows:
R e c a l l = T P T P + F N
P r e c i s i o n = T P T P + F P
where TP represents a positive sample that predicts to be a positive example; FP represents a negative sample that predicts to be a positive example; FN represents a positive sample that predicts to be a negative example. At a specific Intersection over the Union (IoU) threshold, the PR curve is drawn with recall (R) as the horizontal axis and precision (P) as the vertical axis. AP and mAP are expressed as follows:
A P = 0 1 P R d R
m A P = 1 C A P ( C )
where C represents the total number of the target category. This paper adopts mAP50 (IoU is 50%), mAP75 (IoU is 75%), and mAP50~95 (IoU is from 50% to 95%, step is 5%) to evaluate the precision of detection and recognition.

4.3. Experiment Analysis

To verify the performance of the improved algorithm based on YOLOv5s, we select six kinds of object detection algorithms based on deep learning for comparative analysis, Faster R-CNN, Retina-Net, SSD, YOLOv3, and YOLOv5s. Table 3 shows the mAP% of related algorithms based on the author’s datasets.

4.4. Ablation Experiments

To verify the effectiveness of MRFCA, we placed it after the feature layer of the backbone of YOLOv5s. Considering that the MRFCA module will affect the size of model parameters and infer speed to some extent, this paper only introduced one MRFCA module, which is placed after the C2, C3, C4, or C5 feature layer. Their respective recognition accuracy is shown in Table 4. Placing it after the C2 feature layer can achieve the best recognition accuracy, the mAP50~95 has increased by 6.5%, and the mAP50~95 for S-Target has increased by 9.1%. This paper proposed to place the MRFCA module after the C2 feature layer.
To further prove that the proposed method improves the detection and recognition ability of YOLOv5s, we set up several groups of model comparison experiments. The first group is the prototype of YOLOv5s. The other experiments incorporated methods of MRFCA, 4DDH, data augmentation, and K-means++, respectively, and all other structures are the same as YOLOv5s. The experimental results are shown in Table 5.
On comparing Figure 9b and Figure 9c, the YOLOv5s algorithm misses five aircraft targets when the target is small and the background is complex, but the improved YOLOv5s algorithm has a better extraction ability of image features, there are no cases of missed detection, it has better detection and recognition performance for aircraft targets in SAR images.

5. Discussion

We researched some methods in the literature, and transferred some methods to the SAR image interpretation field. These methods can improve the detection accuracy of aircraft targets in SAR images.
We fused the Inception network and SENet attention mechanism to obtain the MRFCA structure, which is beneficial for the detection of multi-scale targets. Figure 10 [36] shows that the distribution of anchor box size is multi-scale in our datasets. The ablation experiment results in Table 4 showed that the designed MRFCA structure can enhance the detection performance for small aircraft targets. The mAP50~95 increased by 9.1% compared with the baseline algorithm for small aircraft targets. In order to further improve the detection ability for the small targets, we proposed adding one more detection head and decoupled processing to obtain the 4DDH structure. The ablation experiment results in Table 5 showed that the improvement in the small target detection effect is significant. However, the MRFCA and 4DDH modules increased the number of model parameters. We will attempt to use the lightweight network to reduce model parameters in further research. The number of SAR images in our datasets is limited. We proposed three data augmentation methods (flip, scaling, and mosaic) to expand the datasets and increase data diversity. The ablation experiment results in Table 5 showed that the mAP50~95 increased by 2.2%. The improvement in detection accuracy is not significant. We will attempt to obtain a richer dataset in further research. We adopted the K-means++ algorithm to cluster 12 anchor boxes for the 4DDH module. The initial size of 12 anchor boxes helped to accelerate network convergence and improve detection accuracy. The ablation experiment results in Table 5 showed that the mAP50~95 increased slightly.
Moreover, the fusion of SAR and optical images has become a prominent research direction in target recognition based on deep learning. SAR imaging has all-weather and penetrating clouds and mist. However, images are difficult to interpret. In contrast, optical imaging is susceptible to environmental impacts such as clouds and light. However, images are easy to interpret. Our further research topic is how to fuse SAR and optical images to achieve information complementarity and improve detection accuracy.

6. Conclusions

For the accurate detection and recognition of aircraft targets in high-resolution remote sensing SAR images, an improved YOLOv5s is proposed in this paper and is of great significance. An MRFCA network is proposed for improving the detection ability for multi-scale targets, the weights of different receptive fields are dynamically adjusted by adaptive learning, reasonably allocating the proportion of feature information of multi-scale. This paper proposed the 4DDH network, as the four detection branches can improve the detection ability for small targets, and the decoupled detection head can effectively avoid the conflict of different feature information concerned in detection and recognition tasks, strengthening the capabilities of detection and recognition. This paper integrated the multi-method of data augmentation, which can enhance the diversity of datasets and generalization of the model, and improve the training speed of the network. This paper used the K-mean++ method, which can improve the network convergence speed and detection accuracy. Experiments showed that the improved YOLOv5s significantly improves the performance of SAR image interpretation, especially for small aircraft targets.
In the case of extremely small targets and complex backgrounds, missing detections and false detections still exist. In addition, the detection speed and model size of the improved YOLOv5s algorithm need to be optimized. To further improve the efficiency of the algorithms, we will try to integrate the following improvements into existing algorithms. Firstly, we should attempt to use the lightweight network to reduce model parameters. Secondly, we should consider to incorporate the attention mechanism to improve the accuracy and efficiency of SAR image interpretation. Thirdly, there are only 2000 SAR images in our datasets, so we should consider how to improve the model generalization. Finally, we should consider how to fuse SAR and optical images to achieve information complementarity and improve detection accuracy.

Author Contributions

Conceptualization, W.H. and X.W.; methodology, Y.L. and X.W.; software, X.W.; validation, D.H.; resources, Y.L. and P.X.; data curation, W.H.; writing—original draft preparation, X.W.; writing—review and editing, W.H. and Y.L.; supervision, W.H. All authors have read and agreed to the published version of the manuscript.

Funding

This research was funded by the key research and development projects of the Ministry of Science and Technology of China (Grant No. 2022YFC2203901), the Science and Technology Development Plan Project of Jilin Province, China (Grand No. 20230201099GX), and the Department of Education Science and Technology Research Project of Jilin Province, China (Grand No. JJKH20220053KJ).

Institutional Review Board Statement

Not applicable.

Informed Consent Statement

Not applicable.

Data Availability Statement

The dataset used in this research can be obtained from the 2021 Gaofen challenge on Automated High-Resolution Earth Observation Image Interpretation. Available online: http://gaofen-challenge.com (accessed on 1 October 2021).

Acknowledgments

The authors would like to thank the anonymous reviewers.

Conflicts of Interest

The authors declare no conflict of interest.

References

  1. Moreira, A.; Prats-Iraola, P.; Younis, M.; Krieger, G.; Papathanassiou, K.P. A tutorial on synthetic aperture radar. IEEE Geosci. Remote Sens. Mag. 2013, 1, 6–43. [Google Scholar] [CrossRef]
  2. Cui, Y.; Zhou, G.; Yang, J. Yamaguchi On the iterative censoring for target detection in SAR images. IEEE Geosci. Remote Sens. Lett. 2011, 8, 641–645. [Google Scholar] [CrossRef]
  3. Ao, W.; Xu, F.; Li, Y.; Wang, H. Detection and discrimination of ship targets in complex background from spaceborne ALOS-2 SAR images. IEEE J. Sel. Top. Appl. Earth Obs. Remote Sens. 2018, 11, 536–550. [Google Scholar] [CrossRef]
  4. Gao, G.; Ouyang, K.; Zhou, S.; Luo, Y.; Liang, S. Scheme of parameter estimation for generalized gamma distribution and its application to ship detection in SAR images. IEEE Trans. Geosci. Remote Sens. 2017, 55, 1812–1832. [Google Scholar] [CrossRef]
  5. Leng, X.; Ji, K.; Zhou, S.; Xing, X. Ship detection based on complex signal kurtosis in single-channel SAR imagery. IEEE J. Sel. Top. Appl. Earth Obs. Remote Sens. 2019, 57, 6447–6461. [Google Scholar] [CrossRef]
  6. Wang, X.; Chen, C. Ship detection for complex background SAR images based on a multiscale variance weighted image entropy method. IEEE Geosci. Remote Sens. Lett. 2017, 14, 184–187. [Google Scholar] [CrossRef]
  7. Zhang, X.; Tan, Z.; Wang, Y. SAR target recognition based on multi-feature multiple representation classifier fusion. J. Radars 2017, 6, 492–502. [Google Scholar] [CrossRef]
  8. Cheng, J.; Li, L.; Wang, X. SAR target recognition under the framework of sparse representation. J. Univ. Electron. Sci. Technol. China 2014, 43, 524–529. [Google Scholar]
  9. Wu, Q.; Sun, H.; Sun, X.; Zhang, D.; Fu, K. Aircraft recognition in high-resolution optical satellite remote sensing images. IEEE Geosci. Remote Sens. Lett. 2015, 12, 112–116. [Google Scholar]
  10. Ge, L.; Xian, S.; Fu, K.; Wang, H. Interactive geospatial object extraction in high resolution remote sensing images using shape-based global minimization active contour model. Pattern Recognit. Lett. 2013, 34, 1186–1195. [Google Scholar]
  11. Xiao, Z.; Liu, Q.; Tang, G.; Zhai, X. Elliptic Fourier transformation-based histograms of oriented gradients for rotationally invariant object detection in remote-sensing images. Int. J. Remote Sens. 2015, 36, 618–644. [Google Scholar] [CrossRef]
  12. Girshick, R.; Donahue, J.; Darrell, T.; Malik, J. Rich feature hierarchies for accurate object detection and semantic segmentation. In Proceedings of the 2014 IEEE Conference on Computer Vision and Pattern Recognition (CVPR), Columbus, OH, USA, 23–28 June 2014; pp. 580–587. [Google Scholar] [CrossRef]
  13. Girshick, R. Fast r-cnn. In Proceedings of the 2015 IEEE Conference on Computer Vision and Pattern Recognition (CVPR), Boston, MA, USA, 8–10 June 2015; pp. 1440–1448. [Google Scholar] [CrossRef]
  14. Ren, S.; He, K.; Girshick, R.; Sun, J. Faster R-CNN: Towards Real-Time Object Detection with Region Proposal Networks. IEEE Trans. Pattern Anal. Mach. Intell. 2017, 39, 1137–1149. [Google Scholar] [CrossRef]
  15. He, K.; Gkioxari, G.; Dollár, P.; Girshick, R. Mask R-CNN. In Proceedings of the 2017 IEEE International Conference on Computer Vision (ICCV), Venice, Italy, 22–29 October 2017; pp. 2961–2969. [Google Scholar] [CrossRef]
  16. Berg, A.C.; Fu, C.; Szegedy, C.; Anguelov, D.; Erhan, D.; Reed, S.; Liu, W. SSD: Single shot multi-box detector. In Proceedings of the European Conference on Computer Vision, Amsterdam, The Netherlands, 11–14 October 2016; pp. 21–37. [Google Scholar] [CrossRef]
  17. Lin, T.; Goyal, P.; Girshick, R.; He, K.; Dollar, P. Focal loss for dense object detection. In Proceedings of the IEEE International Conference on Computer Vision (ICCV), Venice, Italy, 22–29 October 2017; pp. 2980–2988. [Google Scholar] [CrossRef]
  18. Redmon, J.; Divvala, S.; Girshick, R.; Farhadi, A. You only look once: Unified, real-time object detection. In Proceedings of the IEEE Conference on Computer Vision and Pattern Recognition, Las Vegas, NV, USA, 27–30 June 2016; pp. 779–788. [Google Scholar] [CrossRef]
  19. Farhadi, A.; Redmon, J. Yolov3, An incremental improvement. In Proceedings of the Computer Vision and Pattern Recognition, Salt Lake City, UT, USA, 18–23 June 2018. [Google Scholar]
  20. Bochkovskiy, A.; Wang, C.Y.; Liao, H.Y.M. YOLOv4: Optimal Speed and Accuracy of Object Detection. arXiv 2020, arXiv:2004.10934. [Google Scholar] [CrossRef]
  21. Zheng, Y.; Zhou, G.; Lu, B. A Multi-Scale Rebar Detection Network with an Embedded Attention Mechanism. Appl. Sci. 2023, 13, 8233. [Google Scholar] [CrossRef]
  22. Hou, Q.; Zhou, D.; Feng, J. Coordinate Attention for Efficient Mobile Network Design. In Proceedings of the 2021 IEEE/CVF Conference on Computer Vision and Pattern Recognition (CVPR), Nashville, TN, USA, 20–25 June 2021; pp. 13708–13717. [Google Scholar] [CrossRef]
  23. Tan, S.; Yan, J.; Jiang, Z.; Huang, L. Approach for improving YOLOv5 network with application to remote sensing target detection. J. Appl. Remote Sens. 2021, 15, 036512. [Google Scholar] [CrossRef]
  24. Yu, X.; Wu, S.; Lu, X.; Gao, G. Adaptive weighted multiscale feature fusion for small drone object detection. J. Appl. Remote Sens. 2022, 16, 034517. [Google Scholar] [CrossRef]
  25. Huang, M.; Xu, Y.; Qian, L.; Shi, W.; Zhang, Y.; Bao, W.; Wang, N.; Liu, X.; Xiang, X. The QXS-SAROPT dataset for deep learning in SAR-optical data fusion. arXiv 2021, arXiv:2103.08259v2. [Google Scholar] [CrossRef]
  26. Hu, J.; Shen, L.; Sun, G. Squeeze-and-excitation networks. In Proceedings of the IEEE Conference on Computer Vision and Pattern Recognition, Salt Lake City, UT, USA, 18–23 June 2018; pp. 7132–7141. [Google Scholar] [CrossRef]
  27. Li, Z.; Li, C.; Deng, L.; Fan, Y.; Xiao, X.; Ma, H.; Qin, J.; Zhu, L. Improved AlexNet with Inception-V4 for Plant Disease Diagnosis. Comput. Intell. Neurosci. 2022, 2022, 5862600. [Google Scholar] [CrossRef] [PubMed]
  28. Kumar, T.; Mileo, A.; Brennan, R.; Bendechache, M. Image Data Augmentation Approaches: A Comprehensive Survey and Future directions. arXiv 2023, arXiv:2301.02830v4. [Google Scholar] [CrossRef]
  29. Goicovich, I.; Olivares, P.; Román, C.; Vázquez, A.; Poupon, C.; Mangin, J.F.; Guevara, P.; Hernández, C. Fiber Clustering Acceleration with a Modified Kmeans++ Algorithm Using Data Parallelism. Front. Neuroinform. 2021, 15, 727859. [Google Scholar] [CrossRef] [PubMed]
  30. Liu, S.; Qi, L.; Qin, H.; Shi, J.; Jia, J. Path Aggregation Network for Instance Segmentation. In Proceedings of the IEEE Conference on Computer Vision and Pattern Recognition, Salt Lake City, UT, USA, 18–23 June 2018; pp. 8759–8768. [Google Scholar] [CrossRef]
  31. Lin, Y.; Dollár, P.; Girshick, R.; He, K.; Hariharan, B.; Belongie, S. Feature Pyramid Networks for Object Detection. In Proceedings of the IEEE International Conference on Computer Vision, Venice, Italy, 22–29 October 2017; pp. 2117–2125. [Google Scholar] [CrossRef]
  32. Woo, S.; Park, J.; Lee, J.Y.; Kweon, I.S. CBAM: Convolutional block attention module. In Proceedings of the European Conference on Computer Vision (ECCV), Munich, Germany, 8–14 September 2018. [Google Scholar] [CrossRef]
  33. Yang, J.; Wang, W.; Li, X.; Hu, X. Selective kernel networks. In Proceedings of the 2019 IEEE Conference on Computer Vision and Pattern Recognition(CVPR), Long Beach, CA, USA, 16–20 June 2019; pp. 510–519. [Google Scholar] [CrossRef]
  34. Dhivyaa, C.R.; Kandasamy, N.; Rajendran, S. Integration of dilated convolution with residual dense block network and multi-level feature detection network for cassava plant leaf disease identification. Concurr. Comput. Pract. Exp. 2022, 34, e6879. [Google Scholar]
  35. 2021 Gaofen Challenge on Automated High-Resolution Earth Observation Image Interpretation. Available online: http://gaofen-challenge.com (accessed on 1 October 2021).
  36. Wang, X.; Hong, W.; Liu, Y.; Hu, D.; Xin, P. SAR Image Aircraft Target Recognition Based on Improved YOLOv5. Appl. Sci. 2023, 13, 6160. [Google Scholar] [CrossRef]
Figure 1. YOLOv5s network architecture.
Applsci 13 10023 g001
Figure 2. SENet module.
Applsci 13 10023 g002
Figure 3. Inception network.
Applsci 13 10023 g003
Figure 4. MRFCA network.
Applsci 13 10023 g004
Figure 5. The 4DDH network.
Applsci 13 10023 g005
Figure 6. Mosaic synthetic image.
Applsci 13 10023 g006
Figure 7. The distribution of 12 initial anchor boxes in the SAR image dataset.
Applsci 13 10023 g007
Figure 8. Examples of 7 types of aircraft.
Applsci 13 10023 g008
Figure 9. Comparison results of small targets recognition between the original YOLOv5s and the improved YOLOv5s: (a) bounding boxes of the SAR images in the dataset; (b) results for the original YOLOv5s; (c) results for the improved YOLOv5s.
Applsci 13 10023 g009
Figure 10. Distribution of the bounding boxes of the aircraft targets in our datasets.
Applsci 13 10023 g010
Table 1. The initial anchor sizes between the original YOLOv5s and our improved YOLOv5s.
Detection Map LevelP2P3P4P5
Original YOLOv5s-(10, 13)(30, 61)(116, 90)
(16, 30)(62, 45)(156, 198)
(33, 23)(59, 119)(373, 326)
Improved YOLOv5s(16, 15)(35, 37)(65, 79)(94, 74)
(23, 25)(47, 61)(73, 55)(121, 98)
(34, 24)(54, 43)(85, 108)(146, 135)
Table 2. Computer software environment configuration.
ParameterConfiguration
CPUInter(R) Core(TM) i7-7820X CPU @ 3.60 GHz
GPUNVIDIA TITAN Xp
AcceleratorCUDA 10.2
ArchitecturePytorch 1.9
LanguagePython 3.8
Table 3. Comparative analysis based on different network model.
MethodBackbonemAP50mAP75mAP50~95S-Target
mAP50~95
L-Target
mAP50~95
Faster R-CNNResNet-5085.970.355.746.159.8
Retina-NetResNet-5081.266.252.243.257.2
SSDVGG-1680.565.351.841.856.9
YOLOv3DarKnet-5384.470.358.349.062.6
YOLOv5sCSPDarknet5385.171.661.050.565.9
OursImproved91.479.370.363.672.4
Where S-Target represents small targets whose pixel size is less than 60 × 60, our dataset contains 1956 small targets; L-Target represents large targets whose pixel size is more than 60 × 60, and our dataset contains 4600 large targets. From the results of our experiments, the mAPs of our algorithm are higher than those of the compared algorithm. The mAP50~95 increases significantly, especially for small targets, up by 13.1% compared with YOLOv5s. Experiments demonstrate that the improved YOLOv5s has stronger detection and recognition capabilities. Compared with other advanced algorithms, it shows certain advantages. It is more suitable for aircraft target detection and recognition tasks in remote sensing SAR images.
Table 4. Comparison of recognition accuracy of MRFCA modules.
C2C3C4C5mAP50mAP75mAP50~950S-Target
mAP50~95
L-Target
mAP50~95
××××85.171.661.050.565.9
×××89.376.267.559.669.9
×××89.075.866.959.069.6
×××88.675.366.258.269.2
×××88.174.865.357.068.8
Table 5. Ablation experiment results.
IndexFSFSM4DDHMRFCAK-Mean++mAP50mAP75mAP50~95S-Target
mAP50~95
L-Target
mAP50~95
YOLOv5s×××××85.171.661.050.565.9
YOLOv5s+××××86.572.561.651.266.4
YOLOv5s+××××87.373.563.253.867.3
YOLOv5s+×××88.174.565.357.168.2
YOLOv5s+×××89.376.267.559.669.9
YOLOv5s+××90.678.669.763.172.0
YOLOv5s+×××88.174.263.854.367.7
YOLOv5s+×91.479.370.363.672.4
Where FS represents the fusion of the data augmentation method of flip and scaling, and FSM represents the fusion of the data augmentation method of flip, scaling, and mosaic. After integrating the FSM method, the mAP50~95 has increased by 2.2%, and the mAP50~95 for S-Target has increased by 3.3%; after integrating the FSM and 4DDH methods, the mAP50~95 has increased by 4.3%, and the mAP50~95 for S-Target has increased by 6.6%; after integrating the FSM and MRFCA methods, the mAP50~95 has increased by 6.5%, and the mAP50~95 for S-Target has increased by 9.1%; after integrating the FSM, 4DDH, and MRFCA methods, the mAP50~95 has increased by 8.7%, and the mAP50~95 for S-Target has increased by 12.6%; after integrating the FSM, 4DDH, MRFCA, and K-mean++ methods, the mAP50~95 has increased by 9.3%, and the mAP50~95 for S-Target has increased by 13.1%. As can be seen from the ablation experiment results, the detection precision in each index has improved after optimizing, especially for small targets, and the improvement effect is more obvious. The YOLOv5s algorithm tends to miss some small aircraft targets on special occasions. The improved YOLOv5s algorithm can solve the problem very well. Figure 9 shows the comparison result between YOLOv5s and improved YOLOv5s. The color definition is unified with Figure 8.
Disclaimer/Publisher’s Note: The statements, opinions and data contained in all publications are solely those of the individual author(s) and contributor(s) and not of MDPI and/or the editor(s). MDPI and/or the editor(s) disclaim responsibility for any injury to people or property resulting from any ideas, methods, instructions or products referred to in the content.

