Article

Experimental and Theoretical Study of the Influence of Saline Soils on Frozen Wall Formation

1
Mining Institute of the Ural Branch of the Russian Academy of Sciences, 614007 Perm, Russia
2
Institute of Nature Management, National Academy of Sciences of Belarus, 220072 Minsk, Belarus
*
Authors to whom correspondence should be addressed.
Appl. Sci. 2023, 13(18), 10016; https://doi.org/10.3390/app131810016
Submission received: 1 August 2023 / Revised: 29 August 2023 / Accepted: 4 September 2023 / Published: 5 September 2023
(This article belongs to the Special Issue Artificial Ground Freezing Technology)

Abstract

:
This paper examines the impact of salinity on the thermophysical properties of soils during artificial freezing. It focuses on analyzing heat and mass transfer in saline soils for constructing a frozen wall around a mineshaft at a potash salt deposit. The presence of salts in the groundwater near the contact point with water-protective strata is common in these deposits. Experimental studies were conducted on clay, chalk, and sand to understand the effect of salinity on the freezing temperature, unfrozen water content, specific heat capacity, and thermal conductivity of wet soil. These findings were used to simulate heat and mass transfer in saline soils using a one-dimensional model. The technique of circumferential averaging was introduced to account for the thermal impact of freeze pipes. The results indicate that higher soil salinity leads to a faster decrease in soil temperature under freezing conditions, although this dependence is weak for clay. This study also revealed that an increase in initial salinity results in a reduction in the thickness of the frozen wall. It was found that, for chalk and sand, there exists a range of initial salinity during which the frozen wall’s thickness is almost independent of the initial salinity.

1. Introduction

The construction of mineshafts and subway tunnels under the condition of flooded soils is implemented using special methods. One of the most common of those methods is artificial ground freezing (AGF) [1,2]. The purpose of AGF is to build a protective structure, consisting of frozen soils, around the future mineshaft. This structure is most commonly referred to as a “frozen wall” (FW) [3]. The functions of an FW are to prevent the flooding of the shaft with groundwater and to strengthen the loose walls of the shaft before the construction of a permanent concrete lining [3]. The freezing of the soil is implemented with the help of freeze pipes mounted along the perimeter of the designed mineshaft (see Figure 1a).
The study and control of the formation of frozen walls are implemented using experimental and theoretical methods. Experimental methods involve monitoring the temperature distribution over the depth of several control boreholes drilled near the contour of the freeze pipes (see Figure 1b) [4]. The measured temperature distributions are used to adjust the parameters of the mathematical models of heat and mass transfer in the frozen media [5]. Further, the adjusted mathematical models are used to estimate the temperature distribution in the entire volume of the frozen soil to determine the actual thickness and continuity of the FW, with those being the main technical parameters of an FW.
However, the mentioned methods for monitoring and predicting the state of an FW often do not consider the factor of soil salinity, which often occurs during the construction of mineshafts in potash salt deposits. The salinity of the soil leads to a change in its thermophysical and mechanical properties. In addition, an increase in the amount of dissolved salts in the porewater leads to a decrease in its freezing temperature [6,7], which can negatively affect the waterproofing and strength properties of an FW.
There are many studies devoted to the effect of salinity on the freezing of porewater. Tsytovich [6] presents extensive theoretical and experimental information about the general patterns of freezing of saline soils, as well as practical aspects of taking into account salinity in the construction of surface structures. Banin and Anderson [8] and Yong et al. [9] obtained experimental dependences of the thermophysical properties of several frozen soils on the concentration of salts in them. Lucas et al. [10] focused on the mathematical modeling of heat and mass transfer in frozen saline soils and the comparison of the obtained results with the experimental base. In it, Lucas et al. obtained equations for simultaneous heat and mass flows at one of the interfaces for a wide range of temperatures and concentrations. Liu et al. [11] investigated the electrical properties of frozen salted clay. Aleksyutina and Motenko [12] evaluated the effects of soil salinity and organic matter content on the thermal properties of frozen and thawed soils. Qiu et al. [13] proposed a thermal conductivity model of saline soil considering the heat dissipation due to heat radiation. Zhang et al. [14] proposed a coupled hydro-thermal-salt-mechanical model with phase change to simulate the one-side freezing process of saturated sulfate saline soil.
However, most studies are related to the natural freezing of the soil in permafrost regions, and they cannot be fully applied to the conditions involved with the artificial freezing of soils, because of the features of artificial freezing: higher temperature differences, faster changes in the amount of unfrozen groundwater over time, and higher values of rock and hydrostatic pressures due to greater depths.
The effects of salinity on the artificial freezing of soils are described in [7,15,16,17]. Lyu et al. [15] investigated the change in the freezing point with the increase in concentration of NaCl in the pore brine. A new theoretical equation was developed that relates thermal conductivity to water content and temperature. The works [16,17] present the results of laboratory studies on the effects of salinity on freezing temperatures in sand samples. In addition, the results of an experiment on the effects of water filtration and the artificial freezing of soil samples using two freeze pipes with different levels of salt content in the porewater are presented. However, these studies consider only the effect of salinity on the freezing temperature of porewater, while an analysis of the effect of salinity on the changes in the entire complex of basic thermophysical properties of soils was not implemented. The work [7] contains the results of laboratory studies on the effects of the salinity and initial water content on the freezing temperature of porewater, specific heat capacity, thermal conductivity, and unfrozen water content. However, as in the case of works [16,17], this study addresses only one type of soil—argillite-like clay—rather than sand. At the same time, the importance of studying a set of different soil types should be noted because the construction of underground structures often involves penetrating various types of soil layers. Dissolved salt can have different effects on the freezing processes of different types of soils.
Recently, there has been a tendency toward increased research using the numerical simulation of heat and mass transfer during AGF. This may be due to the growing need to design the construction of FWs in difficult hydrogeological conditions. For example, works [18,19] present the results of a study on the numerical modeling of AGF in saline soils, regarding the construction of underground tunnels. Based on the literature data on the experimentally measured thermal conductivity of frozen soils, Bi et al. [20] proposed a new neural network model for determining the dependence of thermal conductivity on temperature and other soil properties. Wan et al. [21] presents an analytical model for evaluating the thermal conductivity of sodium sulfate soils based on a generalized thermal conductivity theory of geomaterials.
At the same time, only a few works can be found that consider the presence of soils and their transfer via porewater during soil freezing. For example, in [22,23,24], complex, coupled thermo-hydro-mechanical models were developed with consideration given to changes in the soil salinity. However, the models presented in these works contain many equations, relationships, and unknown parameters. As a result, they are difficult to implement, and therefore, it is problematic to use them for the practical tasks of designing and controlling FW formation. Most often, when monitoring the state of an FW, carrying out a quick, near-real-time calculation of the temperature field in frozen soil is required. These calculations also usually require preliminary parametrization of the model according to experimental data from control boreholes. The process of parameterizing and adjusting the model also requires a series of trial calculations. For these reasons, in our work, to analyze the state of the FW, we tried to choose models that would be easy to implement, would be less demanding on computational resources, and would have fewer calibrated parameters. However, at the same time, these models should include the most significant physical processes during AGF and the formation of FWs.
Thus, based on all of the above-described considerations, it can be concluded that, at present, it is possible to find a lot of experimental studies on the effect of salinity on soil freezing in relation to permafrost problems, but only a small portion of the studies are directly related to AGF, and even fewer are directly related to the analysis of FW formation. In addition, the issue of the numerical simulation of heat and mass transfer processes in solving applied problems of monitoring and predicting FW formation in saline soils remains poorly covered. This is all further complicated by the fact that an extensive base of laboratory studies on the effect of salinity on the thermophysical properties of porewater is available only for sandy soils.
In view of this, this work aims to study the patterns of thermophysical processes in saline soils of various types in the AGF process. In particular, we want to find out how the soil salinity affects the FW growth rate and its continuity in relation to the construction of mine shafts in potash and rock salt deposits.
To achieve this goal, we solve two problems: the determination of the characteristic thermophysical parameters of porewater in various soils, depending on the concentration of the NaCl salt solution in the water; and the development of a coupled mathematical model of heat and mass transfer during AGF for the case of construction of a mineshaft at a potash salt deposit. The present work is a continuation of the work described in [7,25].

2. Experimental Study on the Effect of Salinity on Soil Thermophysical Properties

2.1. Sample Preparation

Here, we describe the experimental studies that were implemented to identify the dependence of the thermophysical properties of soils on negative temperatures and levels of salt concentration in porewater. They are important for the subsequent analysis of the characteristic features of the effects of salinity on heat transfer in soils during freezing. Porewater containing a solution of NaCl salt was considered. Argillite-like clay, chalk, and sand were studied. The choices of the soils and salt types were based on the fact that they are the most common for the above-salt strata of potash salt deposits.
This study was conducted according to a well-known technique [26].
To elucidate the patterns of salt influence on the phase composition of water and the thermophysical characteristics of soils, the samples’ initial compositions needed to be as identical as possible. Consequently, investigations were carried out on samples with a compromised structure (pastes) at a water content and density that matched those of samples with a natural composition.
To achieve this, the chosen material was initially crushed using a laboratory mill and then sieved through a mesh with a diameter of 5 mm. Subsequently, it was meticulously mixed, placed within a sealed container, and left to age for a full calendar week. Preliminary experiments indicated that this duration was adequate for ensuring a consistent distribution of moisture throughout the sample’s volume. Only after this period was the material’s moisture content determined, which was regarded as its initial state.
Each type of soil was represented by nine samples. These samples were divided into three groups of three samples each. Each group of samples was associated with a certain soil water content. Additionally, the samples in each group were divided as follows: (1) samples with distilled water and the standard freezing temperature of the porewater; (2) samples with a NaCl content for which the freezing point of the porewater was 2 °C lower than the standard freezing temperature; (3) samples with a NaCl content for which the freezing temperature of the porewater was 4 °C lower than the standard freezing temperature. It is worth noting that, in the case of clay, studies were conducted for three values of initial water content. Chalk and sand studies were performed with only a single value for initial water content.

2.2. Methods of Measurement

All experiments were implemented in the Laboratory of Physicochemical Mechanics of Natural Dispersed Systems of the Institute of Nature Management of the National Academy of Sciences of Belarus. The unfrozen water content, the freezing temperature of the porewater, the specific heat capacity, and the thermal conductivity of the soil were the studied thermophysical parameters during the freezing process. A calorimeter was used to determine the unfrozen water content, the freezing temperature of the porewater, and the specific heat capacity. The principle underlying these measurements is the creation of adiabatic conditions, or conditions of controlled heat exchange, around a calorimetric cup filled with the sample under study. This allows for the determination of the thermophysical parameters under study (water content and specific heat capacity) at positive and negative temperatures, as well as the investigation of the changes in unfrozen water content during freezing and thawing cycles. The accuracy of the device is ±0.01 °C when measuring temperature, and the relative error in determining the heat of the phase transition is ±1%.
Experimentally measured masses of water and ice in the sample were used to calculate the unfrozen water content according to the following equation:
w = G w G i G S ,
where w is the unfrozen water content, G w is the mass of water in the sample (kg), G i is the mass of ice in the sample (kg), and G S is the mass of the dry skeleton of the soil (kg).
The specific heat capacity was calculated for the dry skeleton of the soil using the following equation:
c s = ( 1 + w 0 ) c m e a s w c w ( w 0 w ) c i L d w d T ,
c m e a s = Δ Q m e a s C c a l Δ T G Δ T ,
where c s is the specific heat capacity of the dry skeleton (J/(kg·°C)); c m e a s is the measured effective specific heat capacity of the soil sample (taking into account the phase transition of the moisture) (J/(kg·°C)); c w and c i are the specific heat capacities of water and ice (J/(kg·°C)), respectively; C c a l is the heat capacity of an empty calorimeter (J/°C); w 0 is the initial soil moisture (kg/kg); L is the specific heat of the phase transition of the moisture (J/kg); Δ Q m e a s is the amount of heat required to supply the calorimeter so that its temperature changes by Δ T (J); and G is the total mass of wet material (skeleton + water + ice) (kg).
The thermal conductivity of the soils was determined using a unique device based on the method of the stationary thermal state of the soil samples. The device features the use of original heat flow sensors mounted in metal heat-exchanger housings. This makes it possible to average the temperature field in the measurement planes and to protect the heat flow and temperature sensors from mechanical, physical, and chemical damage. The relative error in determining the thermal conductivity is 6%.
The calculation of the thermal conductivity coefficient was conducted in the stationary thermal state of the test sample according to the readings of the signals of the heat flow sensors with two heat exchangers. The first one is located on top of the sample, while the second one is located below it. Before the direct calculation of the thermal conductivity of the samples, the calibration parameters were determined based on the reference sample according to the following equations:
f = Q 2 Q 1 ,
K = λ r e f Δ T ( f q 1 + q 1 ) h ,
where f is the ratio of the heat fluxes of the upper and lower heat exchangers; Q 1 and Q 2 are the heat flows of the lower and upper heat exchangers in steady thermal mode, respectively (W/m2); λ r e f is the thermal conductivity of the reference sample (W/(m·°C)); Δ T is the temperature difference of the heat exchangers (°C); and h is the sample height (m).
As a result, the thermal conductivity of the soil samples is determined using the following equation:
λ = K f q 1 + q 1 Δ T h ,

2.3. Results and Processing of Experimental Measurements

Table 1 shows the measured density of the wet soils and the specific heat capacity of the dry skeleton. 
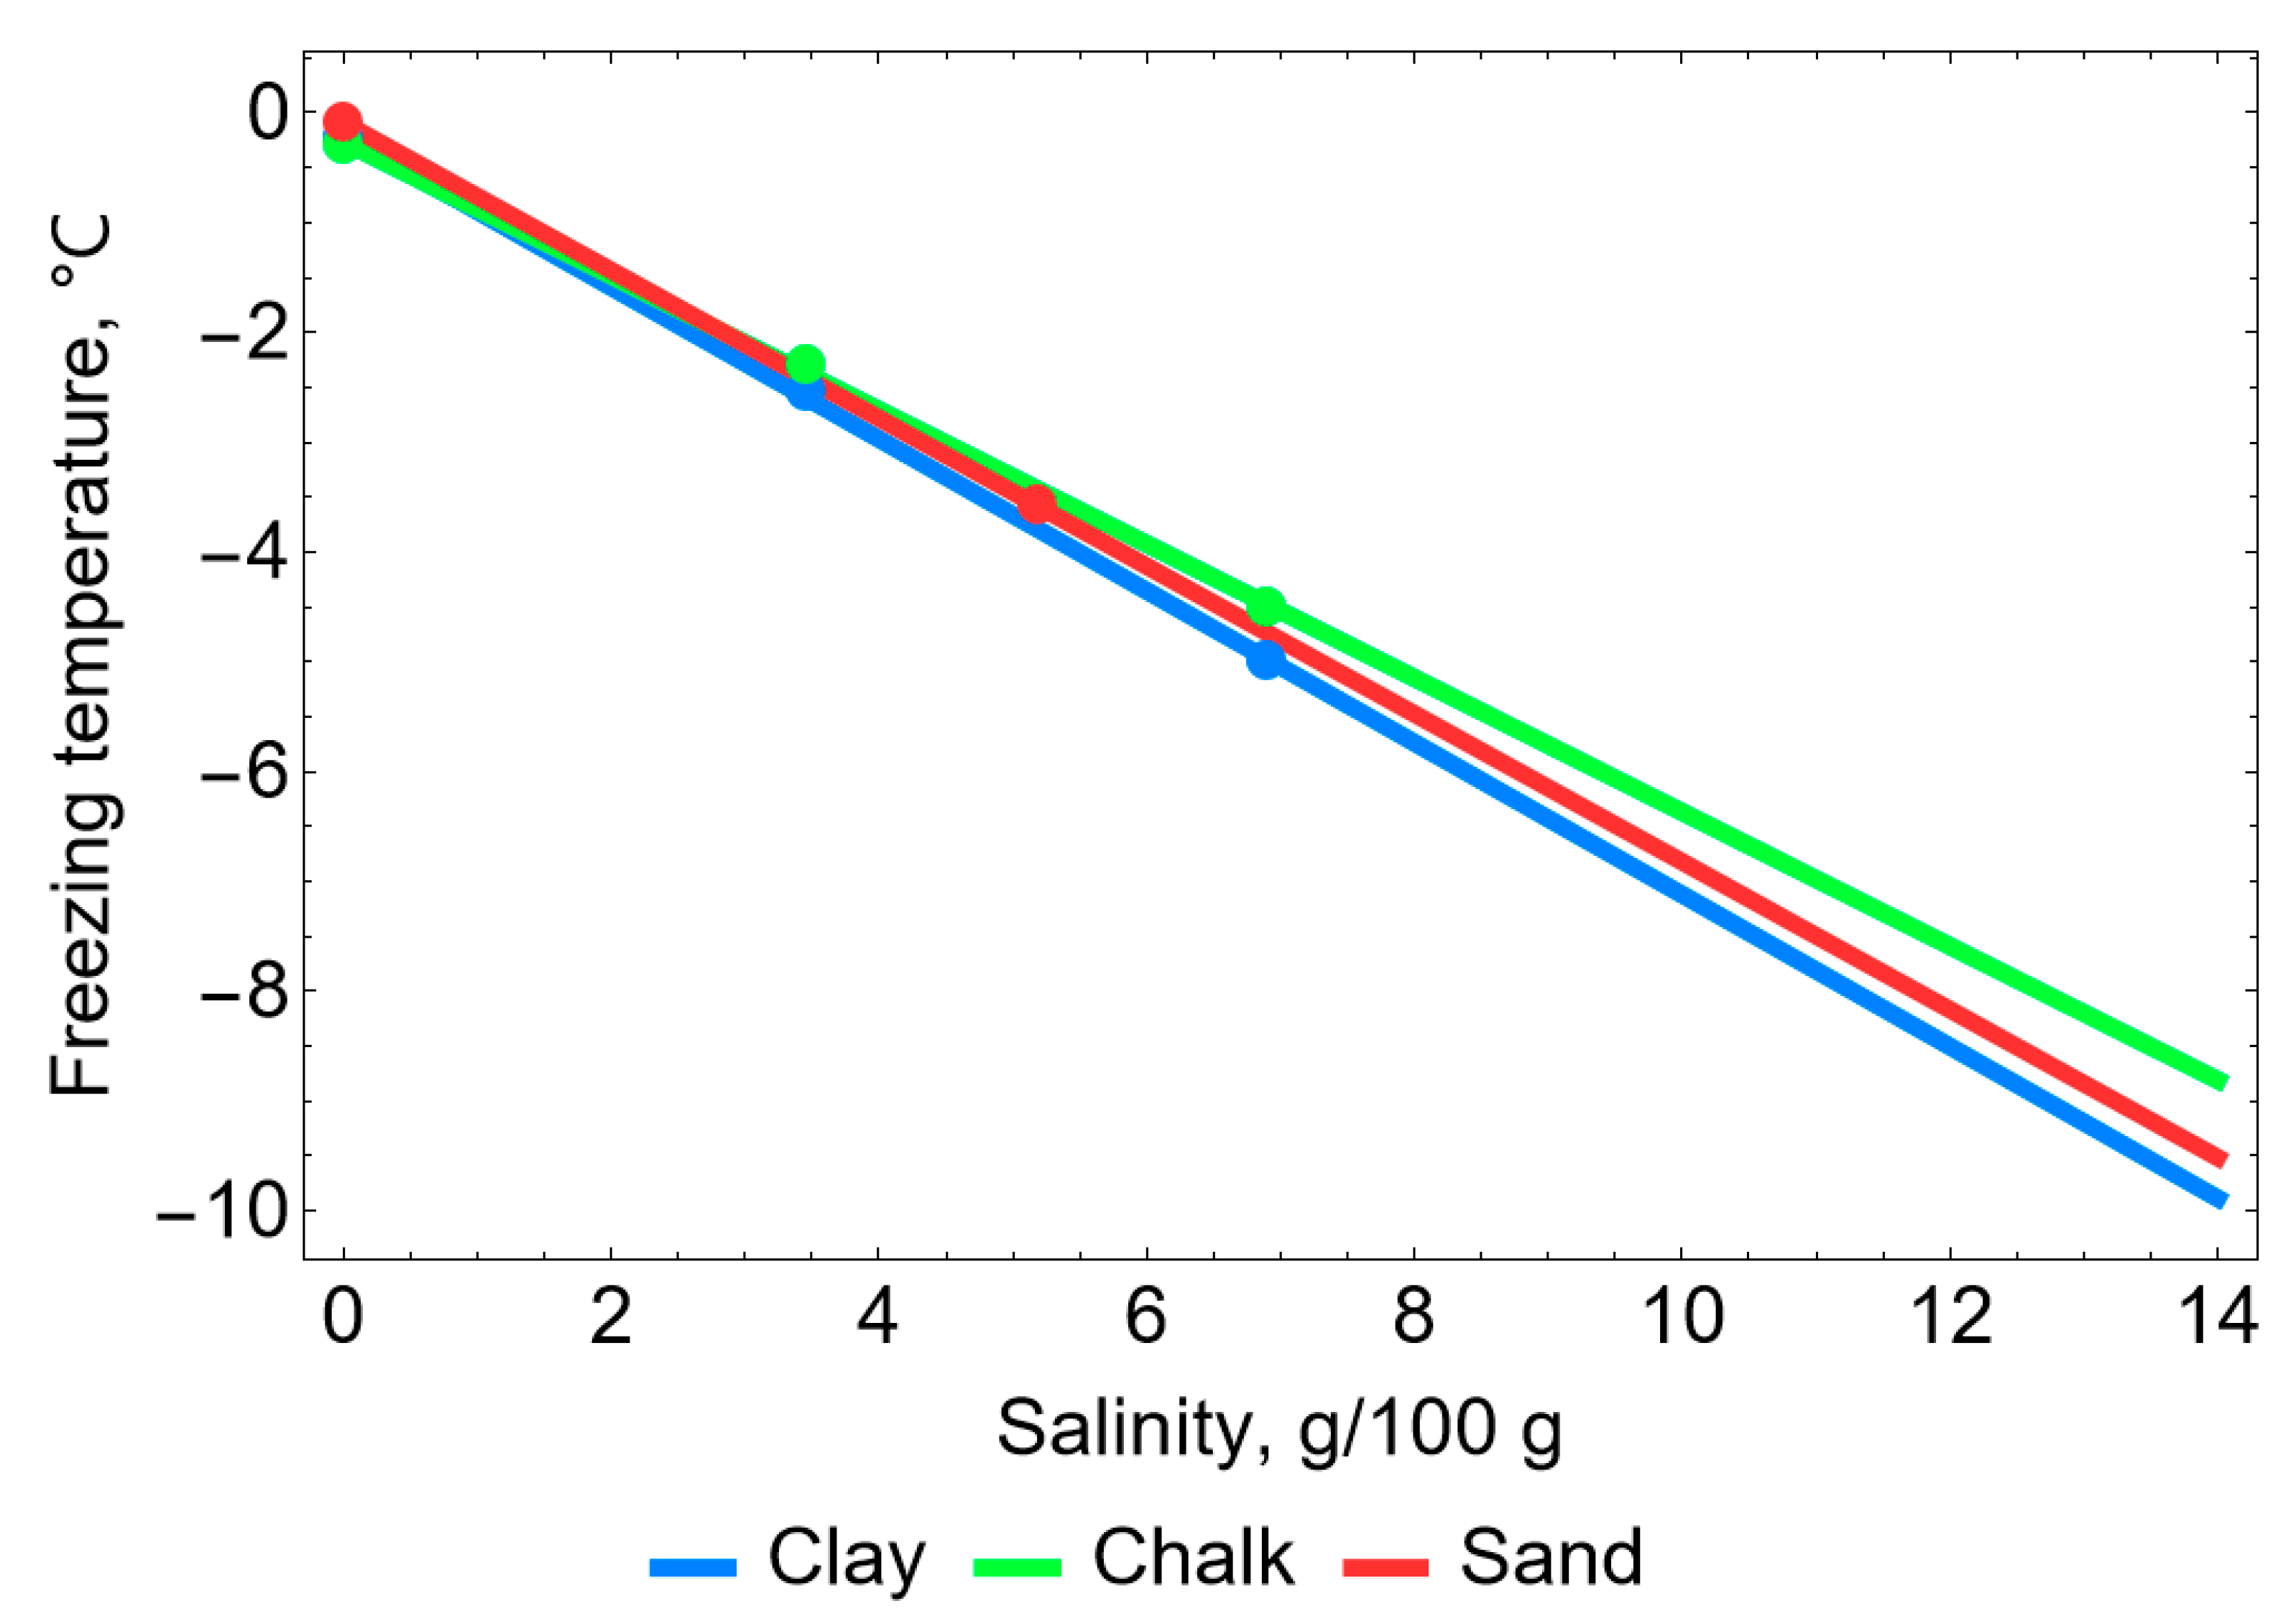
Table 2 shows the dependence of the freezing temperature of the porewater with different levels of NaCl content in units of g/100 g of moisture. (Hereafter, “NaCl content” is replaced with “salinity”.) In Table 1 and Table 2, clay parameters are presented only for one value of water content: 0.26 kg/kg. These parameters appear to be the most interesting from the point of view of comparative analysis with the thermophysical properties of chalk, which has nearly the same water content: 0.25 kg/kg. The results of the experimental measurements of clay parameters with other water content values can be found in [7].
The obtained experimental dependencies for the freezing temperatures of the porewater were approximated by a linear dependence (see Figure 2). It should be noted that, in general, the freezing temperature of water may depend nonlinearly on salinity [27]. However, subsequently, the numerical simulation of the heat and mass transfer in the saline soils was implemented with salinity values in the range of 0.01 g/100 g to 13.8 g/100 g. For this range, the error of the linear approximation relative to the nonlinear one, according to the data from [27], was about 0.2 °C, which can be considered insignificant.
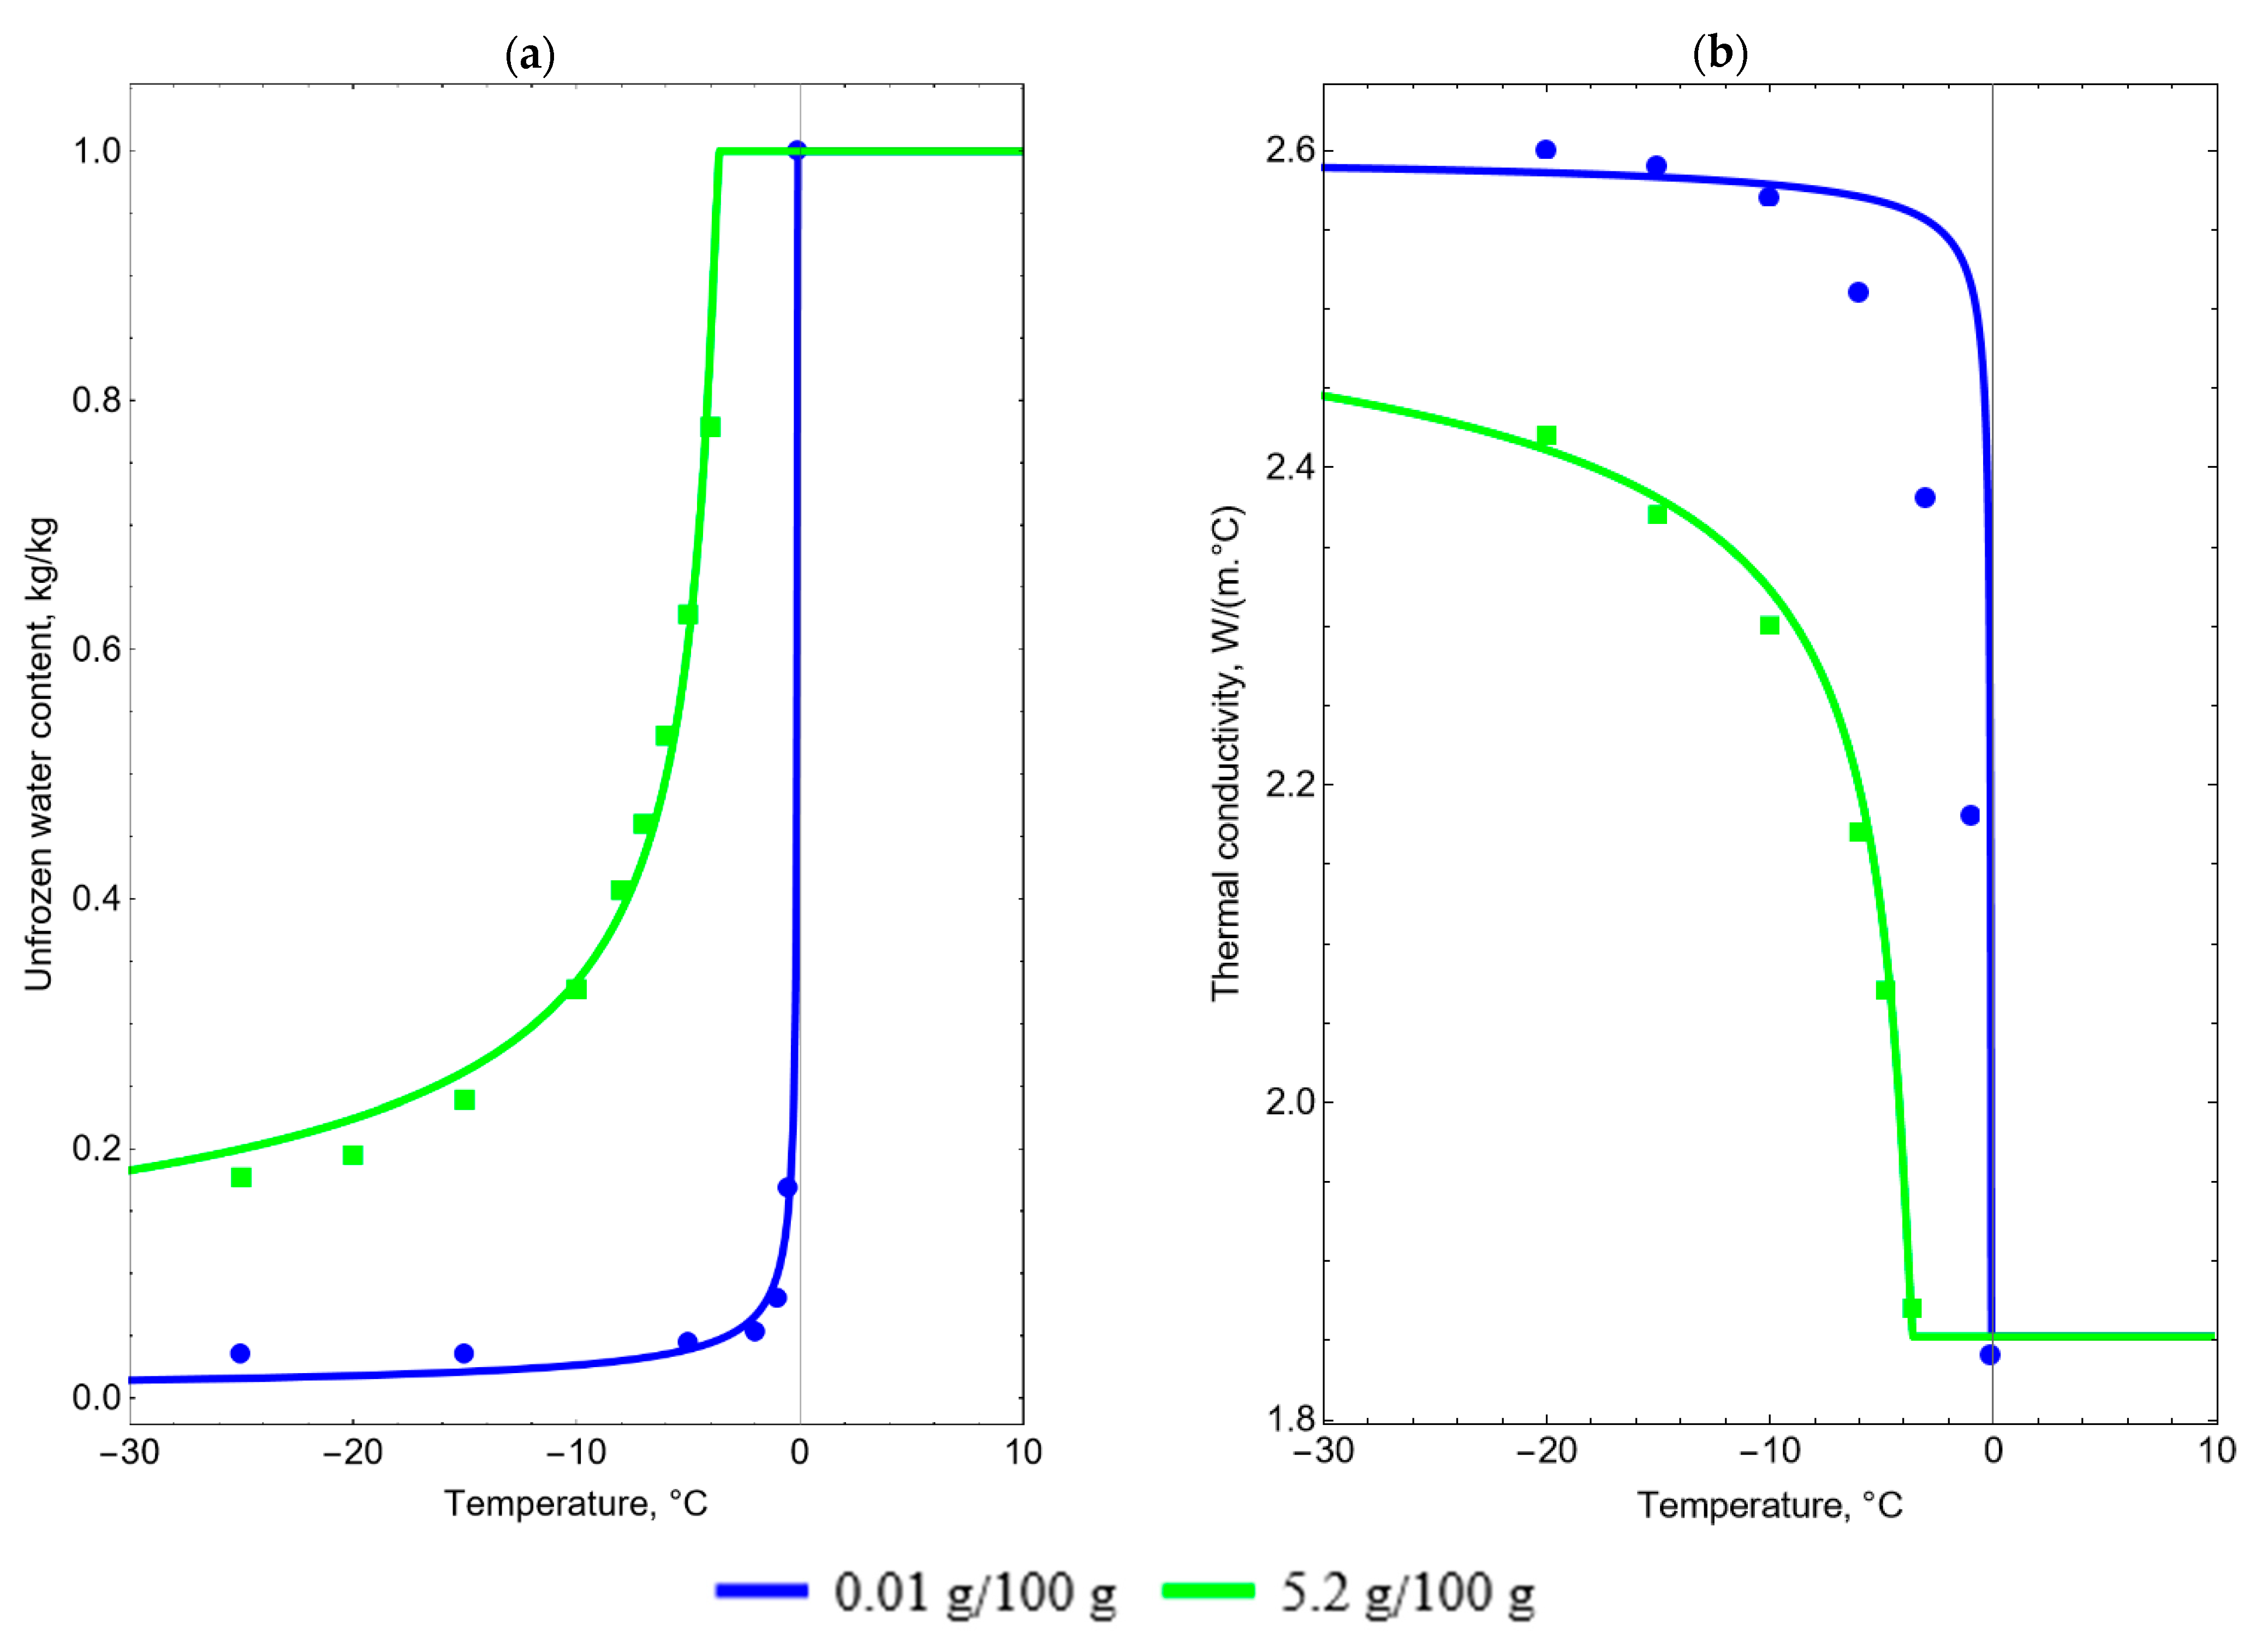
Table 3 shows the results of the experimental measurements of the dependence of the unfrozen water content on temperature and salinity, and Table 4 shows the results for the measurements of thermal conductivity.
The functional dependence of the unfrozen water on temperature and salinity is given by a well-known empirical dependence [28,29]:
γ = [ 1 + ( T l i q T ω ) 1 1 m ] m
where γ is the unfrozen water content (kg/kg), T l i q is the freezing temperature of porewater (°C), T is the temperature (°C), ω is the characteristic cooling temperature associated with the most common pore radius (°C), and m is the index indicating the distribution of the pore radius relative to the average radius.
The unknown parameters of Function (7), ω and m , were determined via experimental measurements using the least squares method. The obtained values for various types of soils and salinity are presented in Table 5. Later, during the process of numerical simulation, the dependence of the value ω on salinity, according to Table 5, was approximated by a linear function, and the value of m was given as a constant due to its small change in the considered range of salinities. Its value is equal to the mean of m values for three soil samples with different salinities.
The functional dependence of the thermal conductivity was set by a known dependence on the unfrozen water content [30]:
λ = λ s 1 n λ w n γ λ i n ( 1 γ )
where λ is the thermal conductivity of the soil (W/(m·°C)), n is the soil porosity, the “s” index corresponds to the dry skeleton, the “w” index corresponds to the water, and the “i” index corresponds to ice.
The porosity of soils can be calculated using the following equation:
n = w 0 ρ ρ w
However, comparative analysis showed that it is not possible to achieve a good agreement with the experimental data when calculating the thermal conductivity according to Equation (8). It was assumed that the reasons for this are unaccounted for by physical factors. For example, these may include a change in the thermal conductivity of the solution due to a change in its salt concentration, the migration of moisture, or the limited applicability of Equation (8) for the types of soils under consideration. Another possible factor is the error (6%) in the experimental measurement of thermal conductivity, as noted earlier. In this regard, to calculate the coefficient of thermal conductivity, a correction factor, ξ , is introduced into Equation (8):
λ = λ s 1 ξ n λ w ξ n γ λ i ξ n ( 1 γ )
Table 6 shows the calculated porosity and thermal conductivity of the dry skeleton for the studied soils (index “s” in Equation (10)) from the minimum mismatch with the experimental data on thermal conductivity. The mismatch was calculated as the root-mean-square error. It was assumed that the thermal conductivities of water and ice are 0.56/2.20 W/(m·°C), respectively.
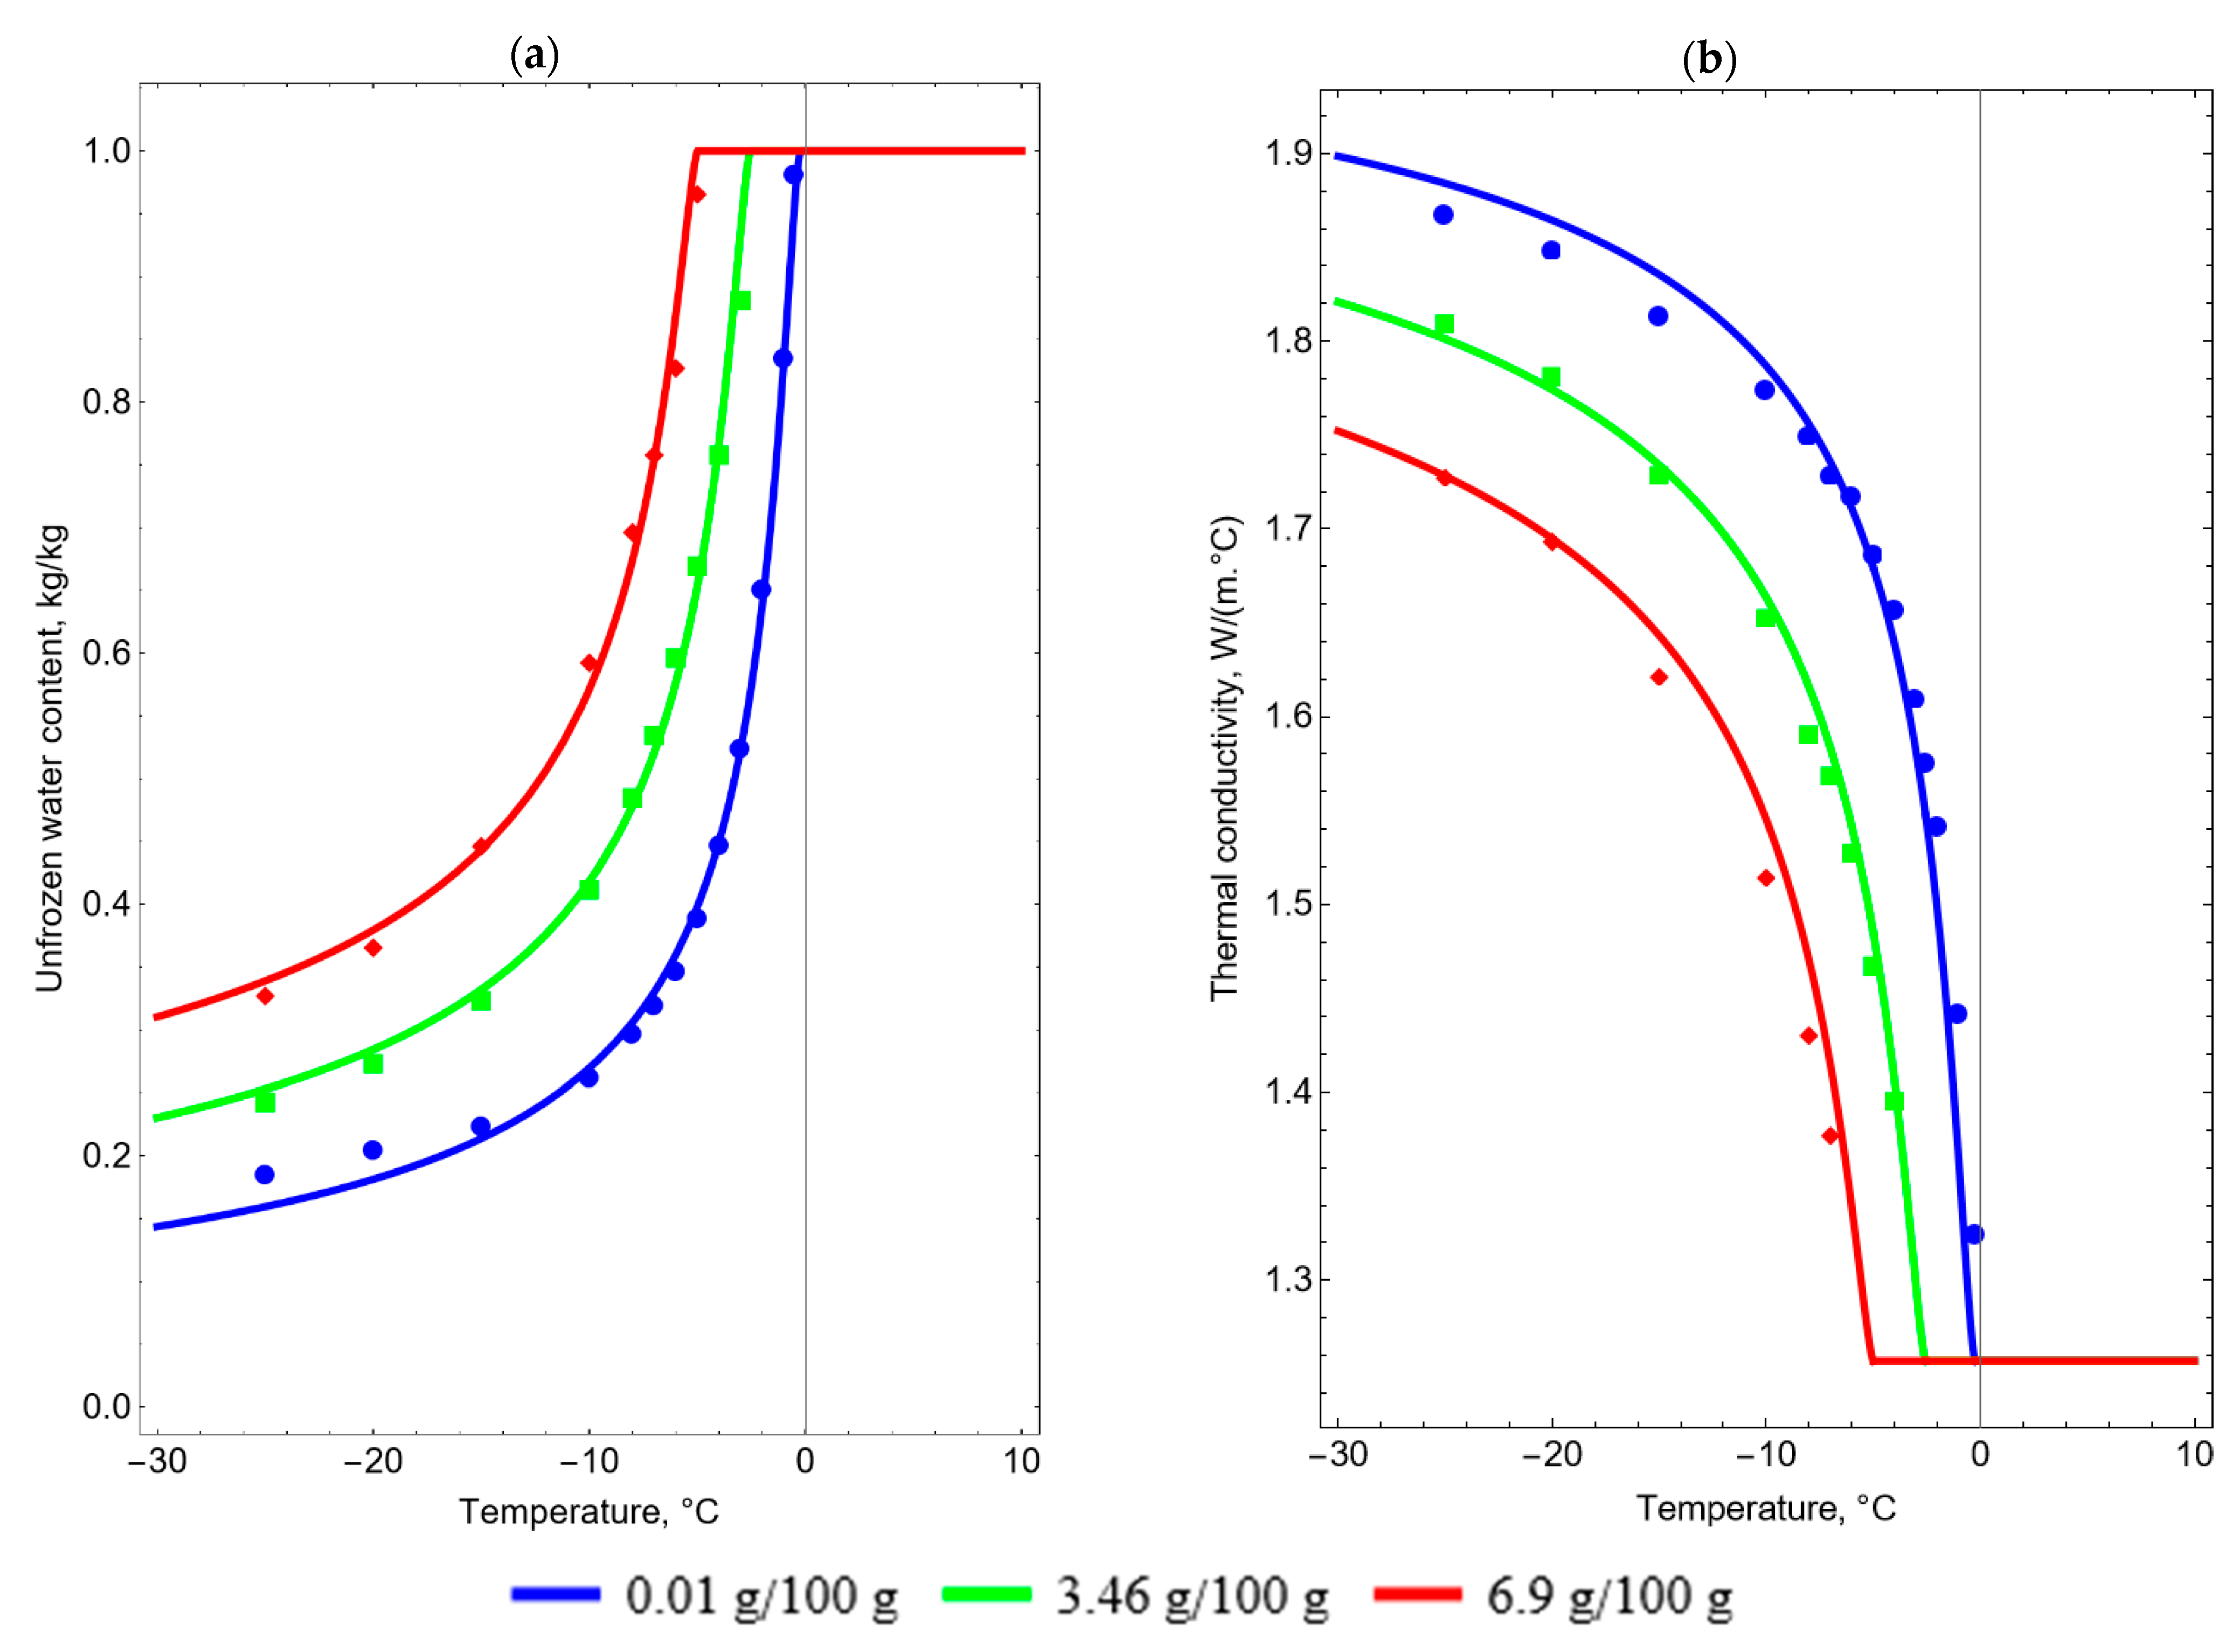
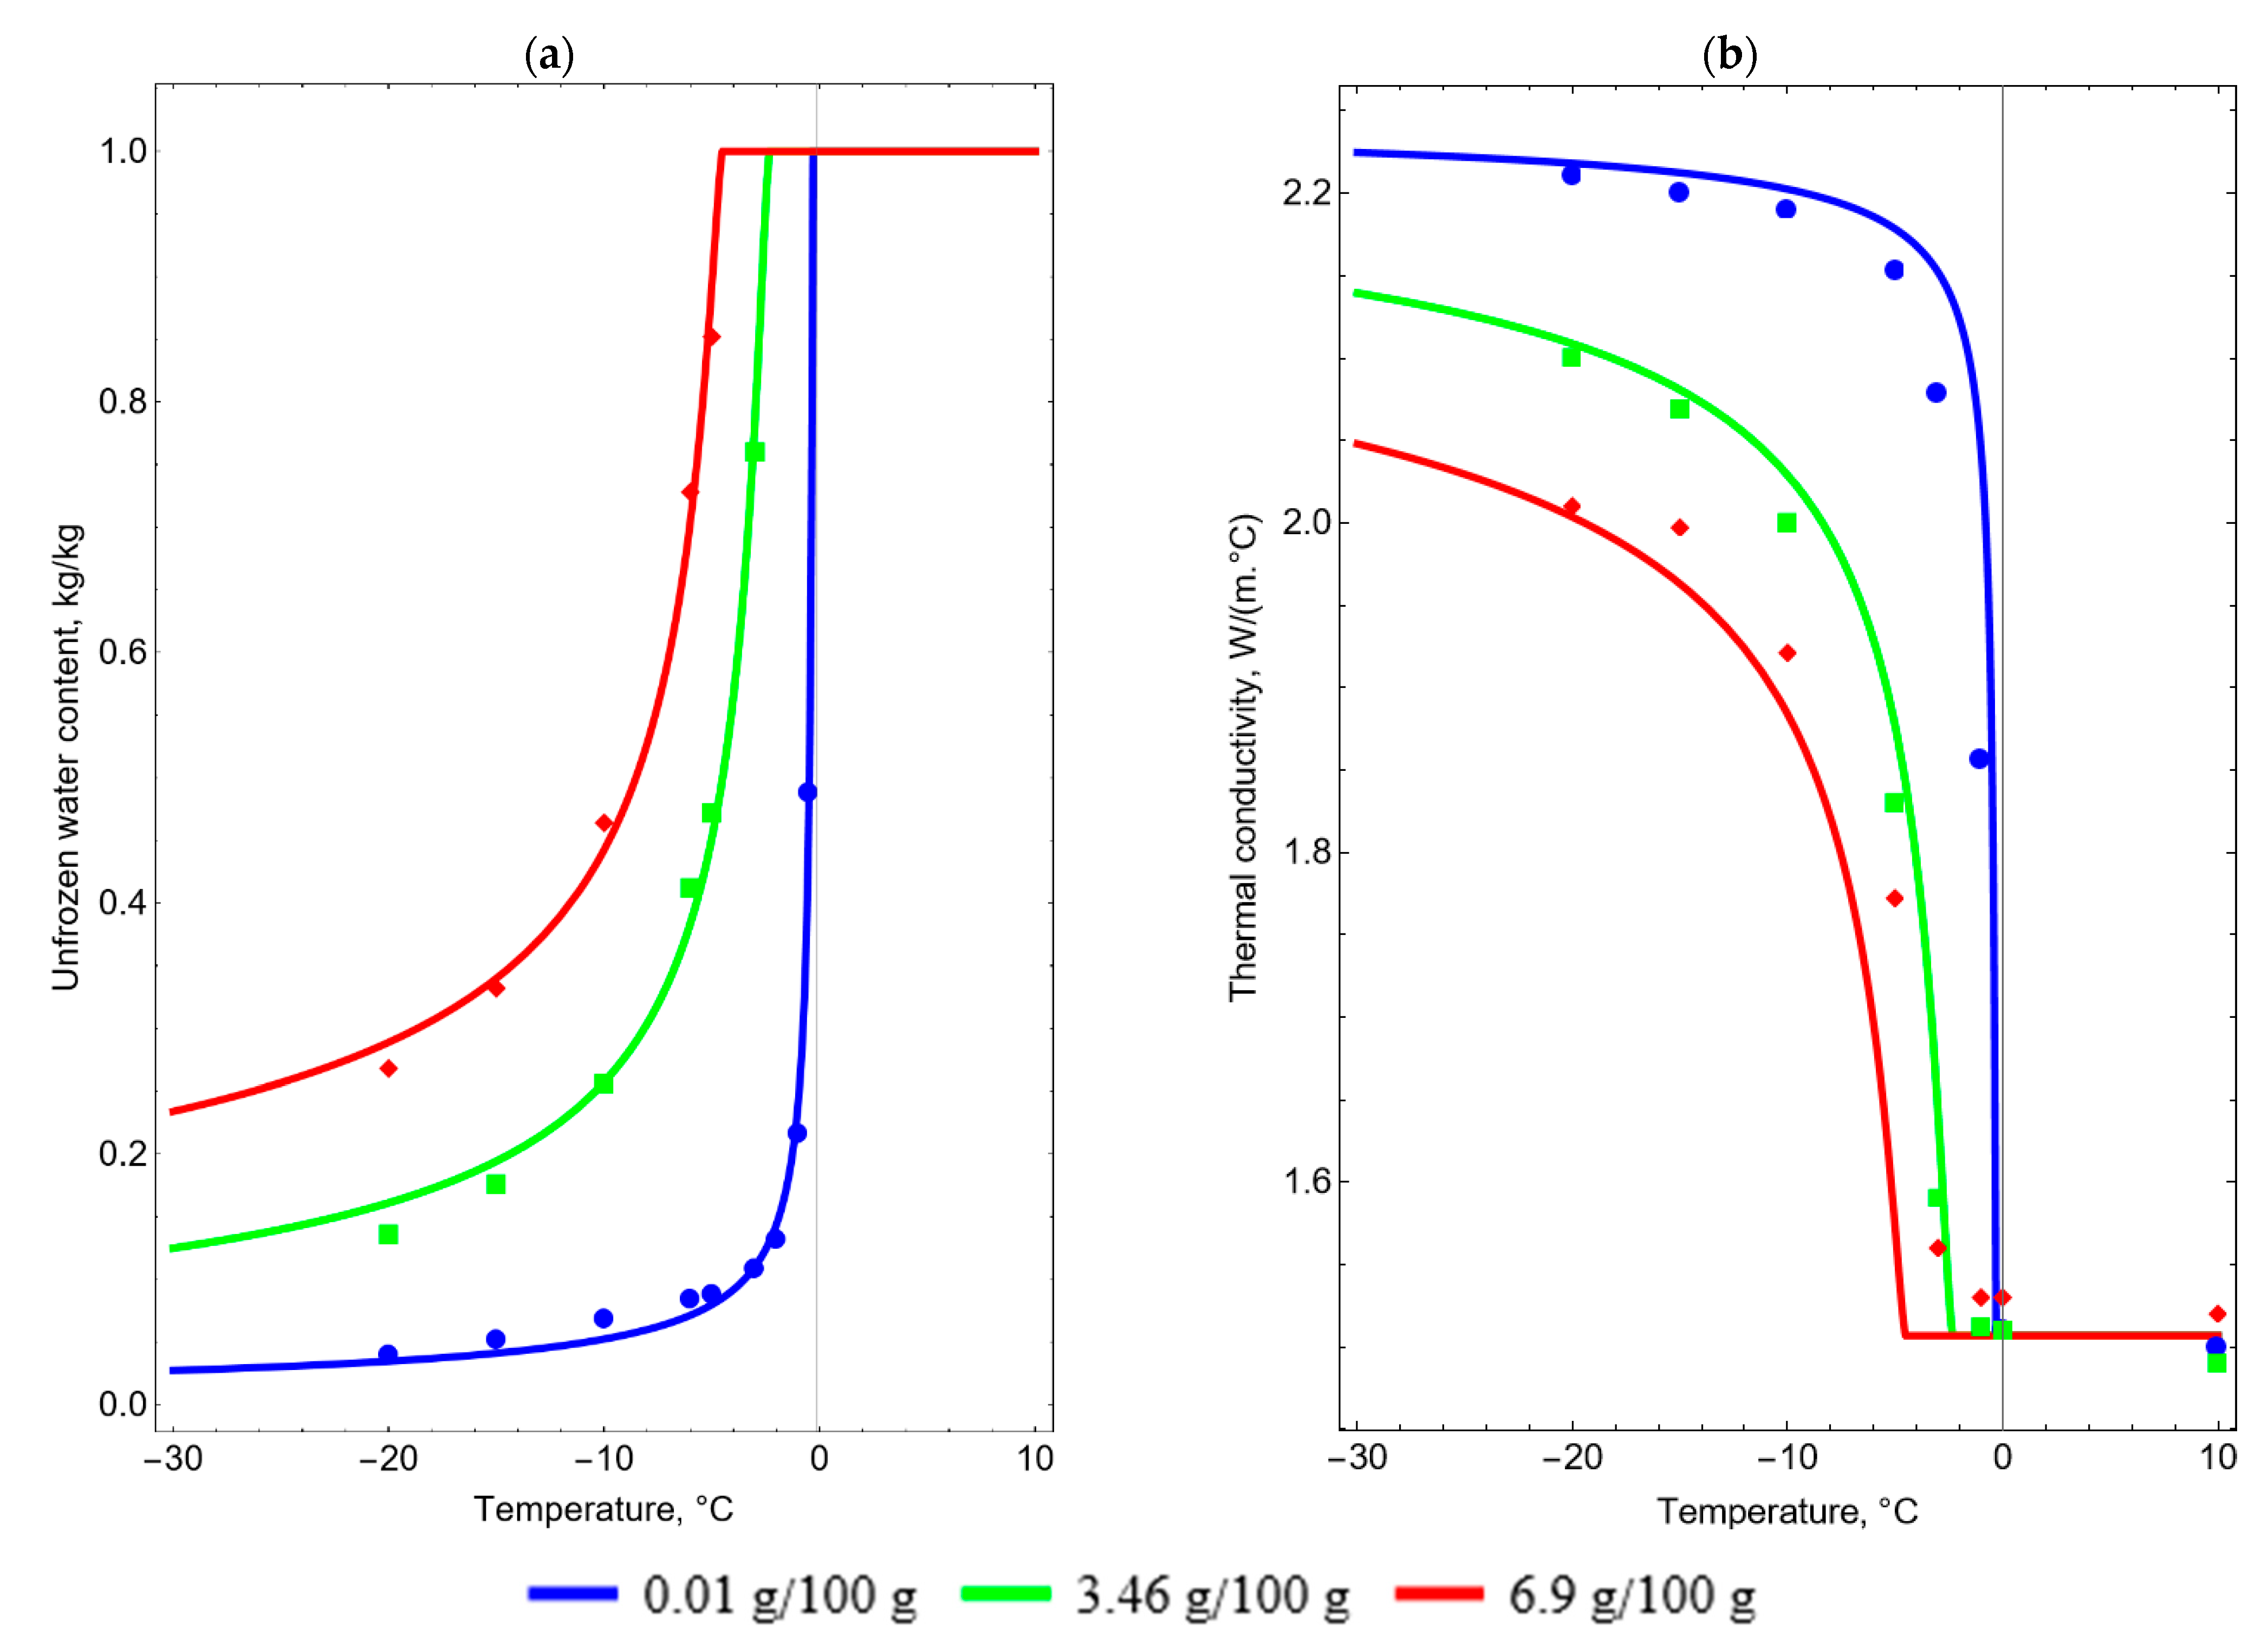
Figure 3, Figure 4 and Figure 5 show the dependencies of Equations (7) and (8) for each type of soil, with superimposed experimental data in the form of markers.
Based on the measurements from Table 1 and measurements processed according to the unfrozen water content and thermal conductivity, the specific heat capacity of the soils was set according to a known dependence [30]:
ρ c p = ( ρ c p ) s ( 1 n ) + n [ ( ρ c p ) l γ + ( ρ c p ) i ( 1 γ ) ] ,
where ρ is the soil density (kg/m3), and c p is the specific heat capacity of the soil at a constant pressure (J/(kg·°C)). Figure 6 shows the obtained dependencies. It was assumed that the density of water/ice is 1000/912 kg/m3 and the specific heat capacity of water/ice is 4200/2100 J/(kg·°C).
The comparison of thermophysical properties of soils in Figure 3, Figure 4, Figure 5 and Figure 6 enabled us to observe the following similarities and differences among them:
  • As the salt concentration increases, all the considered soils exhibit an increase in the amount of unfrozen water, ceteris paribus. In all cases, clay contains the highest proportion of unfrozen water. Even when the salt concentration is nearly zero, clay retains a significant amount of unfrozen water. This fact is clear from the point of view that there is more bound water in clays than in sands and chalk [6,31]. In chalk and sand, a more pronounced reduction in the amount of unfrozen water can be observed with decreasing salt concentration. In a broader sense, it can be noted that freezing water in clay is considerably more challenging than in chalk and sand at any given salt concentration.
  • The impact of salt concentration on the thermal conductivity of all soils under consideration follows the same pattern—an increase in salt concentration leads to a decrease in thermal conductivity. Additionally, clay experiences a smoother decline in thermal conductivity as salt concentration rises, compared to chalk and sand. However, considering chalk, this observation holds true mainly for values close to zero, as the disparity in thermal conductivity between salt concentrations of 3.46 g/100 g and 6.9 g/100 g is noticeably smaller than the difference in thermal conductivity between salt concentrations of 0.01 g/100 g and 3.46 g/100 g.
  • The heat capacity of all soils increases with higher salt concentrations. Similar to the case of thermal conductivity, clay displays a more gradual change in heat capacity in response to changes in salt concentration compared to chalk and sand.
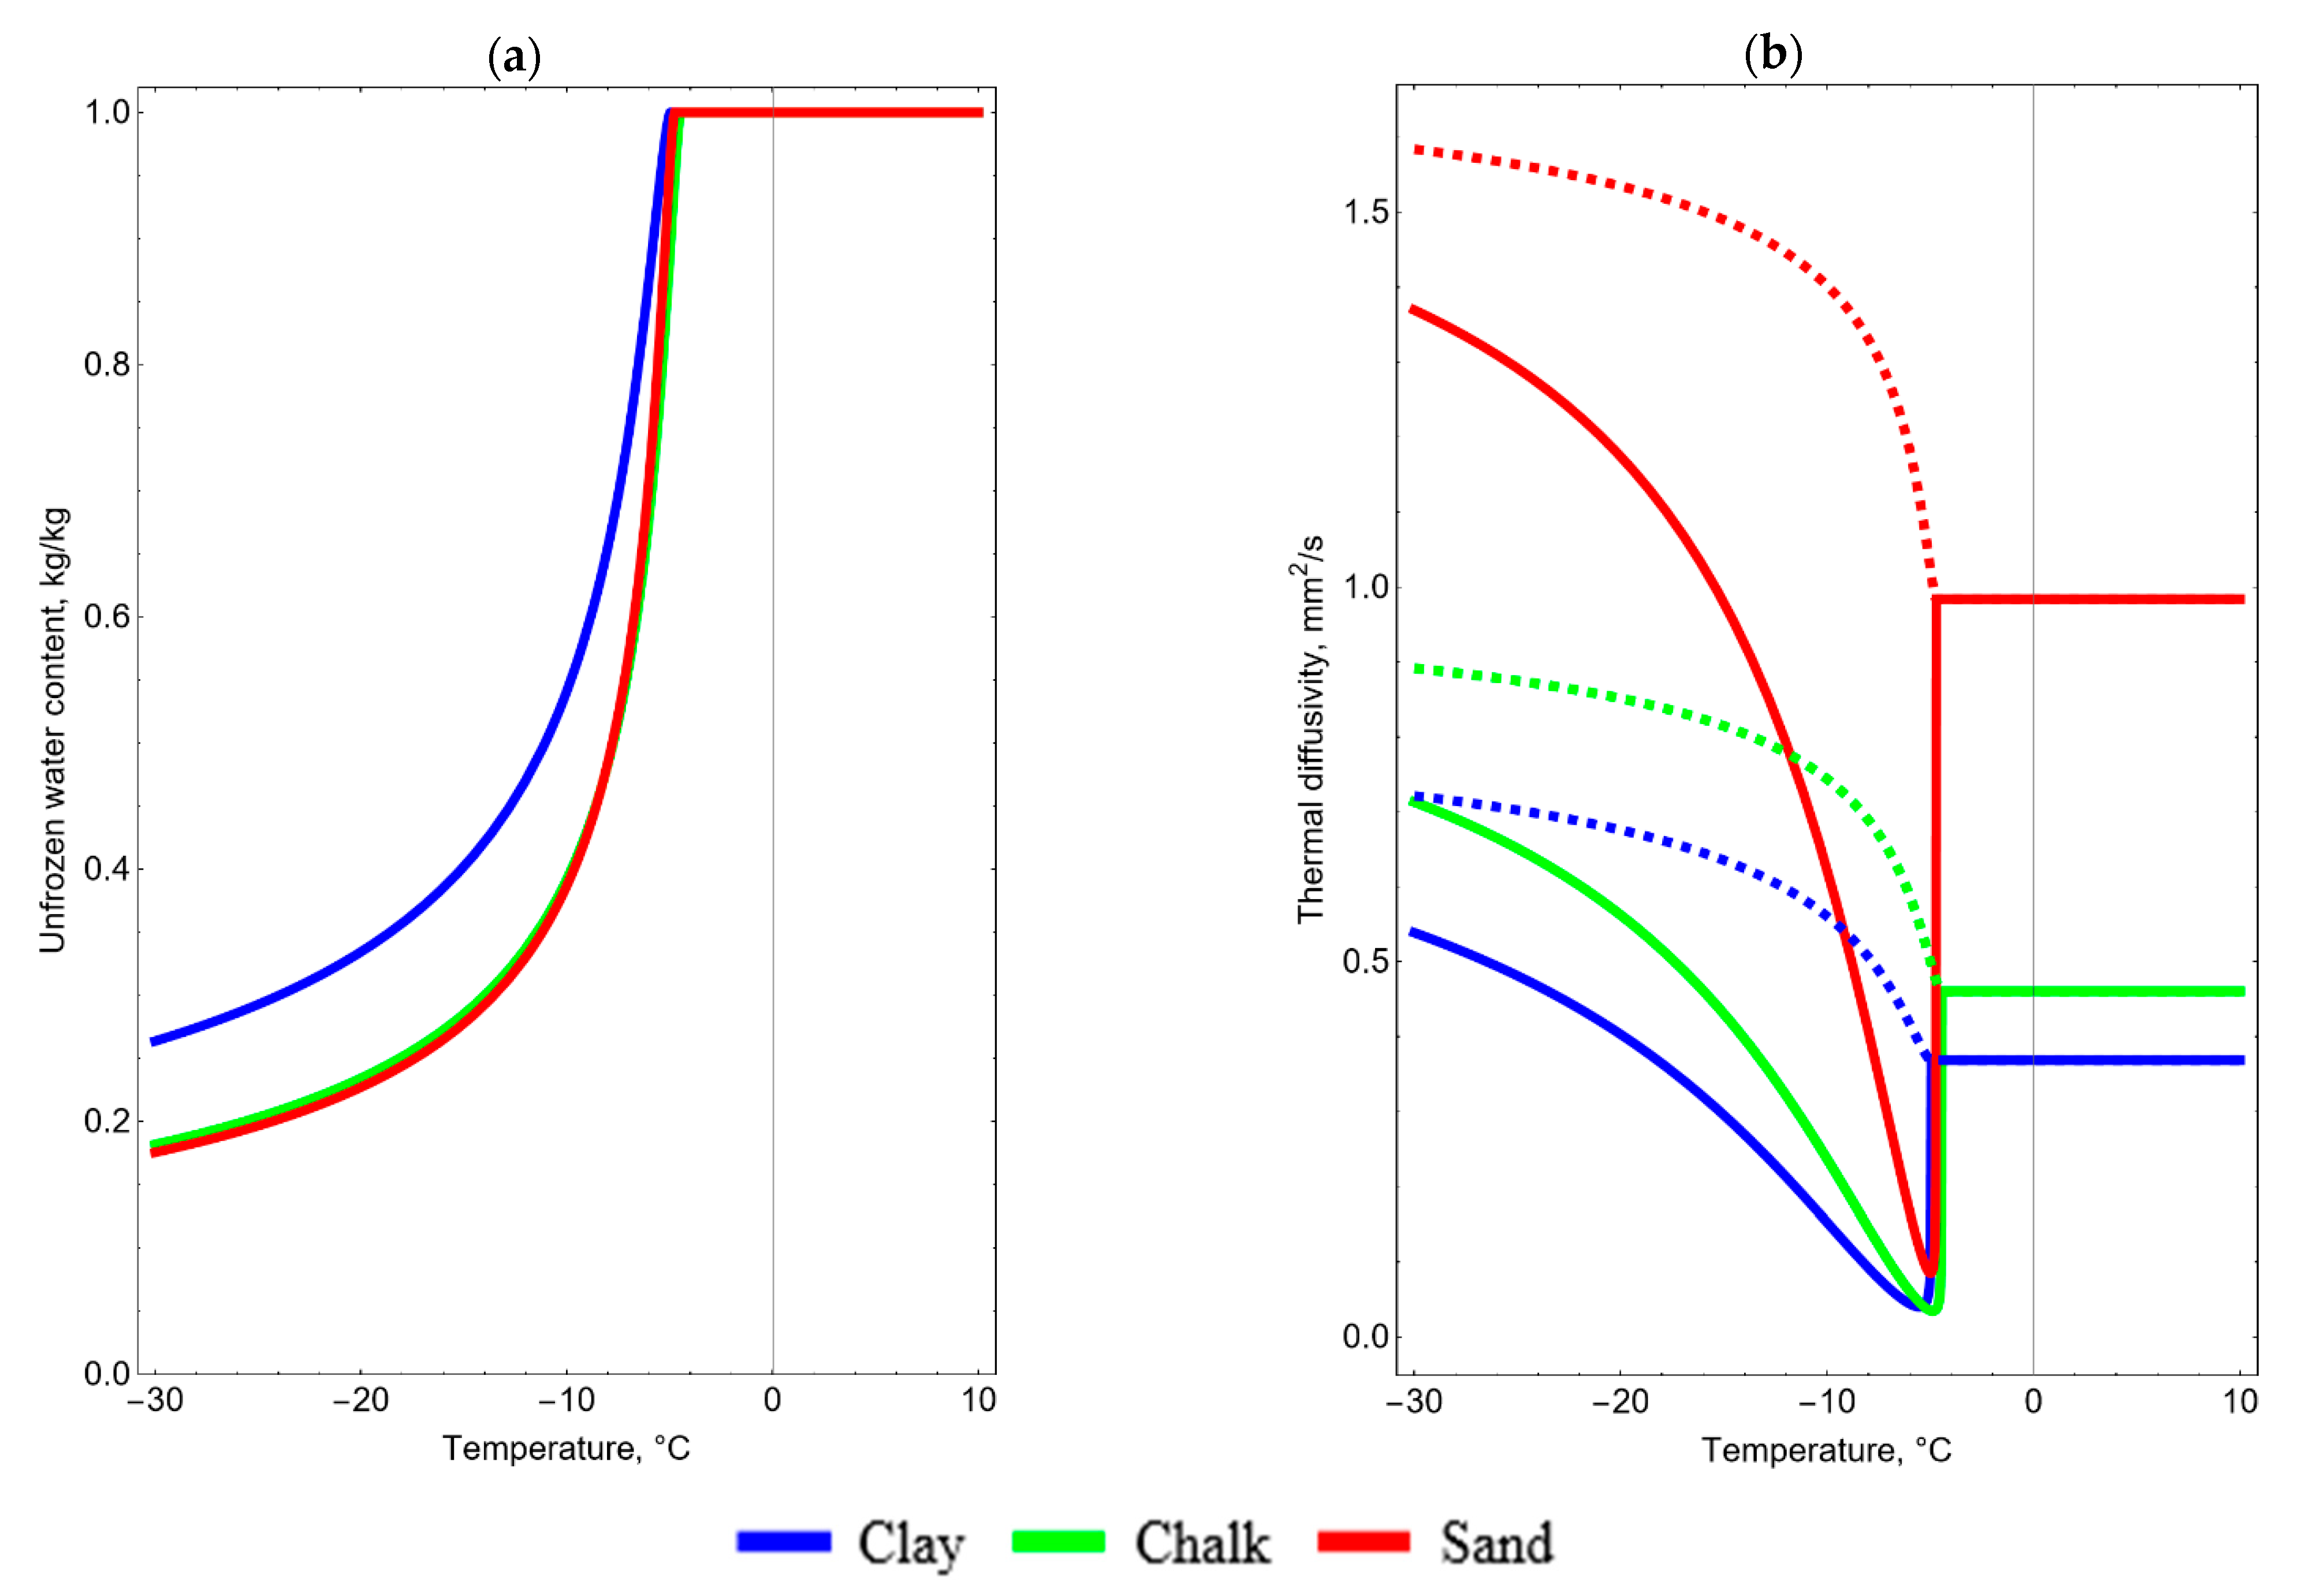
Figure 7 shows the temperature dependencies of the unfrozen water content, the coefficient of thermal conductivity (dashed lines), and the effective heat transfer coefficient (solid lines) for different types of soils at a salinity of 6.9 g/100 g. The difference between the curves makes it possible to understand the soils in which it is easier to freeze water and in which the temperature field changes faster. The effective heat transfer coefficient refers to the ratio of thermal conductivity to the derivative of the specific enthalpy of temperature:
a e f f = λ ( H T ) 1 ,
where a e f f is the effective heat transfer coefficient (m2/c) and H is the specific heat of the soil (J/m3). The specific enthalpy consists of the perceived heat and the latent heat of the phase transition [32]:
H = T r e f T ρ c p d T + ρ w 0 1 + w 0 L γ ,
where T r e f is the reference temperature (°C) and L is the specific heat of the phase transition of water (J/kg). In accordance with [27], the dependence of the specific heat of the phase transition of water can be defined as follows:
L = L 0 + L 0 [ T ( T n o r m 273.15 ) ] ,
L 0 = 333427 ( 1 0.42 c 15.47 c 4.145 + 0.529 c 1.477 ) ,
L 0 = 2458.25 ( 1 0.4524 c 0.79 + 145.824 c 3.56 + 614412 c 10.17 ) ,
T n o r m = 273.1526 ( 1 0.215 c 1.312 c 2.702 20.572 c 6.176 ) ,
where c is the concentration of NaCl solution in the porewater, which is associated with salinity by the following ratio:
c = s ρ w 100 ρ N a C l + s ρ w
where s is the salinity (g/100 g) and ρ N a C l is the NaCl density (kg/m3). The NaCl density is multiplied by 100 to match the salinity unit.
The analysis of the thermodynamic processes using the parameter of effective thermal conductivity allows us to consider the heat jump during the transition through the phase transition. Thus, it is possible to determine the zone where the temperature change due to the heat of the phase transition prevails or is comparable to the conductive heat transfer.
Figure 7 shows that the temperature dependencies of the unfrozen water content for chalk and sand are almost the same. In clay, the curve is higher, and therefore, it is more difficult to freeze the porewater in it. It is noteworthy that the dependencies of the effective heat transfer coefficient on the temperatures for clay and chalk are almost the same, and for sand, the curve is higher. With a decrease in temperature, the difference between the dependencies increases, and at a temperature of −30 °C, the effective heat transfer of sand is three times higher than that of clay or chalk. From this, we can conclude that the process of temperature change occurs faster in sand than in clay or chalk. Chalk, despite having approximately the same amount of porewater as sand (see Figure 7b), has a significantly lower effective heat transfer coefficient because chalk solids have a lower thermal conductivity and a higher specific heat capacity than do sand solids.
It can be seen from Figure 7b that the effective heat transfer drops sharply in all three layers near the freezing temperature of the porewater. This is due to a significant increase in the temperature derivative of the enthalpy at the time of transition through the phase transition boundary.
The dependences of thermophysical parameters on salt concentration and temperature obtained in this section were further used as input parameters for numerical simulation of heat and mass transfer during the formation of FW.

3. Numerical Simulation of Heat and Mass Transfer on the FW Formation

3.1. Mathematical Model

The problem of artificial freezing of the soil volume in the form of a circular cylinder was considered. Freezing was technically accomplished using 39 freeze pipes (see Figure 8a). Geometrically, the pipes were considered as circular cylinders with equal radii, at an equal distance relative to each other, and with zero deviation from the vertical direction. The temperature distribution of the brine moving in the freeze pipes was assumed to be homogeneous. In view of these assumptions, a transition was made from a discrete set of heat sources in the form of freeze pipes to a continuous heat source distributed along the freezing contour (see Figure 8b). This transition was made by specifying a distributed source of heat flux density in the form of the ratio of the total specific heat flux from all pipes to the radius of the freezing contour:
q = α N f r f R f ( T f T ) ,
where q is the heat flux density (W/m2), α is the heat transfer coefficient between the freeze pipes and the soil (W/(m2·°C)), N f is the number of freeze pipes, r f is the radius of the freeze pipes (m), R f is the radius of the freezing contour (m), T f is the temperature on the wall of the freeze pipes (°C), and T is the soil temperature (°C).
It was assumed that the considered soil layers were sufficiently extended in the vertical direction, and therefore, the influence of the vertical heat flows on the temperature field of the median horizontal section of the layers would be negligible over a long period of time. The considered soils were assumed to be homogeneous and isotropic, and heat transfer in them occurs due to thermal diffusion and the convective transport of the porewater. The heat transfer processes between the soil and the freeze pipes were also considered. In addition, the release of latent heat during the phase transition of the porewater was considered. This assumption was made about the local thermodynamic equilibrium of phases at each point of the given cylindrical domain. The effect of supercooling the porewater was not considered.
In view of all the accepted model assumptions, we can say that the problem has angular symmetry, and thermodynamic processes proceed mainly in a radial direction. For these reasons, the problem can be considered using cylindrical coordinates, with its reduction to the one-dimensional case along the radial coordinate. In this case, the transient temperature field in the soil layers is described by the law of energy balance in the following form [32]:
H T T t + 1 r r ( v r H ) = 1 r r ( r λ T r ) ,
where H is the soil specific enthalpy (J/m3), t is the time (s), r is the radial coordinate (m), and v is the vector of groundwater velocity (m/s).
It was assumed that the flow of porewater is plane-radial. This type of flow is typical, for example, in situations when water bulges from the front of the phase transition due to the expansion of freezing water [33]. The Darcy equation was used to simulate porewater flow [34,35]:
v = K k r μ w p = K k r μ w p r r ^ ,
where K is the soil absolute permeability (m2), k r is the soil relative permeability (m2/m2), μ w = 0.001236 Pa·s is the porewater dynamic viscosity, p is the soil density (Pa), and r ^ is the basis vector of the radial coordinate.
The relative permeability depends on the unfrozen water content and is determined through the following ratio [28,29]:
k r = γ [ 1 ( 1 γ 1 m ) m ] 2 ,
The pressure field was calculated based on the assumption of the incompressibility of porewater:
v = K μ w 1 r r ( r k r p r ) = 0 ,
It is worth noting that the calculation of porewater flow was implemented only for the sand layer. For clay and chalk, the flow of porewater was not considered, because these layers are weakly permeable. Thus, the absolute permeability of sand, K , was assumed to be 0.04·10−12 m2.
An important feature of the physical process of freezing saline soil is that only pure water crystallizes, while dissolved salt accumulates in unfrozen water. This process can be mathematically expressed by the following expression:
s = s 0 γ ,
where s 0 is the initial salinity of porewater in an untouched soil mass (g/100 g).
The dissolved salt accumulates in the unfrozen water until the eutectic point is reached [36,37]. After that, the excess salt precipitates. The solution itself (water + salt) in this case is saturated. At the same time, it is also possible to release the additional heat of the phase transition, which, according to estimates [37,38], is 216–235 J per 1 g of the eutectic solution involved in the chemical reaction. In the case of NaCl, the saturated solution has two ways to reach the eutectic point: (1) when salinity reaches 23.2% [37]; or (2) when water with a salt solution freezes to a temperature of −21.2 °C [37]. However, this is true only in the case where water with a salt solution is in an unstressed state. According to [39], it is difficult to reach the eutectic point in porewater, which is in a confined state. For this reason, the process of salt precipitating upon reaching the eutectic point was not considered in the mathematical model.
To calculate the change in salinity over time, Equation (24) was differentiated by time, and the corresponding term was added to the resulting equation to account for the convective transport of porewater:
s t + 1 r r ( v r s ) = s 0 γ 2 γ t ,
The system of Equations (20)–(25) was supplemented by the following initial and boundary conditions:
T | t = 0 = T 0 ,   s | t = 0 = s 0 ,
λ T n | r = R f = q ,
λ T n | r = R 1 = 0 ,   s n | r = R 1 = 0 ,   p | r = R 1 = p 1 ,
T | r = R 2 = T 0 ,   s | r = R 2 = s 0 ,   p | r = R 2 = p 2 ,
where n is the normal vector to the boundary (m); R 1 and R 2 are the internal and external radii of the calculated area (see Figure 9), respectively; and p 1 and p 2 are the pressures at the boundaries of the computational domain (Pa).
For a numerical discretization of Equations (20)–(29) in space, the finite volume method was used [40]; for discretization in time, an explicit Euler [41] with a dynamic time step was used. The computational mesh was uneven, with a decrease near the freeze pipe (see Figure 10). Table 7 shows the main numerical parameters that were further used in the simulation.

3.2. Discussion

Figure 11, Figure 12 and Figure 13 present the results of the simulation of the dependencies of the distributions of temperature, salinity, and unfrozen water content on the initial salinity, S0, for clay, sand, and chalk near the heat source. The results are presented for the final moment in time: 30 days. The dashed vertical line in the figure shows the location of the distributed heat source.
From Figure 11, it can be observed that the initial salinity has a weak effect on the temperature distribution in the clay in the range from 0 to 6.9 g/100 g. At the same time, with an increase in initial salinity, the unfrozen water content increases significantly. That is, clay may contain a significant amount of unfrozen porewater despite the weak dependence of temperature on initial salinity, up to 6.9 g/100 g. It may negatively affect the FW’s strength properties. However, with an increase in the initial salinity to 13.8 g/100 g, the temperature dependence on the initial salinity begins to manifest itself. In this case, with an increase in the initial salinity above 6.9 g/100 g, the temperature begins to decrease. At the same time, the maximum difference between the curves with initial salinities of 6.9 g/100 g and 13.8 g/100 g is 3 °C, which can be considered significant.
It is also worth noting that, since an increase in initial salinity leads to an increase in the unfrozen water content, a natural proportional decrease in relative salinity occurs since the same volume of dissolved salt remains in a larger volume of unfrozen water.
From Figure 11c,d, it can be observed that a significant jump in salinity occurs at the location of the distributed heat source. This is natural because, at the initial moment in time, the temperature of the freeze pipe is rapidly established in the local zone near the heat source. This dramatically reduces the unfrozen water content. As a result, the dissolved salt remains in a smaller unfrozen water content.
For chalk (see Figure 12), one can qualitatively note the same features that were described above for clay. The exceptions are the temperature distributions. For chalk, the effect of the initial salinity on the resulting temperature curves is much stronger and appears earlier than for clay. Figure 12a shows that the temperature curve shifts higher with an increase in the initial salinity from 0.01 g/100 g to 3.46 g/100, but with a further increase in the initial salinity, the temperature curve shifts downward. This can be explained by the fact that an increase in temperature with an increase in salinity is a local effect only for small values of initial salinity. In general, chalk is characterized by a decrease in temperature with an increase in salinity. This is explained by the fact that, if the soil is more saline, then less heat must be removed from the soil to lower its temperature by a given value, Δ T , since less unfrozen water content needs to be frozen. It is worth noting that, in fact, a decrease in temperature with an increase in initial salinity is also characteristic of clay, but this is manifested to a much lesser extent due to more gently sloping curves for unfrozen water content (see Figure 7a).
When comparing the unfrozen water content in clay and chalk, it can be noted that the unfrozen water content near the heat source in chalk is lower than in clay. Therefore, with the same salinity of chalk and clay, it is easier to freeze porewater in chalk.
The case of sand (Figure 13) differs significantly from clay and chalk. First, this is due to the presence of porewater flow. Due to the convective transfer of porewater, the dependence of the temperature distribution on the initial salinity is more pronounced. As in the case of clay and chalk, an increase in temperature can be observed with an increase in initial salinity from 0.01 g/100 g to 3.46 g/100 g, but with a further increase in initial salinity, the temperature decreases significantly. Additionally, in general, it is possible to observe a more complex distribution of temperature, unfrozen water content, and salinity due to the presence of the flow of porewater. For this reason, the design, construction, and monitoring of FWs in highly permeable soils can be complicated because, in this case, there is the problem of selecting a criterion for assessing the thickness of the FW due to a highly asymmetric freezing pattern.
Based on the obtained simulation results, the dependencies of an FW’s thickness on time for all three layers were also determined (see Figure 14 and Figure 15). However, as noted above, in the case of sand, the criterion for estimating the FW’s thickness is complicated due to the asymmetric distribution of the temperature field. For this reason, we considered three FW thicknesses for sand: (1) the thickness of the inner frozen zone (to the left of the heat source), (2) the thickness of the outer frozen zone (to the right of the heat source), and (3) the total FW’s thickness.
It is also worth noting that an FW’s thickness is usually determined by reaching the ground temperature of a certain isotherm. In this case, the FW’s thickness was calculated from the isotherm of the freezing temperature of the porewater. The choice of this isotherm was based on the fact that it directly varies, depending on the amount of salinity, and it allows one to more accurately assess the variation in the FW’s thickness with a change in salinity. If we estimate the FW’s thickness using the constant isotherm, then we can arrive at an erroneous conclusion about the beneficial effect of salinity on an FW’s growth over time. The fallacy lies in the fact that, as has been shown, with an increase in initial salinity, the soil temperature decreases, and, accordingly, the FW’s thickness, as calculated from the constant isotherm, will grow.
Figure 14a shows the expected result for clay; with an increase in initial salinity, the FW’s thickness decreases. However, in the case of chalk (Figure 14b), interesting results can be observed; for cases of initial salinity of 3.46 g/100 g and 6.9 g/100 g, the FW’s thickness practically does not change, and with a further increase in the initial salinity, the FW’s thickness decreases again. This result can be explained by balancing two factors for initial salinities of 3.46 g/100 g and 6.9 g/100 g: a decrease in soil temperature with an increase in salinity, and a decrease in freezing temperature with an increase in salinity. The first factor favorably affects the increase in the FW’s thickness; the second, on the contrary, reduces the FW’s thickness. However, with a further increase in the initial salinity, the second factor begins to prevail, and the FW’s thickness begins to decrease again.
When considering sand (Figure 15), it can be observed that, in the inner frozen zone, the FW’s thickness increases with increasing initial salinity. This is a consequence of the influence of the flow of porewater, due to which the temperature of the sand decreases faster to the left of the heat source than its freezing temperature decreases. However, in the outer frozen zone, where the effect of the flow of porewater is not so great, a similar effect can be observed, as in the case of chalk: the FW’s thickness at the initial salinity of 3.46 g/100 g and 6.9 g/100 g coincides, and with a further increase in salinity, the FW’s thickness decreases. Thus, it can be concluded that the occurrence of the effect of the coincidence of the FW’s thicknesses at different initial salinities is determined not only by the thermophysical properties of the soil and porewater, but also by the presence of the flow of pore water.
It should be noted that in the future, it is planned to test this model in the field when monitoring the AFG of potash mine shafts under construction. It is assumed that the obtained dependencies will allow a much better explanation of the observed features of temperature changes in the control wells. At the same time, experimental data on the real process of freezing of soils with known salinity will help to carry out a full-fledged validation of the model proposed by us.

4. Conclusions

In the course of this work, laboratory and theoretical studies were implemented on the effects of porewater salinity on the artificial freezing of three soils: clay, chalk, and sand.
Conducting laboratory studies made it possible to determine the dependencies of the freezing temperature of porewater, the unfrozen water content, the specific heat capacity, and the thermal conductivity on the salinity of the considered soils. The experimental data obtained were approximated using analytical functions known in the literature. The obtained dependencies were later used for theoretical research: the numerical simulation of the AGF process for the conditions of the construction of the frozen wall around the designed mineshaft at a potash salt deposit.
The analysis of the simulation results shows that, with an increase in the initial salinity, the temperature of the soil decreases because more saline soils contain a larger quantity of unfrozen water content (which was also shown by the simulation results), and, therefore, to lower their temperature by a given amount, less heat must be removed. However, this effect is less pronounced in clay. In addition, for all the soils under consideration, the opposite local effect was noted: at low values of initial salinity, the soil temperature increases. Since this effect manifests itself only at small initial salinities, we can discuss the insignificance of this effect.
The dependence of the FW’s thickness on the initial salinity was found. The thickness was calculated from the isotherm of the freezing temperature of the porewater. The obtained results show that, in the case of clay, a natural process occurs: an increase in initial salinity leads to a decrease in the FW’s thickness since the water’s freezing temperature decreases. In the case of both chalk and sand, it was found that, at certain values of initial salinity, the FW’s thickness becomes independent of the initial salinity. However, with the continued increase in initial salinity, at some point, the FW’s thickness begins to decrease. This can be explained by the fact that, at some values of initial salinity, the two processes are balanced: a decrease in ground temperature leads to an increase in the FW’s thickness, and a decrease in the freezing temperature of porewater leads to a decrease in the FW’s thickness.
The relationships and simulation results acquired in this study hold significant practical importance: they will contribute to the enhancement of existing tools for the design and monitoring of frozen walls under the circumstances involving saline soil layers near the water-protective salt stratum.

Author Contributions

Conceptualization, S.B., M.S., L.L., A.B. and I.D.; methodology, M.S., A.B. and I.D.; software, S.B. and M.S.; validation, S.B., M.S. and L.L.; formal analysis, S.B., M.S. and L.L.; investigation S.B., M.S., L.L., A.B. and I.D.; resources, S.B., M.S., L.L., A.B. and I.D.; data curation, M.S., A.B. and I.D.; writing—original draft preparation, S.B.; writing—review and editing, M.S.; visualization, S.B.; supervision, M.S. and L.L.; project administration, M.S. and L.L. All authors have read and agreed to the published version of the manuscript.

Funding

This research was funded by the Ministry of Science and Higher Education of Russia within the framework of project No. C-26/563.

Institutional Review Board Statement

Not applicable.

Informed Consent Statement

Not applicable.

Data Availability Statement

Not applicable.

Conflicts of Interest

The authors declare no conflict of interest.

References

  1. Trupak, N.G. Ground Freezing in Underground Construction; Nedra: Moscow, Russia, 1974. [Google Scholar]
  2. Nikolaev, P.V.; Shuplik, M.N. Rationale for choosing heat transfer liquid for artificial ground freezing. Min. Informational Anal. Bull. (Sci. Tech. J.) 2016, 1, 320–332. [Google Scholar]
  3. Olkhovikov, Y. Support of Permanent Openings of Potash and Salt Mines; Nedra: Moscow, Russia, 1984. [Google Scholar]
  4. Semin, M.; Levin, L.; Bogomyagkov, A.; Pugin, A. Features of Adjusting the Frozen Soil Properties Using Borehole Temperature Measurements. Model. Simul. Eng. 2021, 2021, 8806159. [Google Scholar] [CrossRef]
  5. Levin, L.; Semin, M.; Parshakov, O. Improving Methods of Frozen Wall State Prediction for Mine Shafts under Construction Using Distributed Temperature Measurements in Test Wells. J. Min. Inst. 2019, 237, 268–274. [Google Scholar] [CrossRef]
  6. Tsytovich, N.A. Mechanics of Frozen Soils; High School: Moscow, Russia, 1973. [Google Scholar]
  7. Semin, M.; Levin, L.; Bublik, S.; Brovka, G.; Brovka, A.; Agutin, K. Parameterization of the Model of Artificial Clay Freezing Considering the Effect of Pore Water Salinity. Fluids 2022, 7, 186. [Google Scholar] [CrossRef]
  8. Banin, A.; Anderson, D.M. Effects of Salt Concentration Changes During Freezing on the Unfrozen Water Content of Porous Materials. Water Resour. Res. 1974, 10, 124–128. [Google Scholar] [CrossRef]
  9. Yong, R.N.; Cheung, C.H.; Sheeran, D.E. Prediction of salt influence on unfrozen water content in frozen soils. Eng. Geol. 1979, 13, 137–155. [Google Scholar]
  10. Lucas, T.; Chourot, J.M.; Bohuon, P.; Flick, D. Freezing of a Porous Medium in Contact with a Concentrated Aqueous Freezant: Numerical Modelling of Coupled Heat and Mass Transport. Int. J. Heat Mass Transf. 2001, 44, 2093–2106. [Google Scholar] [CrossRef]
  11. Liu, J.; Yang, P.; Yang, Z. (Joey) Electrical Properties of Frozen Saline Clay and Their Relationship with Unfrozen Water Content. Cold Reg. Sci. Technol. 2020, 178, 103127. [Google Scholar] [CrossRef]
  12. Aleksyutina, D.M.; Motenko, R.G. The Effect of Soil Salinity and the Organic Matter Content on the Thermal Properties and Unfrozen Water Content of Frozen Soils at the West Coast of Baydarata Bay. Moscow Univ. Geol. Bull. 2016, 71, 275–279. [Google Scholar] [CrossRef]
  13. Qiu, E.; Zhong, C.; Wan, X.; Lu, J.; Chen, H.M.; Pirhadi, N.; Wang, Z.; Chen, Q. Study on Thermal Conductivity Model of Saline Soil Based on Particle Morphology. Heat Mass Transf. 2021, 57, 2029–2043. [Google Scholar] [CrossRef]
  14. Zhang, J.; Lai, Y.; Li, J.; Zhao, Y. Study on the Influence of Hydro-Thermal-Salt-Mechanical Interaction in Saturated Frozen Sulfate Saline Soil Based on Crystallization Kinetics. Int. J. Heat Mass Transf. 2020, 146, 118868. [Google Scholar] [CrossRef]
  15. Lyu, C.; Sun, Q.; Zhang, W. Effects of NaCl Concentration on Thermal Conductivity of Clay with Cooling. Bull. Eng. Geol. Environ. 2020, 79, 1449–1459. [Google Scholar] [CrossRef]
  16. Rong, C.; Sun, S.; Cheng, H.; Duan, Y.; Yang, F. Experimental Study on Temporal and Spatial Evolutions of Temperature Field of Double-Pipe Freezing in Saline Stratum with a High Velocity. Energies 2022, 15, 1308. [Google Scholar] [CrossRef]
  17. Qin, B.; Rui, D.; Wang, S.; Ji, M.; Zou, Z. Experimental Investigation on Formation and Evolution Characteristics of Frozen Wall under Salty Groundwater Seepage. J. Eng. Sci. Technol. Rev. 2020, 13, 99–107. [Google Scholar] [CrossRef]
  18. Calderón, D.S.; Palacio, S.; Ibanez García, S.; Bock, S.H. An Adjusted Analytical Solution for Thermal Design in Artificial Ground Freezing. Int. J. Rock Mech. Min. Sci. 2023, 164, 105310. [Google Scholar] [CrossRef]
  19. Deng, S.; He, Y.; Yang, M.; Zhou, F.; Liu, H.; Zhu, R.; Wan, Z. Numerical Analysis of Shield Tunnelling Breakthrough Working Shaft by Artificial Ground Freezing Method under Extreme Conditions Considering Phase Change Latent Heat. Appl. Sci. 2023, 13, 3651. [Google Scholar] [CrossRef]
  20. Bi, J.; Wu, Z.; Cao, W.; Zhang, Y.; Wen, H.; Yang, S.; Zhang, Q.; Sun, T.; Wei, T. A Hyperbolic Model for the Thermal Conductivity of Freezing Soils. Geoderma 2023, 436, 116507. [Google Scholar] [CrossRef]
  21. Wan, X.; Zhong, C.; Mohamed, H.S.; Qiu, E.; Qu, M.; Nkiegaing, F.J. Study on the Thermal Conductivity Model of Sodium Sulfate Soils. Exp. Heat Transf. 2021, 34, 217–239. [Google Scholar] [CrossRef]
  22. Zhelnin, M.; Kostina, A.; Prokhorov, A.; Plekhov, O.; Semin, M.; Levin, L. Coupled Thermo-Hydro-Mechanical Modeling of Frost Heave and Water Migration during Artificial Freezing of Soils for Mineshaft Sinking. J. Rock Mech. Geotech. Eng. 2022, 14, 537–559. [Google Scholar] [CrossRef]
  23. Tounsi, H.; Rouabhi, A.; Jahangir, E. Thermo-Hydro-Mechanical Modeling of Artificial Ground Freezing Taking into Account the Salinity of the Saturating Fluid. Comput. Geotech. 2020, 119, 103382. [Google Scholar] [CrossRef]
  24. Zhang, X.; Wang, Q.; Yu, T.; Wang, G.; Wang, W. Numerical Study on the Multifield Mathematical Coupled Model of Hydraulic-Thermal-Salt-Mechanical in Saturated Freezing Saline Soil. Int. J. Geomech. 2018, 18, 04018064. [Google Scholar] [CrossRef]
  25. Semin, M.A.; Levin, L.Y.; Zhelnin, M.S.; Plekhov, O.A. Simulation of Artificial Ground Freezing under Conditions of Heterogeneous Mineralization of Pore Water. High Temp. 2022, 60, 391–398. [Google Scholar] [CrossRef]
  26. Brovka, A.G.; Brovka, G.P.; Dedyulya, I.V. The Influence of Salt Concentration in a Detached Water of Claystone-like Clay on the Ground Freezing Point and the Dependence of the Amount of Unfrozen Water on Temperature. In Mining Mechanical Engineering and Machine-Building; JSC «Soligorsk Institute of Resources Saving Problems with Pilot Production»: Soligorsk, Belarus, 2022; pp. 14–23. [Google Scholar]
  27. Rouabhi, A.; Jahangir, E.; Tounsi, H. Modeling Heat and Mass Transfer during Ground Freezing Taking into Account the Salinity of the Saturating Fluid. Int. J. Heat Mass Transf. 2018, 120, 523–533. [Google Scholar] [CrossRef]
  28. Gens, A.; Nishimura, S.; Jardine, R.; Olivella, S. THM-Coupled Finite Element Analysis of Frozen Soil: Formulation and Application. Geotechnique 2009, 59, 159–171. [Google Scholar] [CrossRef]
  29. Zhou, M.M.; Meschke, G. A Three-Phase Thermo-Hydro-Mechanical Finite Element Model for Freezing Soils. Int. J. Numer. Anal. Methods Geomech. 2013, 37, 3173–3193. [Google Scholar] [CrossRef]
  30. Xiao, Z.; Hou, Z.; Zhu, L.; Dong, X. Experimental Investigation of the Influence of Salt on the Phase Transition Temperature in Saline Soil. Cold Reg. Sci. Technol. 2021, 183, 103229. [Google Scholar] [CrossRef]
  31. Tian, H.; Wei, C.; Wei, H.; Zhou, J. Freezing and Thawing Characteristics of Frozen Soils: Bound Water Content and Hysteresis Phenomenon. Cold Reg. Sci. Technol. 2014, 103, 74–81. [Google Scholar] [CrossRef]
  32. Voller, V.R.; Swaminathan, C.R.; Thomas, B.G. Fixed Grid Techniques for Phase Change Problems: A Review. Int. J. Numer. Methods Eng. 1990, 30, 875–898. [Google Scholar] [CrossRef]
  33. Khakimov, K.R. Artificial Freezing of Soils, Theory and Practice: (Voprosy Teorii i Praktiki Iskusstvennogo Zamorazhivaniya Gruntov); Israel Program for Scientific Translations; U.S. Department of Commerce: Washington, DC, USA; Clearinghouse for Federal Scientific and Technical Information: Springfield, VA, USA, 1966. [Google Scholar]
  34. Neuman, S.P. Theoretical Derivation of Darcy’s Law. Acta Mech. 1977, 25, 153–170. [Google Scholar] [CrossRef]
  35. Heinemann, Z.E. Fluid Flow in Porous Media; Springer-Verlag: Berlin/Heidelberg, Germany, 2005; pp. 337–362. [Google Scholar]
  36. Wang, M.; Zhu, Y.; Zhao, T.; Cui, L.; Mao, W.; Ye, M.; Wu, J.; Yang, J. Chemical Characteristics of Salt Migration in Frozen Soils during the Freezing-Thawing Period. J. Hydrol. 2021, 606, 127403. [Google Scholar] [CrossRef]
  37. Leys, J.; Losada-Pérez, P.; Glorieux, C.; Thoen, J. The Melting Behaviour of Water and Water–Sodium Chloride Solutions Studied by High-Resolution Peltier-Element-Based Adiabatic Scanning Calorimetry. J. Therm. Anal. Calorim. 2017, 129, 1727–1739. [Google Scholar] [CrossRef]
  38. Han, B.; Choi, J.; Dantzig, J.; Bischof, J. A Quantitative Analysis on Latent Heat of an Aqueous Binary Mixture. Cryobiology 2006, 52, 146–151. [Google Scholar] [CrossRef]
  39. Koniorczyk, M.; Bednarska, D. Kinetics of Water Freezing from Inorganic Salt Solution Confined in Mesopores. Thermochim. Acta 2019, 682, 178434. [Google Scholar] [CrossRef]
  40. Moukalled, F.; Mangani, L.; Darwish, M. The Finite Volume Method in Computational Fluid Dynamics: An Advanced Introduction with OpenFOAM® and Matlab; Fluid Mechanics and Its Applications; Springer International Publishing: Cham, Switzerland, 2016; Volume 113, ISBN 978-3-319-16873-9. [Google Scholar]
  41. Atkinson, K.E.; Han, W.; Stewart, D. Numerical Solution of Ordinary Differential Equations; Pure and Applied Mathematics; Wiley: Hoboken, NJ, USA, 2009; ISBN 978-0-470-04294-6. [Google Scholar]
Figure 1. Scheme of the frozen wall (a) and an example of the location of control boreholes in a transverse horizontal section (b).
Applsci 13 10016 g001
Figure 2. Dependence of the freezing temperature of porewater on salinity. (Experimental measurements are indicated by dots.)
Applsci 13 10016 g002
Figure 3. Dependence of the unfrozen water content (a) and the thermal conductivity (b) on temperature and salinity for clay.
Applsci 13 10016 g003
Figure 4. Dependence of the unfrozen water content (a) and the thermal conductivity (b) on temperature and salinity for chalk.
Applsci 13 10016 g004
Figure 5. Dependence of the unfrozen water content (a) and the thermal conductivity (b) on temperature and salinity for sand.
Applsci 13 10016 g005
Figure 6. Dependencies of specific heat capacity on temperature and salinity for clay (a), chalk (b), and sand (c).
Applsci 13 10016 g006
Figure 7. Dependencies of the unfrozen water content (a) and the effective heat transfer coefficient (b) of soils on the temperature for clay, chalk, and sand at a salinity of 6.9 g/100 g.
Applsci 13 10016 g007
Figure 8. Part of the computational domain with a discrete set of heat sources: with freeze pipes (a) and with a distributed heat source (b).
Applsci 13 10016 g008
Figure 9. Schematic representation of boundary conditions.
Applsci 13 10016 g009
Figure 10. Schematic representation of the computational mesh.
Applsci 13 10016 g010
Figure 11. Distribution of temperature (a), unfrozen water content (b), salinity (c), and relative salinity (d) for clay.
Applsci 13 10016 g011aApplsci 13 10016 g011b
Figure 12. Distribution of temperature (a), unfrozen water content (b), salinity (c), and relative salinity (d) for chalk.
Applsci 13 10016 g012
Figure 13. Distribution of temperature (a), unfrozen water content (b), salinity (c), and relative salinity (d) for sand.
Applsci 13 10016 g013aApplsci 13 10016 g013b
Figure 14. The dependence of the FW’s thickness on time for clay (a) and chalk (b).
Applsci 13 10016 g014
Figure 15. The dependence of the FW’s thickness on time for sand in the inner frozen zone (a) and in the outer frozen zone (b), and on the total thickness (c).
Applsci 13 10016 g015aApplsci 13 10016 g015b
Table 1. Experimental measurements of soil density and specific heat capacity of dry skeleton.
SoilSoil Density (kg/m3)Specific Heat Capacity of Dry Skeleton (J/(kg·°C))
Clay2070757
Chalk1985798
Sand1730692
Table 2. Experimental measurements of the dependence of the freezing temperature of porewater on the NaCl content.
SoilNaCl (g/100 g)Moisture (kg/kg)Freezing Temperature (°C)
Clay0.000.26−0.23
3.46−2.55
6.90−5.00
Chalk0.000.25−0.30
3.46−2.31
6.90−4.51
Sand0.000.11−0.09
5.20−3.59
Table 3. Experimental measurements of the dependence of the unfrozen water content on temperature and salinity.
Temperature (°C)Soil
ClayChalkSand
NaCl (g/100 g)
0.003.466.900.003.466.900.005.20
Unfrozen Water Content (kg/kg)
−0.50.981--0.488--0.168-
−1.00.835--0.216--0.080-
−2.00.650--0.132--0.053-
−3.00.5230.881-0.1080.760---
−4.00.4460.758-----0.779
−5.00.3880.6690.9650.0880.4720.8520.0440.628
−6.00.3460.5960.8270.0840.4120.728-0.531
−7.00.3190.5350.758----0.460
−8.00.2960.4850.696----0.407
−10.00.2620.4120.5920.0680.2560.464-0.327
−15.00.2230.3230.4460.0520.1760.3320.0350.239
−20.00.2040.2730.3650.0400.1360.268-0.195
−25.00.1850.2420.327---0.0350.177
Table 4. Experimental measurements of the dependence of the thermal conductivity on temperature and salinity.
Temperature (°C)Soil
ClayChalkSand
NaCl (g/100 g)
0.003.466.900.003.466.900.005.20
Thermal Conductivity (W/(m·°C))
20------1.841.87
101.101.1041.121.501.491.52--
0---1.511.511.53--
−11.441.1041.121.861.511.532.181.87
−21.541.101.12-----
−31.611.131.122.081.591.562.381.87
−41.661.401.12-----
−51.691.471.122.151.831.77--
−61.721.531.13---2.512.17
−71.731.571.38-----
−81.751.591.43-----
−101.771.651.512.192.001.922.572.30
−151.811.731.622.202.071.992.592.37
−201.851.781.692.212.102.012.602.42
−251.871.811.73-----
Table 5. Parameters of the approximate dependence of the unfrozen water content.
SoilNaCl (g/100 g)
0.003.465.206.900.003.465.206.90
ω (°C) m
Clay1.001.23-1.390.360.32-0.29
Chalk0.060.72-0.850.370.36-0.30
Sand0.01-0.51-0.64-0.70-
Table 6. Porosity, specific heat capacity, and thermal conductivity of solid soil particles.
SoilPorosityThermal Conductivity (W/(m·°C))
Clay0.541.95
Chalk0.502.27
Sand0.202.75
Table 7. Basic numerical parameters.
ParameterDimensionValue
Geometry and computational mesh
Radius, R 1 m0.1
Radius, R 2 m25
Radius of the freezing contour, R f m7.7
The characteristic value of the computational mesh around the freeze pipem0.0025
Radius of the freeze pipe, r f m0.073
The ratio of the size of neighboring computing volumes%10
Initial and boundary conditions
Simulation timeday30
Temperature of the untouched soil, T 0 °C10
Temperature on the wall of the freeze pipe, T f °C−30
Heat transfer coefficient, α , between the freeze pipe and the soilW/(m2·°C)150
Pressure, p 1 MPa0
Pressure, p 2 MPa1.79
Disclaimer/Publisher’s Note: The statements, opinions and data contained in all publications are solely those of the individual author(s) and contributor(s) and not of MDPI and/or the editor(s). MDPI and/or the editor(s) disclaim responsibility for any injury to people or property resulting from any ideas, methods, instructions or products referred to in the content.

