1. Introduction
Enhancing the data to highlight key aspects is one of the main goals in the analysis of aeromagnetic data. In addition to providing information on lithological changes and structural trends, aeromagnetic prospecting also defines lateral changes in susceptibility contrast. Gradients themselves can be used to infer the properties of subsurface structures.
From a mining point of view, the Bou Azzer inlier hosts two important mines: the cobalt mine of Bou Azzer associated with the ophiolitic complex whose mineralization is in the form of lenses and veins, and the mine of Bleïda marked by the presence of significant copper indices in the form of lenses.
Aeromagnetic data are analysed using gradient tensor and other operators to identify many positions of the geological borders. The greatest amplitudes like horizontal gradients which can be replaced by horizontal components of gradient tensor were employed by [
1] with the intention of identifying geologic near-vertical borders from aeromagnetic anomalies. The boundaries displayed the highest values signifying sharp disparities in lateral susceptibility. Gradiometers have enabled the recent ability to conduct measurements of all the tensor elements. For the purpose of distinguishing structural characteristics from potential field gradient tensor data, many mapping approaches have been devised. Researchers in [
2] calculated the gravity–magnetic tensor invariants across a sophisticated model simulating a basement surface with both horizontal and vertical faults.
In the interest of estimating source depth, ref. [
3] demonstrated that the greater negative eigenvalue is analogous to the greatest negative bend acquired from typical potential field anomalies. Geologic contacts were identified [
4] by means of the horizontal gravity–magnetic gradient tensor. Horizontal gravity gradients that have been seen or calculated from magnetic data are used to define the eigenvalues of the Hessian matrix in [
5,
6,
7] as described by a linear feature analysis. Refs. [
8,
9] imaged subsurface geology using invariants derived from horizontal gravity gradient components.
A method for using the gravity–magnetic gradient tensor was developed by [
8]. According to [
10], the eigenvector of the entire tensor gravity–magnetic gradient matrix that corresponds to the least eigenvalue may be used to predict the striking direction of quasi 2D entities. According to [
11], the sub-vertical plugs, dikes, or diatremes connected to alkaline encroachments are imaged by the rotational and horizontal invariants of the gravity–magnetic gradient tensor. The different tensor components were merged into invariants by [
12], who also specified information on geologic contact and body shape.
To identify the margins of anomalous sources, we compute and map strike lineaments (θ) using processed rotational invariants (I0, I1, I2) and horizontal invariants (Ih1, Ih2). This technique was used to construct the gradient tensor of the aeromagnetic data from Bou Azzer.
2. Geological Background
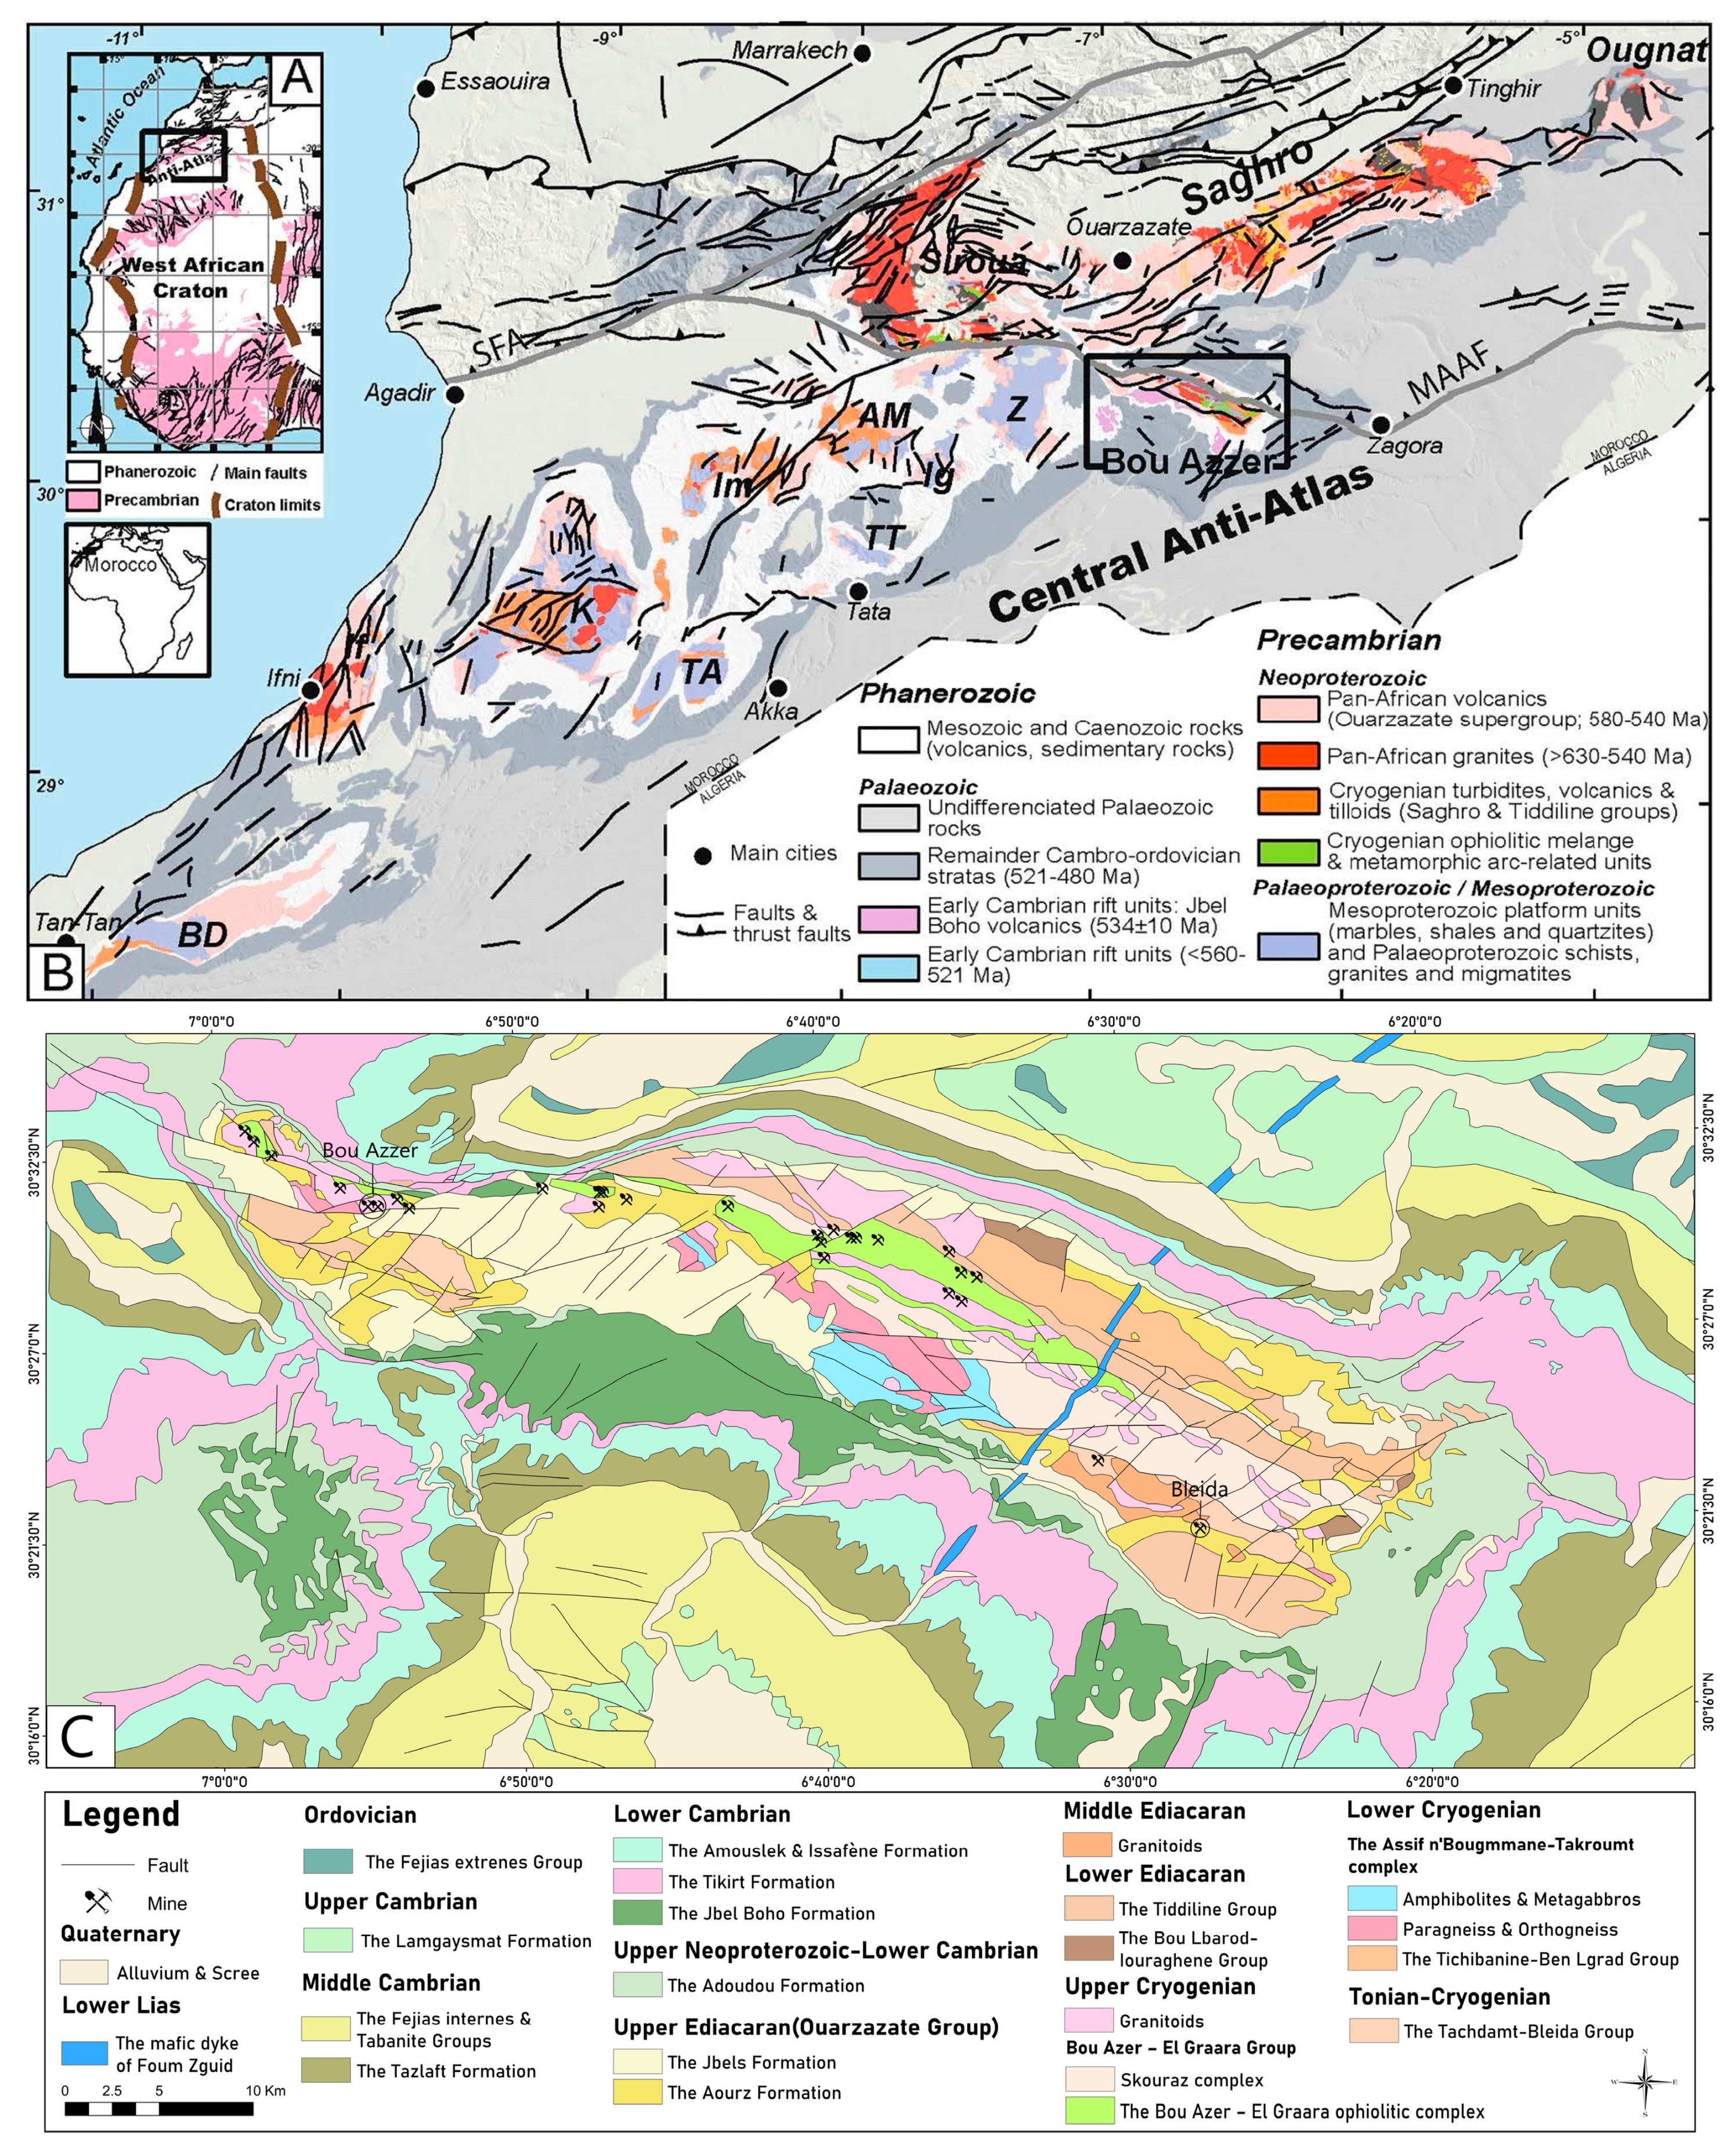
The Bou Azzer-El Graara Inlier (BAEI) (
Figure 1A–C) is linked with two nearby depressions, Bou Azzer then El Graara, situated 45 km southwest of Ouarzazate city. It spreads approximately 20 km from Taznakht to Bleïda in a WNW-ESE direction. The Tissoukine and Tasla synclines surround it from the north and south, respectively. The BAEI was formed during the excavation of the Anti-Atlas Major Accident (AAMA), representing an amount of the earliest Pan-African seams.
In the southern inlier part, the Tachdamt-Bleïda Set, it is thought that remains of the Tonian platform came into existence on the northern border of the West African Craton (WAC). Based on recent tectonic and lithological classifications along with newly acquired geochronological information, it encompasses the most ancient rock formations within the BAEI. During this period of rifting, there is a distinctive emission of tholeiitic to alkaline basalts, initially approximated at 788 ± 10 Ma and more lately, around 883 Ma [
13].
The Assif n’Bougmmane-Takroumt complex’s metamorphic rock formations stretch from west-northwest to east-southeast. These formations create separate elevated areas in Bou Azzer, Tazigzaout, Oumlil, and the primary elevated region of the Bougmmane massif situated in the Takroumt region, located north of the Tachdamt-Bleïda group. These metamorphic rocks were previously thought to belong to the Paleoproterozoic (PI) basement. However, recent geochronologic data suggest that they are younger and are now attributed to Cryogenian dates [
14,
15].
Figure 1.
The location of the studied area (Bou Azzer inlier) at (
A) The West African Craton level modified after [
16] and (
B) at the Anti-Atlas level modified after [
16]. (
C) Geological map of the study area modified after [
15].
Figure 1.
The location of the studied area (Bou Azzer inlier) at (
A) The West African Craton level modified after [
16] and (
B) at the Anti-Atlas level modified after [
16]. (
C) Geological map of the study area modified after [
15].
They consist of amphibolites, metagabbros, augen gneiss, and micaschists in their lithology [
15]. The protoliths of these rocks have geochronological dates ranging between 730 million years and 752 million years ago within the Tazigzaout Complex [
17], and from 745 million years to 755 million years ago in both the Bou Azzer massif and the Oumlil massif [
15]. Furthermore, there are extra geological characteristics, including a mafic intrusion within the Bougmmane Complex established 700 million years ago, along with two veins of micas leucogranodiorite in the Tazigzaout massif, dated at 705 million years ago and 701 million years ago [
18], and another at 695 Ma in the Oumlil massif, which all cross-cut these rocks [
15]. These findings suggest that an orthogneissification event occurred earlier than 700 Ma during the Lower Cryogenian period.
Similarly, to the northeastern side of the BAEI, within the Tichibanine-Ben Lgrad area, one can find rocks formed from volcanic arcs, including rhyolites, microgabbros and basalts, alongside volcano-sedimentary formations like cinerites, sandy siltstones, dacite and felsic tuffs. The dating of the dacite and felsic tuffs, using U/P on zircon, reveals ages of 767 million years and 761 million years, respectively [
19].
Ref. [
20] was the first to characterize the famed Neoproterozoic supracrustal ophiolite found at BAEI. It is composed of ophiolite slices from ultramafic to mafic, connected to mélanges of volcanic sediments that have been invaded by intrusions related to subduction [
21]. Ultramafic cumulates of wehrlites, harzburgites and dunite lenses, and clinopyroxenolites, a crustal gabbroic unit’s section, basaltic pillow lavas a complex of sheeted dykes are all parts of the BAO series. The BAO and the Khzama orb in the Siroua window are examples of the pan-African oceanic lithosphere, which was thrust onto the northern boundary of the WAC (West African Craton) as stated in reference [
22]. Its precise age remains a topic of debate despite various speculative indirect estimates [
16].
However, the Khzama plagiogranite within the Siroua ophiolite provides the most accurate age estimation for the Central Anti-Atlas ophiolite, pinpointing it at 762 million years old [
23]. Around 660 Ma to 640 Ma, a series of quartz diorite intrusions (located in the Bou Azzer massifs, Ousdrat, Taghouni, Ait Ahmane and Bou Frokh) intruded Cryogenian rocks in the Bouazzer region. These intrusions occurred during the Pan-African paroxysm, characterized by sinistral deformation [
24].
The Bou Azzer-El Graara Cryogenian foundational layer is covered by non-metamorphic clastic and volcanic deposits from the Ediacaran period in an unconformable manner. The lower units encompass the Tiddiline and Bou Lbarod-Iouraghene Groups, formed approximately 625 million years ago, primarily consisting of andesite and ignimbrite within an active margin setting. Additionally, the age of Tiddiline deposits, defined by fault boundaries and interspersed with rhyolitic layers, date back 606 million years. Before the deposition of the 580 million year old Bleïda granodiorite in a later Pan-African transpressional event, the Tiddiline deposits experienced uplift and folding [
25].
The Ouarzazate Group, a large volcano-sedimentary post-collisional complex, corresponds to the Upper Ediacaran period [
15]. Within this time frame (580–570 million years ago), the Aourz geological background dominate with volcanic ignimbritic facies having a dacitic-rhyolitic formation, and the Jbels composition is branded by alternating andesitic rhyolites-ignimbrites and flows.
Above the Late Ediacaran Ouarzazate Group, there is a paraconformable overlay of rich-carbonate Adoudou composition. Taroudant Set, representing a transgressive unit from the Early Paleozoic to Late Proterozoic, comprises several marine deposits. Concurrently, the volcanic complex at Jbel Boho, known as Alougoum, was assigned an age ranging between 529 million years and 531 million years [
26]. The Paleozoic succession persists with the Tata Group during the Cambrian period, succeeded by the internal Feijas, Tabanit, external Feijas, first and second Bani, as well as Ktaoua transgression groups spanning from the Cambrian to the Ordovician era.
Understanding the Mesozoic and Cenozoic evolution of the Anti-Atlas region is limited by the absence of relevant sedimentary successions. The Anti-Atlas has experienced the influence of various Lower Liassic mafic dykes aligned in a northeast-southwest direction, which are associated with the CAMP magmatic event, signifying the breakup of Pangea during the Triassic-Jurassic transition. Notably, the Foum Zguid dyke, which crosses the BAEI, stands out as the most prominent of these dykes.
The present Anti-Atlas topography emerged during the Neogene period, coinciding with the High Atlas uplift, following several burial and exhumation phases [
27].
3. Material and Methods
3.1. Description of the Aeromagnetic Data
This study made use of geophysical data acquired during a comprehensive survey of Morocco, conducted by Canadian Fugro Airborne Surveys Corporation for MMETSD between October 1998 and May 1999 [
28]. The survey was an integral component of the National Geological Mapping Project, encompassing the entire Anti-Atlas region.
The latter refers to a comprehensive initiative with two primary objectives: first, to enhance searching for minerals in the Anti-Atlas area, which stands out as one of the most important metallogenic regions in Morocco, and second, to consolidate geoscientific databases. The study made use of a high-resolution data collection generated from an aerial geophysical survey on the part of providing accurate structural and geology cartography of the research region. Specifically, this research focuses on aeromagnetic data obtained from a rectangular region measuring 40 km by 69 km surrounding the BAEI (
Figure 1). The data were captured using an optically pumped cesium vapor magnetometer that operates using pumping, featuring a level of sensitivity of 0.01 nT, and a data collection frequency of 10 samples per second was applied.
For the airborne magnetic survey, the N30° E flying path was utilized, set apart at intervals of 500 m. The magnetic sensor’s height above the terrain was set to approximately 30 m, and the tie lines were perpendicular with N120° E direction, a spacing of 4000 m. These parameters allowed for the collection of a substantial amount of magnetic field data, covering a total distance of 5700 km. As an advantage of these survey settings, a high-resolution aeromagnetic survey of the research region was effectively conducted. The preliminary handling of the unprocessed data involved standard levelling, noise reduction, diurnal adjustment, and other essential steps.
The contractor performed the gridding of the magnetic data using the minimal curvature technique, yielding a standardized square grid with a grid spacing of 250 m (half of the line interval, regardless of the data sampling rate) [
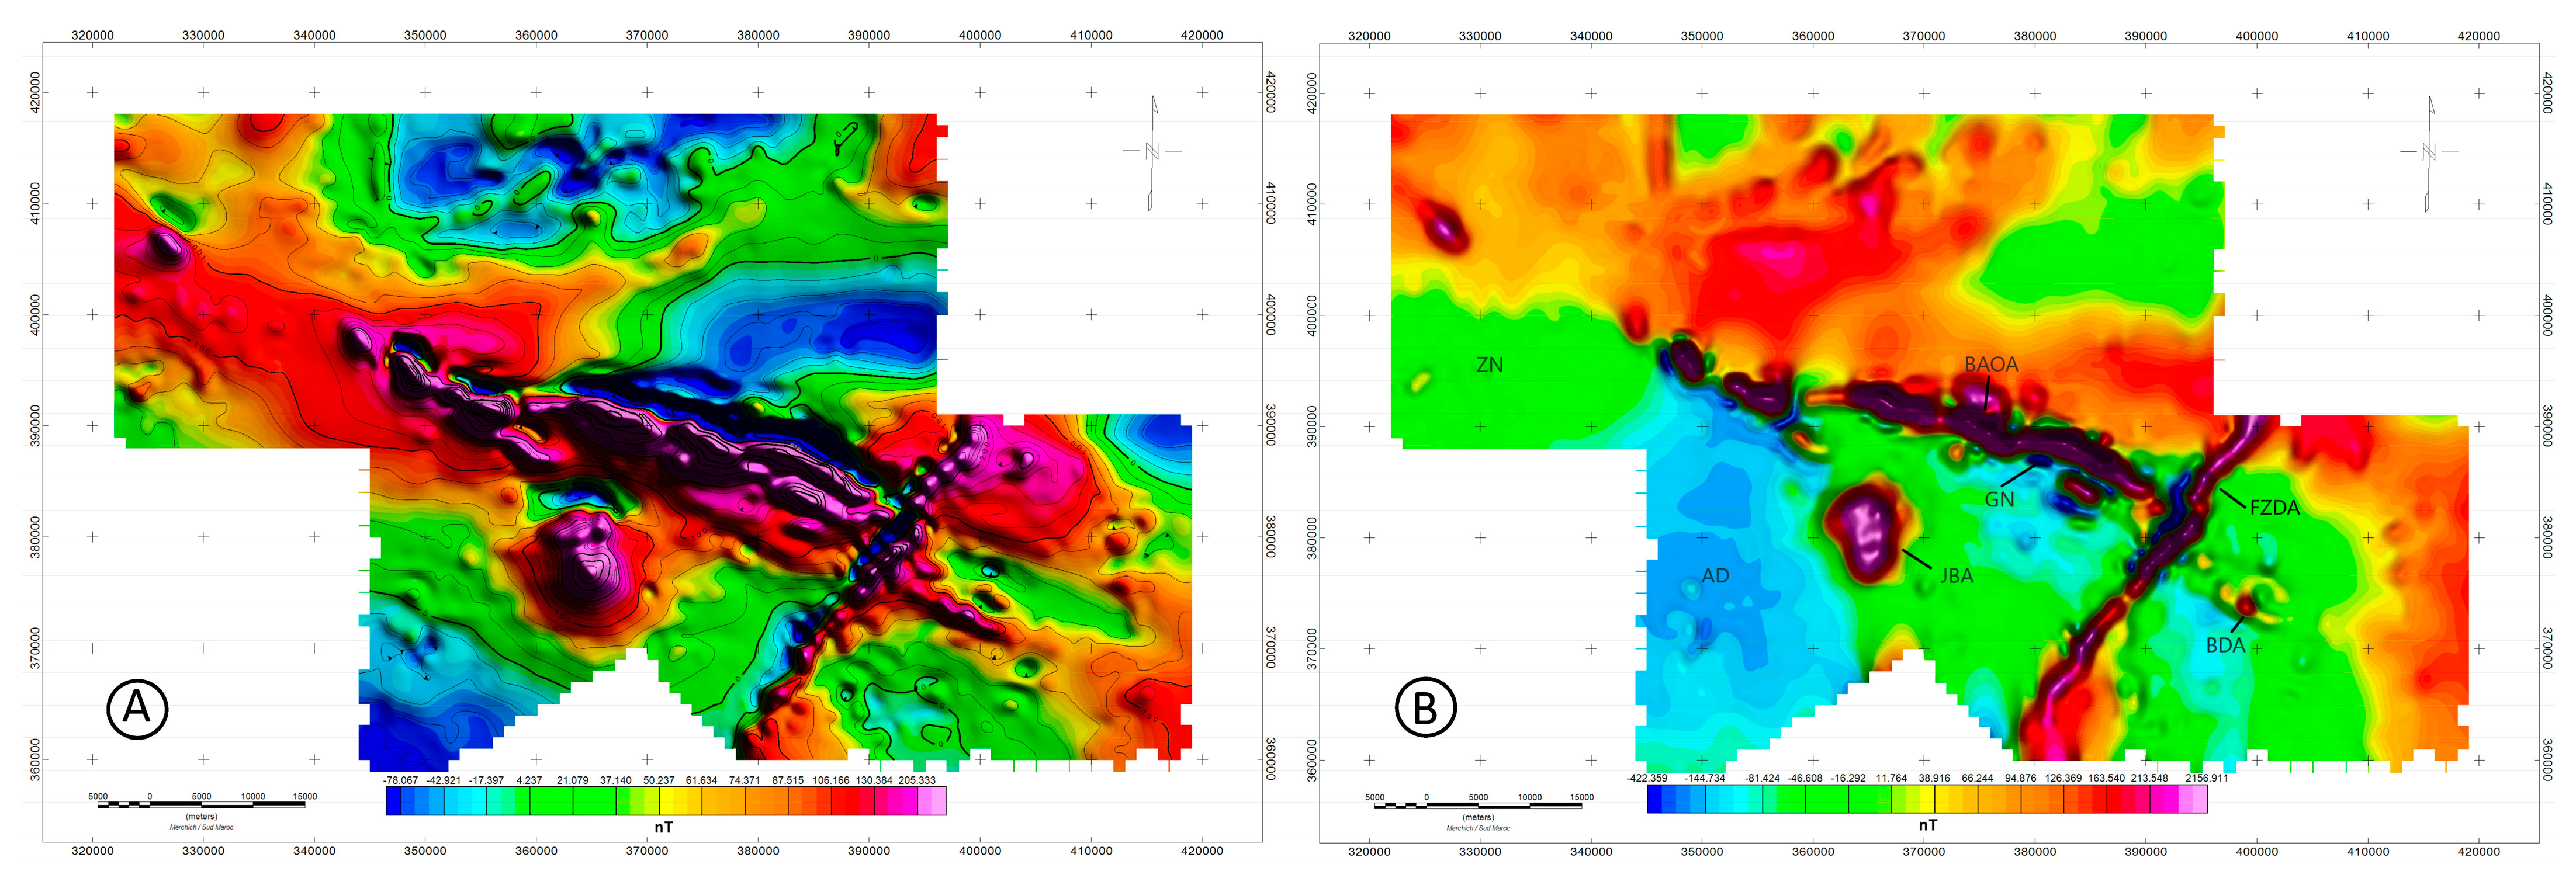
29]. Aeromagnetic maps of Bou Azzer Inlier Reduced to the north pole and the Residual Aeromagnetic map of Bou Azzer Inlier (
Figure 2), computed by [
28], were referenced using the southern Moroccan Lambert metric coordinate projection. The residual magnetic field performed by [
28] shows a very agitated magnetic relief and a certain heterogeneity with the presence of several anomalies (
Figure 2A), the observed class ranging from −900 nT to 1800 nT.
3.2. Gradiometric Tensor
Aeromagnetic assessments are frequently employed in geophysical local surveys aimed at unexploded ordinance surveillance, geology mapping, and mineral prospecting (UXO). Using a single total field magnetometer, aeromagnetic traditional surveys only yield assessments of the total magnetic intensity (TMI).
Different sensors provide precise measurements of the entire field gradient. These yields detailed data about shallow geological characteristics, which remain unaltered by diurnal fluctuations and the magnetic field background of the region. As an illustration of the gradient tensor measurement’s power, the Canadian Geological Survey initiated an aeromagnetic gradiometer program in Canada, developing short baseline aeromagnetic gradiometers back in 1975 [
30,
31,
32].
In recent years, there has been the development of gradiometers that use superconducting quantum interference devices (SQUIDs). These devices have been demonstrated to be successful for observing geomagnetic phenomena. IPHT Jena has successfully created and tested full tensor magnetic gradiometer systems based on LTSQUIDs (low-temperature superconducting quantum interference devices) for various targets [
33,
34].
Vector surveys offer significant advantages, and the interpretability of magnetic surveys is greatly improved through the use of the complete magnetic gradient tensor (MGT), This describes how the three field components change in space along three perpendicular axes. This comprehensive MGT opens up possibilities for applications like magnetic navigation, air anti-submarine warfare, UXO detection and more. As a result, multiple geophysical firms are in the process of creating complete-tensor magnetic gradiometer systems. However, there are additional engineering obstacles that need to be addressed to create a functional airborne SQUID gradiometer system [
34].
The Magnetic Gradient Tensor (MGT) can be derived by transforming the potential field. Based on potential field theory, it is feasible to calculate the various potential fields and gradient elements overhead magnetic sources [
35]. Consequently, gridded data for Total Magnetic Intensity (TMI) could be employed to generate the components of the gradient tensor [
36].
The gradient tensor can alternatively be obtained by measuring the total-field gradients in either the vertical or horizontal directions [
37]. There is no requirement to perform derivative operations, which could be unstable on Fourier domain, toward computing the gradient tensor from the total field gradient. Utilizing data on triaxial magnetic gradients allows for a more effective determination of gradient tensor components. However, in [
37], triaxial aeromagnetic gradients were not taken into consideration, and instead, the observed vertical gradient was derived by means of the horizontal gradient.
While gradiometer (or tensor) data are becoming more prevalent, especially in aerial gravity surveys, magnetic data are still often collected as a single value [
38]. Gradiometer data involve the collection of nine gradient magnetic or gravity values for each point, instead of just one overall field magnitude [
39]. This implies that more data sets are available for modeling, which can aid in resolving ambiguity issues during the modeling process.
3.3. The Art of Gradient Tensor Analysis
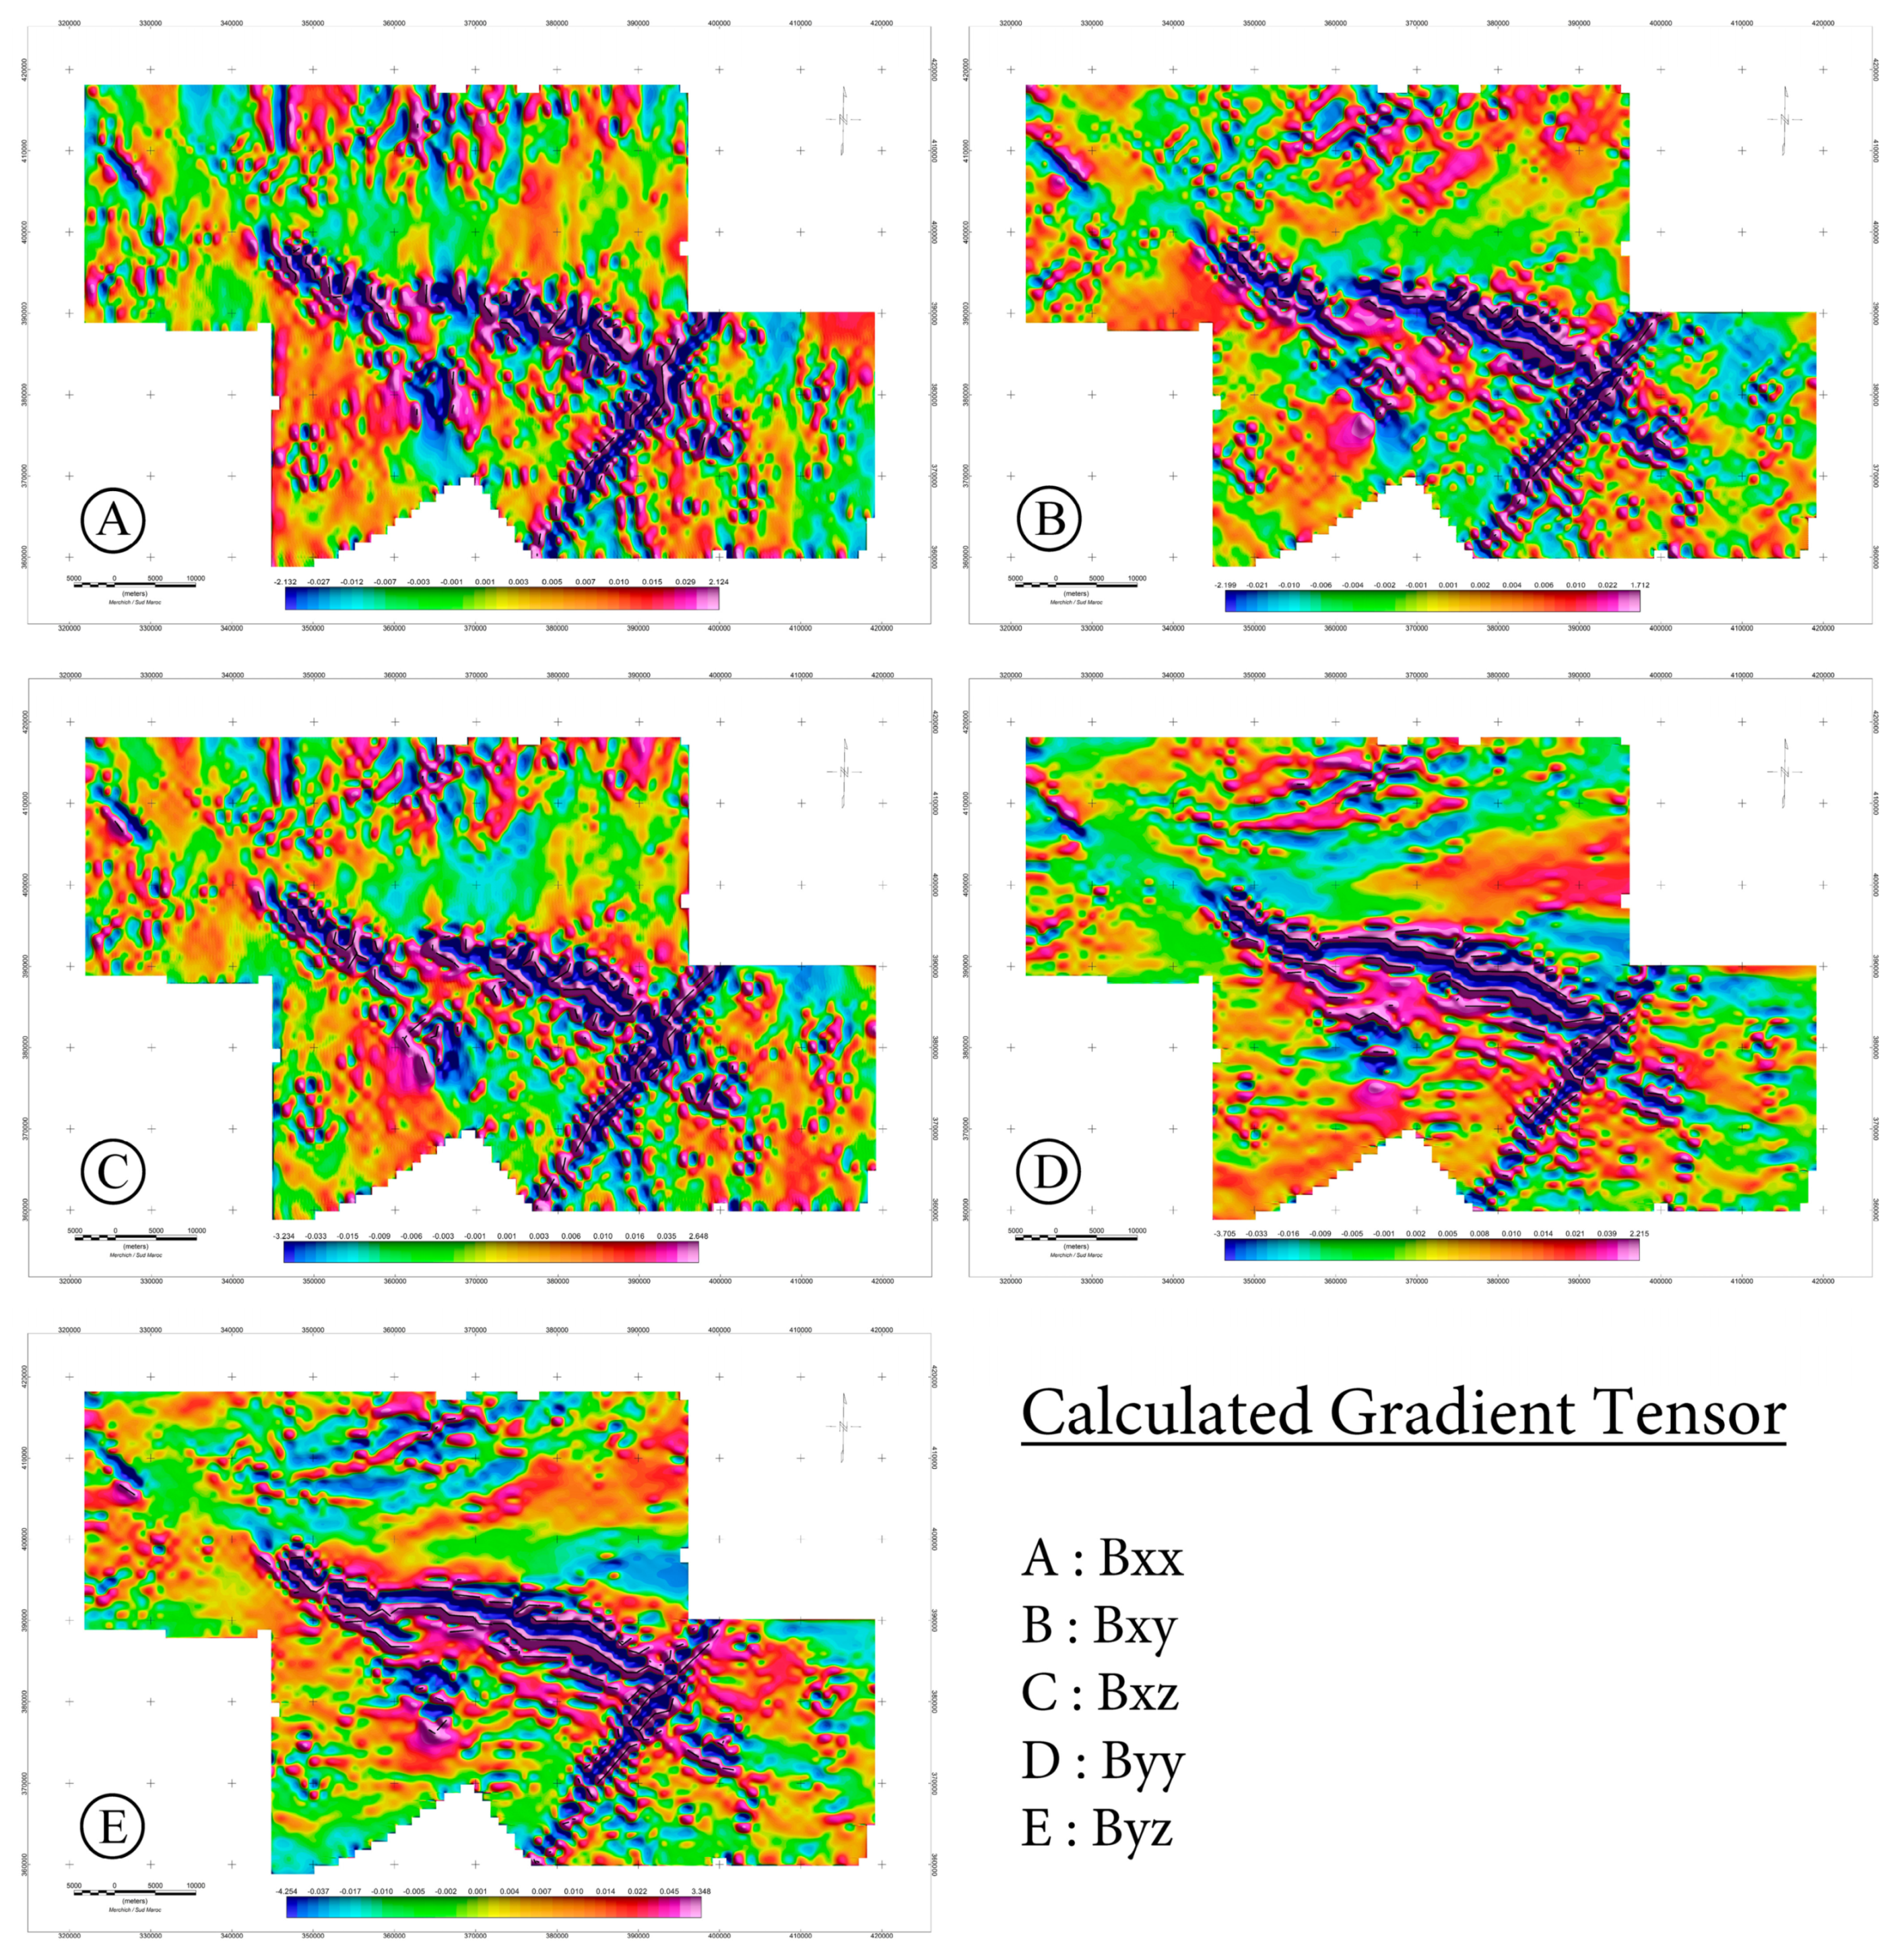
Tensors are an extension to the concepts of scalars, vectors and matrices. A tensor is represented as an organized multidimensional array of numerical values. A practical example of this is the magnetic gradient tensor (
Figure 3) [
37]:
where
Bx,
By and
Bz are:
x,
y and
z magnetic field components. The sheer volume increase in measured data presents many opportunities for new input into source detection and forward modelling algorithms.
Tensors can be categorized based on their rank or order [
40]. This categorization is evident in the count of components that a tensor has within an
N-dimensional space. Hence, a tensor with order
p comprises
Np components.
For instance, in a three-dimensional Euclidean space, the number of components in a tensor is 3p. From this, for example:
- ○
A zero-order tensor (p = 0) contains a single element and is referred to as a scalar. Physical quantities that only possess magnitude are depicted using scalars;
- ○
A tensor of order one (p = 1) consists of three elements and is termed a vector. Quantities that encompass both magnitude and direction are depicted using vectors. Bx is an example of a first rank tensor component;
- ○
A tensor of order two (p = 2) comprises nine elements and is commonly illustrated using a matrix. is an example of a second rank tensor component;
- ○
A tensor of order three (p = 3) has twenty-seven components. is an example of a third rank tensor component.
A structure tensor is a matrix derived from the gradient of a function. It is a second order tensor (
Figure 3) (has components such as
Bxy), and has 2D and 3D forms (can be represented by either two or three variables). The 3D form is used in gradiometer surveys. Assume that
B is a function of three variables (
x,
y,
z). We can recognize that since
, this implies that (in SI units)
,
,
Therefore, the structure tensor would be [
41]:
where ⊗ is the dyadic product. Since the magnetic field represents a gradient of potential, where the tensor elements correspond to second-order derivatives of the scalar potential (φ). As a result, the tensor components exhibit symmetry. Therefore:
According to Laplace’s equation:
From this it can be seen that:
Based on previous equations we have:
This means that there exist only five distinct and unconnected tensor components with magnetic and gravity data. For magnetic data these are Bxx, Bxy, Bxz, Byy, Byz.
Refs. [
42,
43] explore a different type of tensor representation that is based on amplitudes and phases.
A tensor measurement can be transformed using eigenvalues and eigenvectors. Each reading is divided into its orthogonal rotation matrix, invariant eigenvalue amplitudes, and local to the survey reference frame eigenvectors. The amplitude and phase of the tensor are represented by the eigenvalue amplitudes and eigenvector rotations. The amplitude-phase form respects the inherent physical features of tensors while enabling extremely quick and reliable processing of tensor data.
A thorough summary of eigenvector analysis of the tensor is provided by [
36]. The link between these values is as follows if we define a tensor measurement as the matrix B with a scalar eigenvalue and eigenvector ν:
The eigenvalues are determined through the solution of the characteristic equation. Det(
B−
λI). Expanding this, we get:
where:
where
. Applying eigenvector analysis to our tensor equation, as shown in the previous equation, we obtain 3 eigenvalues and 3 eigenvectors. The rotation matrix
R which has as its columns the eigenvectors
, diagonalises
B when applied to it. It is straightforward to verify that the following holds:
The eigenvalues, and any combination thereof, are the tensor rotational invariants. [
36] makes extensive use of one such rotational invariant, specifically, the standardized source magnitude. It is defined as:
In contrast to magnitude of the tensor (Frobenius norm)
|B|, ref. [
36] notes that it is entirely isotropic in the vicinity of a dipole source. It is perfect for inverse operation (total magnetic field calculation).
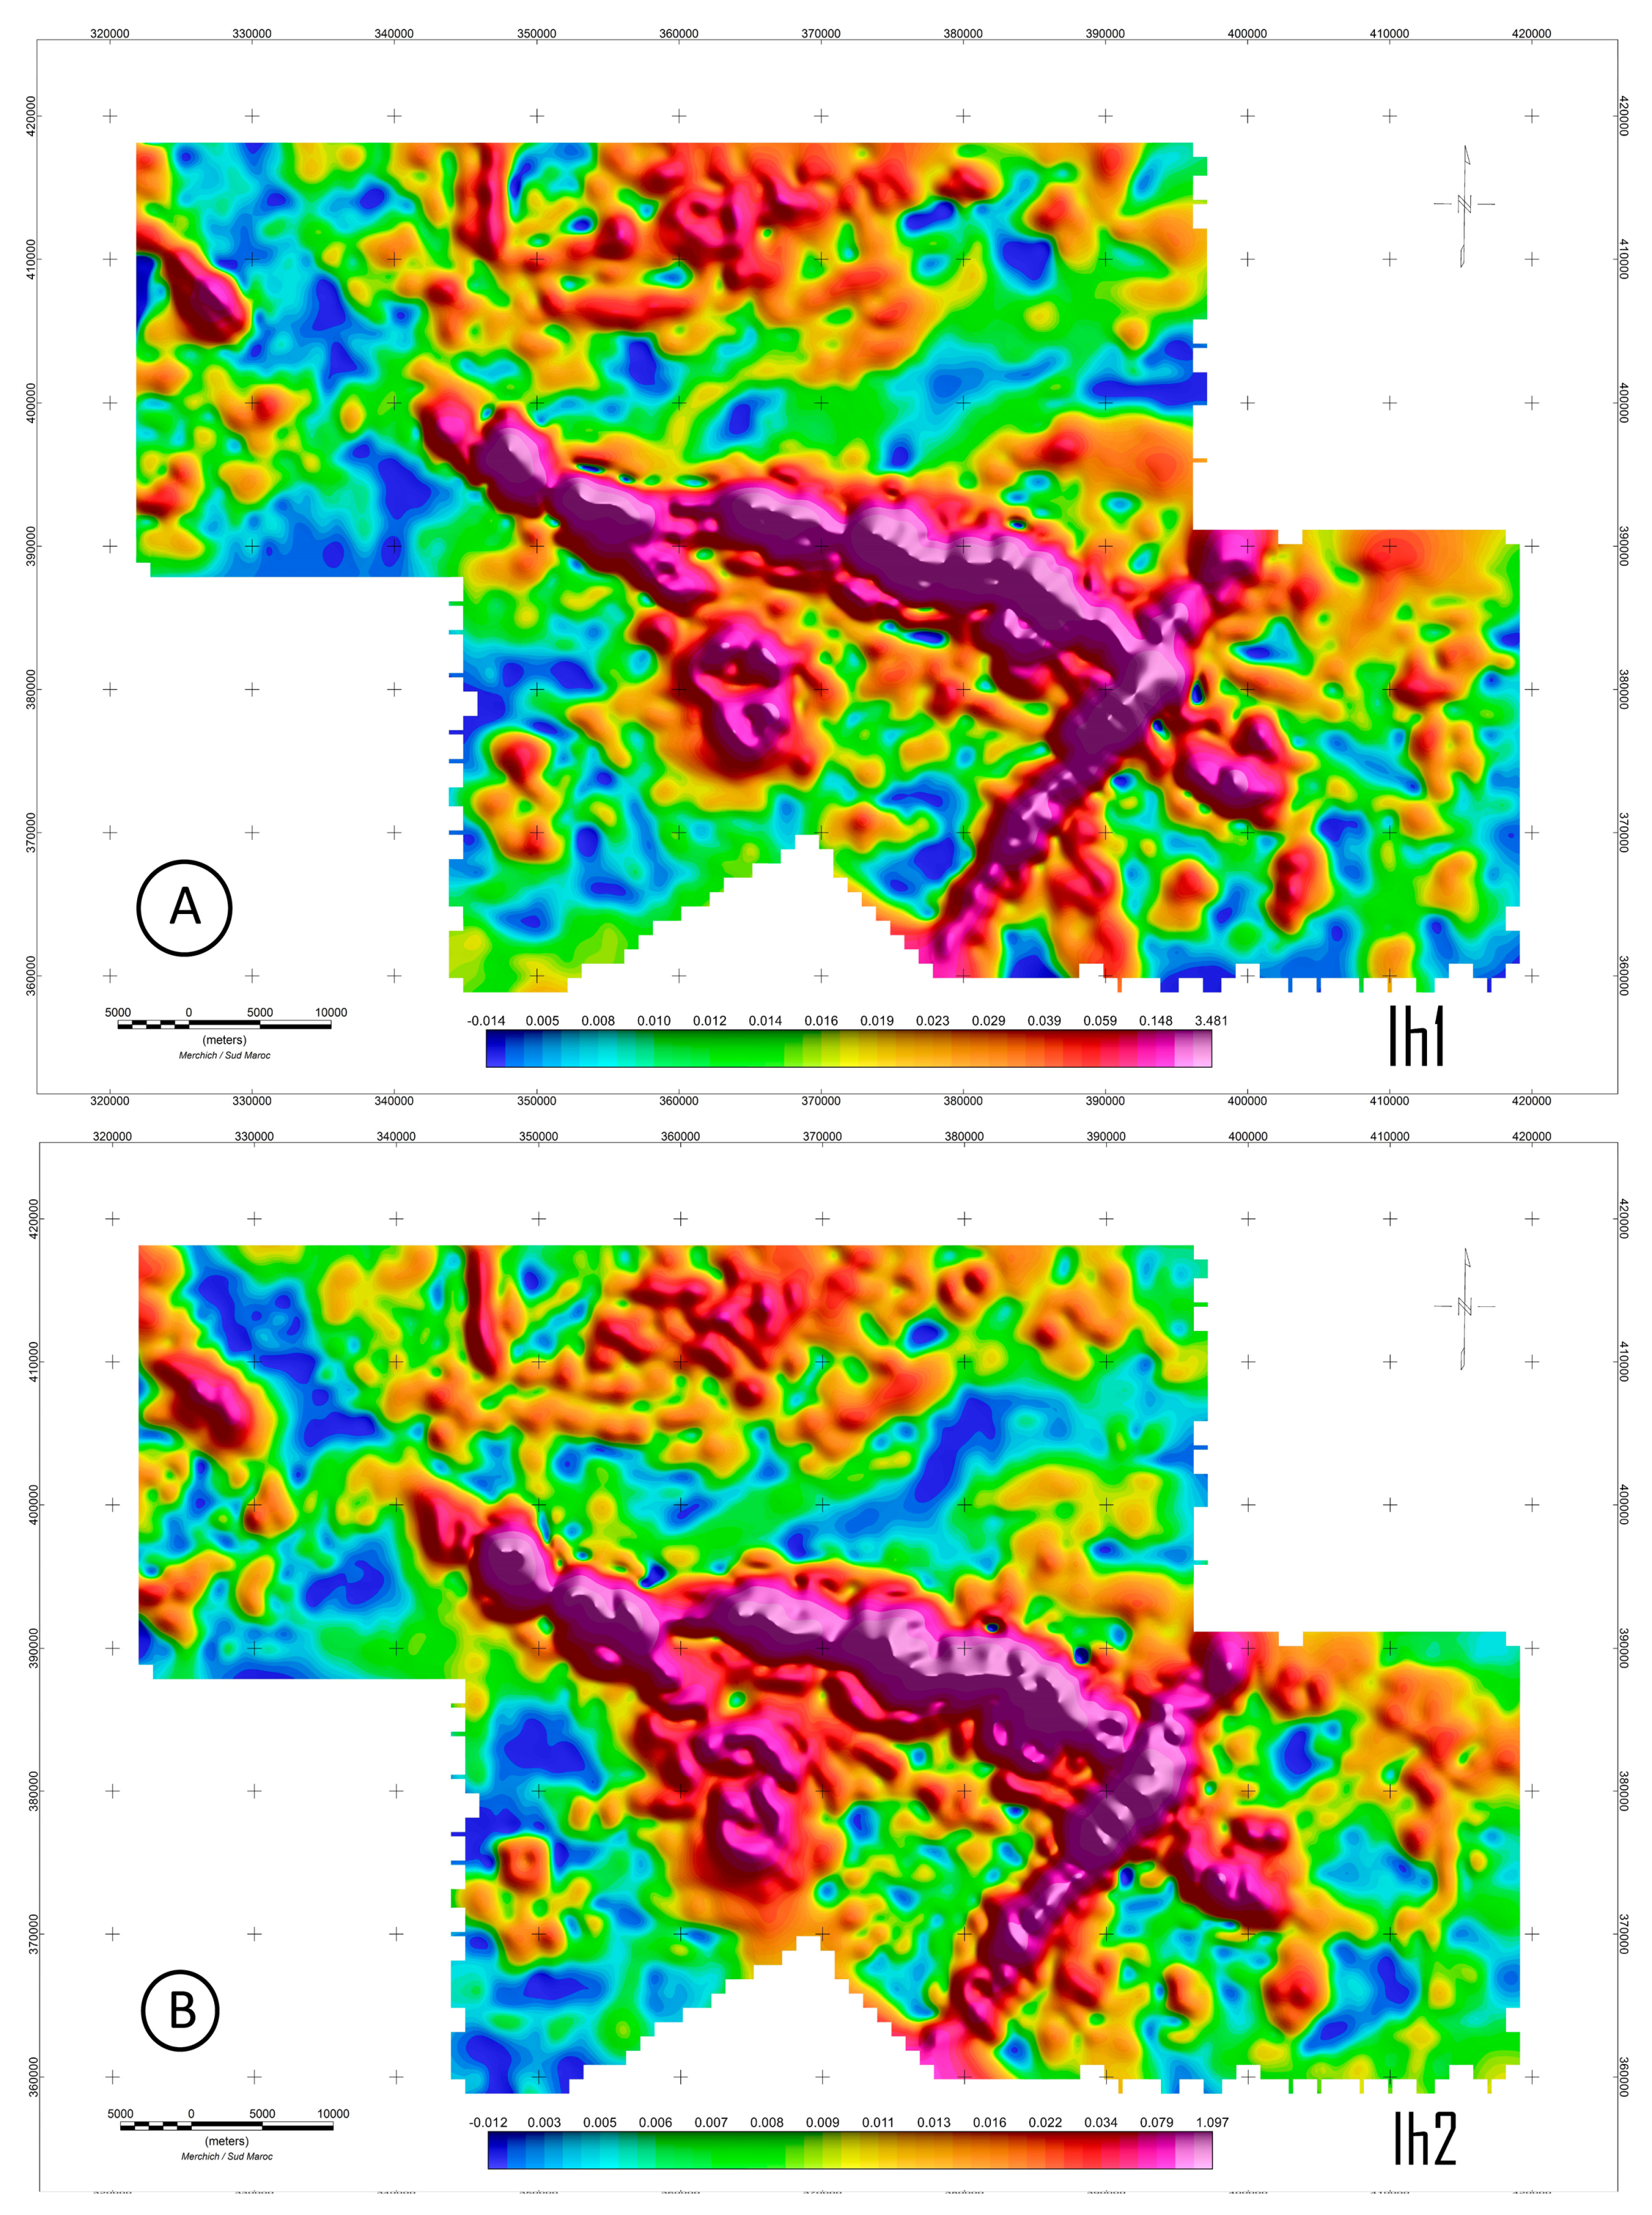
As a result, the previous formulation may be used to determine the horizontal invariants of the FTG map the edge of units (
Figure 4). They are characterized as:
The gradient tensor determinant of 2-D structures, according to [
10], is equal to zero. The first system for which the x-axis corresponds with the strike direction will be obtained if the coordinate system is then rotated such that it lines up with the striking direction., the element
becomes zero. Although this does not really occur in practice, the optimal striking direction can be identified if the matrix is rotated around the z-axis to decrease this component. You may compute this rotation angle [
44,
45,
46] (
Figure 5) using:
4. Results and Discussion
4.1. Bou Azzer Magnetic Field
Given the great geological and structural complexity of the region, the residual magnetic field map shows a variety of anomalies. Thus, after examining the residual Aeromagnetic map of Bou Azzer inlier (
Figure 2A) we notice the presence of a large bipolar anomaly-oriented WNW-ESE, which runs along the central part of our study area, with a length exceeding 10 km. It is a linear anomaly with a positive pole more developed than the negative pole. In such a context at this latitude and with an inclination of the magnetic field which is around 45°, it is obvious that this structure has an NNE dip.
A second linear bipolar anomaly is situated in the eastern section of the inlier. It forms an elongated feature stretching in the northeast to southwest direction, covering approximately ten kilometers. It signifies a consistent continuation beyond the main geological formation. An additional set of anomalies was identified within the research area. These anomalies exhibit circular shapes and belong to a distinct group. The initial anomaly is positioned to the south of the central WNW-ESE structure within the geological formation. Its circular appearance suggests it might be a result of a basic magmatic intrusion. The second anomaly is situated to the southeast of the study region. Currently, it is challenging to differentiate among the various anomalies since all these formations exhibit significant consistency on both sides of their originating sources. As a result, the utilization of enhancement filters becomes crucial for accurately interpreting the aeromagnetic data. Hence, to ensure accurate comprehension, it is vital at this phase to employ a range of filters aimed at enhancing the analysis. This might involve attenuating prolonged wavelength anomalies in some cases or amplifying it in others.
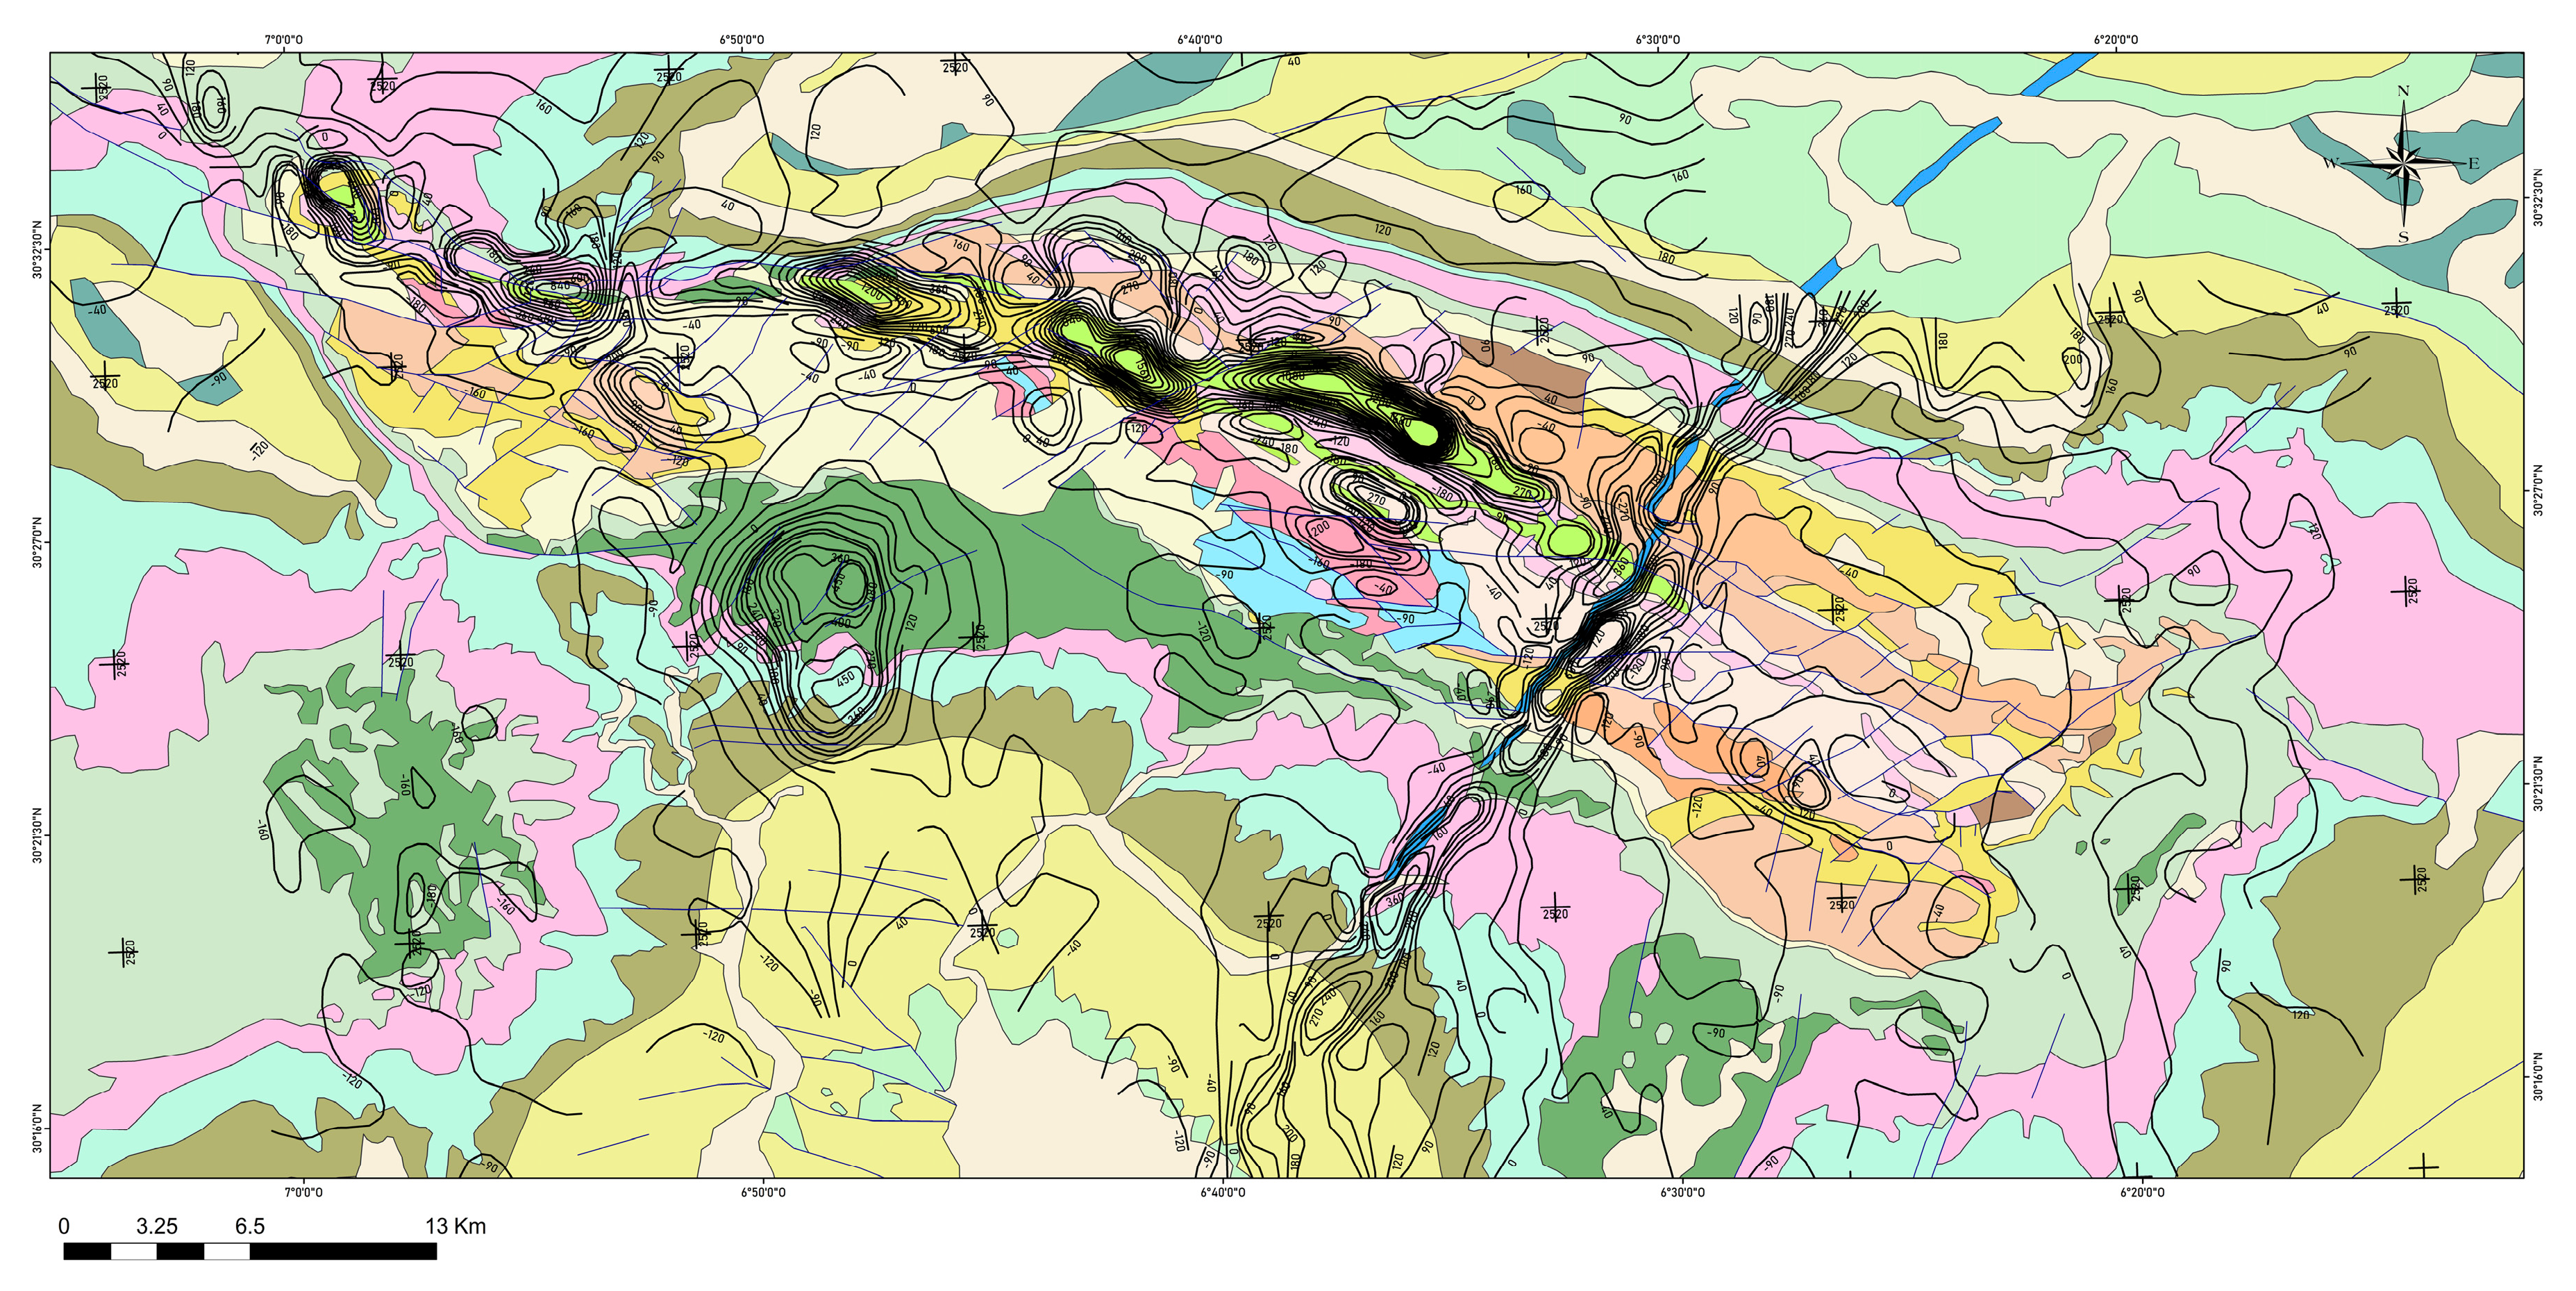
Examination of the RTP map (
Figure 2B), allowed for the detection of several linear and circular formations with varying amplitudes. In furtherance of perceiving their origin, the contours lines of the positive RTP data values were overlapped on the geological Bou Azzer inlier map (
Figure 6). We will address each anomaly separately in the following sections. We will begin by interpreting the positive anomalies and then move on to the negative anomalies and those with lower intensity.
BAOA: This anomaly (
Figure 2B) corresponds to the ophiolite complex of Bou Azzer which runs along the central part of our inlier along a WNW-ESE axis, showing a value greater than 2240 nT. The elevated magnetic susceptibility is attributed to the rock’s nature. As previously mentioned, the ophiolitic complex has undergone near-complete serpentinization, accounting for the heightened magnetic intensity observed within this formation. This axis is evidently shifted by several strike-slip faults.
FZDA: This anomaly (
Figure 2B) corresponds to the famous Foum-zguid mafic dyke. It displays a value greater than 2000 nT (
Figure 2A,B). This dyke is formed mainly by dolerites which explains its high magnetic susceptibility. The FZ dyke extends over more than 200 km along a linear NE-SW fracture. Its lower Jurassic age (Lias), suggests that it was formed during the opening of Tethys. This large dyke is an integral portion of the Central Atlantic Magmatic Province (CAMP) [
47,
48].
JBA: This anomaly showing a value of about 2100 nT (
Figure 2B) is linked to the basic magmatism of Jbel Boho, then located south of the ophiolitic complex, this circular anomaly has been the subject of several studies. This magmatism is known for its richness in rare earth and copper which makes it one of the important districts in the inlier. The igneous formation includes a central syenitic core surrounded by extensive flows of volcanic lava, characterized as trachytes, andesites and basalts, which extend for tens of kilometers from the complex’s center. These volcanic stones are found within the lower portions of a sequence of carbonate rocks that were deposited at the same time [
49].
BDA: This anomaly displaying a value of about 200 nT (
Figure 2B) located SE of the inlier to the east of the FZ dyke, corresponds to the basic complex formed mainly by basalts which belongs to the Tachdamt-Bleïda platform, this anomaly sticks perfectly with the famous mining district of Bleïda marked by the presence of copper mineralization in the form of lenses.
AD: The negative magnetic anomaly (Ad) displaying a value of about −150 nT (
Figure 2B), unquestionably represents the Adoudounian sedimentary cover. The negative values reflect the deep aspect of the said cover, it is a thick sedimentary filling having originated at the level of a deep sedimentary basin. This series, more than 2000 m thick here, rests unconformably on the series of the Ouarzazate Group [
16].
GN: The negative Gn anomaly displaying a value of about −400 nT (
Figure 2B) located south of the ophiolitic complex is related to granitoids (quartz diorite) of upper cryogenic age. They occurred during the Pan-African deformation [
15].
Zn: This anomaly displaying a value of about −50 nT (
Figure 2B) located in the northwest fringe of the inlier and which is in the form of an arc with weak magnetic field values corresponds to the northeast limit of the Zenaga inlier (Zn).
4.2. Gradient Tensor Analysis of Bou Azzer Inlier
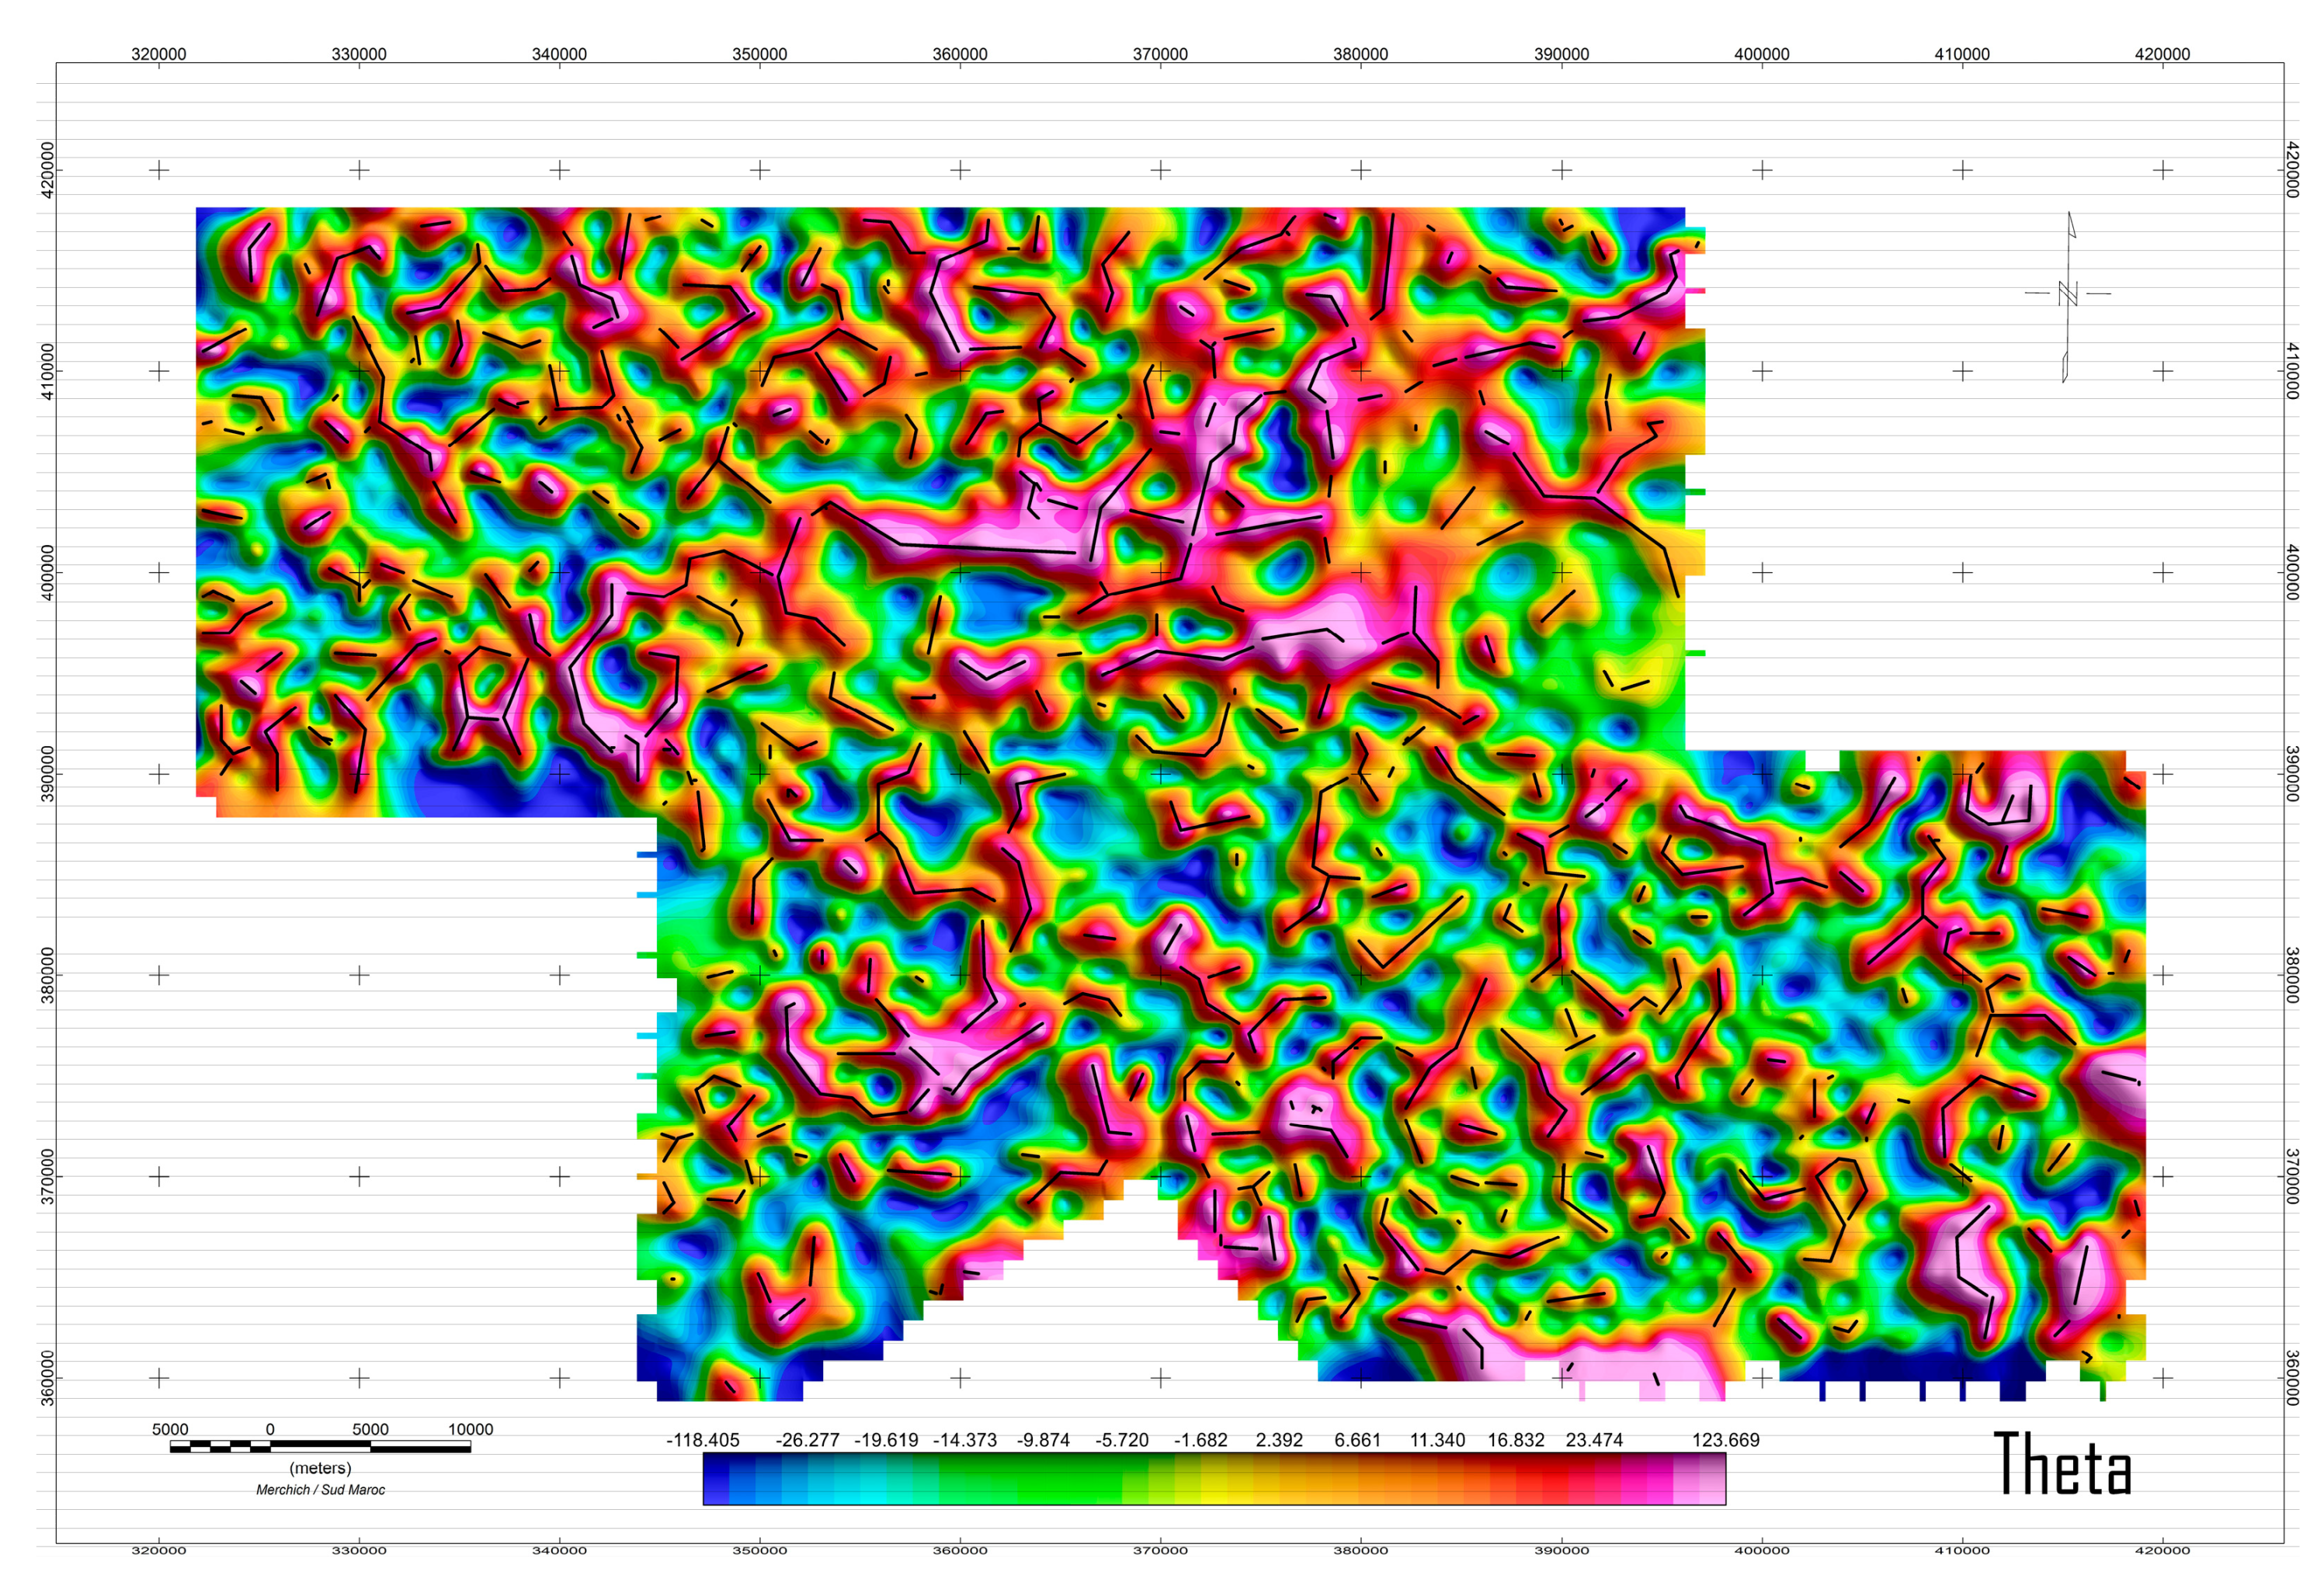
The approach employed (GTA) still performant in highlighting shallow formations in all directions (
Figure 4,
Figure 5 and
Figure 7), thus its application allows us to highlight a basic complex (Bc) of the Tonian—Cryogenian series of Tachdamt-Bleïda which lies in the center between the ophiolitic complex of Bou Azzer and Jbel Boho. It is mainly composed of basalts, which explains its high magnetic susceptibility. Note also that a fragment of serpentinite known as Takeroumt’s (Tk) was also better understood by applying this gradient, the latter is associated with the Cryogenian oceanic subduction system. We also note the continuous interruption of the Foum Zguid dyke all along the NE-SW axis, which corroborates with the geological map, thus the responses obtained at the level of the Horizontal invariants reflect the deep character of said dyke. It is noted that the application of GTA allowed us to attenuate the noise effect.
Note that it is difficult at this stage to carry out a precise mapping of the study area given the great contrast that appears at the level of the gradient tensor maps, but one can easily detect a certain number of tectonic events having affected the study area. On the one hand, there is a slight offset at the level of serpentinites at the level of the Ait Ahmane sector. This is due to the presence of a fracture N70° with sinistral lateral rejection, it is acts of Irthem fault (
Figure 4 and
Figure 7). On the other hand, we have detected at the level of the Foum Zguid dyke a fracture oriented N120 with a sinistral component which corresponds to the AMAA. We note that throughout the ophiolitic complex several fractures appear (
Figure 7), they are mainly oriented N40 to N60 with a left lateral strike-slip movement. Note that throughout the northern part of the ophiolitic complex, we notice the presence of a strong negative vertical gradient which can probably be attributed to the Anti-Atlas Major Accident (
Figure 3).
Meanwhile, the GTA enables us to separate closely spaced bodies and allows clear visualization of the plunging bodies, which will allow us to determine the plunging direction. The aforementioned GTA will help locate the maxima above the causative sources. Therefore, it will ensure a good visualization of magmatic intrusions, especially those of a basic nature as present in the study area (
Figure 7A).
We note that the aforementioned study region is distinguished by the presence of a famous ophiolitic complex, with 70% serpentinization. The obtained results (
Figure 4,
Figure 5 and
Figure 7A) easily allow one to identify the anomalies of high magnetic susceptibility. Through the analysis of the map, we observe that the Bou Azzer complex represents a solitary serpentine structure along the WNW-ESE axis, confirming the fragmented nature of said ophiolitic complex. It is worth noting that the aforementioned complex exhibits a northward plunging direction. Similarly, we observe a lateral continuity towards the west of the Takeroumt’s serpentinite fragment.
Also, GTA allows the balancing of anomalies originating from both shallow and deep origins and to accentuate specific features of interest (
Figure 5 and
Figure 7A), such as the edges of magnetic bodies. GTA can emphasize the edges of the anomalies identified in the Bou Azzer sector. We would like to point out that the cobaltiferous and nickeliferous mineralization is located at the contact between the ophiolitic complex, in other words, between high-amplitude anomalies and the surrounding rocks. Hence, it is important to map these contacts. This method exhibits remarkable traits, as it generates peak amplitudes at the edges of the source and equalizes signals originating from both shallow and deep sources. The application of this method extends to both synthetic and real data. Its effectiveness is assessed by comparing it to other contour detection methods found in previous literature that rely on derivatives.
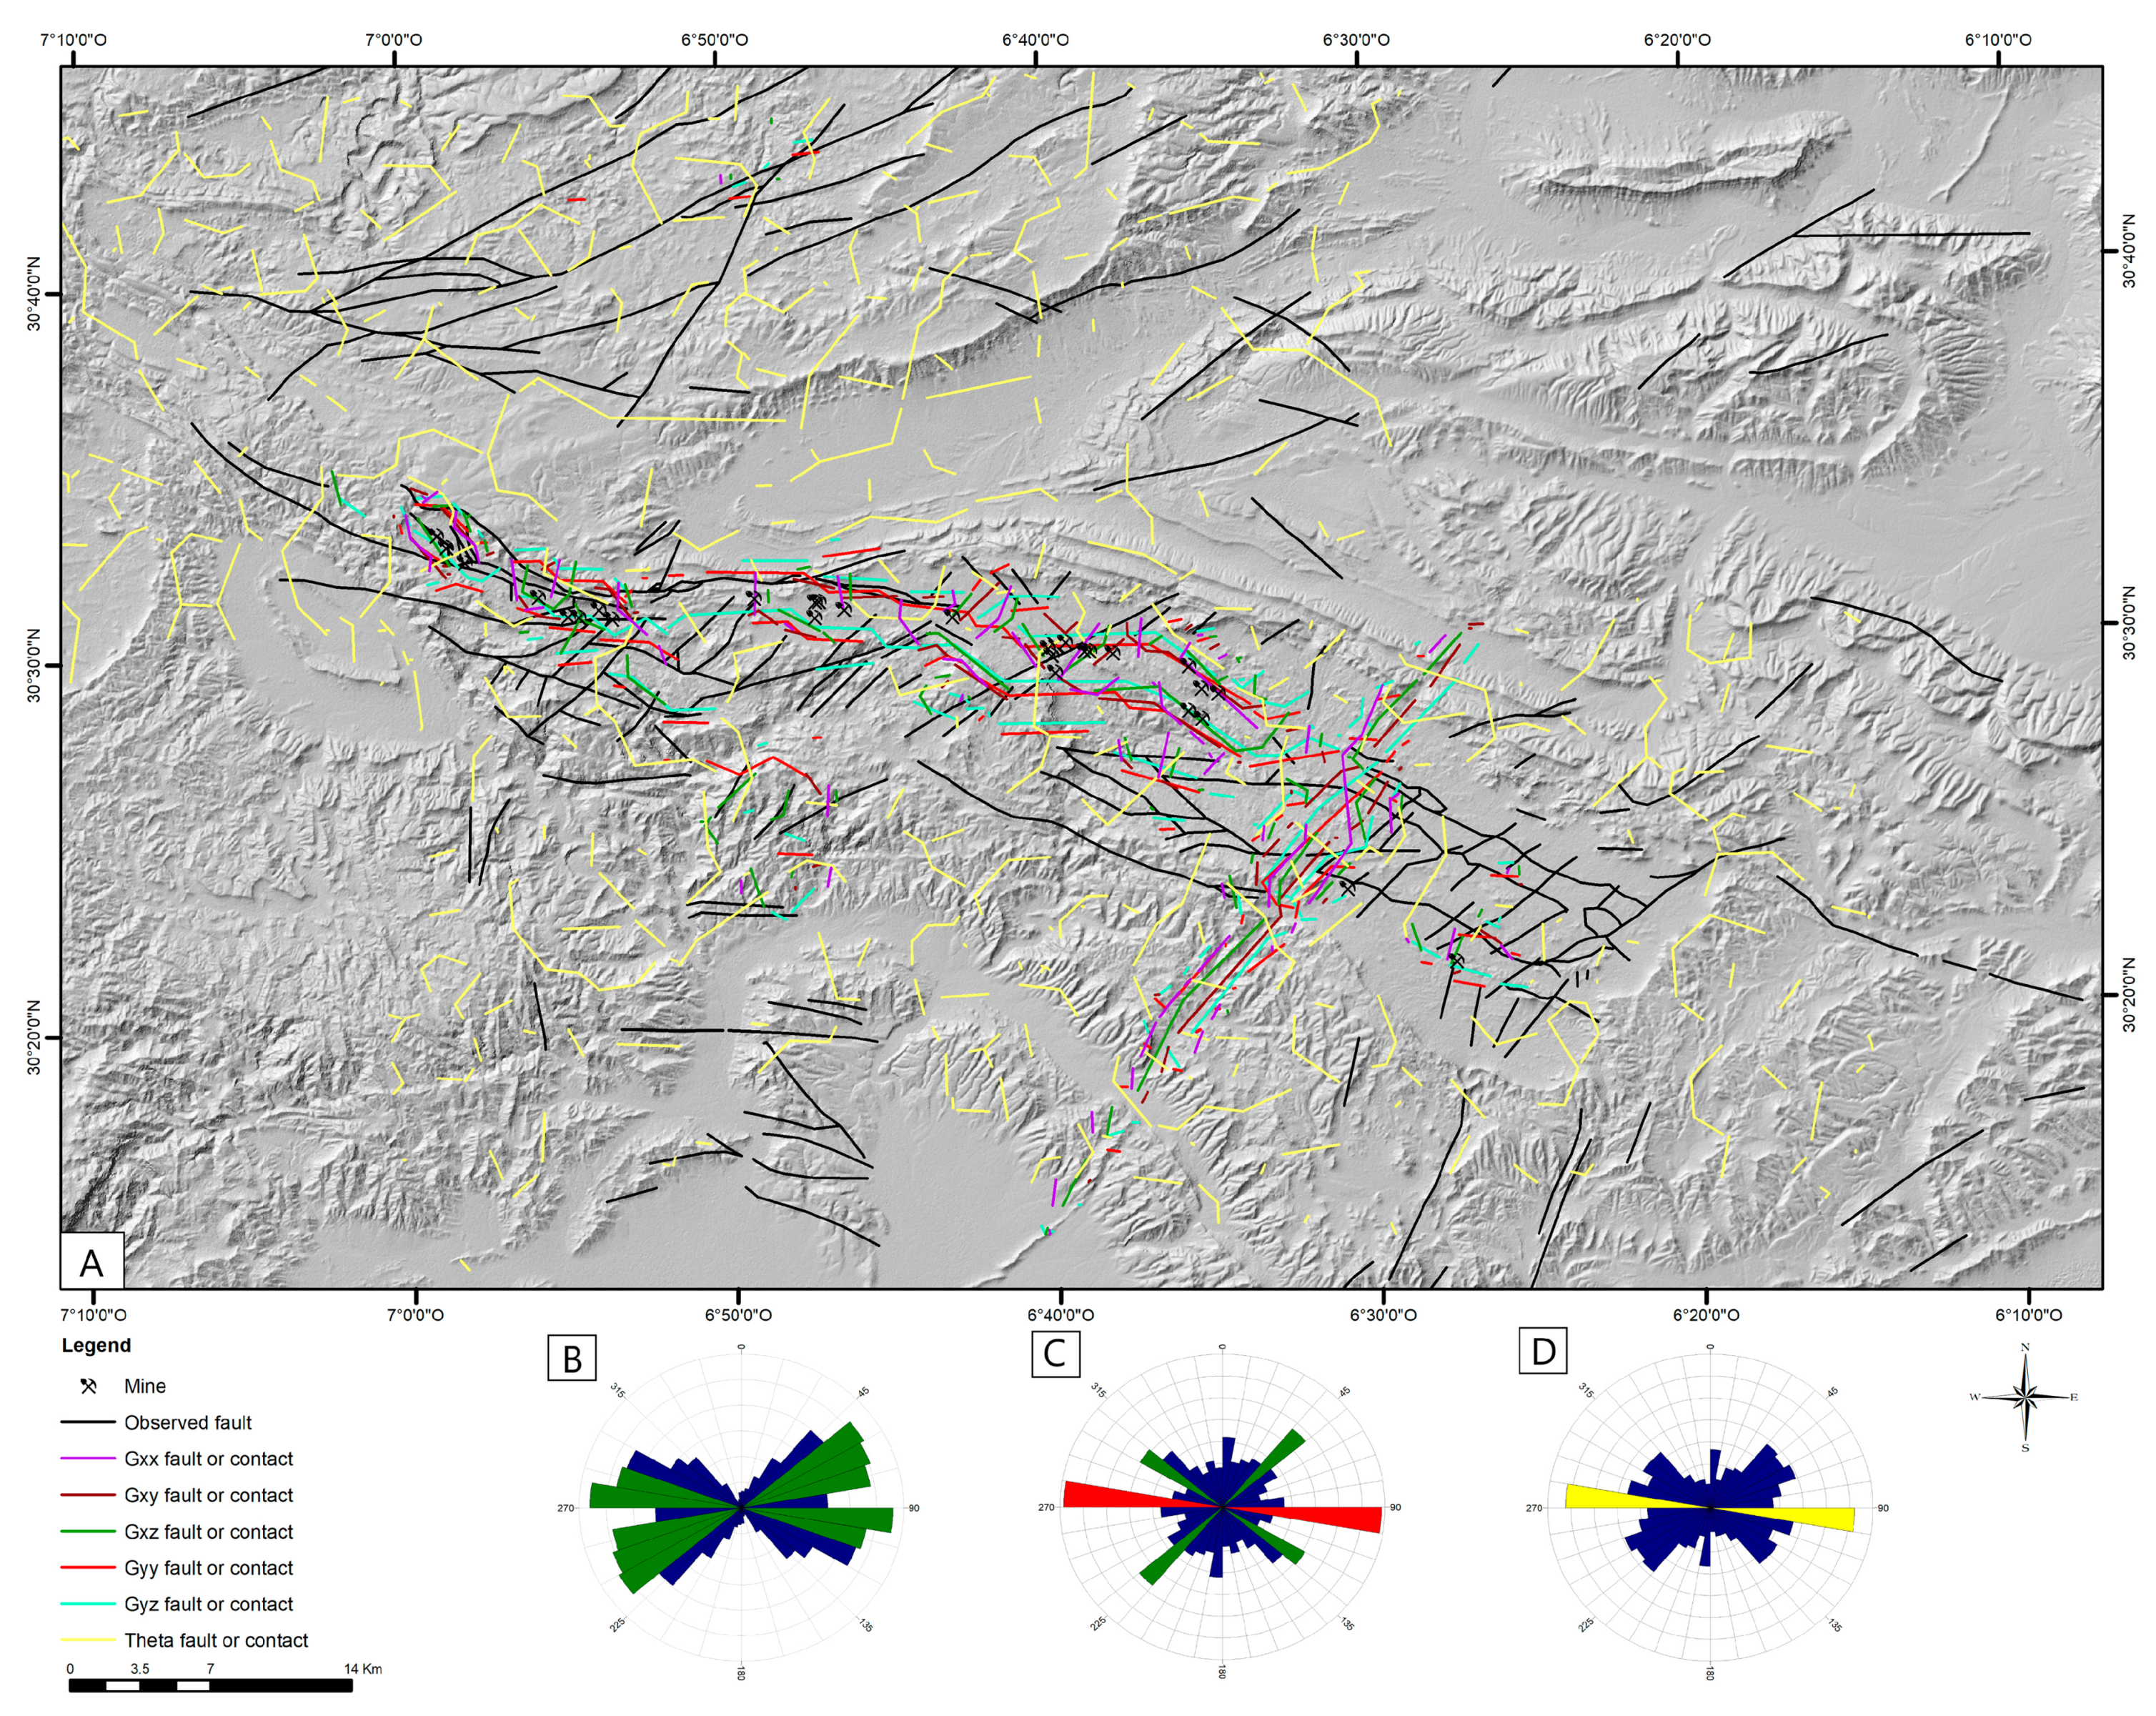
The black lines (
Figure 3 and
Figure 5) and the colored lines (
Figure 7) demonstrate the undeniable effectiveness of our method in accurately indicating the location of the boundaries of causative bodies, even for anomalies caused by numerous intrusive sources. It is worth noting that the northern contact between serpentinites and basic rocks in the uplifted block shows a straight alignment, as does the southern contact. However, we must then emphasize that the most significant deposits are located on the southern interaction among quartz diorite and serpentinite. The application of GTA in the Bou Azzer uplifted block has yielded effective results. Thus,
Figure 4 displays the amplitude maxima of horizontal invariants along the edges of the ophiolitic complex, marked by a tectonic contact with the surrounding rocks. In this case, regarding
Figure 5, it becomes easy to identify the geological lineaments with theta map, enabling a better comprehension of the area’s tectonic history. The effect of depth has been observed in the extension of the ophiolitic complex in the north-western part of the uplifted block. From a structural standpoint, the major Anti-Atlas fault-oriented WNW-ESE is more clearly visible on the gradient tensor maps (
Figure 3), snaking through the northern portion of the aforementioned ophiolitic complex. We emphasize that the contact between the basic magmatism of Jbel Boho and the surrounding rocks is subcircular (
Figure 4). Therefore, we recall that the northern contact is marked by the presence of dolomitic beds from the lower Adoudounian, while the southern contact is marked by the presence of dolomites. For the Foum Zguid dyke, we note that the maxima are located on either side of the center of said dyke [
28]. Then said maxima show an elongation along the NE-SW direction.
4.3. Structural Analysis
Examination of the first rose diagram (
Figure 7B) shows that the observed geological faults extracted from the geological map are globally dispersed among main directions ENE-WSW, E-W and WNW-ESE. In return, the rose diagram relating to the magnetic lineaments shows that the latter are aligned in lightly diverse orientations, NE-SW, NW-SE and fewer ostensibly N-S. The noticeable contrast in these alignments can be associated with the underlying structural composition of the basement resulting from the magnetic interpretation. These structures are entirely hidden beneath Quaternary sediments, and consequently, they are not depicted on the geological map. Moreover, the coverage of the geophysical data exceeds the limits of the Bou Azzer inlier.
The NE-SW direction particularly represents strike-slip faults that cause a notable offset of the ophiolitic body.
The WNW-ESE to E-W (
Figure 7C) directions are particularly evident in the inlier central zone, this is the main orientation of the Bou Azzer ophiolitic complex, these directions represent the faults inherited from the Pan-African orogeny and which were reactivated in the long term until the uplift by Variscan deformation [
15,
16]. It is a period marked by a generalized shortening, at the level of the central and eastern Anti-Atlas, so we are witnessing a reactivation of the Precambrian structures along the Major Anti-Atlas Accident which led to the raising of the inlier along a NW-SE axis [
50].
The structural rose diagram (
Figure 7D) shows that the lineaments display an E-W, NE-SW, WNW-ESE main trend and N-S less important direction.
The obtained results demonstrate that the studied region is prominent owing to its high structural complexity resulting from polyphase tectonics at the level of the Bou Azzer inlier.
4.4. Tectonic Implications
Regarding the structural analysis of the Bou Azzer inlier, we were able to highlight several fault families representing different tectonic episodes that affected the study area. It is noted that this variety of direction is the result of polyphase tectonics. As mentioned above, the obtained results revealed the following structures:
The family of faults showing directions N°020 and N°030 particularly concerns the old basement [
51] (
Figure 7B,C).
Faults N°020, N°040, N°060, N°070, N°100, N°120, N°130 and N°140 mainly affect Upper Proterozoic formations [
52] (
Figure 7B,C).
The Infracambrian and Paleozoic cover formations are affected by families, N°020, N°030, N°060 and N°070 [
15] (
Figure 7B,C).
Studies conducted by various authors [
15,
16,
51,
52] have concluded that:
The main Pan-African B1 phase is marked mainly by the N030° to N050° dextral faults and by the N140 to N160° sinistral faults. This phase is responsible for the exhumation of the ophiolitic complex by the process of obduction. This is a WNW-ESE-oriented compression phase.
The late main Pan-African phase B2 is distinguished by a significant tightening at the level of the inlier, thus we find two large families of faults: the family N°150° to 160° dextral strike-slip, and a family N°70 sinistral strike-slip. The tightening is oriented N020° to N030°.
The post Pan-African period is marked by a distensive phase, giving rise to faults oriented N70°. This phase is marked by the formation of grabens with detrital filling. This phase is followed by a major extensive phase marked by normal synsedimentary faults N20° and N70°.
The Hercynian phase corresponds to a period of reactivation of the N70° faults. This is a compressive event marked by a sinistral movement of these faults. The latter have dextral inverse NW-SE conjugates.
4.5. Mining Implications
In the Bou Azzer inlier, the structural study combining geological and geophysical data (GTA) has proven effective in analyzing the structural and geodynamic evolution of the inlier. Note that the majority of hydrothermal mineral deposit types seem to have originated from extensive hydrothermal systems often concentrated near significant crustal features (faults and crustal discontinuities) [
53]. This is the case for the mineralization at the level of the Bou Azzer inlier which displays an intimate relationship with the Ophiolitic complex of Bou Azzer and surrounding rocks. This association suggests that a deeply embedded structure served as a conduit for concentrating mineral-rich fluids through the crust. Nevertheless, these substantial structures may not always be evident at the surface (e.g., the Carlin Trend) [
54]. Therefore, the significance of employing gradient tensor analysis lies in its ability to identify these underlying formations that are not visible on the geological map.
The mineralized structures within the Bou Azzer mining district can be categorized into five primary orientations: East-West, West-Northwest to East-Southeast, Northeast-Southwest, Northwest-Southeast, and North-South. These orientations align with the magnetic lineaments that have been identified.
Cobaltiferous and nickeliferous mineralization in the Bou Azzer mining district preferentially developed in old tectonic breccia bodies located between serpentinites and magmatic intrusions (quartz diorites). This configuration testifies to the existence of old normal faults WNW-ESE having participated in the exhumation of deep mantle rocks. The contact between seawater and magmatic bodies leads to hydrothermal reactions at the origin of mineralogical transformations leading to the formation of both cobalt and nickel.
The WNW-ESE and ENE-WSW families represent the major pan-African accidents. They are sinistral in nature and linked to the compressive episode affecting the entire Anti-Atlas chain. The WNW-ESE trending faults represent drains for the circulation of hydrothermal fluids. Furthermore, the NE-SW and E-W trending lineaments constitute the structural framework in which the mineralization is situated.
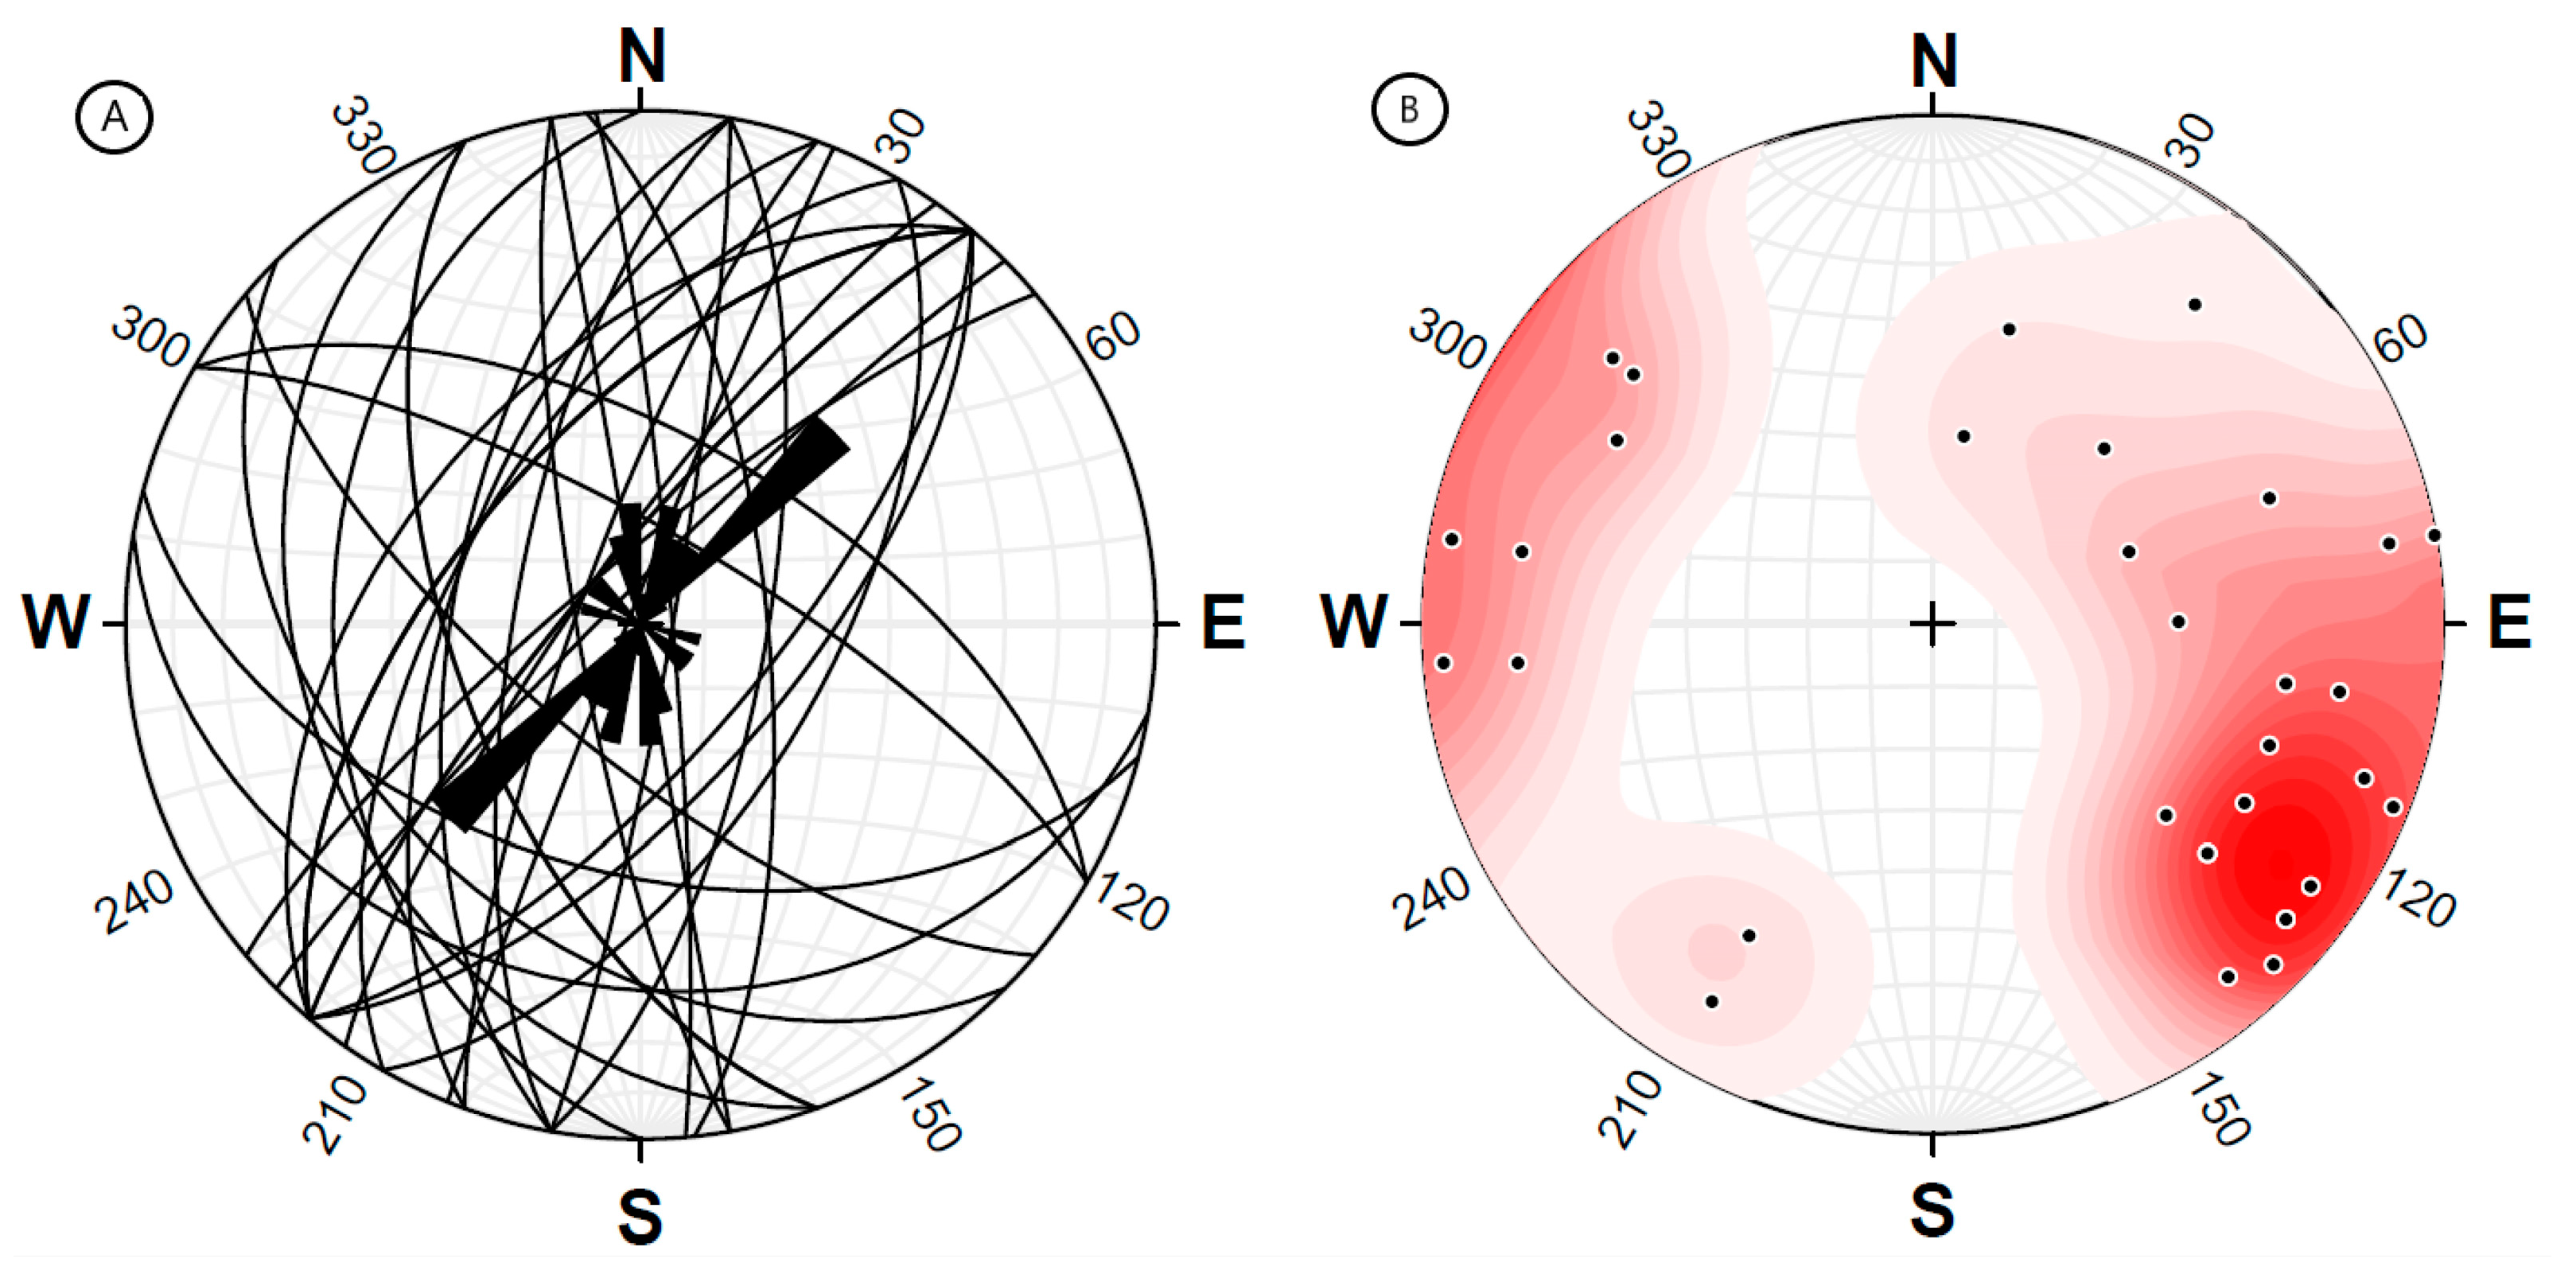
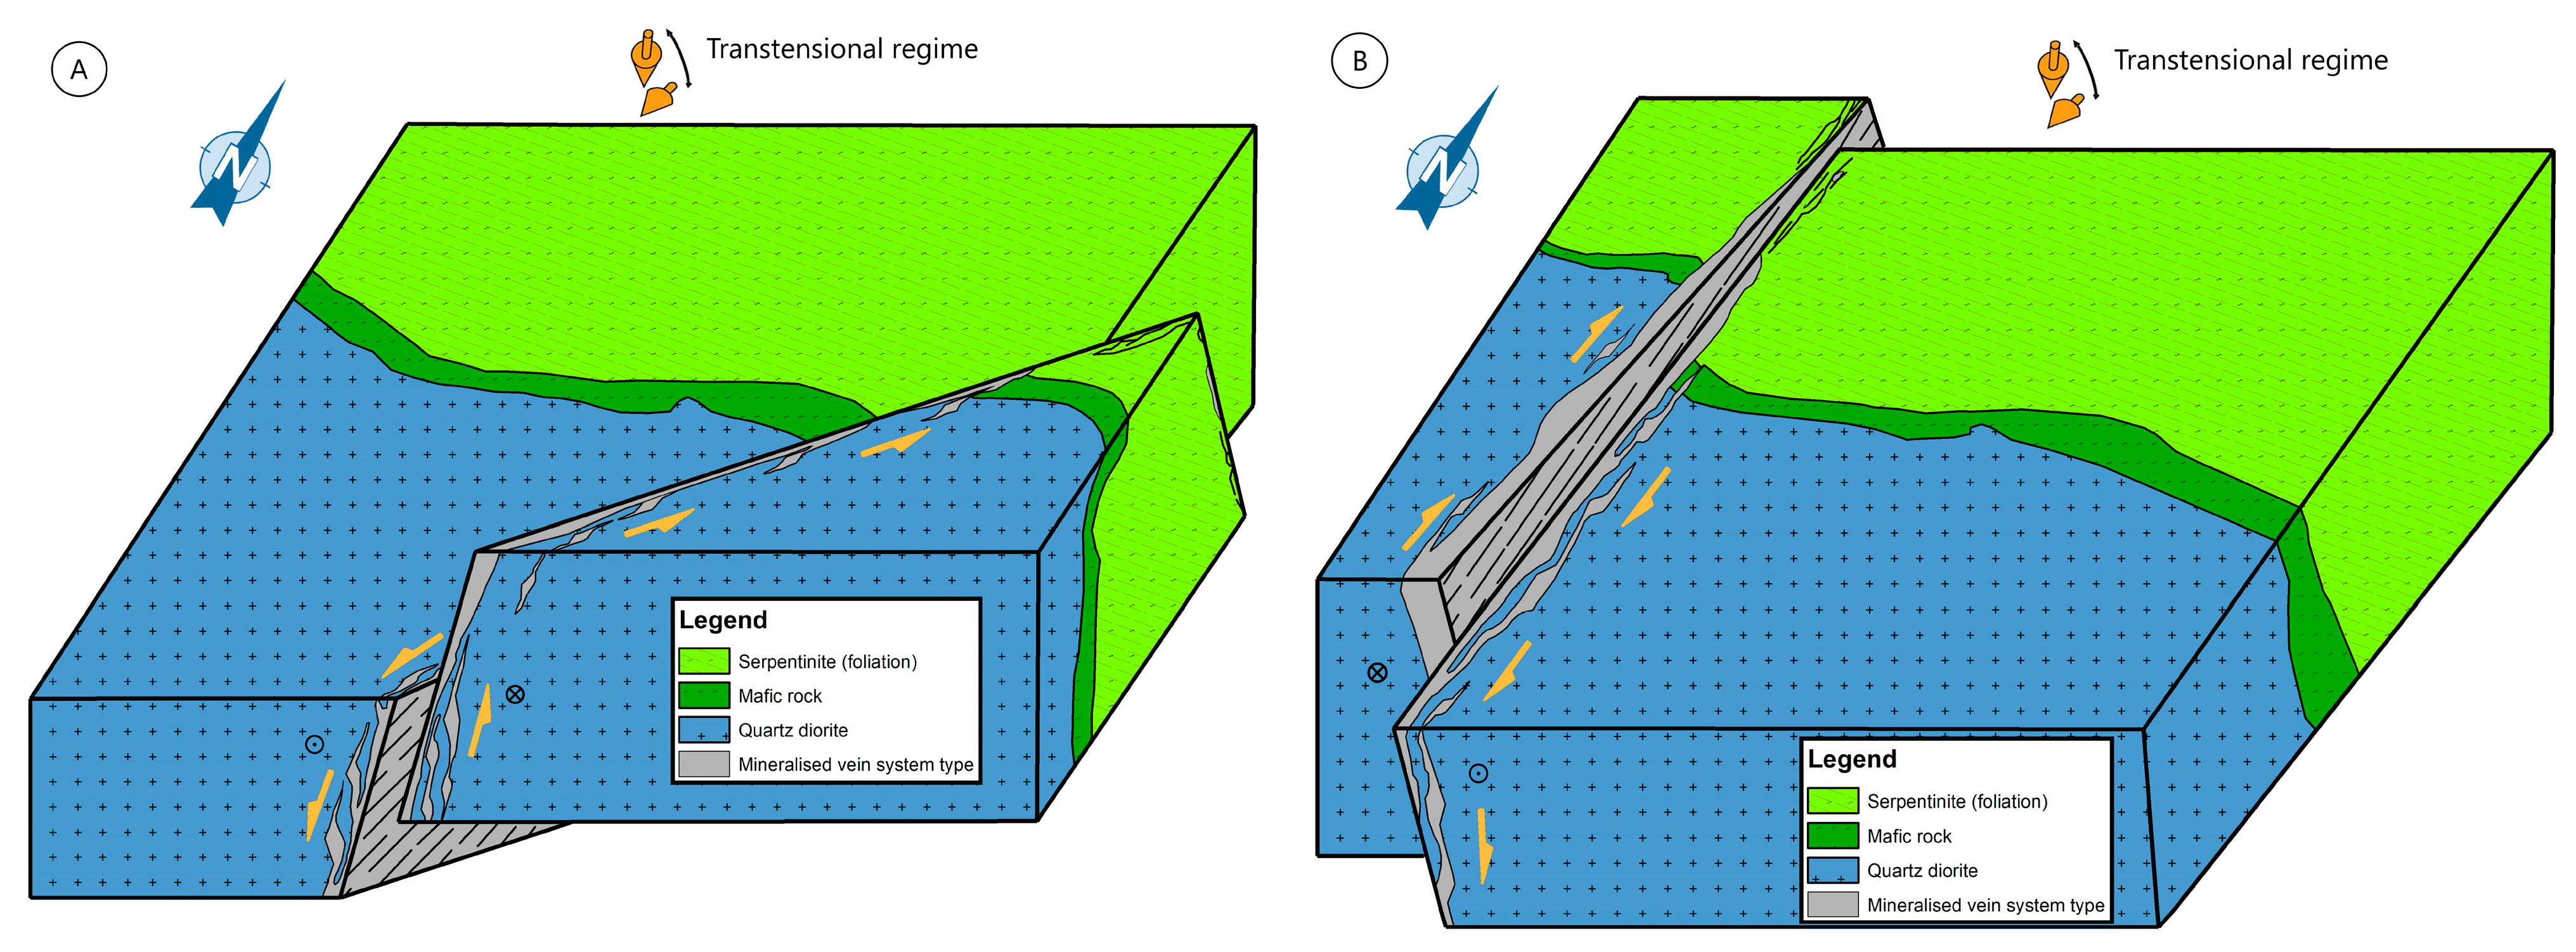
It should be noted that the vein system at the level of the cobaltiferous deposit of Bou Azzer presents numerous movement criteria which diverge according to the orientation of the vein. Measurements taken in situ and ex situ have shown that the veins tend mainly from N10° to N70° E with a main dip towards W or NW, respectively, and values close to 60–80° (
Figure 8). Indeed, the veins oriented N70° E are associated with a left lateral movement [
55] (
Figure 9A), while those oriented N-S present a right lateral movement [
55] (
Figure 9B).
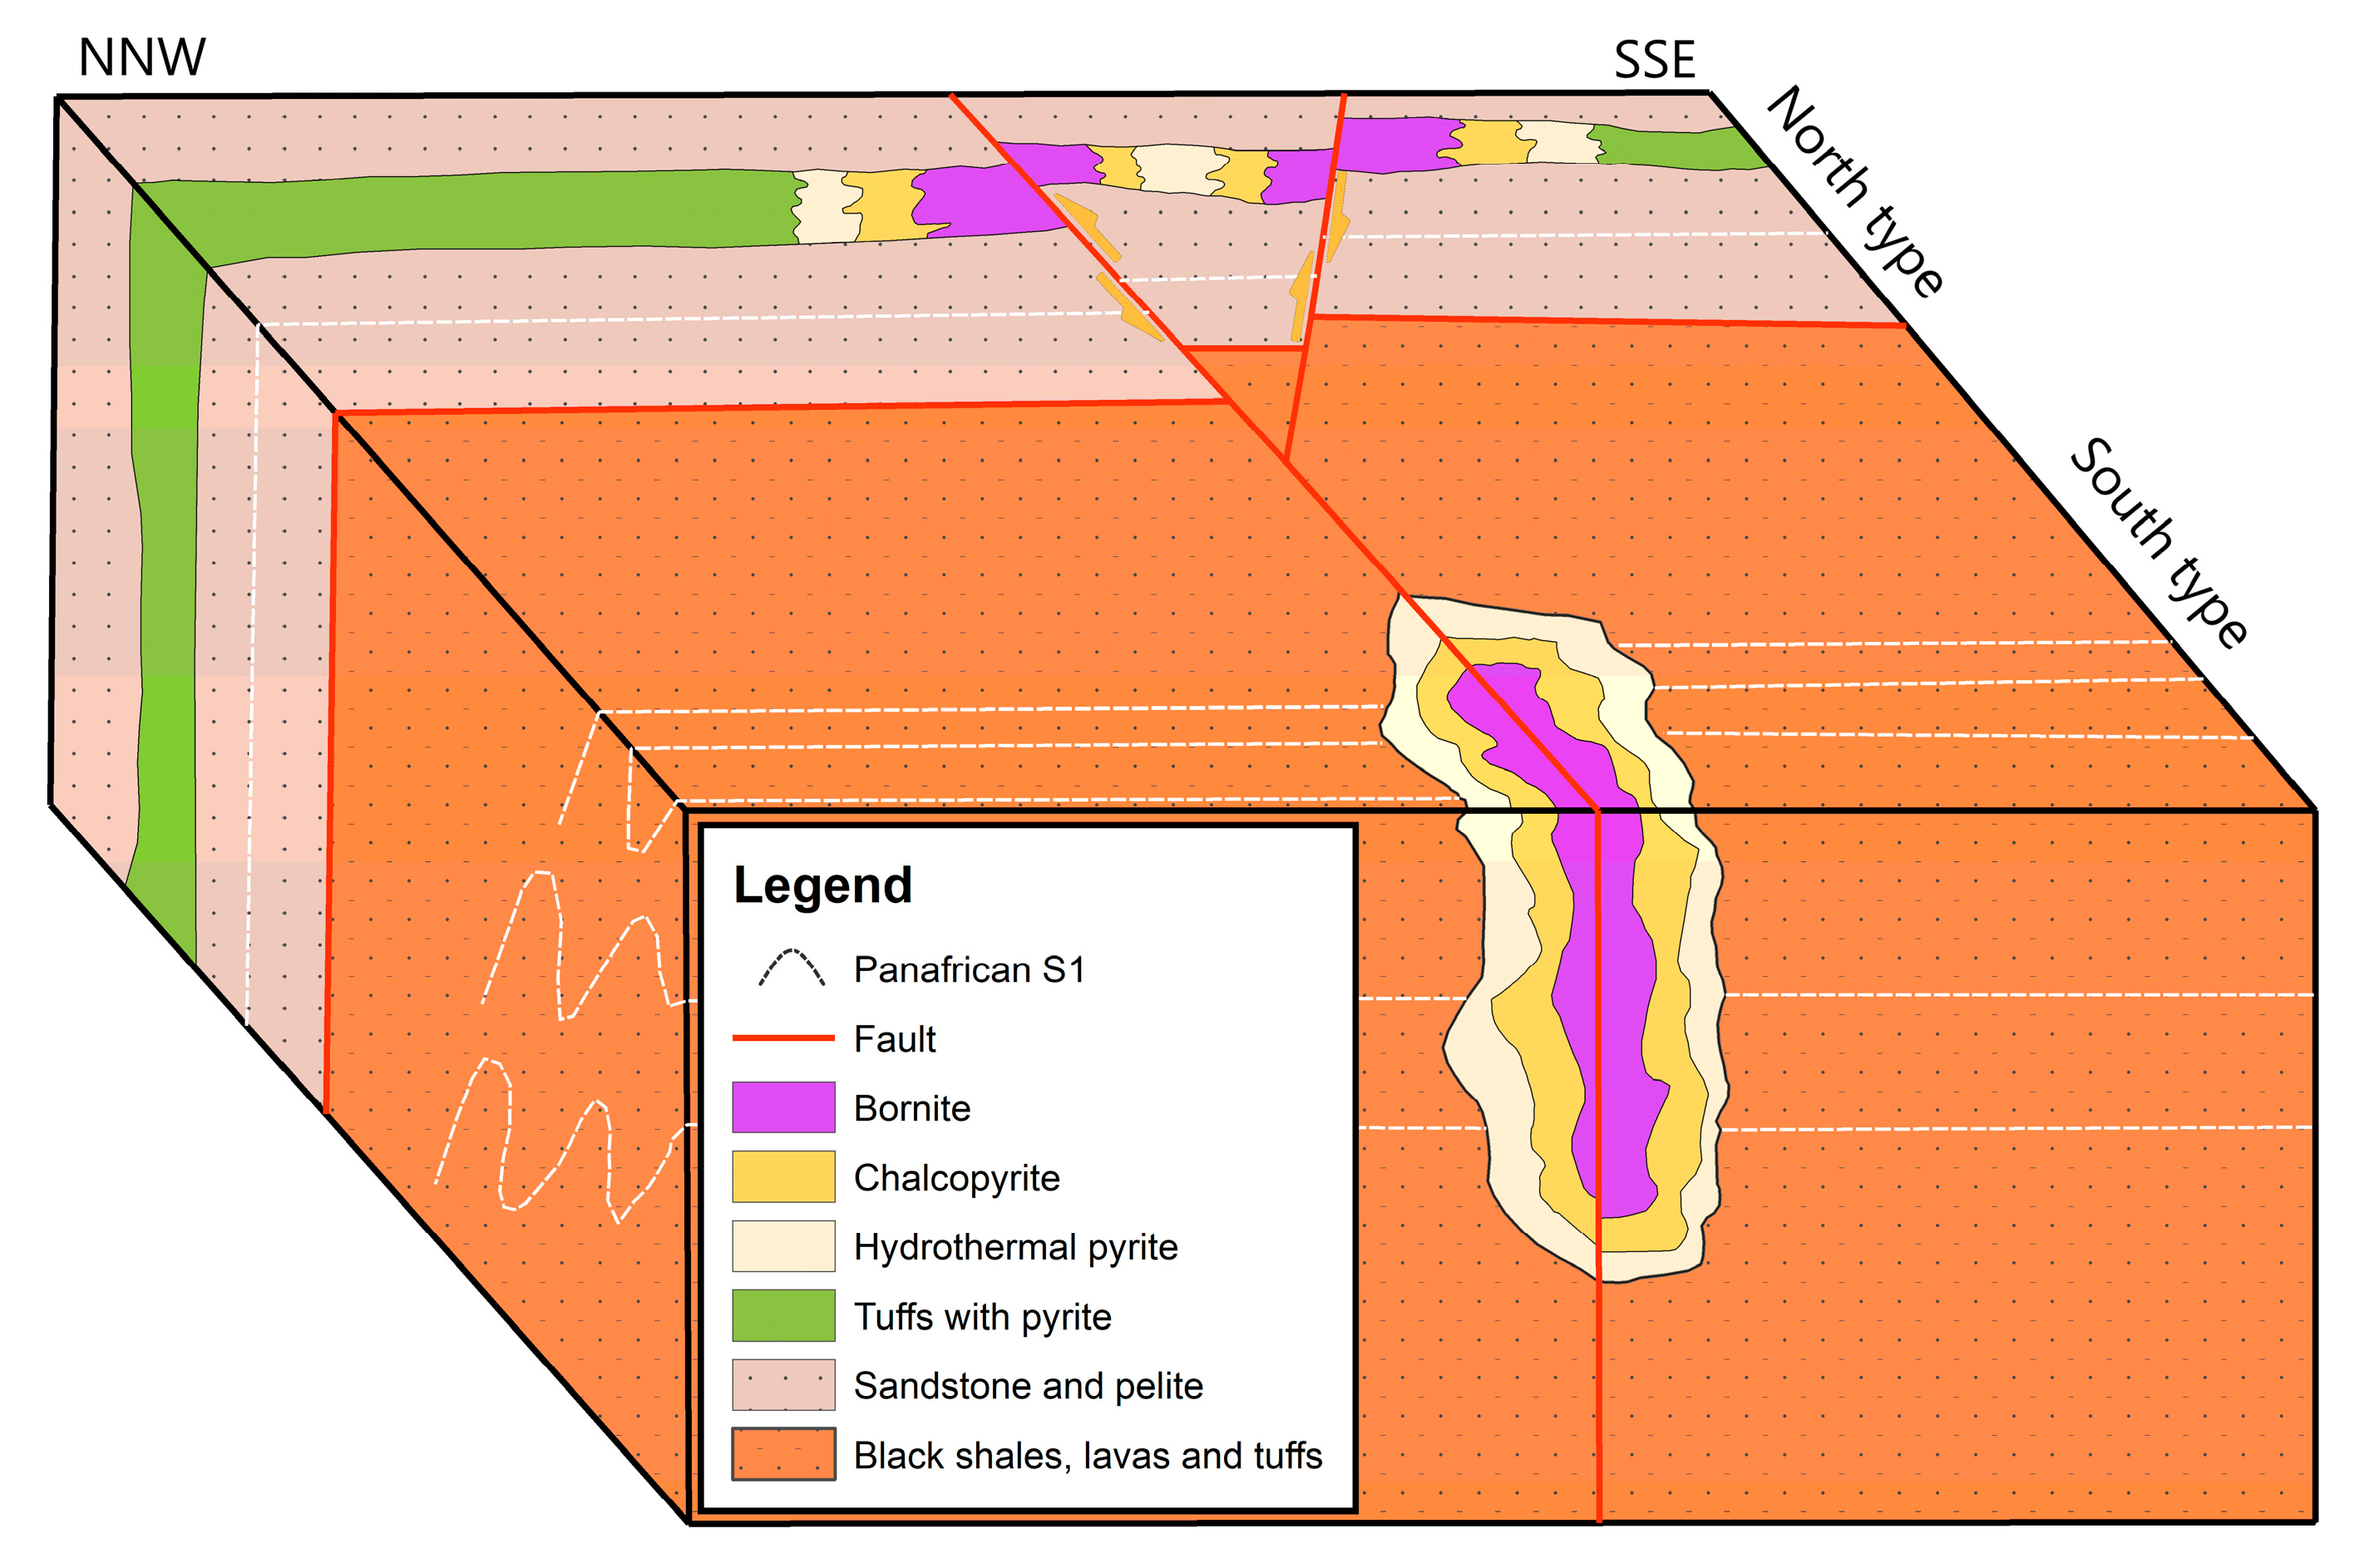
The copper mineralization at the level of the Bleïda mining district located SE of the inlier is associated with brittle, secant faults on the Pan-African structures. These faults are in the N070° direction with left-lateral movement [
56] (
Figure 10).
Faults trending N110 at 130° are associated with a replay zone of Pan-African ductile structures [
56] (
Figure 10). These faults would constitute a feeder zone for copper-rich fluids then circulating in the N070° faults and precipitating copper sulfides along these faults.
5. Conclusions
The GTA conducted in the central Anti-Atlas, particularly in the Bou Azzer inlier, using high-resolution aeromagnetic data, proved beneficial and allowed us to address several issues. It identified several favorable areas for mineralization, and helped to solve part of the mystery regarding the polarity of the subduction plane.
The geophysical study with GTA in the Bou Azzer inlier revealed the presence of several positive and negative anomalies. The main positive anomaly, occupying the core region of the investigated area, is directly related to serpentinized oceanic rocks, while the other positive anomalies are associated with basic intrusions. The detected negative anomalies are closely related either to quartz diorites or to the Adoudounian sedimentary cover.
In terms of structural analysis, the investigation conducted using geological and geophysical data was able to confirm the results obtained in previous studies. Several fault families were identified, namely WNW-ESE and ENE-WSW families associated to the Pan-African episode, and the NE-SW family related to the post-orogenic episode, thus confirming the previously mentioned polyphase tectonics.
Regarding the mineralized structures, this study demonstrates that the vein system is undoubtedly controlled by the NE-SW faults, while the massive mineralization follow the WNW-ESE family. The Bou Azzer inlier lives up to its reputation as a premier metallogenic province, as the conducted study highlighted several zones that showed promising indicators, encouraging future detailed prospecting campaigns to confirm the obtained results.
The use of findings from previous studies like [
20,
24,
57] has proven to be effective, as it has highlighted several promising zones characterized by high structural complexity and strong alterability. We have detected a zone closely related to mantle rocks known for their cobalt enrichment. Another zone has also attracted interest, as it is associated with the basic complex of the Tachdamt-Bleïda platform, where a copper mineralization in the form of lenses is present.
Therefore, we recommend tightening the grid spacing in future geophysical surveys to achieve higher resolution, and conducting reconnaissance drilling in the areas deemed favorable for mineralization. Additionally, we suggest applying other geophysical methods such as gravimetry, electromagnetism, and electrical surveys to accurately cross-reference different geophysical signatures.


 ,
, 