1. Introduction
Earth fissures are linear tensile fissures with a certain extension length that develop on the Earth’s surface and may be accompanied by vertical fissures. They are affected by various complex factors such as internal and external forces and human activities [
1]. Earth fissures have developed widely around the world and occur in the United States, Mexico, Africa, Europe, and throughout most of China [
2,
3]. Thus, the formation and development of earth fissures seriously affect infrastructure construction and restrict national economies [
4].
The study of earth fissures began in 1929 [
5,
6], and humans have been studying earth fissures for a century. The first step in preventing and controlling earth fissure hazards is to identify the mechanisms of their formation and evolution. There are many factors affecting the formation of earth fissures, and the explanations of the formation mechanisms of earth fissures by domestic and foreign scholars can mainly be divided into three categories: ground subsidence induced by tectonic genesis [
7,
8], groundwater genesis [
9,
10,
11], and structural and groundwater compound genesis [
12,
13,
14]. Among them, China is one of the countries whose earth fissures have an enormous scale of development, the broadest distribution, and the most substantial phenomenon of surface damage caused by earth fissures. Since 2000, more than 5000 earth fissures have been discovered in China, mainly in the Fenwei Basin, the Hebei Plain, and the Su-Xi-Chang area (
Figure 1) [
15]. Compared to the other two regions, the planar spread of the earth fissures within the Fenwei Basin is the longest and most active. There have been many excellent results and consensus on the distribution pattern, activity characteristics, and genesis mechanisms of fissures in the Fenwei Basin [
16,
17,
18,
19,
20,
21,
22,
23,
24,
25,
26,
27,
28].
The existence and activity of earth fissures do not only cause direct damage to surrounding structures, but when an earthquake occurs, the presence of earth fissures can change and even increase the seismic response of the site, causing the structures near the earth fissures to suffer severe damage or even be destroyed. Thus far, research on the development, distribution characteristics, and formation mechanisms of earth fissures all over the world has produced results, but our understanding of the dynamic effects of earth fissure sites is insufficient. Several studies have investigated the dynamic effects of earth fissures under earthquake loads based on numerical simulations [
29,
30], and others have used indoor simulation experiments to explore the influence of earth fissures on the dynamic response of a site [
31,
32,
33,
34,
35], but the existing results are few and unsystematic and are not sufficient to guide engineering practice. Therefore, in terms of the specifications for site investigation and engineering design on Xi’an ground fractures (DBJ61-6-2006), [
36] only regards the seismic effects of earth fissure sites as a general site threat in accordance with the code for the seismic design of buildings (GB50011-2010) [
37]. Furthermore, because there are no systematic measurement data on the seismic response of earth fissure sites, in order to study this problem it is necessary to develop new ideas and appropriate methods.
A microtremor is a kind of constant micro-movement that has no specific seismic source and can be observed at any time, and its amplitude is generally only a few microns. Microtremor studies originated in the 1950s. Kanao and Tamaka [
38] quantitatively analyzed the nature of microtremor surface waves. After this, many research works were carried out on the microtremor sources, formation mechanisms, and waveforms of microtremors [
39,
40,
41,
42]. In the late 1960s, Toksoz and Lacoss used a seismic network to separate, extract, and analyze the various periodic components of microtremors [
43,
44] and reported on the components of the different bands of the microtremors and their possible causes. In the 1990s, Nakamura proposed a new microtremor method [
45]. This horizontal-to-vertical spectral ratio (H/V) method has gradually become the focus of the analysis of site dynamics around the world. Many scholars have tried to explain the theoretical basis of this method from different angles [
46,
47]. In 1994, Lermo and Chavez-Garcia [
48] summarized the three main types of microtremor analysis methods and concluded that the H/V method could effectively eliminate the source effect. Since then, the H/V method has been widely used in the field of engineering. Many scholars in China have also contributed to the microtremor theory and practical engineering applications [
49,
50,
51]. A large number of studies have shown that microtremor movement is an efficient, economical, and convenient method for testing the dynamic characteristics of a site which contains a large amount of site soil structure information that can be used as field measurement data. Moreover, the microtremor test has initially been applied to the topic of the dynamic effect of earth fissure sites [
52,
53], and the study showed that the existence of earth fissures does indeed aggravate the vibration intensity of the site.
The Yuncheng Basin is an important part of the Fenwei Basin and contains the most well-developed earth fissures in China. The earth fissures in the Yuncheng Basin have caused serious disasters, and have become the most notable geological disaster in this area. Furthermore, the basin has a large population, developed agriculture, and industry, and the earth fissures not only cause direct damage to local roads and houses, but also severely restrict the construction of urban infrastructure, and thus they restrict the economic and social development of the Yuncheng Basin. The results of this study provide theoretical support for the development of seismic fortification and avoidance measures for the earth fissure sites in this area.
2. Regional Structure
From north to south, the Fenwei graben system consists of the Datong Basin, the Xinding Basin, the Taiyuan Basin, the Linfen Basin, the Yuncheng Basin, the Weihe Basin, and several other large fault basins (
Figure 1). The Yuncheng Basin is located in the southwestern part of Shanxi Province and has a total area of 4885 km
2.
The Yuncheng Basin is a Cenozoic faulted basin superimposed on the multi-cyclic superimposed Ordos Basin. The sedimentary strata have been deformed by multiple tectonic movements and have experienced multiple tectonic periods, such as the Yanshanian and Himalayan movements. A representative large rift basin formed later [
27]. The basic framework of the Zhongtiao mountain uplift area and the Emei platform uplift area in the basin was laid by the strong tectonic movement in the Yanshanian period, and it was mainly affected by the Himalayan movement during the Paleogene. Large-scale fault block tectonic movement occurred in this area. The tectonic setting of the basin has changed from a compressive and twisting thrust fault to a tension and twisting normal fault, and the embryonic form of the basin has been modified since then. The main structural deformations preserved today include a fault system in the Himalayan strike-slip extensional background [
2].
The main forms of tectonic movement in the Yuncheng Basin are faults. The Basin was controlled by the Yanshan movement in the Mesozoic era, the Himalayan movement in the Cenozoic era, and especially by tectonic movement since the Late Cenozoic era, and therefore fault structures have been well-developed in the basin. The main active fault in the basin is the large fault on the northwest side of Zhongtiao mountain, which is also the main controlling boundary fault in the Yuncheng Basin [
25]. There are eight active faults in the basin, with NE, NEE, and NNE strikes. They enclose the boundaries of the Yuncheng Basin and the secondary structural units inside the basin, and they mutually restrict and control the structural framework of the basin [
27]. The Yuncheng Basin is bordered by the Emei Platform to the west, and the Zhongtiao mountains to the southeast. The NE-trending Mingtiaogang in the middle of the basin divides the Yuncheng Basin into the Sushui river plain and the Qinglong river plain. The basin is an asymmetrical sag basin that is deep in the south and shallow in the north.
The basin contains a large amount of Cenozoic strata, accounting for about 80% of the total area, and the thickness of the strata increases from the northeast to the southwest. The thickness of the Cenozoic strata in the basin is generally greater than 1000 m, and the Quaternary sediments are also more than 300 m thick. This loose, thick sedimentary layer provided the material basis for the extensive development of earth fissures.
In general, factors such as the uplift of the horst in the Yuncheng basin, the faulted basement, the over-exploitation of groundwater, and the loose, thick sedimentary layer have laid the foundation for the development of earth fissures in the basin.
3. Characteristics of the Earth Fissures in the Yuncheng Basin
The development of earth fissures is controlled by tectonic movement. The earth fissures in a basin are mainly affected by the secondary structural units. The Yuncheng Basin has been affected by the Himalayan tectonic movement since the Cenozoic era. Due to the control of the faults at the northern foot of the Zhongtiao mountain, the basement has been in a faulted extensional environment. Under the strong tectonic activity of the Zhongtiao mountain fault, the secondary structural unit in the basin was controlled, which intensified the uplift of the block and caused the formation of the Mingtiaogang earth fissures. The dip slip extension of the hanging wall normal fault in the basin caused the tension shear cracking of the surface soil layer, which laid the structural foundation for the development of earth fissures in the basin. In addition, since the 1980s, the over-exploitation of groundwater has been severe in this area, causing the groundwater level to continuously fall and the falling funnel to expand year by year, which has induced a large number of earth fissures in the Yuncheng Basin. Thus, the Yuncheng Basin has become the faulted basin with the largest number of earth fissures in Shanxi.
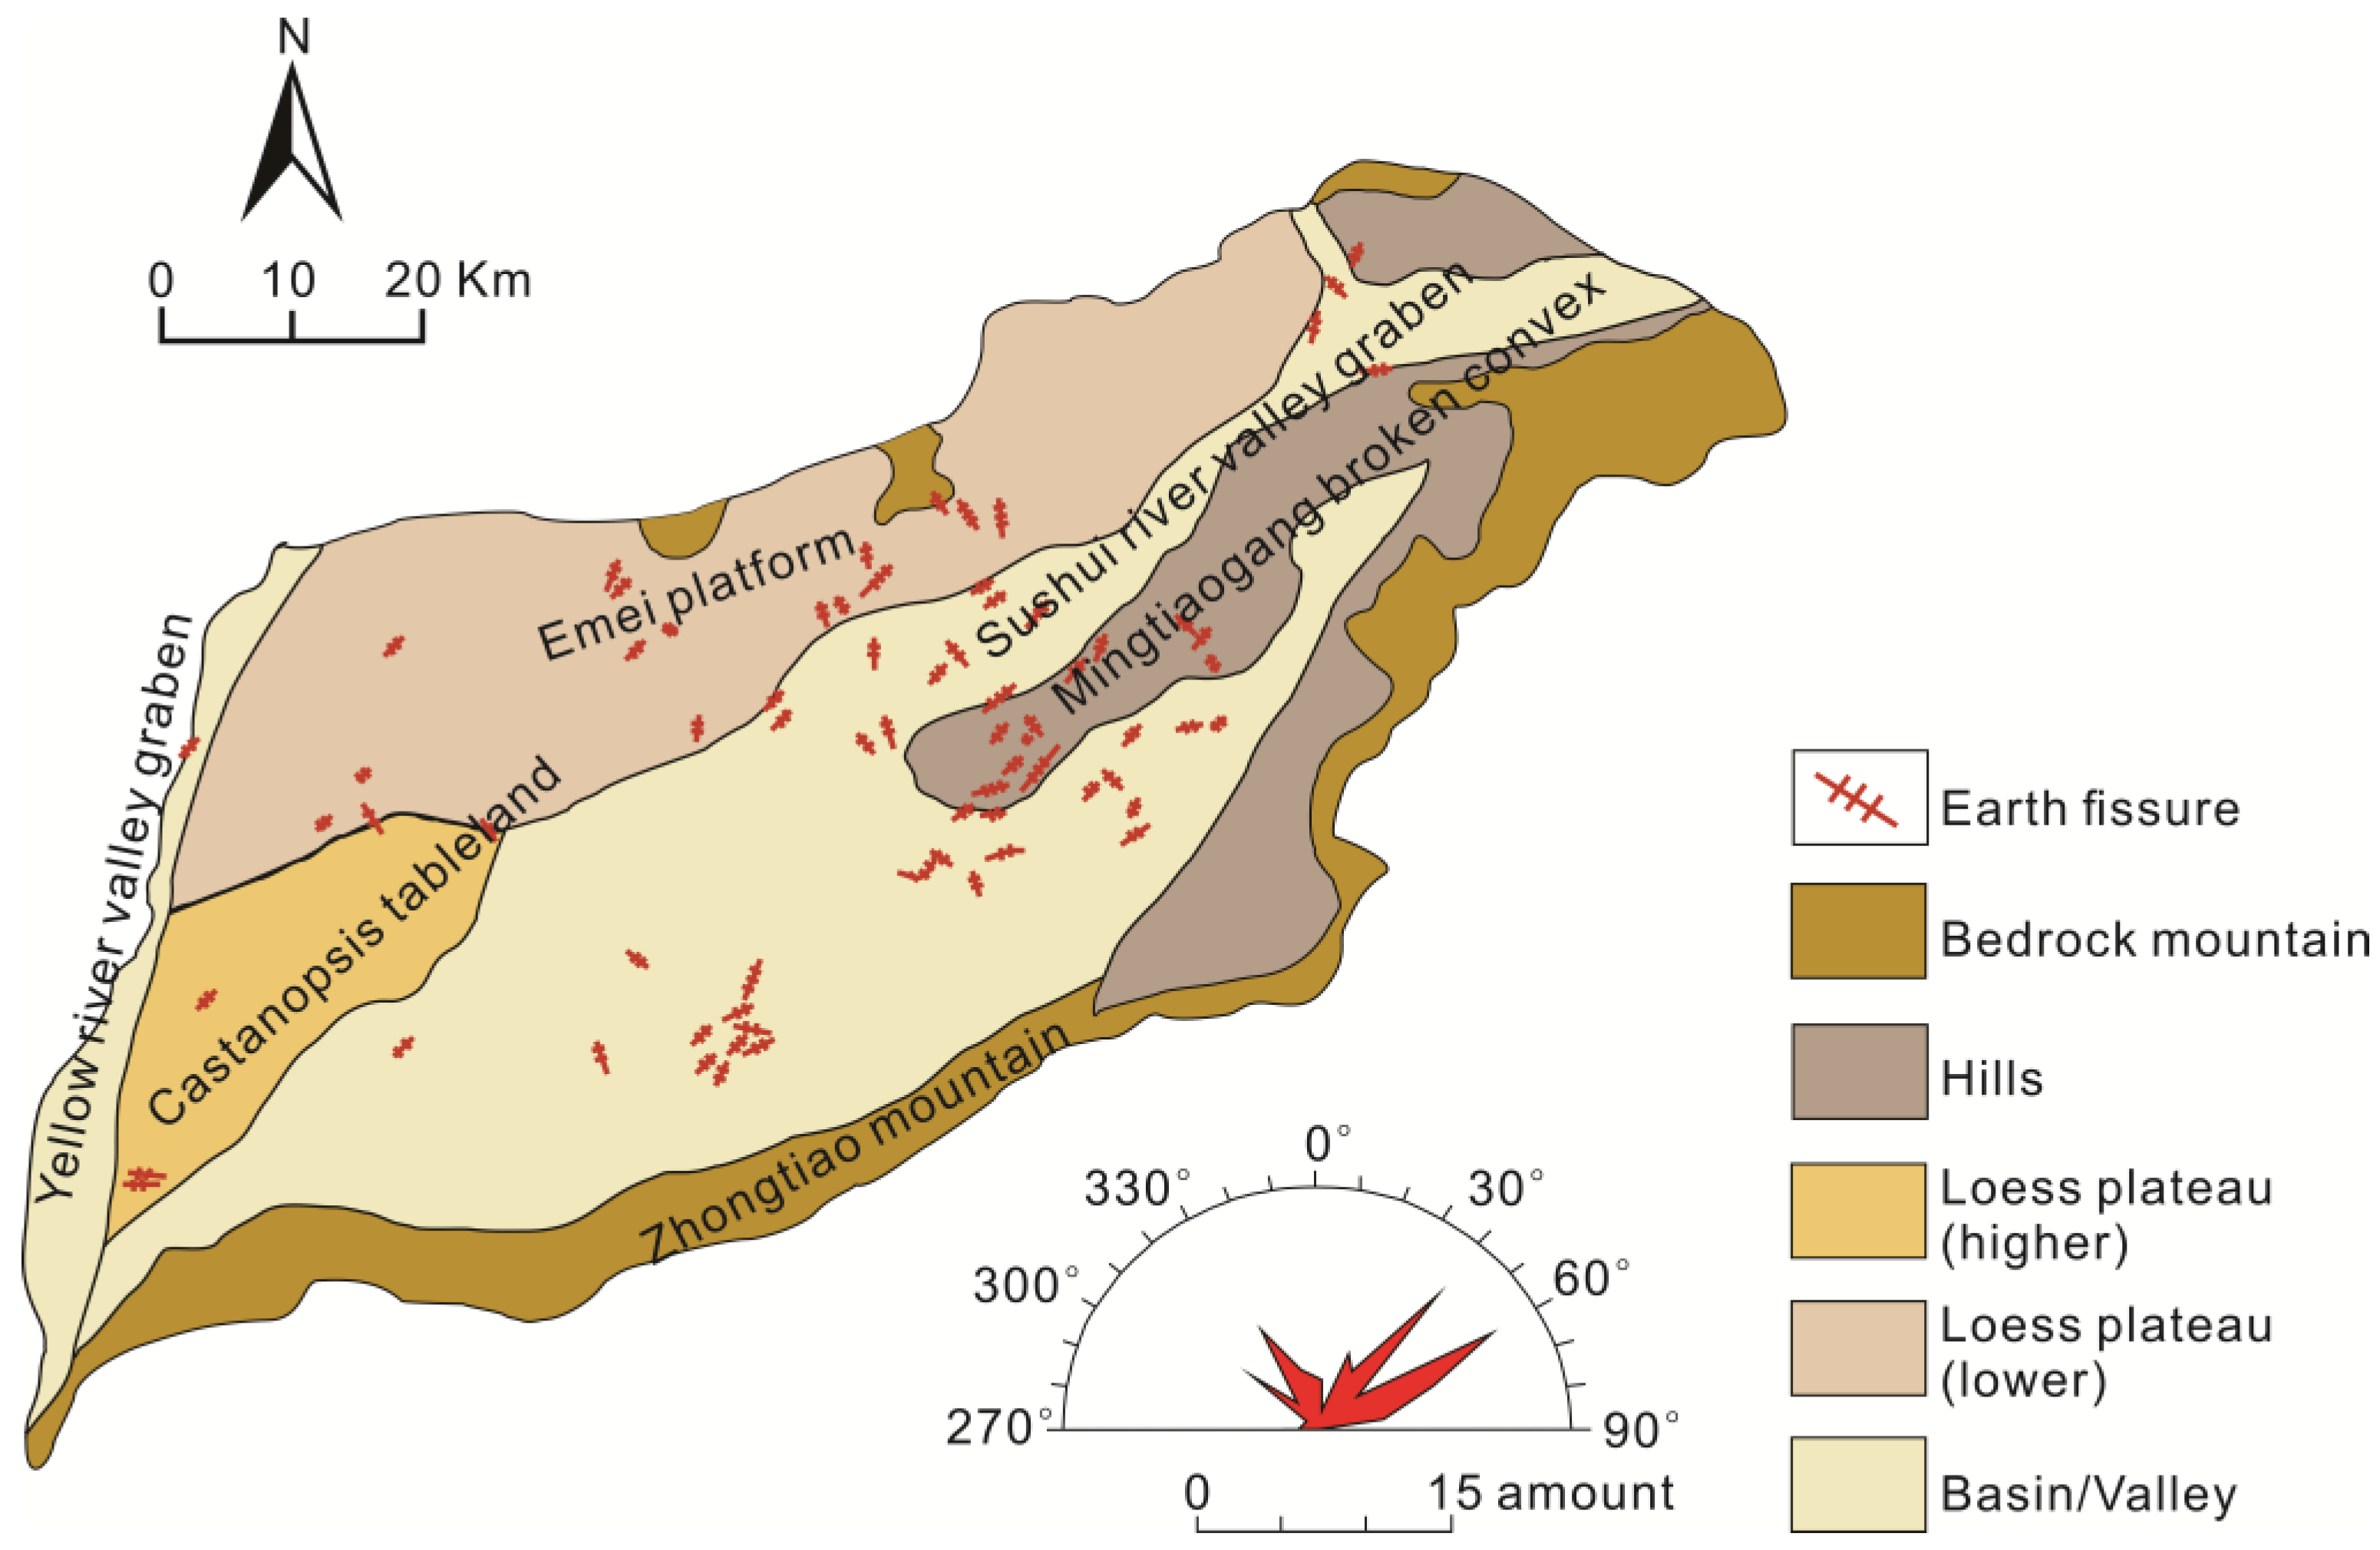
The earth fissures in the basin are mainly distributed on top of and on both sides of the Mingtiaogang uplift within the basin, in the Zhongtiao mountain uplift to the southeast, and in the Emei platform front edge to the north (
Figure 2). The earth fissures in the Yuncheng Basin are distributed along the boundaries of the geomorphology, are concentrated along the fault zone, and are associated with land subsidence. The earth fissures predominantly have NE strikes. According to our survey, the earth fissure disasters in the basin mainly occurred before 1980 and between 1995 and 2005. A total of 119 earth fissures (belts) have developed in the study area. They mainly strike NE and are generally 100–2000 m long, with the longest reaching up to 5000 m. They are generally 0.05–0.5 m wide, and the widest can reach up to 2 m. The small earth fissures account for 45% of the earth fissures (length less than 500 m); the medium earth fissures account for 28% (length between 500 and 1000 m); and the large earth fissures account for 17% (length between 1000 and 5000 m). There is only one giant earth fissure in the basin. It is located in the salt lake district and is 10 km long and 0.3–1 m wide.
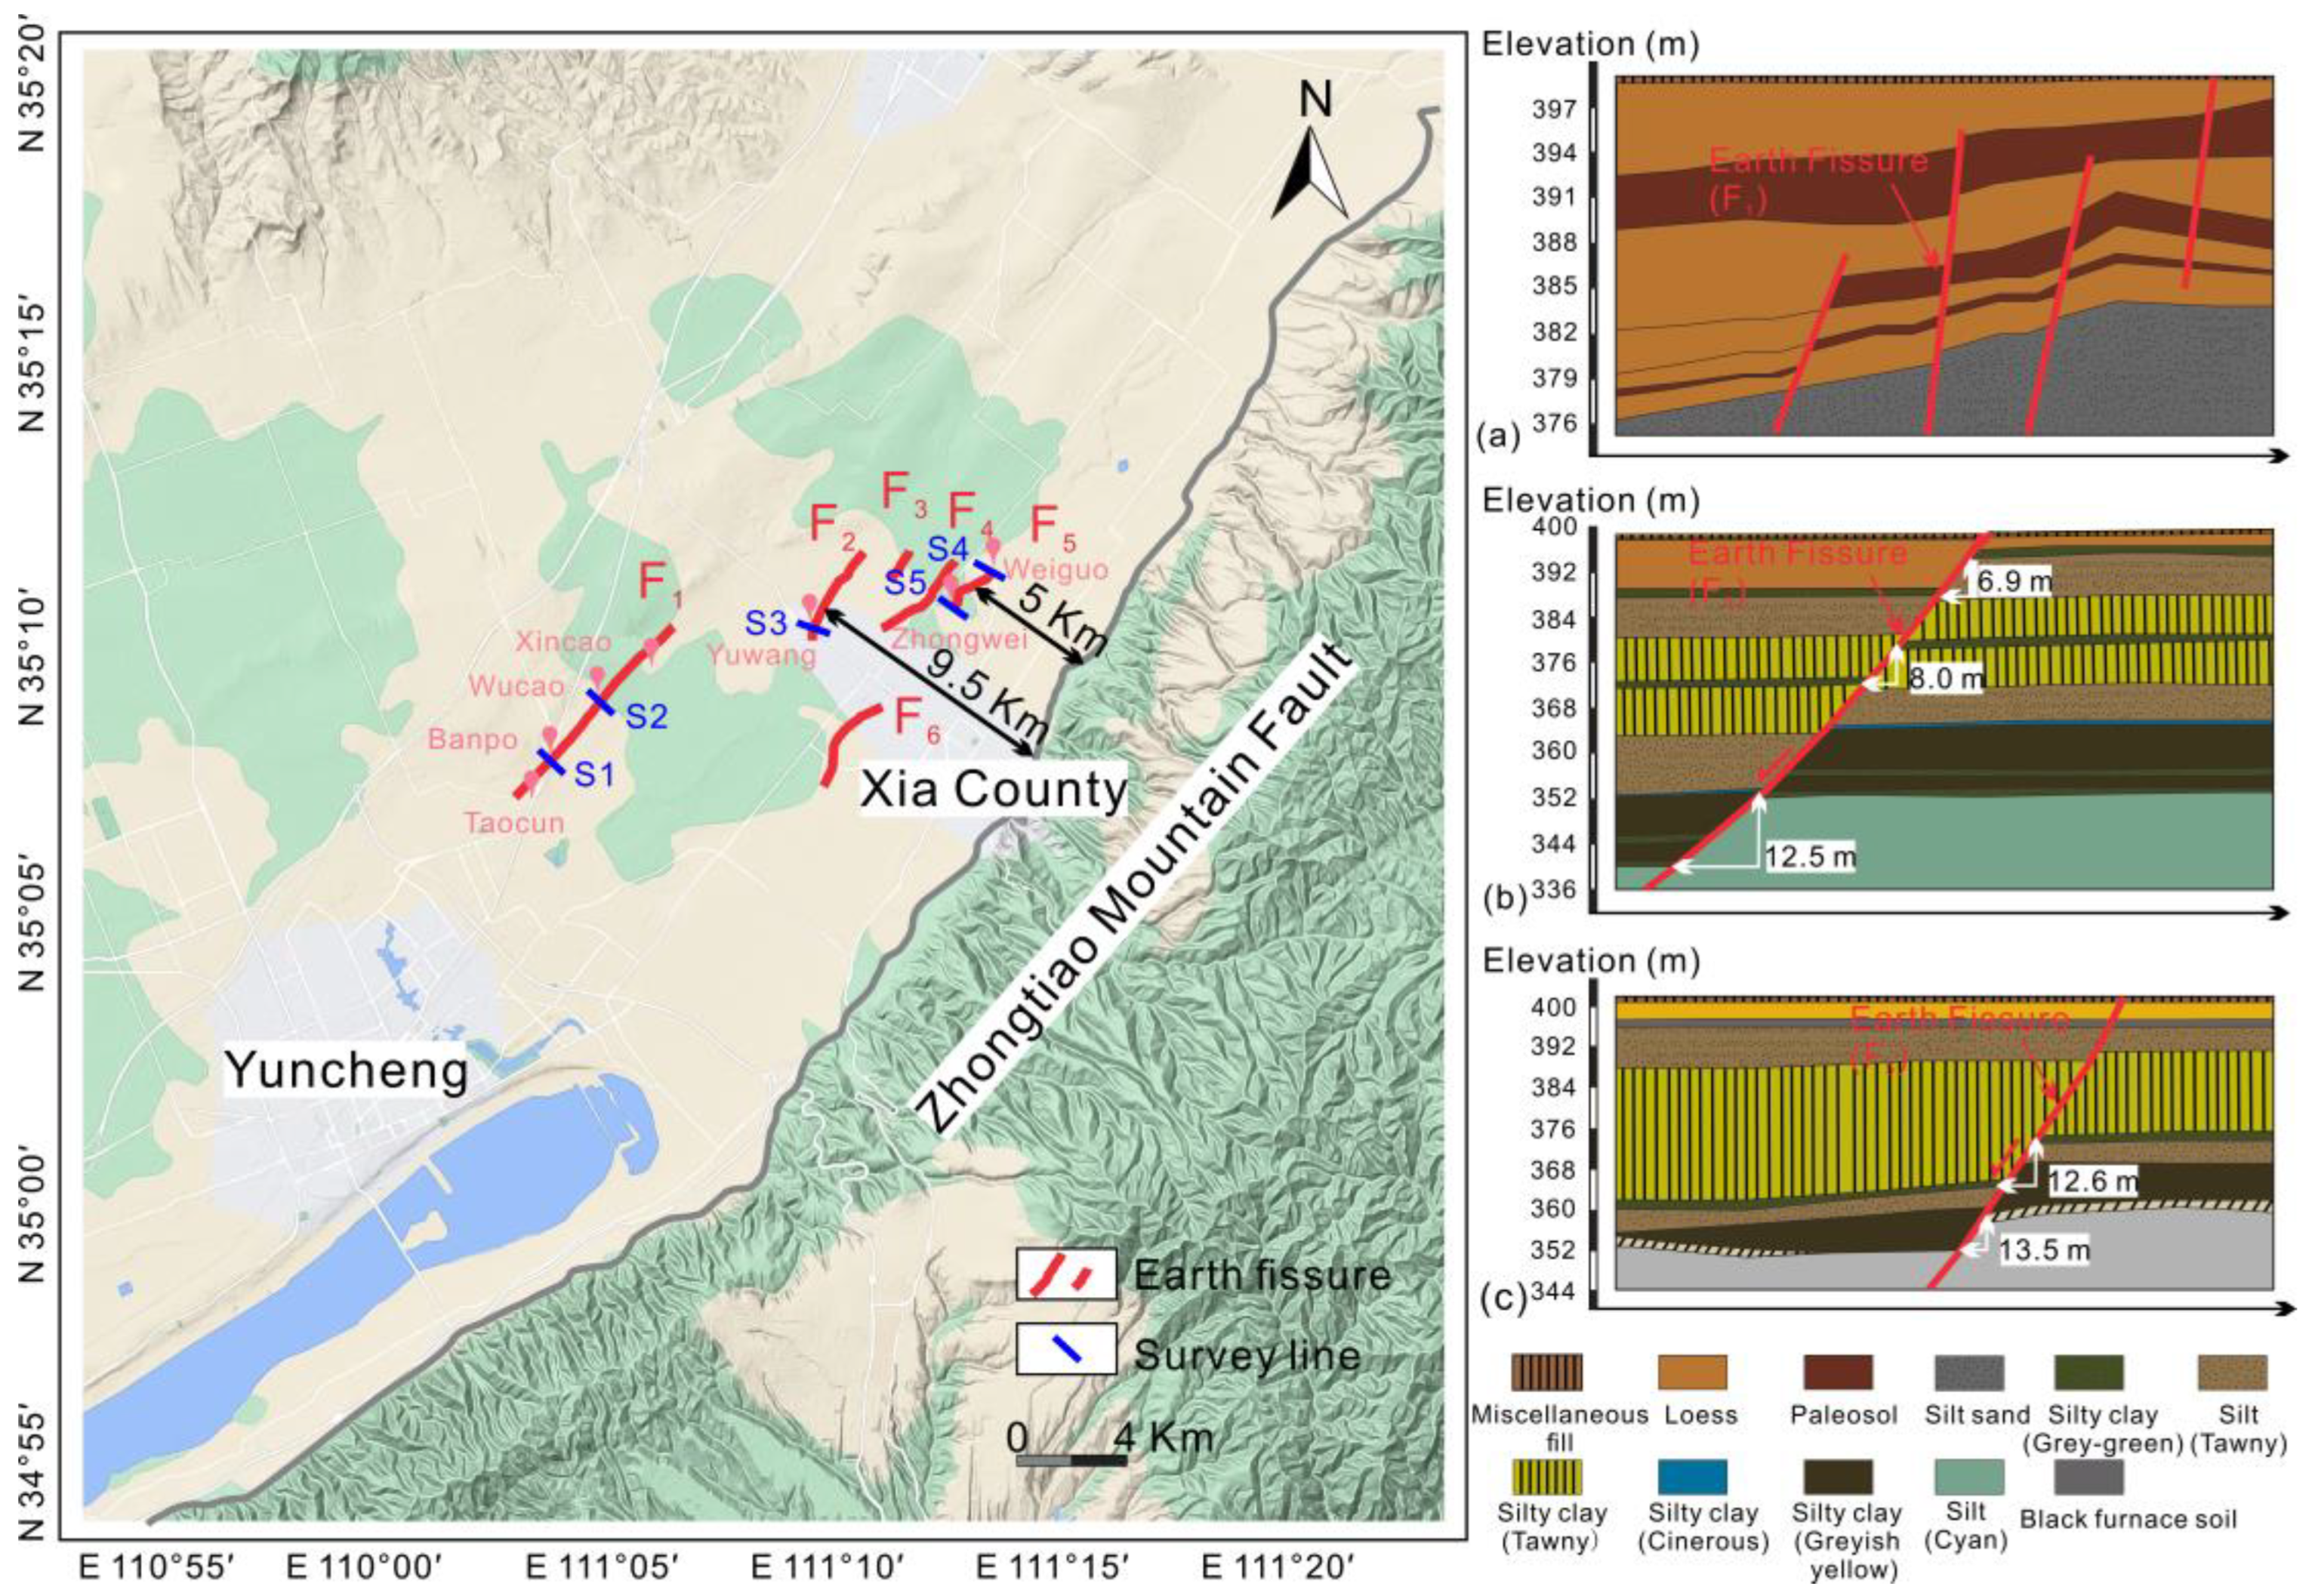
Figure 3 shows six typical earth fissures in the Yuncheng Basin and their profiles. Earth fissure F
1 (Pleistocene earth fissure on the southern margin of the Mingtiaogang uplift) is located in the salt lake district of Yuncheng. It is the only giant earth fissure in the Yuncheng Basin. The earth fissure F
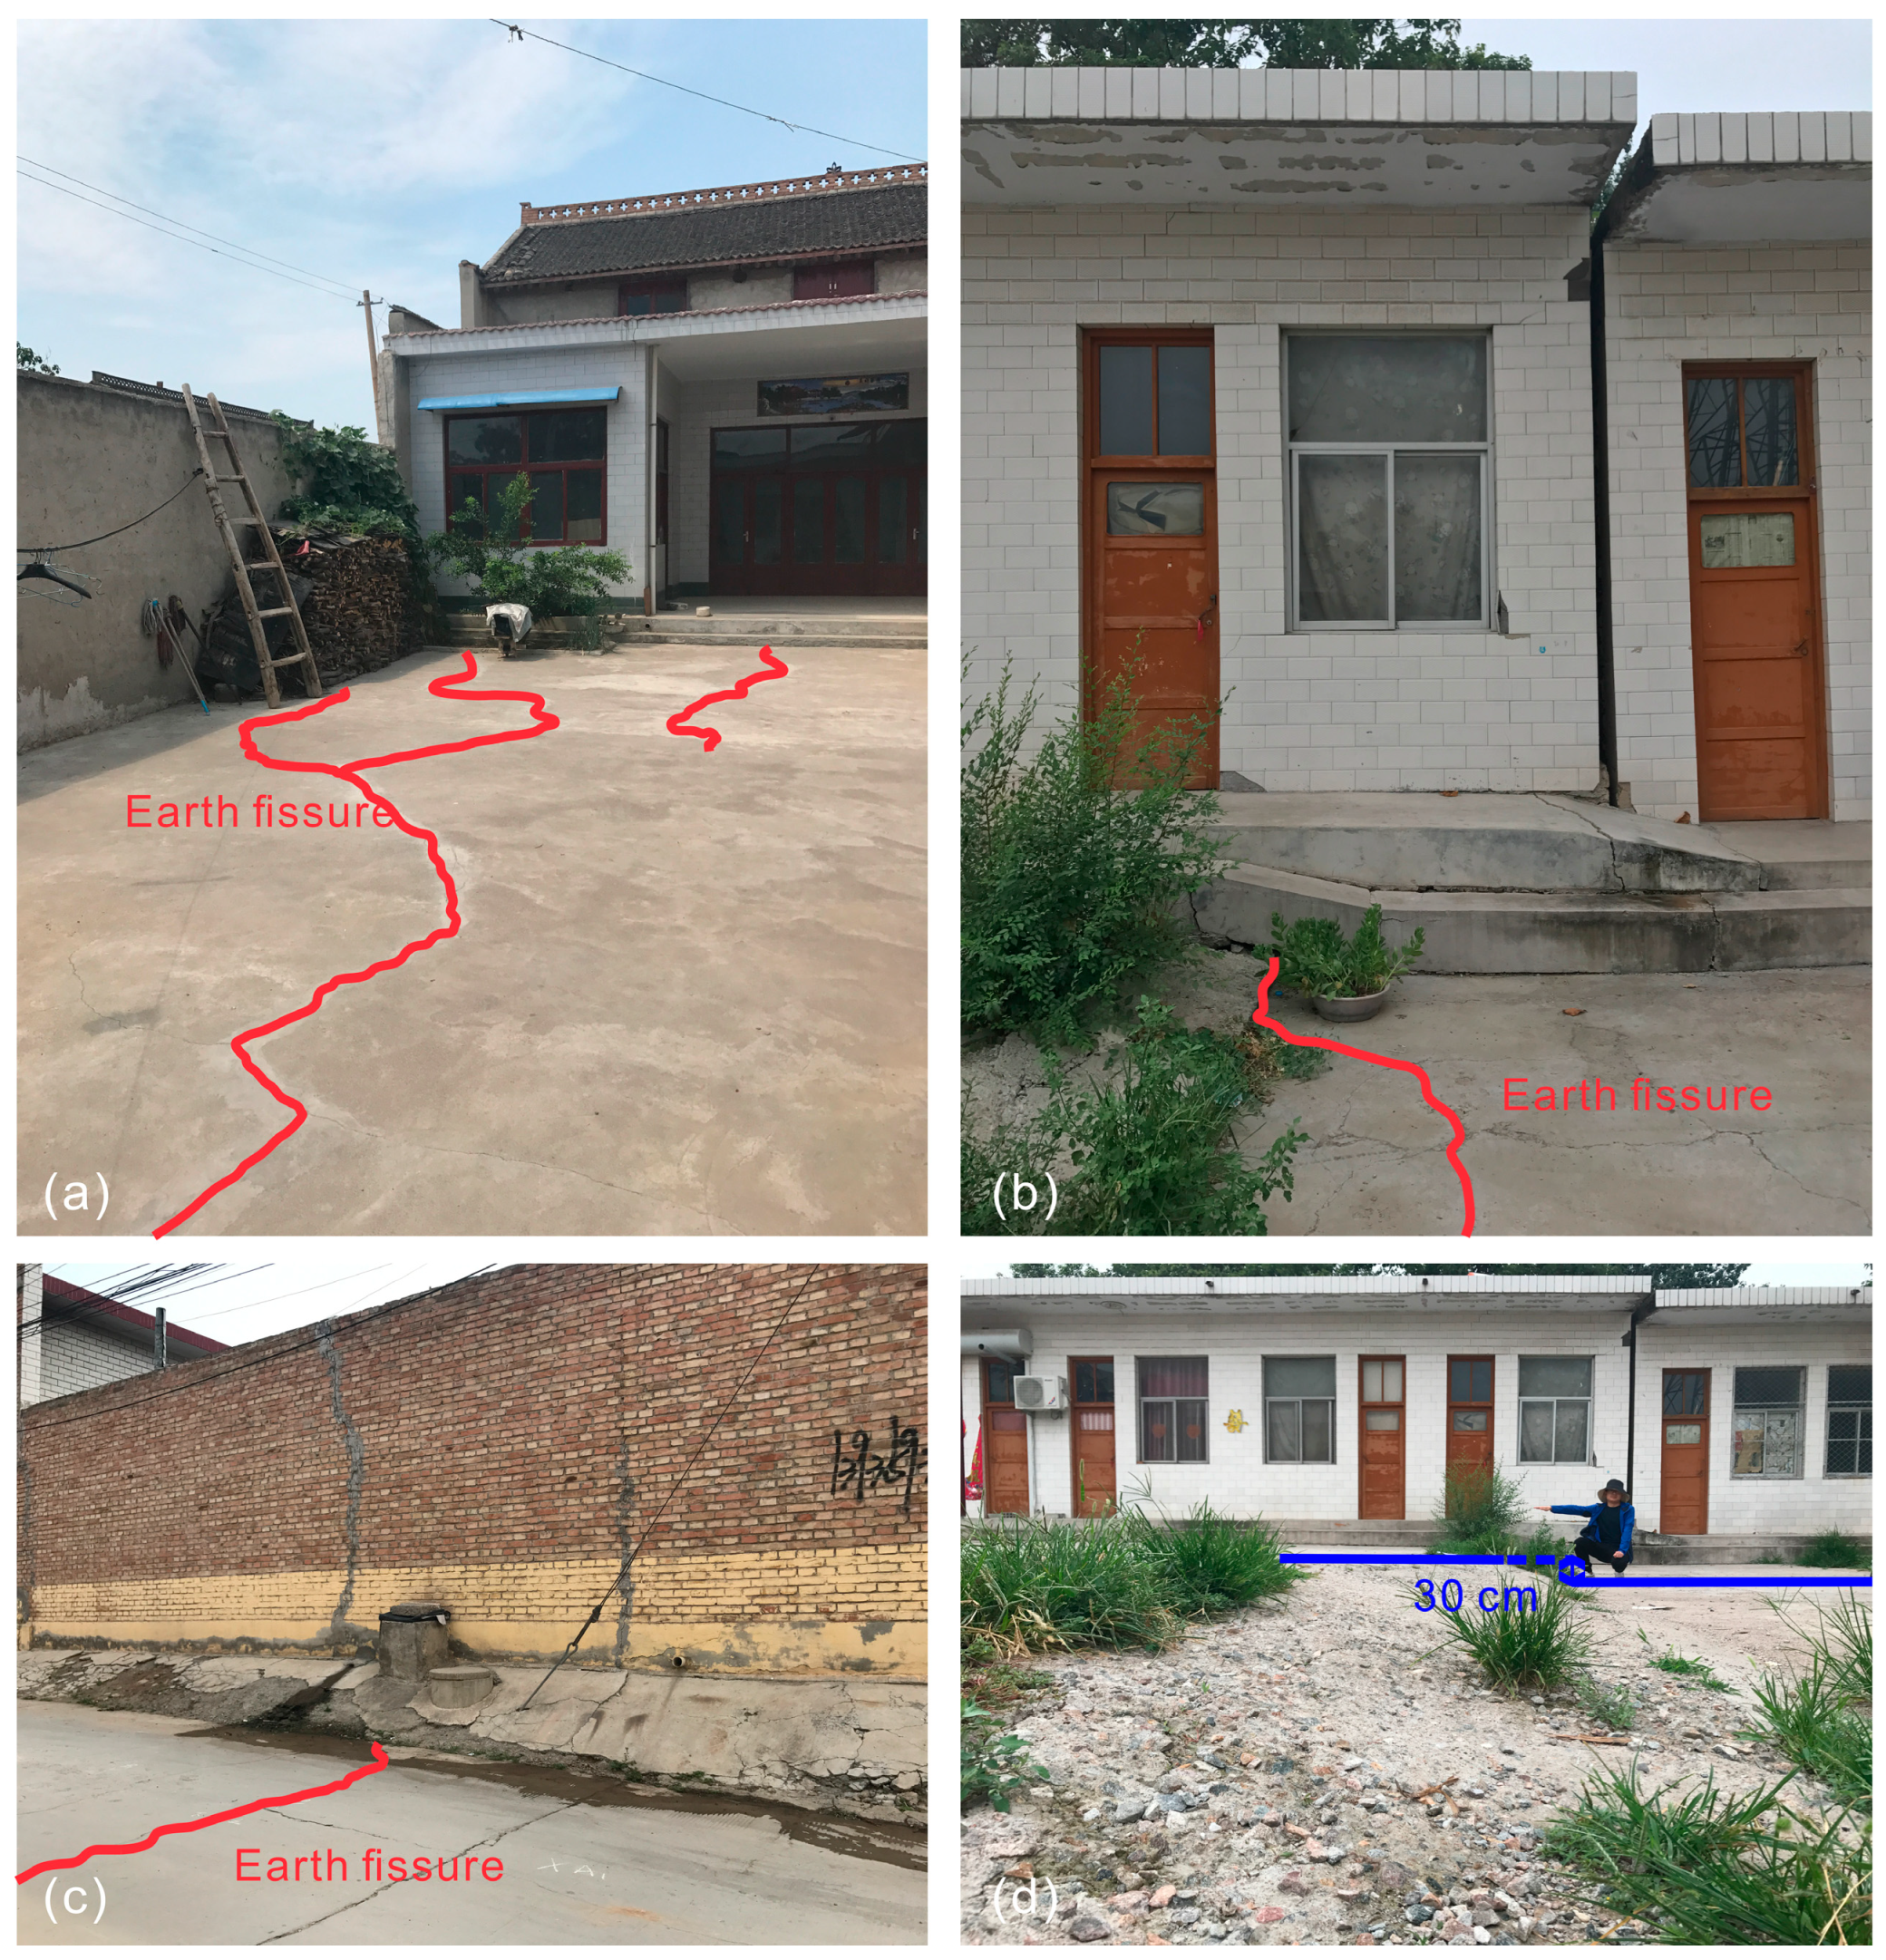
1 appeared in 1975. It has a long extension, large scale, and strong continuity, and is not controlled by the pavement, buildings, or roads along the route. It is 10 km long and crosses Taocun–Banpo–Wucao–Xincao and other villages, and it is very destructive along the strike (
Figure 4a,c). Earth fissure F
1 strikes NE, which is consistent with the active fault in the underlying bedrock. In a plane view, the earth fissure F
1 is longer, and its overall shape is linear. In profile, the site is dominated by loess and paleosol, with secondary fissures on either side of the main fissure symmetrically developed and approximately parallel. The vertical plane of the two sides near the surface of the main fissure is small, and the deep dislocation is large, showing the characteristic of a synsedimentary fault (
Figure 3a).
The Zhongtiao mountain piedmont fault zone is located in the southern part of Xia County. Affected by tectonic movement, the five earth fissures (F
2–F
6) developed in the Xia County area are all distributed on the northwestern side of the Zhongtiao mountain fault zone. The earth fissures are distributed in parallel rows at nearly equal intervals from southeast to northwest (
Figure 3). The earth fissure F
2 is farthest from (i.e., ~9.5 km) the Zhongtiao mountains in Xia County. It has the most significant vertical surface dislocation among the five earth fissures in Xia County. The largest surface vertical dislocation occurs in the playground of Xinmiao Primary School in Yuwang, where the surface dislocation reaches 30 cm (
Figure 4b,d). The earth fissure F
2 appeared in 1998 and developed rapidly from 2007 to 2008. It strikes, which is consistent with the trend of the Zhongtiao mountains, and extends for 3.9 km. Its scale is relatively large. The earth fissure F
2 passes through Yuwang and other places, and it is more destructive along the strike. As can be seen from the cross-section shown in
Figure 3b, the formation is composed of interbedded silt and silty clay, and the vertical dislocation increases with increasing depth. The earth fissure F
5 is 5 km from the Zhongtiao mountain fault zone, making it the closest of the five earth fissures to the fault zone. The earth fissure F
5 starts in Yuguo and ends in Zhongwei. Its overall trend is NE55°, which is consistent with the trend of the Zhongtiao mountains. It extends for about 2.3 km, and the vertical dislocation of the ground surface is 8–20 cm. The earth fissure F
5 appeared in 2000, and it entered a period of rapid development after 2007. It is active and destructive along the strike, and it is still developing. The earth fissure is a tilt-slip tension crack with obvious horizontal extensional movement and vertical differential movement. The differential settlement on both sides of the earth fissure is obvious, and the maximum vertical dislocation is 13.5 m. As can be seen from the cross-section shown in
Figure 3c, the formation is composed of silt and silty clay. The stratum is relatively weak.
4. Microtremor Tests and Analysis
4.1. Survey Line and Data Point Layout
Survey lines were along the previously described earth fissures (F
1, F
2, and F
5). Two survey lines (S1 and S2) were laid in Banpo and Wucao for the earth fissure F
1, only one survey line (S3) was laid in Yuwang for the earth fissure F
2, and one survey line each was laid in Yuguo and Zhongwei (lines S4 and S5, respectively) for the earth fissure F
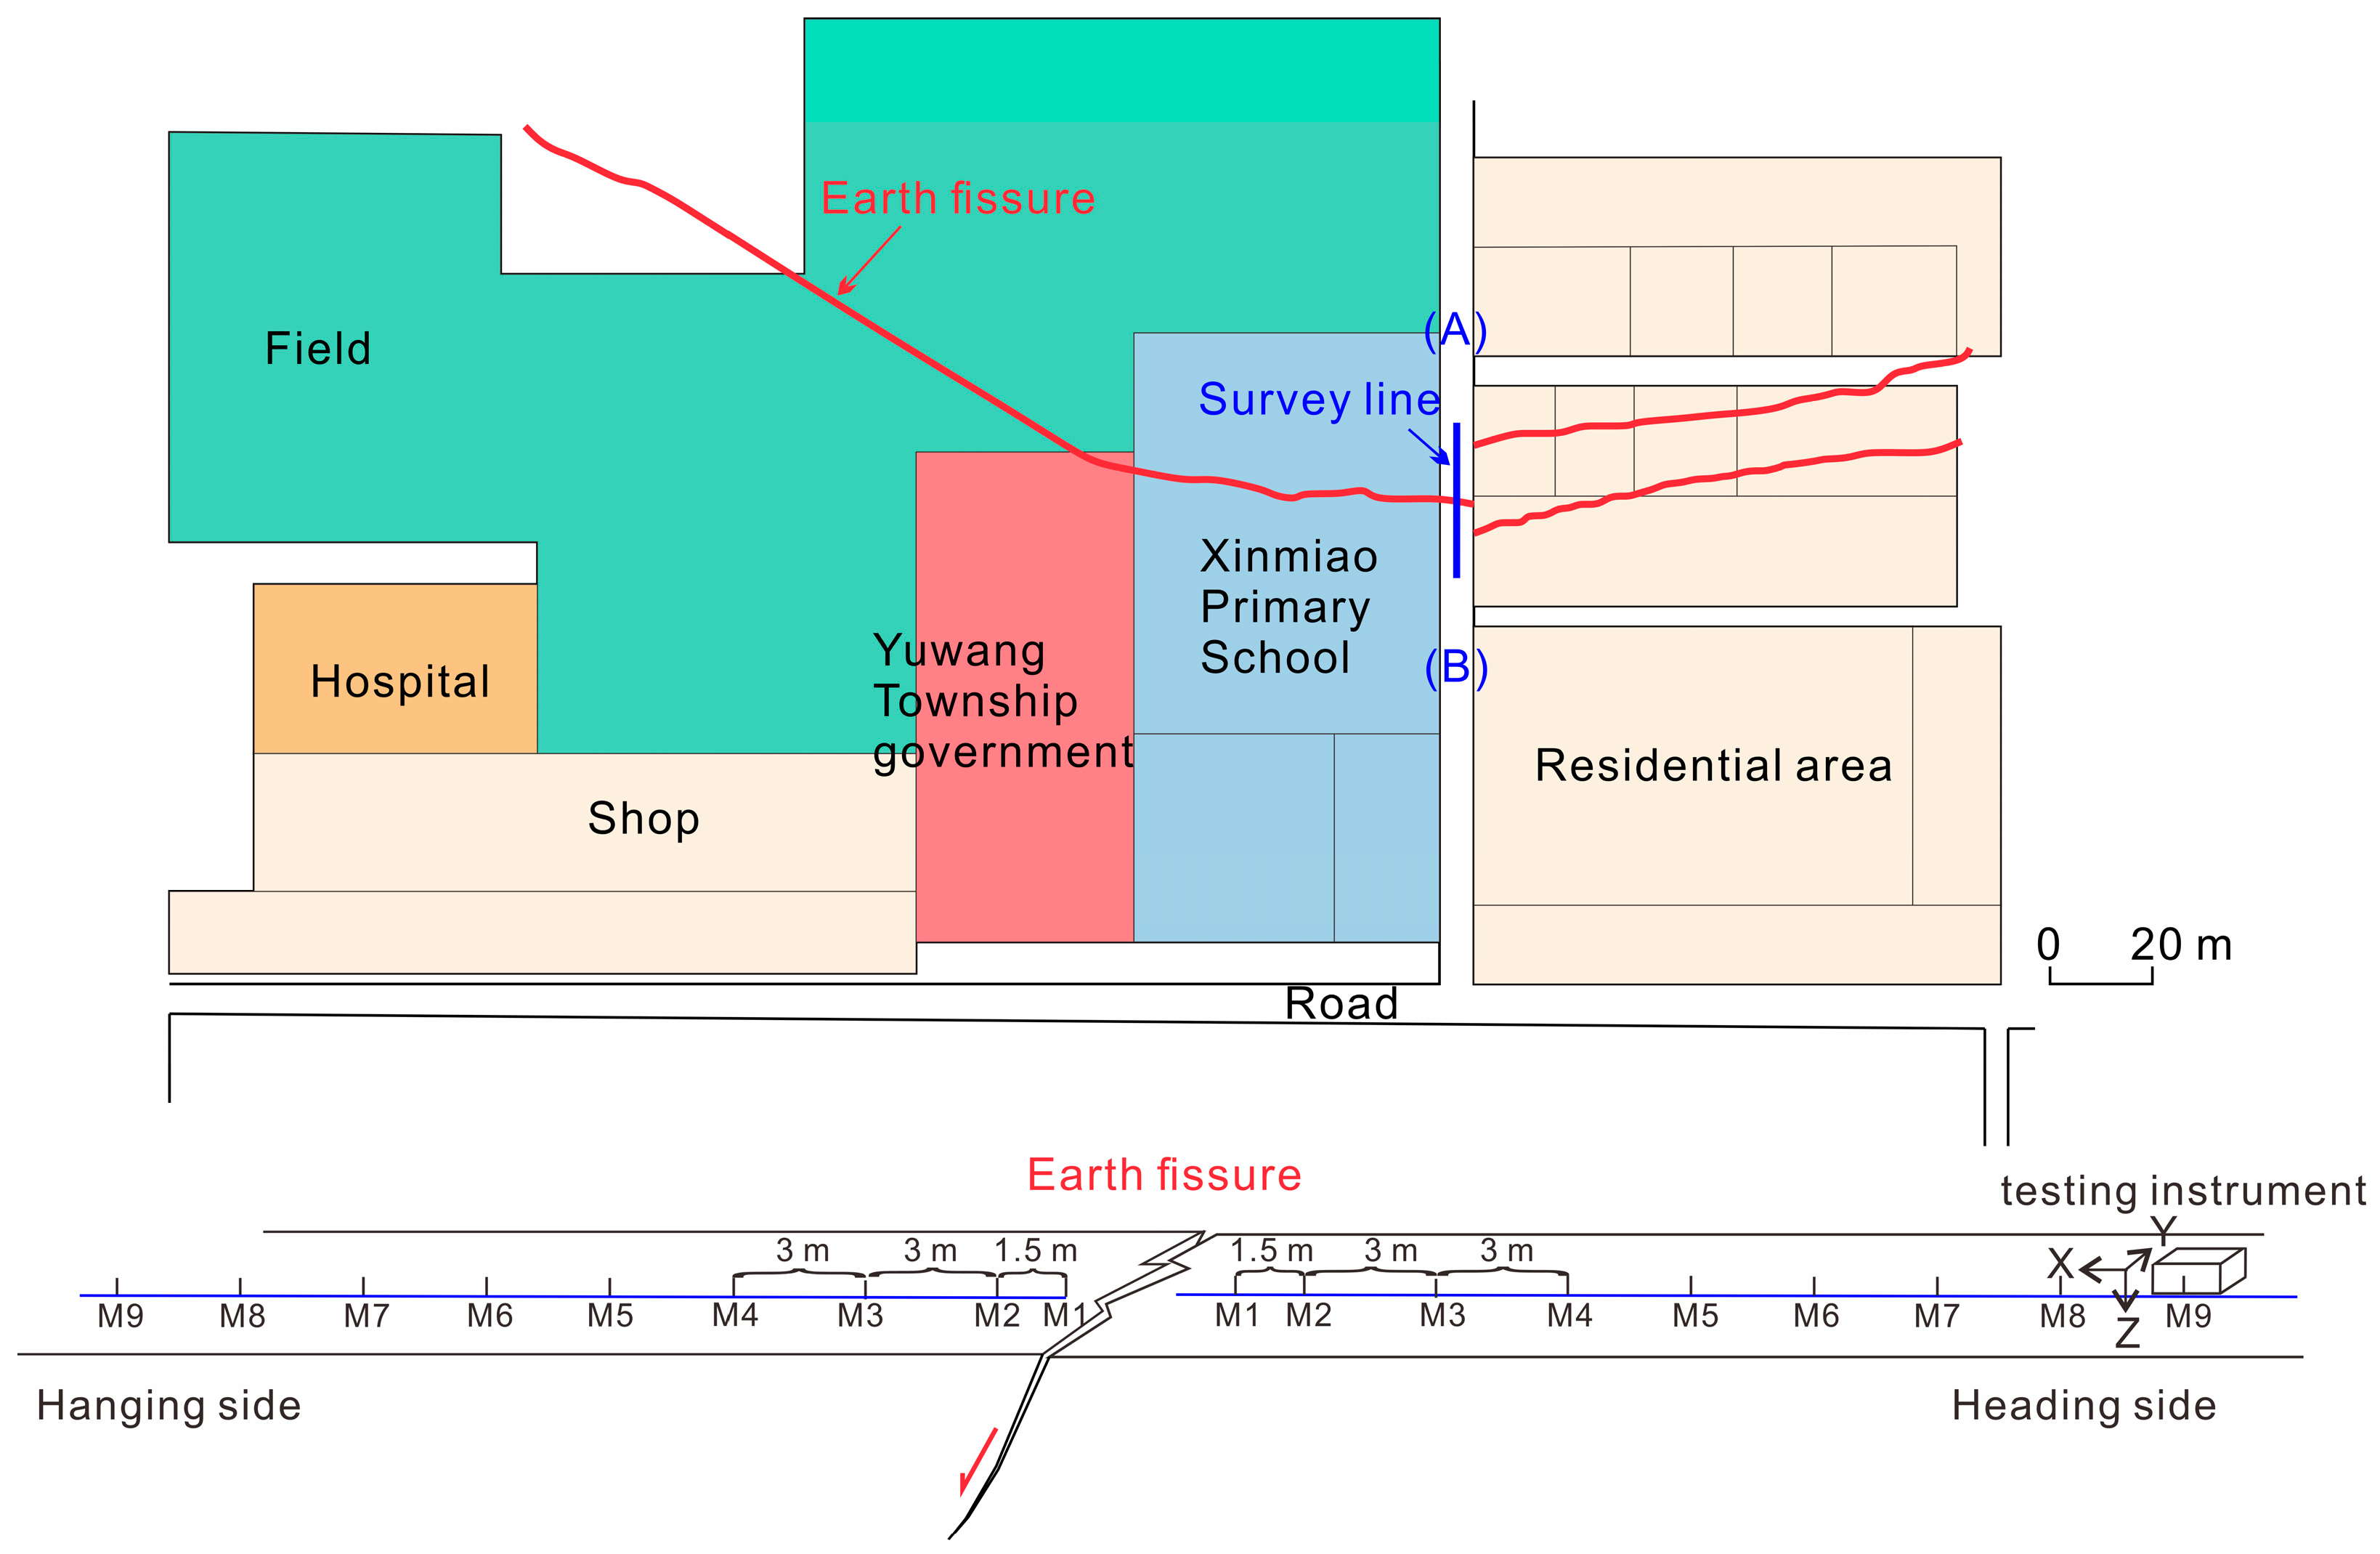
5. As an example, the survey line layout of F
2 in Yuwang is shown schematically in
Figure 5. The survey lines were perpendicular to the earth fissures. Each survey line contained 18 data acquisition points, and 9 measurement points were set on either side of the earth fissure. The survey lines were about 60 m long.
4.2. Equipment and Methodology
The testing instrument used for the microtremor was a high-sensitivity servo-type velocity network seismograph (CV-374AV) manufactured by Tokyo Sokushin Co., Ltd. Company (Tokyo, Janpan). The sampling frequency of the instrument was 0.1–100 Hz. It can monitor in three orthogonal directions of microtremor data at the same time. The testing instrument meets the requirements of the microtremor test.
The tests were carried out at night when it was quiet and in good weather in order to avoid obvious vibration sources. The microtremors in the X, Y, and Z directions were measured at each measurement point, and each measurement point was monitored for more than 10 min. If pedestrians or vehicles passed by during the test, these details were recorded, and the affected time period was avoided as much as possible when selecting the data.
The collected speed–time history curve from the reliable signal was intercepted and converted into the acceleration time–history curve. Intercepted data were imported into the SeismoSignal program. After the preprocessing had been completed, including filtering and baseline corrections, Fourier spectrum, response spectrum, and Arias intensity analyses were performed.
5. Microtremor Analysis of the Earth Fissure Sites
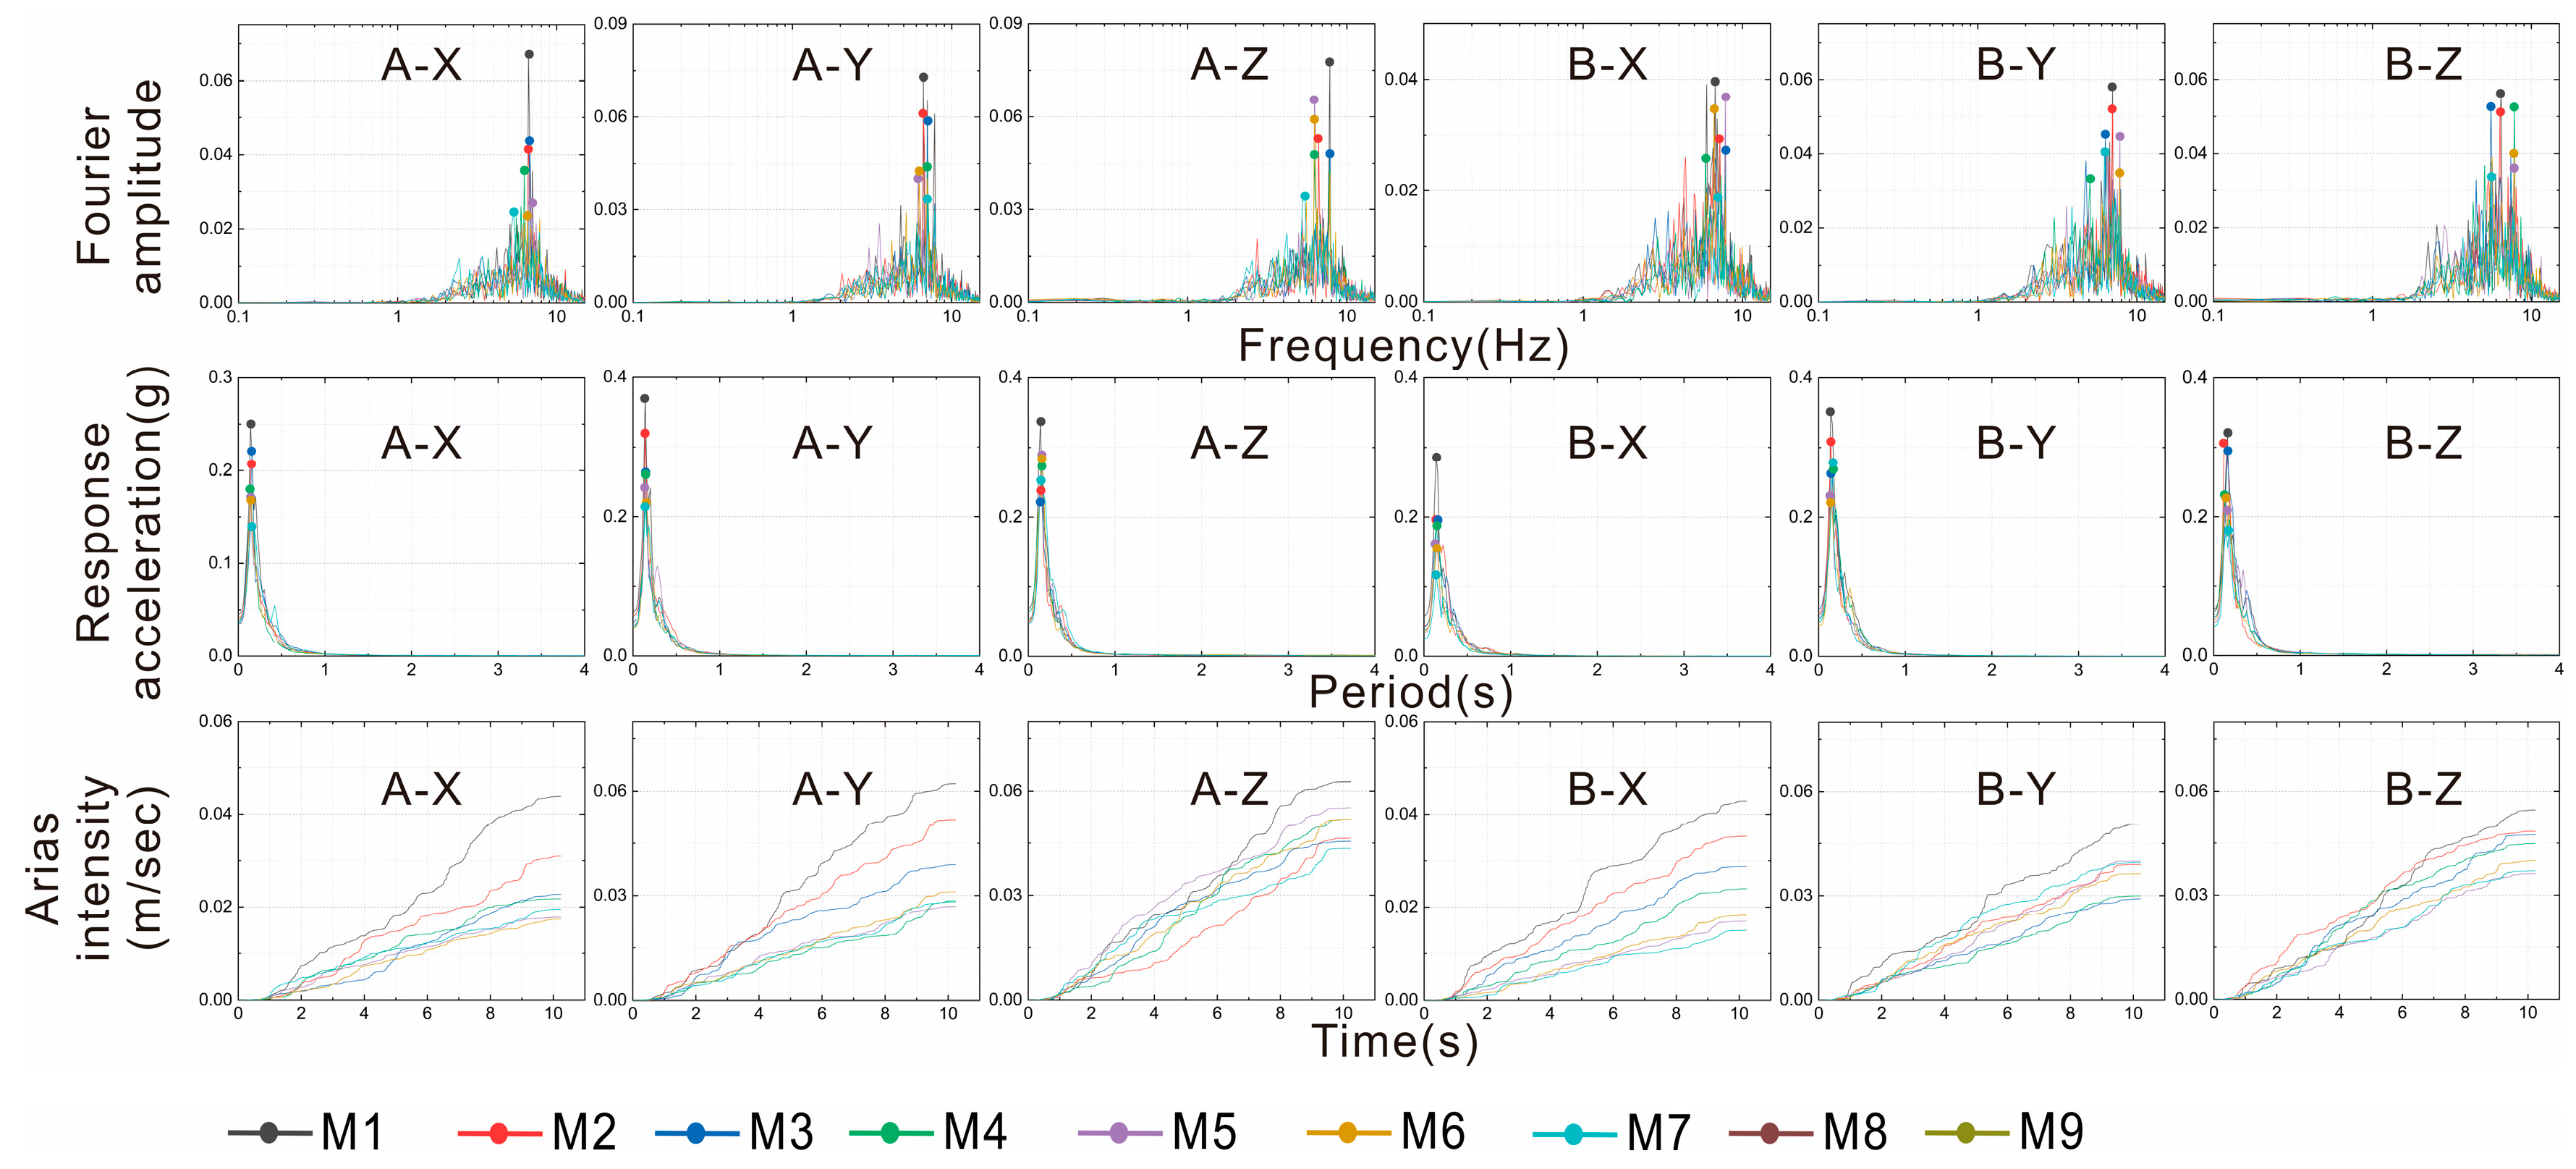
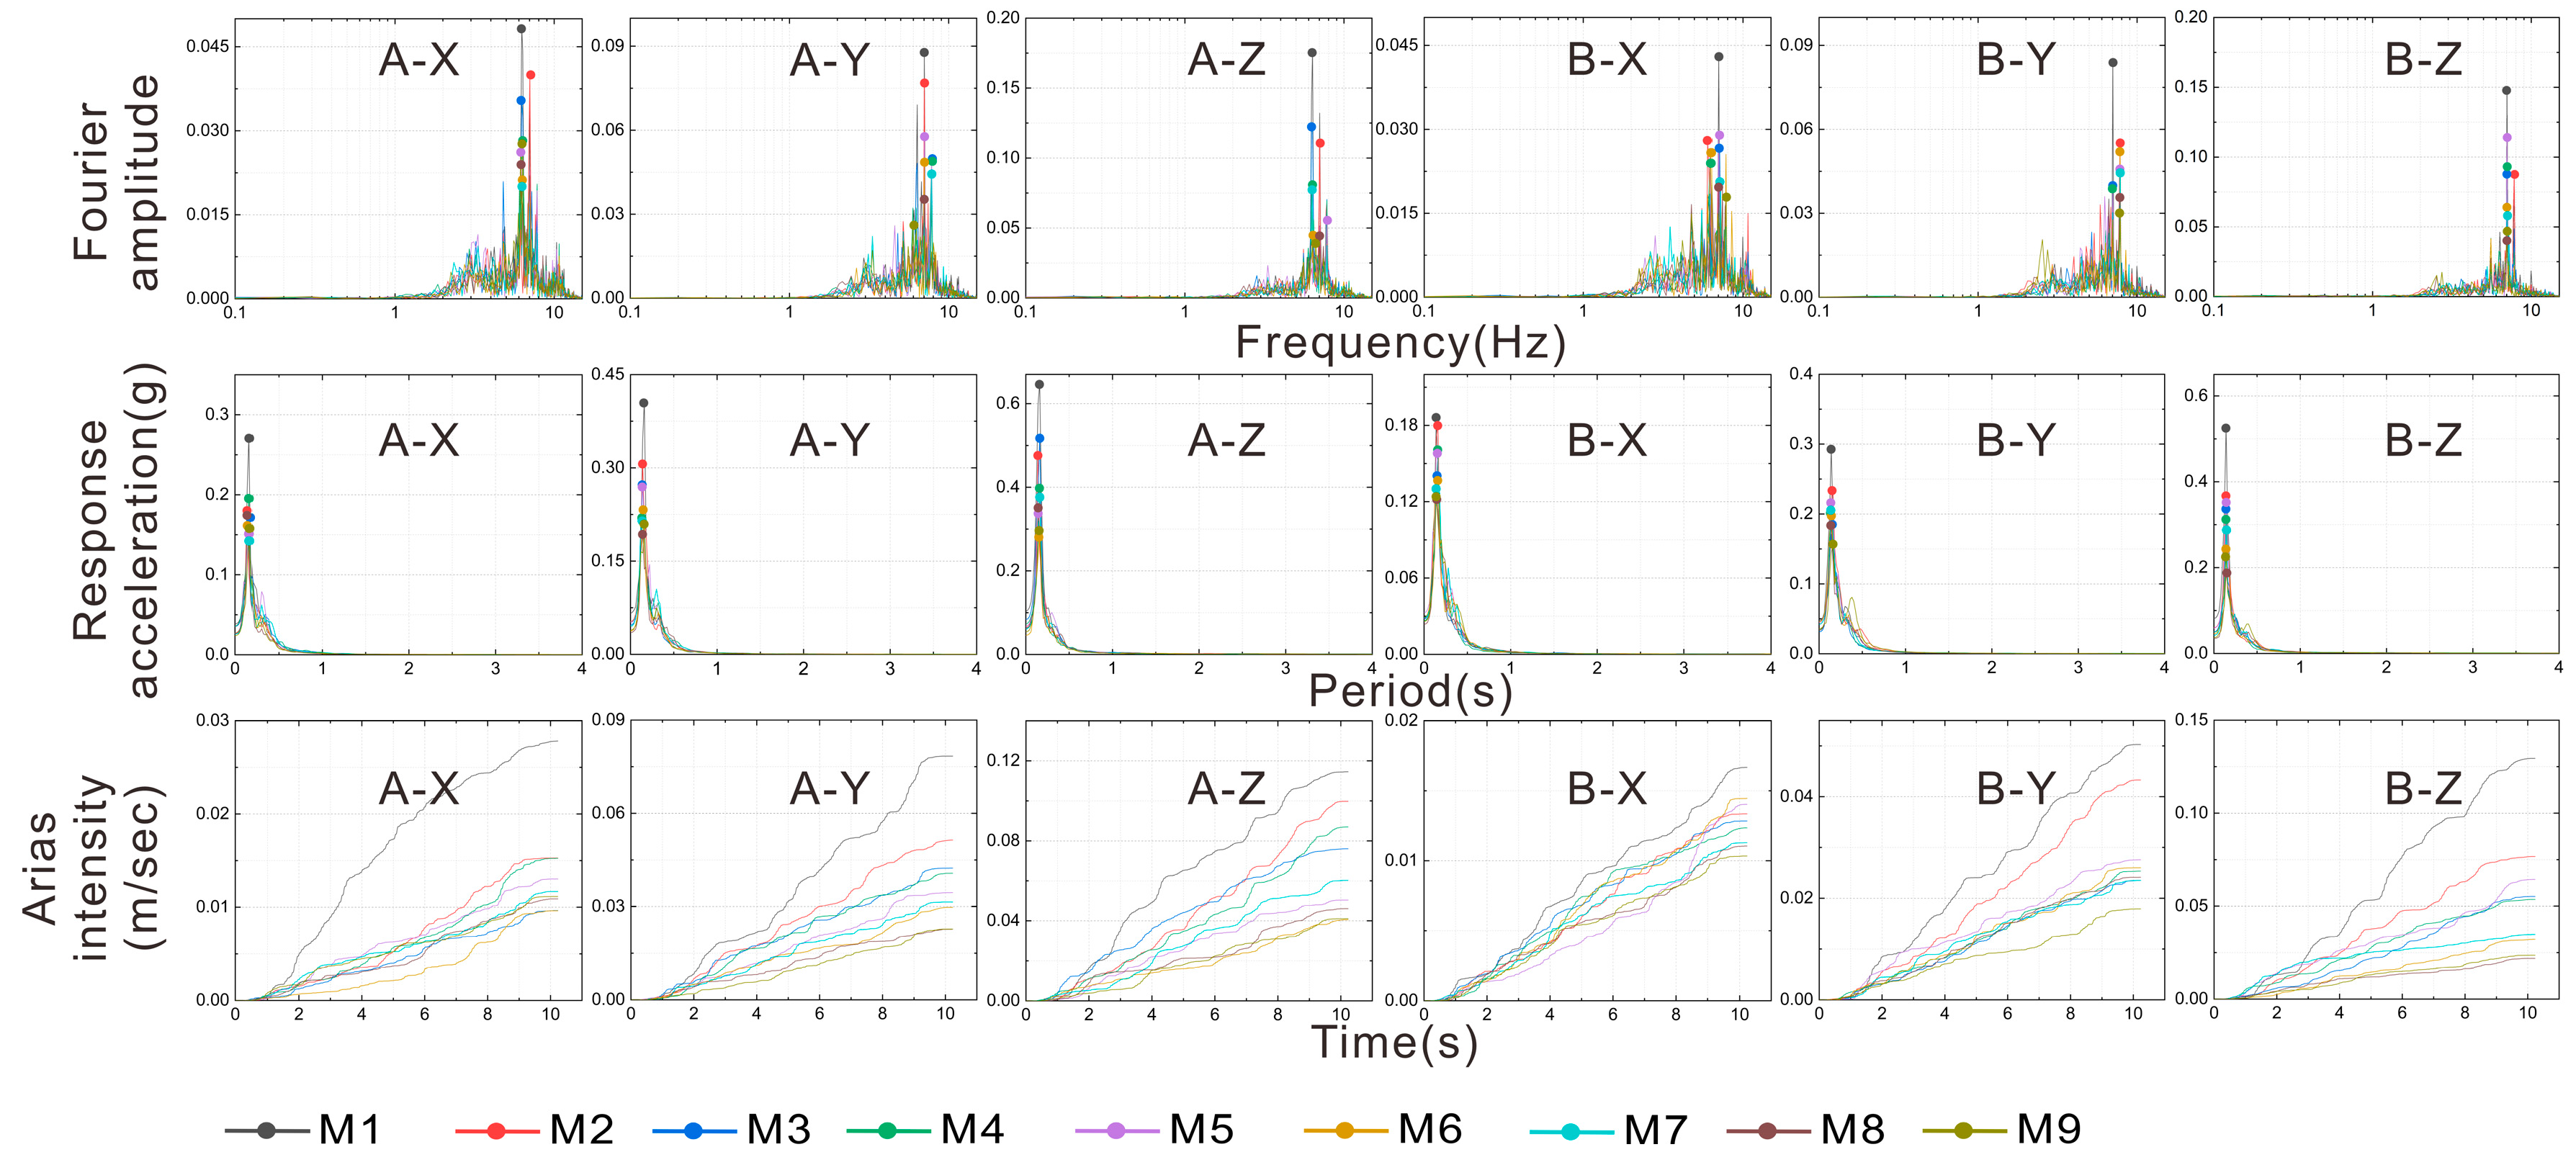
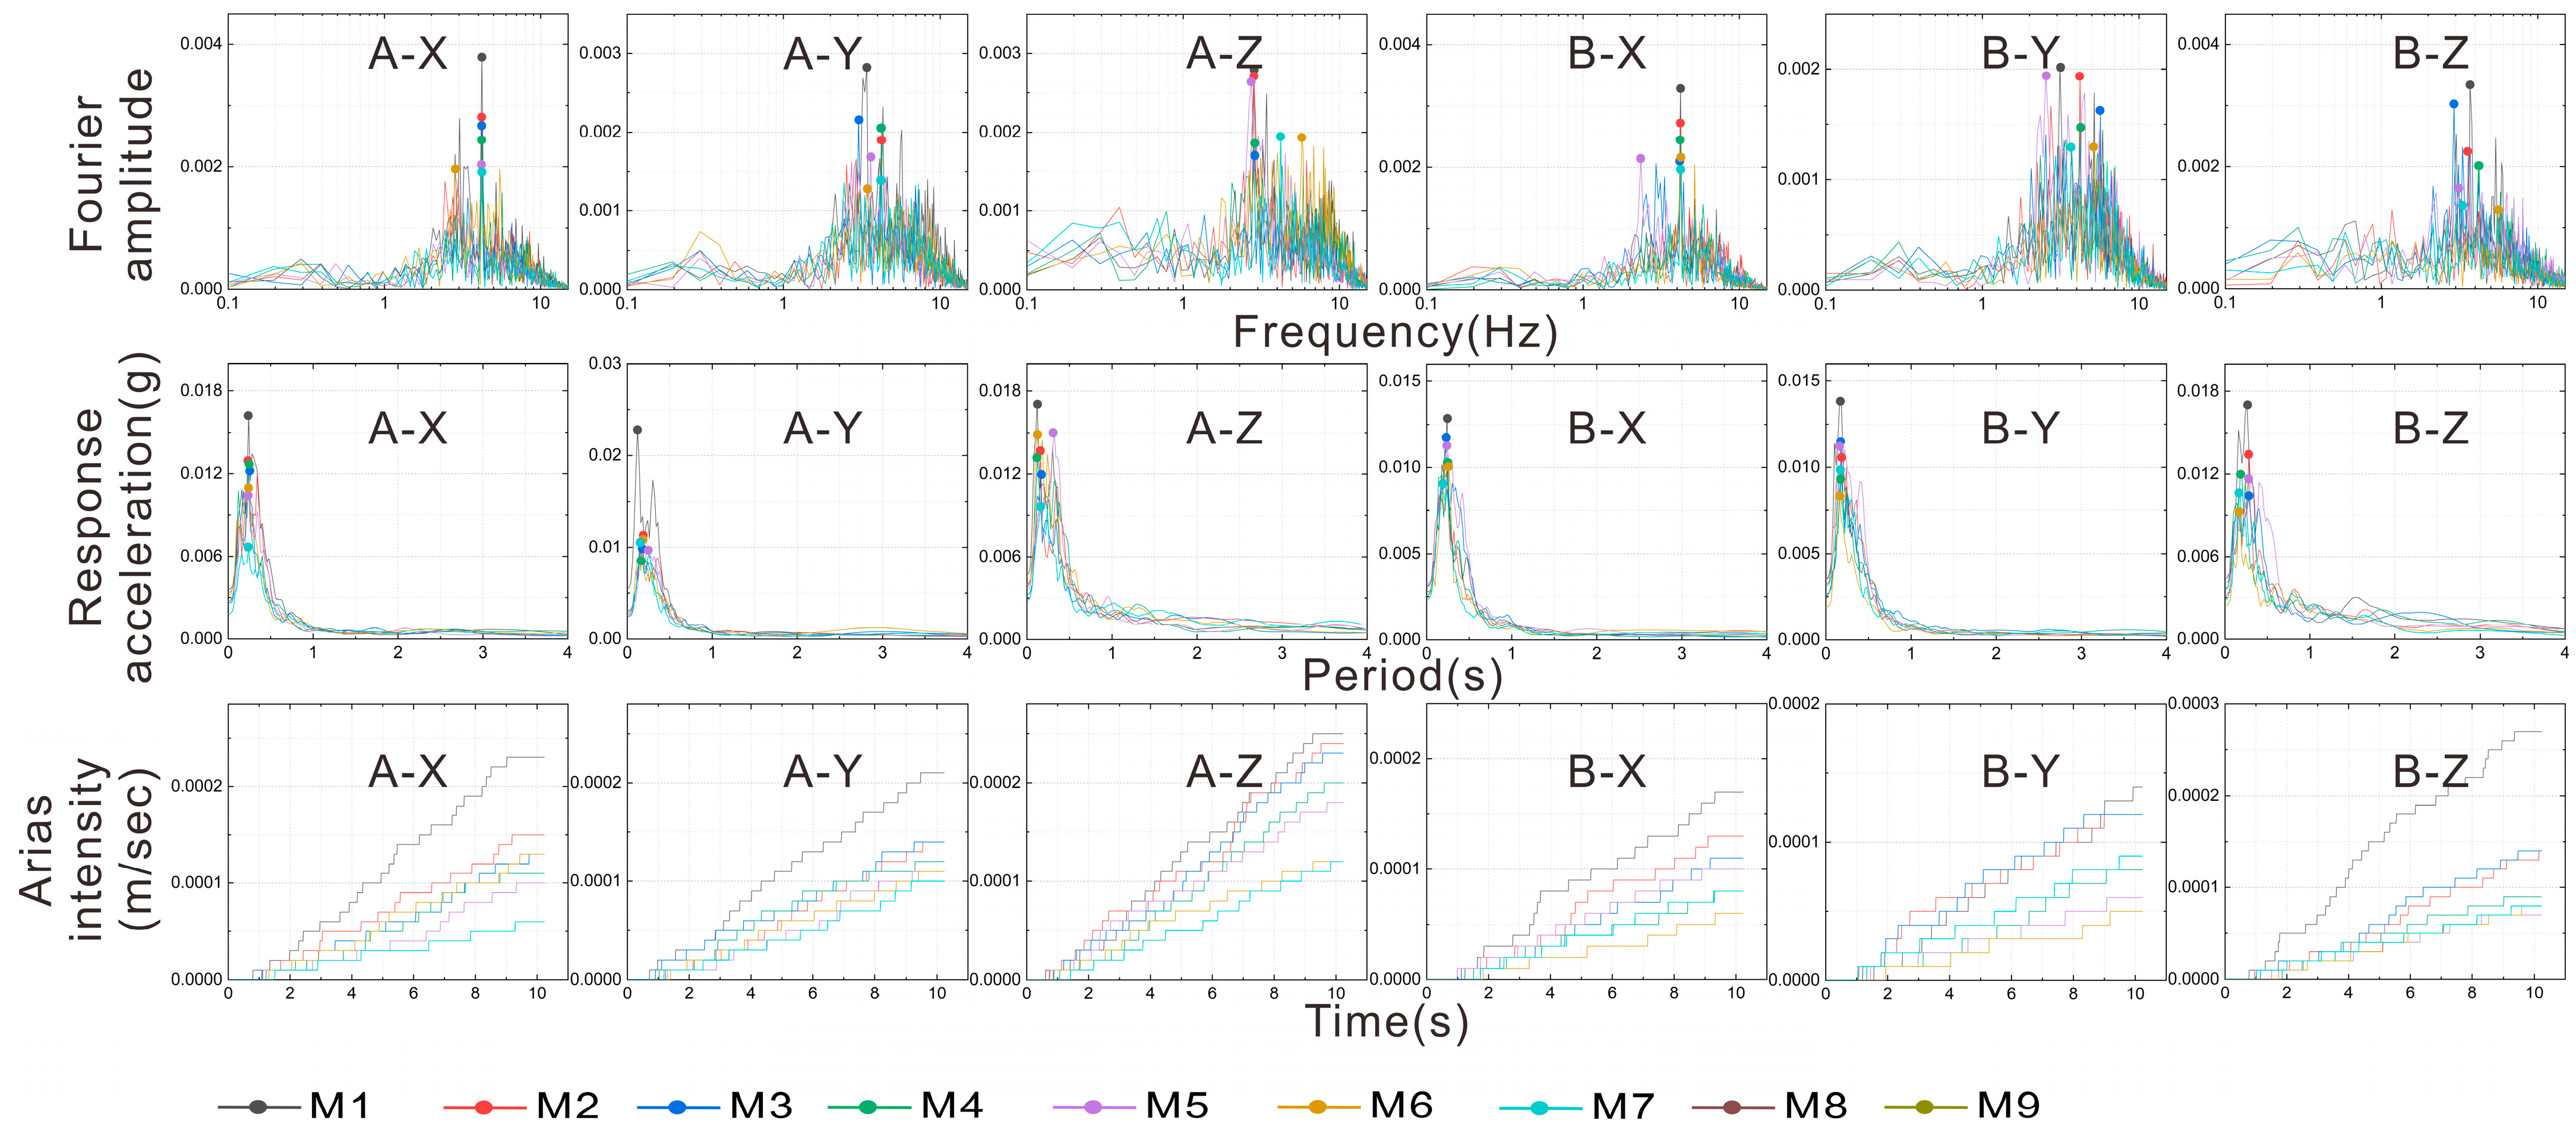
The Fourier spectral results show that the same earth fissure site yielded consistent Fourier spectral features, while the spectra patterns from different fissure sites were distinctive. As can be seen from
Figure 6 and
Figure 7, the Fourier spectrum patterns of the F
1 earth fissure site are dominated by ‘single-peak’ spectra, with small spectral areas, prominent main peaks, and narrow spectral energy distribution intervals. From
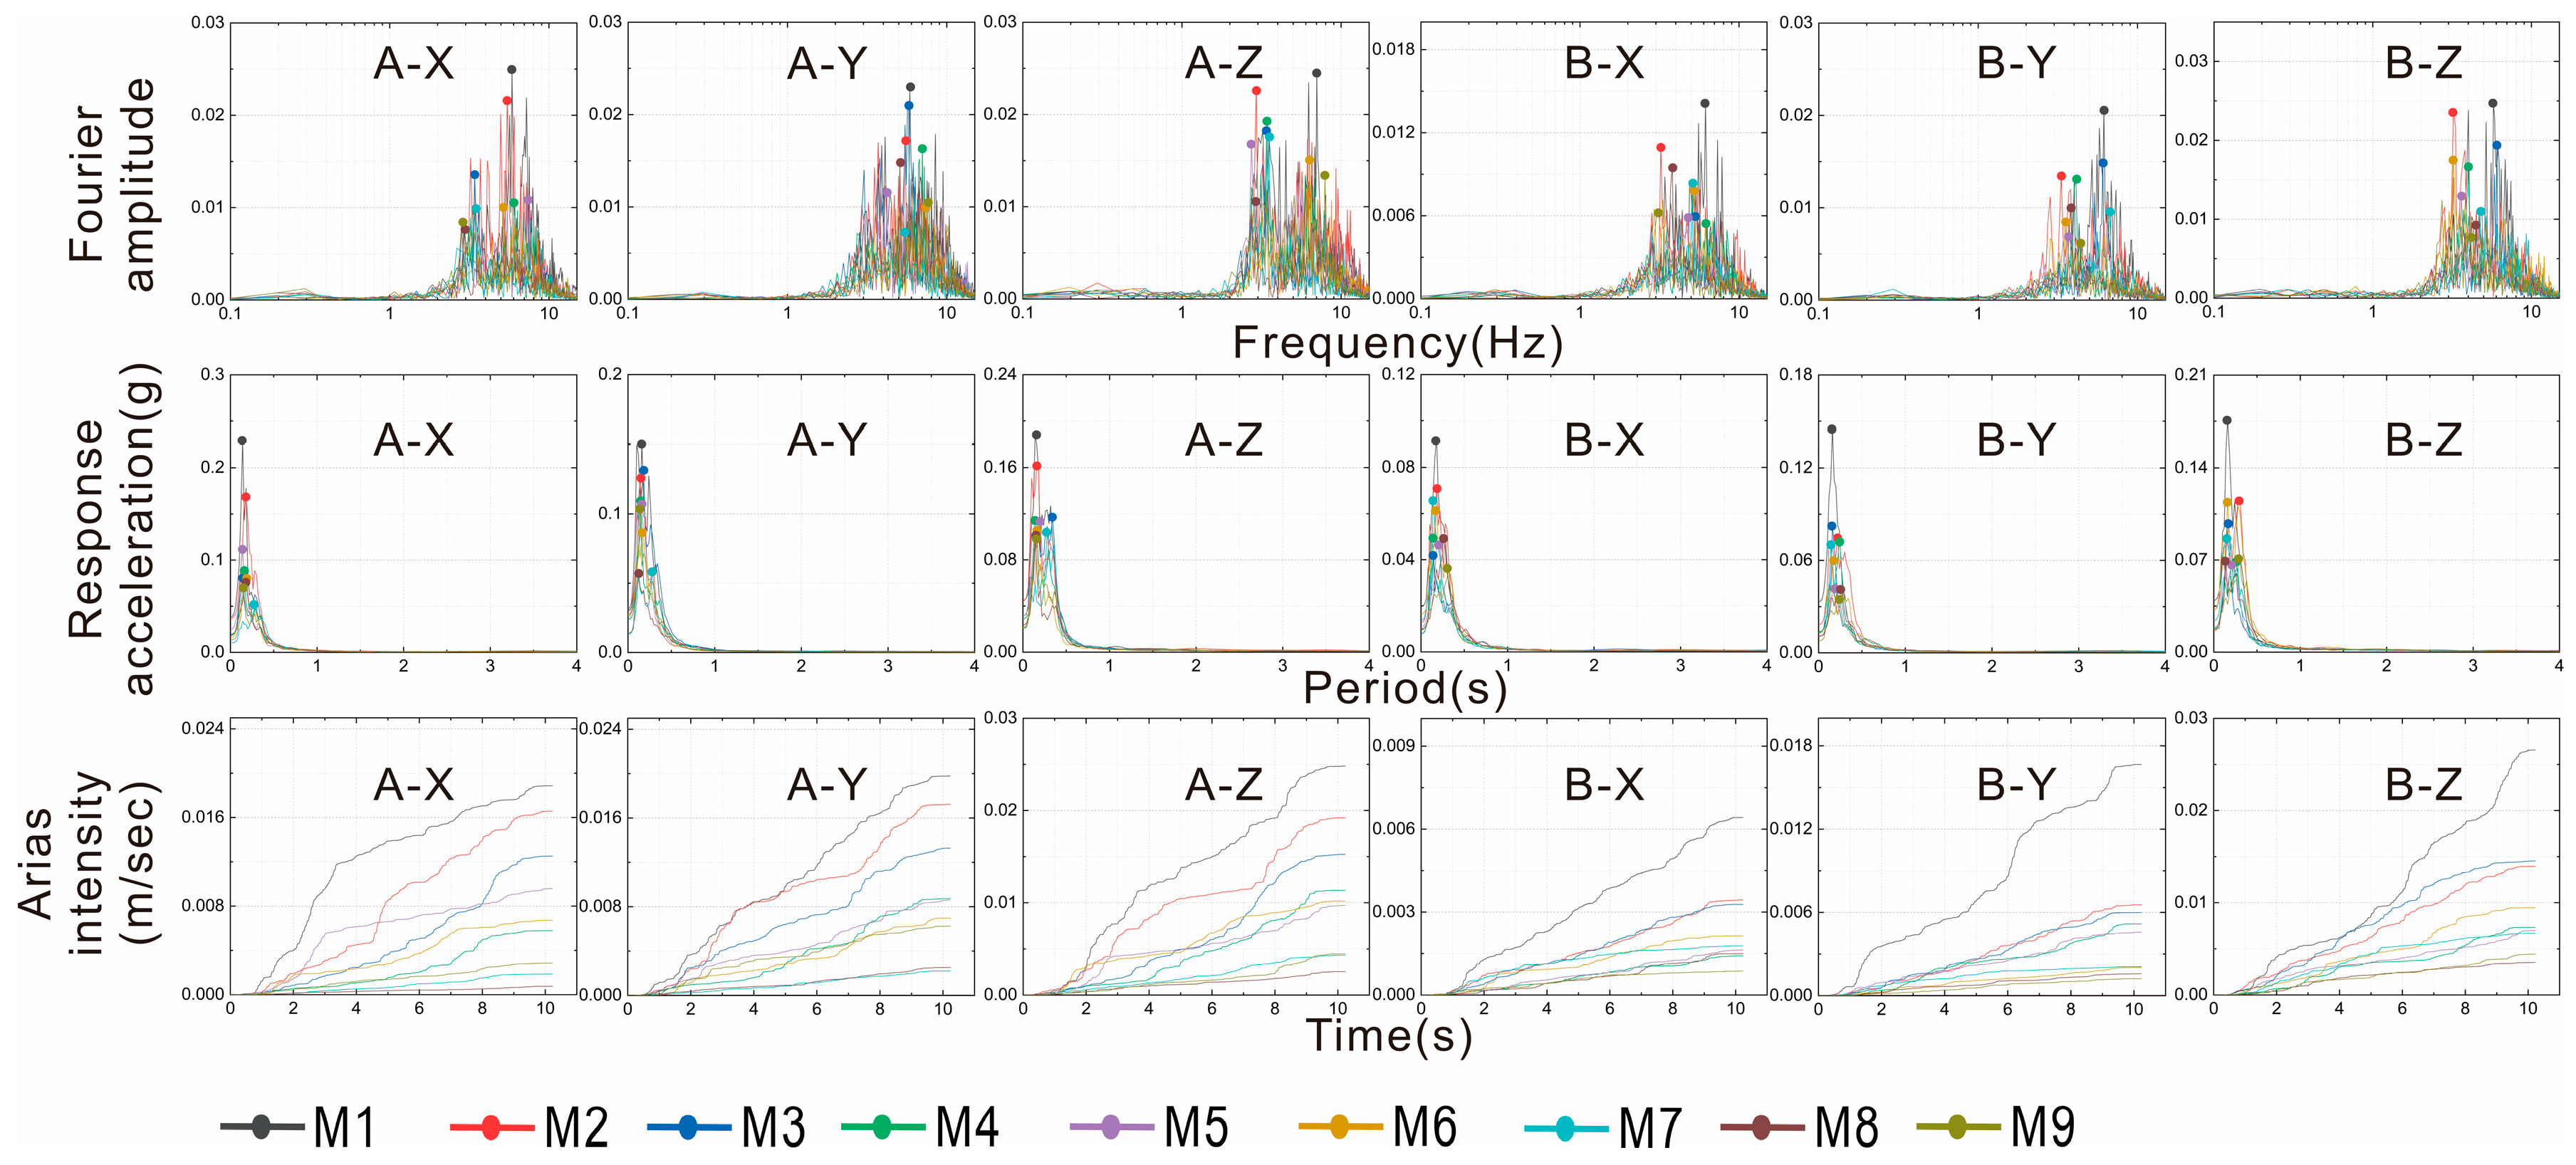
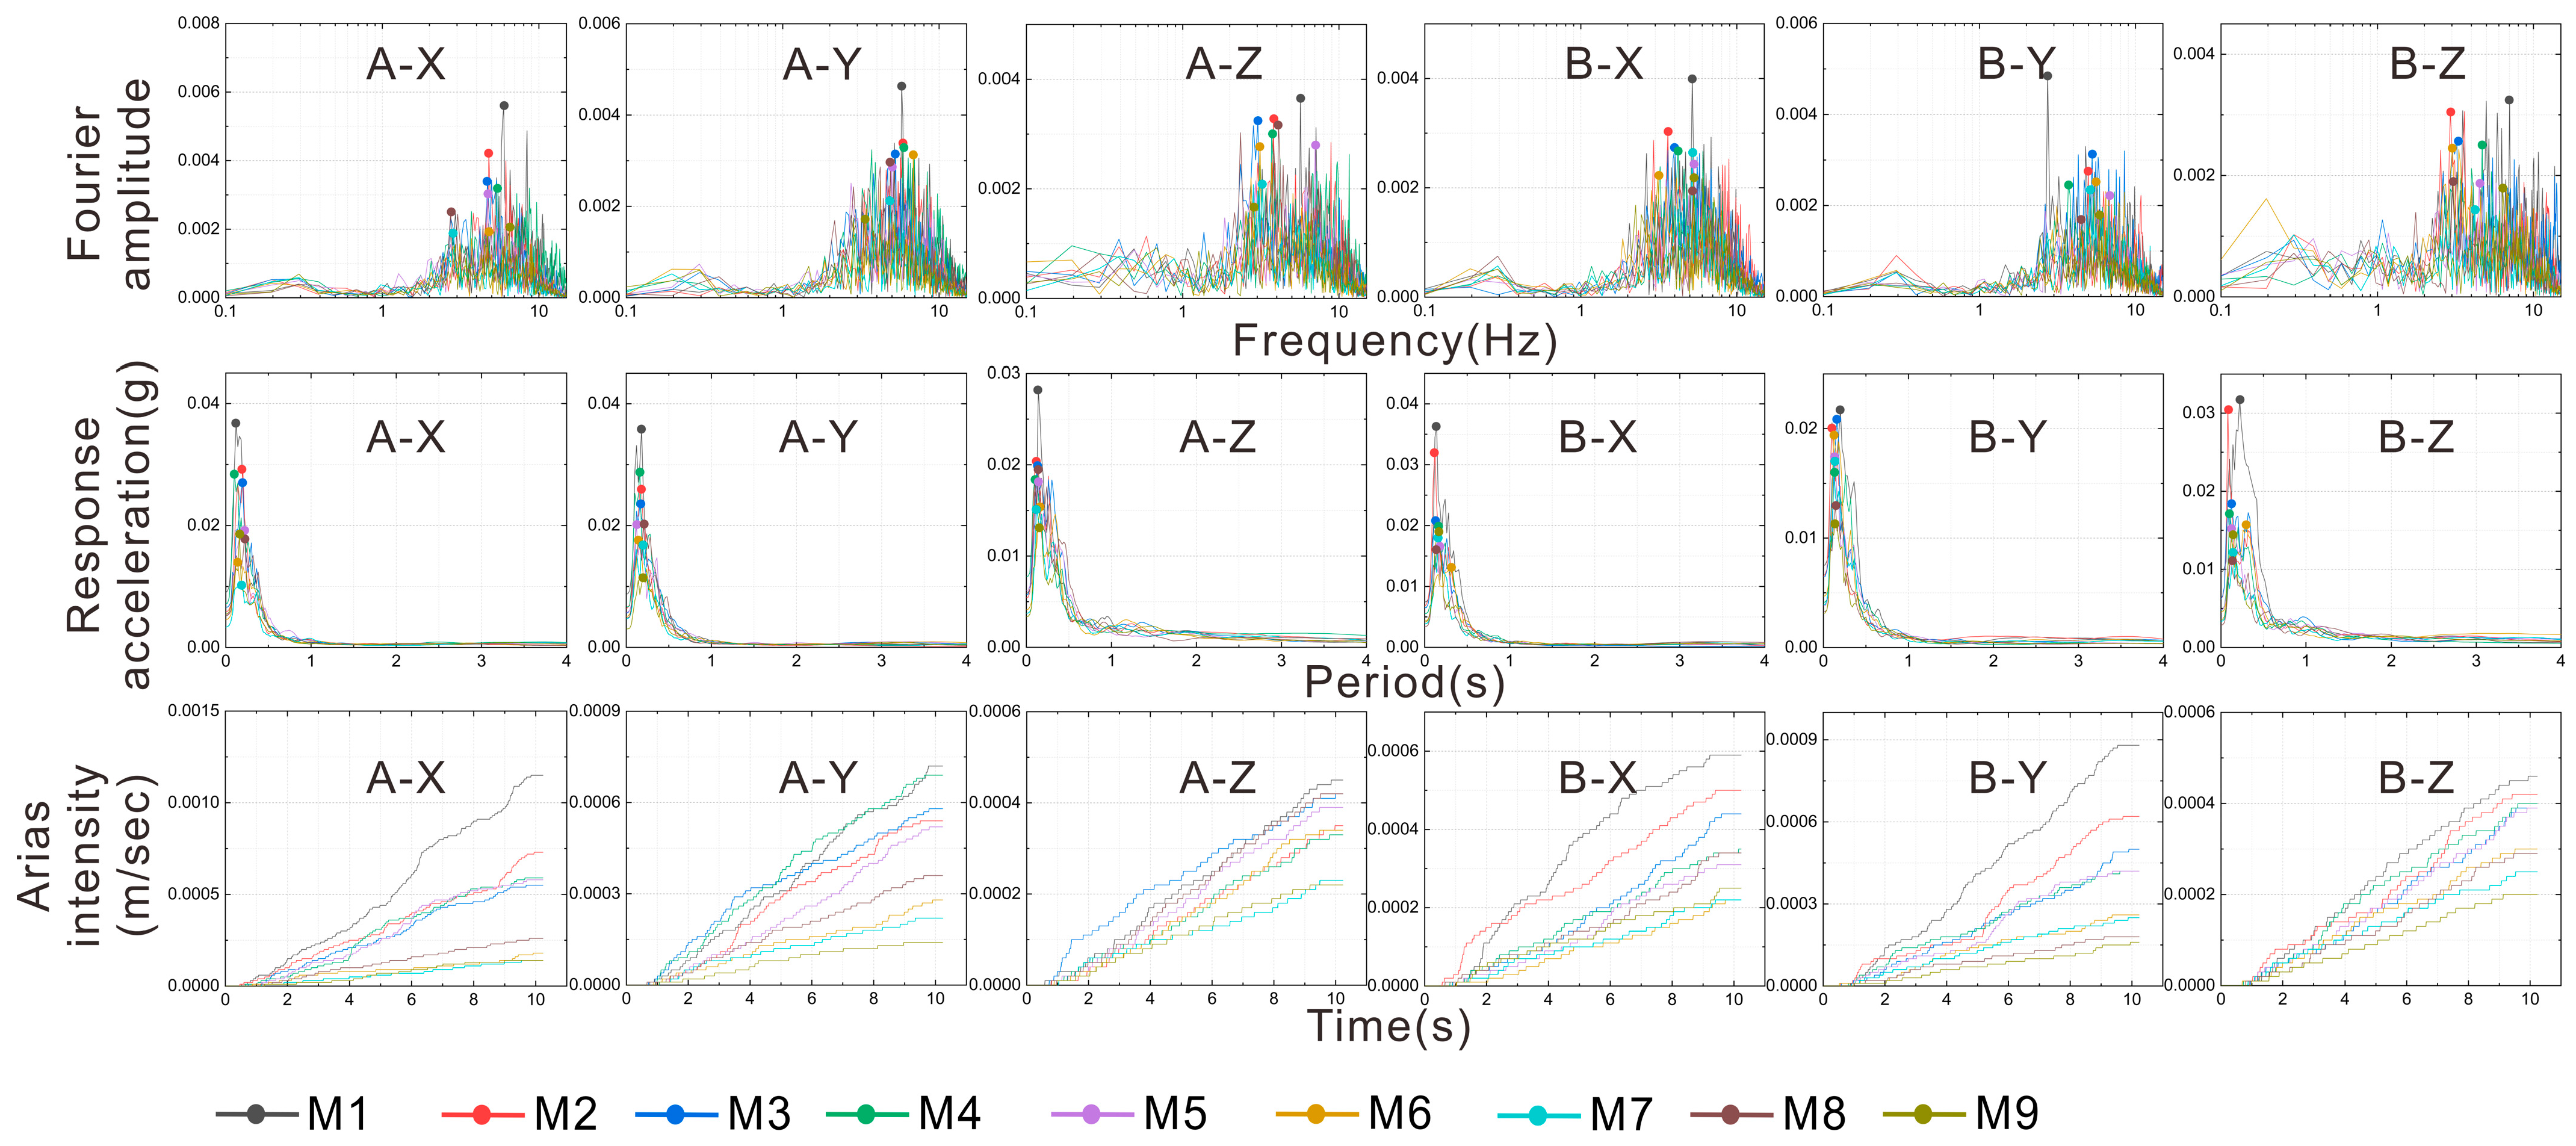
Figure 8,
Figure 9 and
Figure 10, it can be seen the Fourier spectra of the F
2 and F
3 fissure sites are both broad and dominated by ‘multi-peak’ spectra, with more secondary peaks and a relatively wide range of spectral energy distribution. The Fourier spectral pattern is dependent on the fissure site, with the F
1 fissure site having relatively hard soil conditions, dominated by interbedded loess and paleosol. The F
2 and F
5 fissure sites have different site conditions, but the profiles reveal that the two sites have similar soil conditions, dominated by silty clay intercalated with silt, with a relatively weak soil layer. Therefore, the Fourier spectral patterns of the earth fissure sites F
2 and F
5 are similar, and they are significantly different from the Fourier spectral characteristics of the F
1 site.
Further analysis of the predominant frequencies revealed that the presence of earth fissures had little effect on the predominant frequencies of the site. This means that the predominant frequencies of the same survey line did not change significantly with increasing distance from the earth fissures, and the ranges of the predominant frequencies on the hanging and heading sides were basically the same. From the results of the spectral analysis, it can be concluded that the predominant frequency of the F1 earth fissure site is 6–7 Hz, that of F2 is 3–5 Hz, and that of F5 is 3–5 Hz. However, because of the different soil structures of different earth fissure sites, the predominant frequencies of the different sites are different.
The response spectra of the same fissure sites were also generally consistent, with all three types of fissure sites showing a predominantly ‘single-peak’ response spectrum, with prominent main peaks and few or no secondary peaks. Similar to the results of the Fourier spectrum analysis, the response spectrum of the F1 fissure site was the narrowest among all of the fissure sites, while the F2 and F5 fissure sites revealed a similar response spectrum with a slightly larger spectral area than that of F1. All three fissure sites had a relatively concentrated predominant period, which was distributed in the interval of 0–0.5 s.
The Arias intensity is the curve of the energy accumulation at the measurement point over time. The difference between the energy of the different measurement points can be seen better from the final accumulated energy. Based on the Arias intensity of the three earth fissure sites, the closer the measurement point to the earth fissure, the greater the energy accumulated at the measurement point. The accumulated energies of each site reached the extreme values at measurement points A1 and B1, and as the distance increased, the energy gradually decreased and finally stabilized.
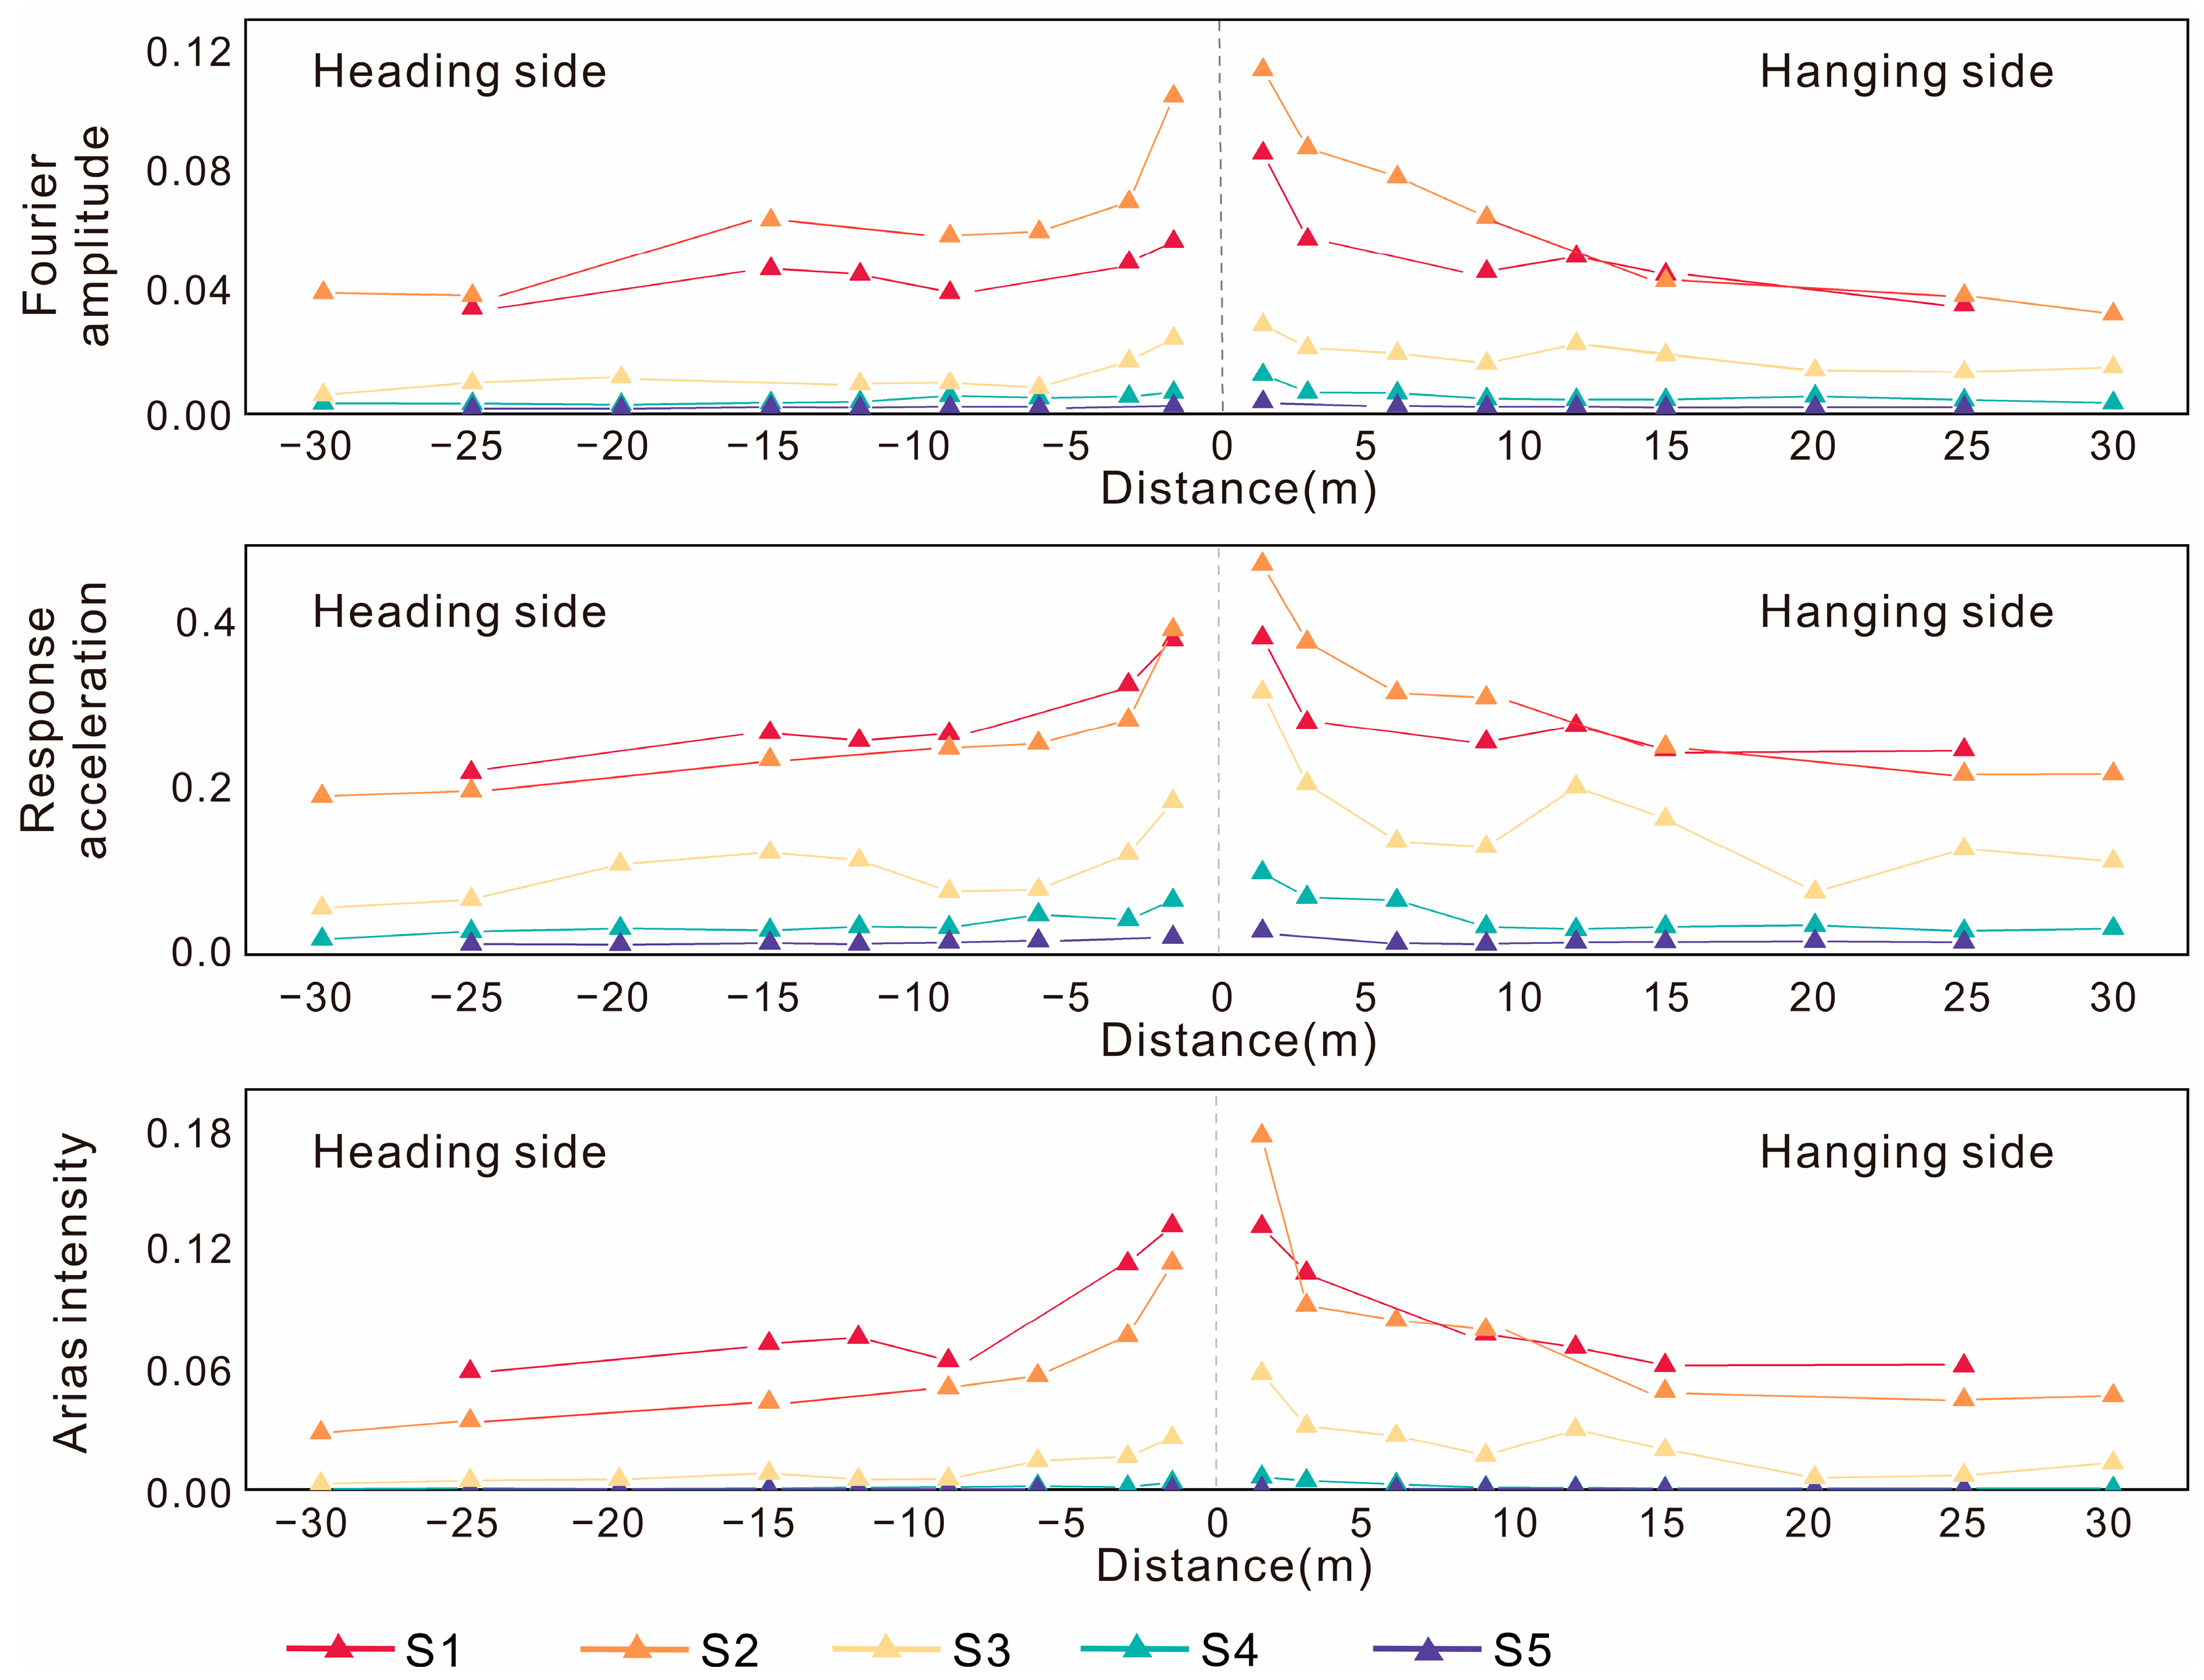
From the spectral results, it can be further found that earth fissures have no significant influence on the inherent characteristics of the site, such as the predominant frequency and the predominant period. However, when we explored the dynamic response law of the earth fissure site, the amplitude difference of each measurement point was notable. From
Figure 6,
Figure 7,
Figure 8,
Figure 9 and
Figure 10, there are significant differences in the amplitudes of the various measurement points, but it is difficult to visualize the relationship between the magnitudes of the various measurement points and the location of the earth fissure from the spectrum results. Therefore, we averaged the amplitudes of each measuring point in the X, Y, and Z directions, and obtained the relationship curve between the average amplitude of the Fourier spectrum, response spectrum, Arias intensity, and the distance from the earth fissure, as shown in
Figure 11. As can be seen from the figure, although the response intensity varied from site to site, the measurement points near the earth fissures all exhibited a significant amplification effect, which gradually attenuated and stabilized with increasing distance from the earth fissure.
6. Analysis of Dynamic Effects of the Earth Fissure
6.1. Amplification Effect
In order to more intuitively reveal the degree and scope of the impact of the earth fissures on the dynamic response of the site, the concept of the amplification factor was introduced.
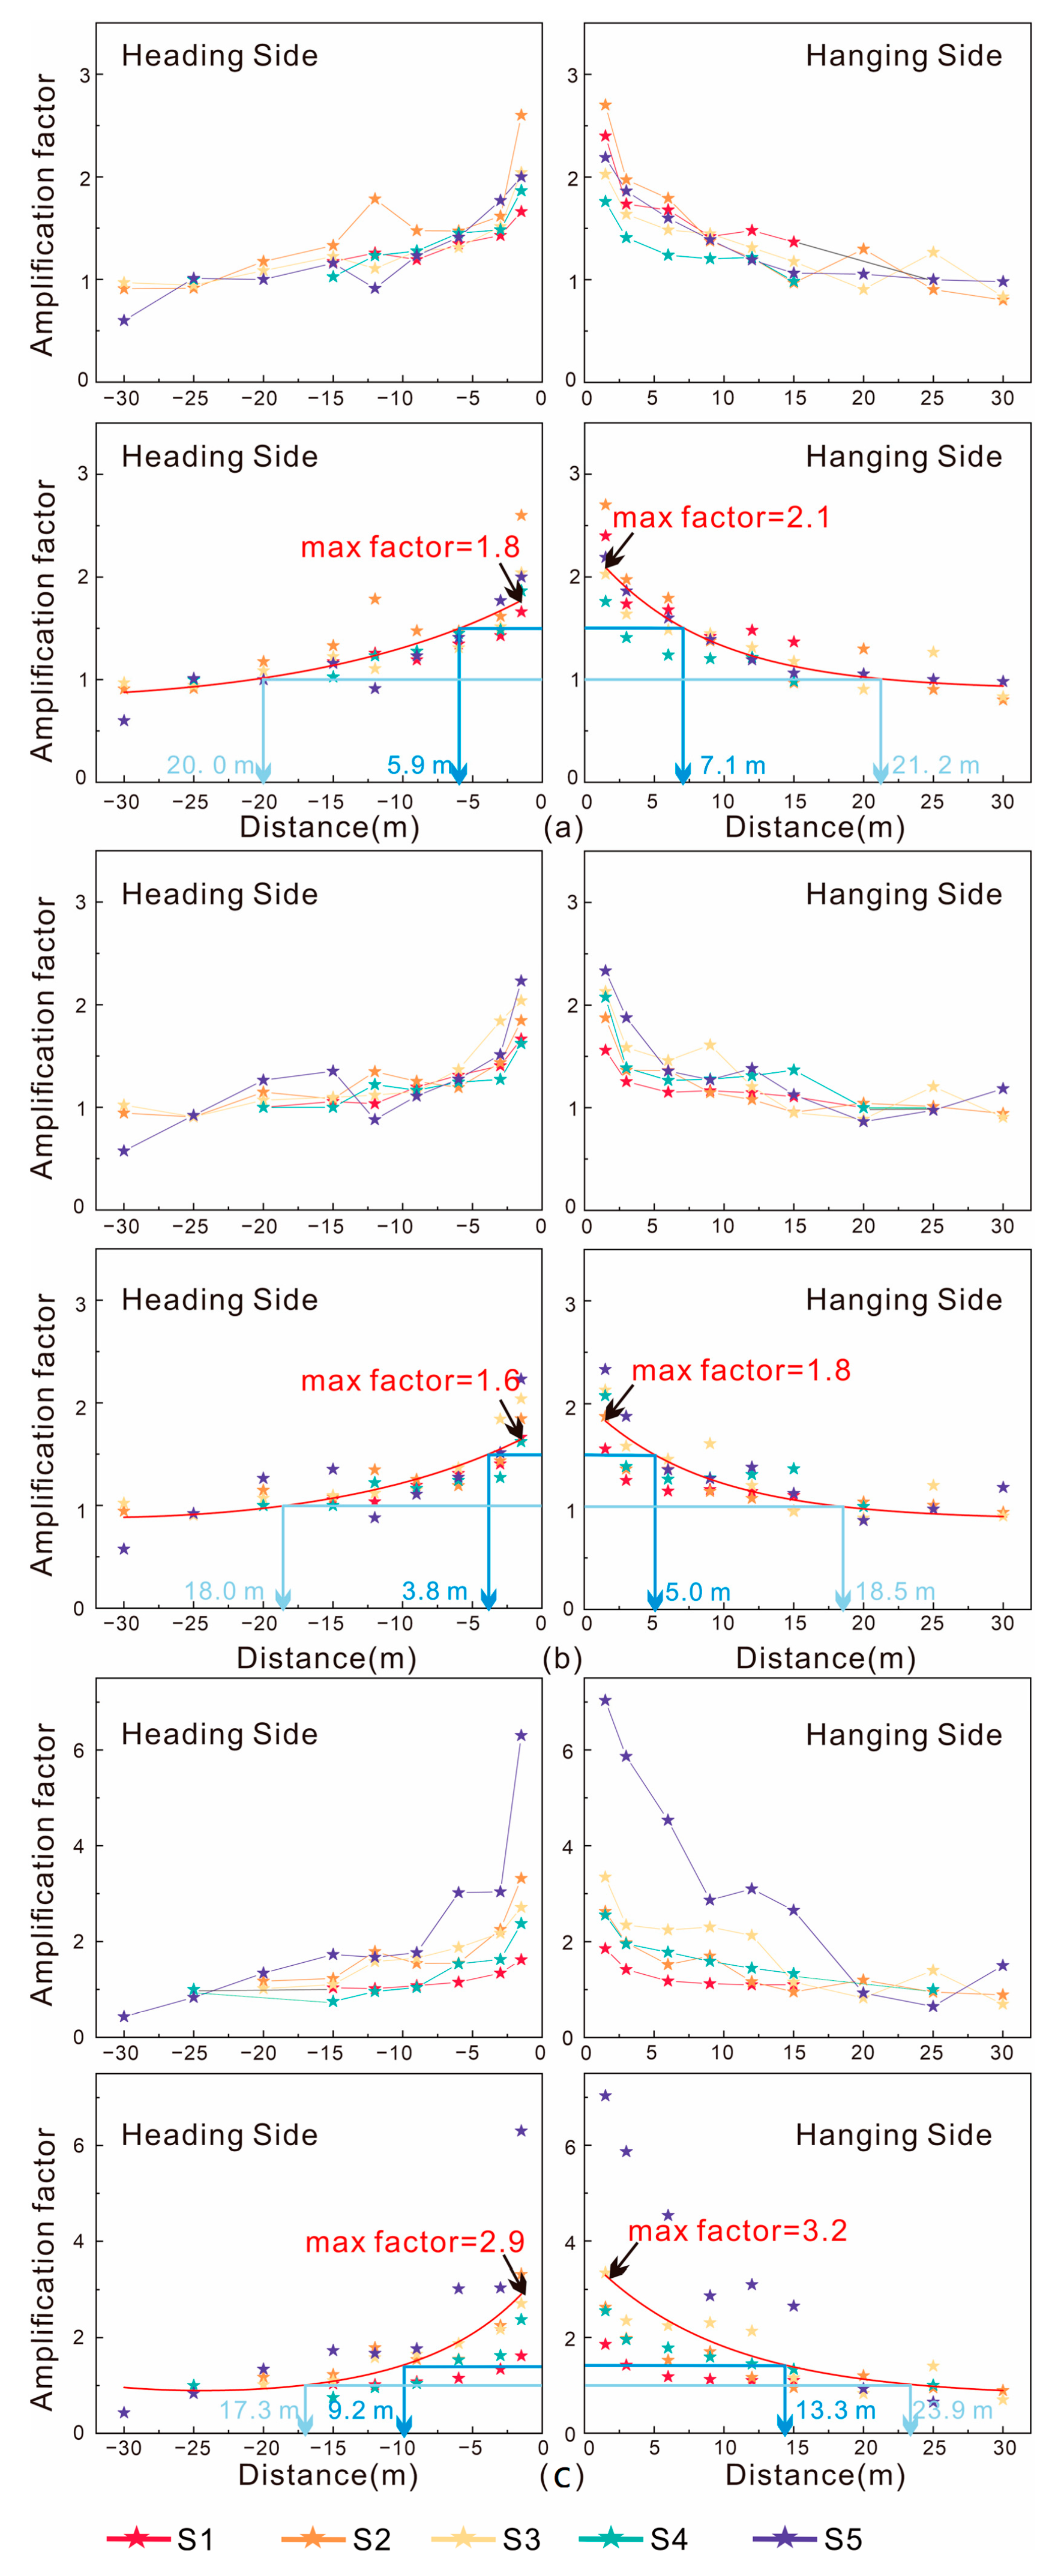
Figure 12 shows that the amplitudes of the three measurement points on both sides of the earth fissure on each survey line were basically the same and tended to be stable. Therefore, the stable amplitude was defined as the average of the amplitudes of these three measurement points, and the amplification factor was defined as the average amplitude of each measurement point divided by the stationary amplitude.
Figure 12 shows the attenuation curve and fitting curve of the amplification factor with distance. As can be seen from the figure, the earth fissure site amplification effect revealed via Fourier spectrum, response spectrum, and Arias intensity had the same attenuation mode, and the dynamic amplification response of the site was most significant when closest to the earth fissure and tended to decay as the distance from the fissure increased until reaching the area farthest away from the earth fissure, where the dynamic response of the site gradually stabilized and the amplification factor approached 1. This also indicates that the influence of the earth fissure on the dynamic response of the site had a limited range.
According to the amplification factor fitting curve (
Figure 12), we can obtain the amplification factor extreme value of different analysis results. As shown in
Table 1, the extreme value of the hanging and heading sides obtained by the Fourier method is 1.8–2.1. The extreme value of the amplification factor of the hanging side obtained by the response spectrum is 1.8, and that of the heading side is 1.6, while the Arisa intensity has the largest amplification factor extreme values of 3.2 for the hanging side and 2.9 for that of the heading. The amplification factors obtained by three analysis methods are different, we can choose different amplification factors according to the needs of seismic fortification. The Fourier method focuses on the inherent information of the site soil layer, which can intuitively reflect the vibration characteristics of the site. Therefore, we can select the Fourier amplification factor when considering only the dynamic characteristics of the site itself. The response spectrum can reflect the dynamic characteristics of different structural particle systems under ground motion, which is very effective for the seismic fortification of structures. The Arias intensity is a time-dependent curve, indicating the strength of the overall dynamic response of the site over a period of time. According to the amplification factor of the Arias intensity, the peak acceleration of the site under seismic action can be obtained, and the seismic fortification level of the site can be adjusted. Different methods show that the extreme value of the amplification factor in the hanging side of the same earth fissure site is slightly larger than that of the heading. Therefore, under the dynamic load, when the distance from the earth fissure is the same, the dynamic amplification response of the hanging side is stronger.
6.2. Range of Influence
From the amplification factor fitting curve, the range of distances corresponding to the amplification factor of 1.5 was divided into three regions for the influence of the dynamic response of earth fissure, as shown in
Table 2. In future seismic fortification work, the seismic fortification levels of buildings and structures can be adjusted according to the amplification factors in different areas.
When the amplification factor is greater than 1.5, it is in an area where the dynamic response of the site is amplified most intensely. All three methods have varying degrees of influence range, in which Fourier and response spectra are relatively close, the hanging side is about 5.0–7.1 m, and the heading side is 3.8–5.9 m. The area of Arias intensity is relatively large, with the hanging side at 0–13.3 m and the heading side at 0–9.2 m, and when the amplification factor is between 1.5 and 1, it is in an area where the dynamic response of the site is significantly amplified, and the buildings and structures in this area should also increase their seismic protection level accordingly. Furthermore, when the amplification factor is attenuated to 1, the site can be considered as no longer being affected by the amplification effect of the earth fissure, and therefore a zone of influence of the dynamic response can be delineated accordingly. The Fourier method yielded a hanging and heading side of approximately 20 m, while the response spectrum was about 18 m, and the Arias intensity showed an influence zone of 23.9 m for the hanging side and 17.3 m for the heading side.
As a result, the influence range of the same method was closer to both fissure sides, but the hanging side influence range was always greater than that of the heading. Therefore, from the perspective of practical engineering for seismic protection, new buildings should try to avoid the influence area. If it cannot be avoided, the seismic protection intensity of the building should be increased as much as possible according to the corresponding amplification factor. Moreover, the dynamic amplification effect of the hanging side has a wider and more extensive scope of influence than that of the heading side, in particular for the seismic fortification level of the hanging sides of the earth fissure sites.
7. Conclusions
(1) The presence of the earth fissure significantly amplifies the peaks of the direct Fourier spectra, the acceleration response spectra, and the Arias intensity within the site. In particular, the peaks of each spectrum increased dramatically in the range of 5 m immediately on either side of the fissure.
(2) The amplification effect at the fissure site follows the pattern of steep increase in the near field, slow rise in the middle field, and steady rise in the far field. Areas with amplification factors higher than 1.5 showed a steep rise in amplification, with both spectral and intensity peaks rapidly increasing to several times the original site and eventually reaching extreme values at the outcrops of the fissures. Areas with an amplification factor between 1.5 and 1 are zones with a slow rise of the amplification effect, and the dynamic response of the site is still affected by the fissures.
(3) The amplification of the dynamic response of an earth fissure site with positive fault characteristics has a significant “hanging side effect.” The amplification factor is often higher in the steep rise zone of the hanging side, and the hanging side has a further influence range.
(4) In the actual seismic fortification of the project, it is necessary to avoid the area where the amplification factor rises sharply. Alternatively, the strength of structures and foundations in the area should be increased, and additional seismic fortification measures should be taken. In areas where the amplification factor rises slowly, the seismic fortification level of the structure should also be strengthened according to the amplification factor, so that it can withstand 1.5 times the expected seismic factor.
In this study, based on the microtremor test, typical earth fissures in the Yuncheng Basin of China were taken as the research objects, and dynamic amplification patterns at earth fissure sites were systematically revealed using spectral characterization of the microtremors. We propose preliminary seismic fortification for different dynamic amplification areas. This study provides a reference for the seismic fortification of sites with similar engineering conditions and the subject of seismic amplification effect in similar sites. In addition, the numerical simulation of seismic responses of fissure sites and different structures is expected to further improve the results of the amplification effect and provide more detailed suggestions for seismic fortification under different seismic intensities.
Author Contributions
Conceptualization, Y.D.; Software, G.C.; Investigation, G.C., J.C., Y.X. and N.H.; Writing—original draft, G.C.; Writing—review & editing, G.C., Y.D. and H.M.; Supervision, Y.D.; Funding acquisition, Y.D. and H.M. All authors have read and agreed to the published version of the manuscript.
Funding
This research was funded by [National Natural Science Foundation of China] grant number [41772275], [Fundamental Research Funds for the Central Universities] grant number [300102268203], [Scientific Research Plan Projects of Shaanxi Education Department] grant number [20JK0801], [Natural Science Basic Research Program of Shaanxi Province] grant number 2022JQ-289, [Fundamental Research Funds for the Central Universities] grant number 300102262505, and [Key Research and Development projects of Shaanxi Province] grant number 2022SF-197.
Institutional Review Board Statement
Not applicable.
Informed Consent Statement
Not applicable.
Data Availability Statement
The data presented in this study are available on request from the corresponding author. The data are not publicly available due to the processed data required to reproduce these findings cannot be shared at this time as the data also forms part of an ongoing study.
Conflicts of Interest
The authors declare no conflict of interest.
References
- Carpenter, M.C. Earth-Fissure Movements Associated with Fluctuations in Ground-Water Levels Near the Picacho Mountains, South-Central Arizona, 1980–1984; U.S. Geological Survey: Reston, VA, USA, 1991. [CrossRef]
- Rojas, E.; Arzate, J.; Arroyo, M. A method to predict the group fissuring and faulting caused by regional groundwater decline. Eng. Geol. 2002, 65, 245–260. [Google Scholar] [CrossRef]
- Laike, M.A. Environmental hazard from fissures in the main Ethiopian rift. J. Afr. Earth Sci. 1998, 27, 481–490. [Google Scholar] [CrossRef]
- Qiao, J.W.; Peng, J.B.; Deng, Y.H.; Wen, H.; Zang, M. The study on basic characteristic of earth fissure in Linfen basin. J. Eng. Geol. 2015, 23, 856–865. [Google Scholar] [CrossRef]
- Snider, L.C. A suggested explanation for the surface subsidence in the goose greek oil and gas field. AAPG Bull. 1927, 11, 729–745. [Google Scholar] [CrossRef]
- Minor, H.E. Goose greek oil field. Harris county, Texas. Adv. World Pet. Geosci. 1925, 9, 286–297. [Google Scholar] [CrossRef]
- Leonard, R.J. An earth fissure in Southern Arizona. J. Geol. 1929, 37, 765–774. [Google Scholar] [CrossRef]
- Li, Y.S.; Li, J.Z.; Bian, J.M.; Wu, X.D. The Ground Fissures in Xi’an; Seismological Press: Beijing, China, 1986. [Google Scholar]
- James, T.N.; Langer, A.M.; Kerr, P.F. Giant desiccation polygons of great basin playas. Geol. Soc. Am. Bull. 1968, 79, 69–90. [Google Scholar] [CrossRef]
- Fletcher, J.E.; Harris, K.; Peterson, H.B.; Chandler, V.N. Piping. Eos Trans. Am. Geophys. Union 1954, 35, 258–262. [Google Scholar] [CrossRef]
- Li, X.S. Some new view on the genetic mechanism of Xi’an ground fractures. J. Xi’an Collage Geol. 1994, 16, 75–80. [Google Scholar] [CrossRef]
- Holzer, T.L. Faulting caused water level declines, San, Joaquin Valley, California. Water Resour. Res. 1980, 16, 1065–1070. [Google Scholar] [CrossRef]
- Holzer, T.L. Reconnaissance Maps of Earth Fissure and Land Subsidence, Bowie and Willecox Areas, Arizona; Miscellaneous Field Studies Map; U.S. Geological Survey: Reston, VA, USA, 1980. [CrossRef]
- Yang, K.Y.; Wu, C.J. Deformation Monitoring and Research in Xi’an Ground Fissures; Shannxi Normal University Press: Xi’an, China, 1986. [Google Scholar]
- Wan, J.W.; Li, B.; Tan, C.X.; Zhang, P.; Feng, C. Characteristics and mechanism of earth fissures in China: A case Study of Fenhe River-Weihe river basin, Hebei plain and Suzhou-Wuxi-Changzhou plain. Geol. Rev. 2019, 65, 1383–1396. [Google Scholar] [CrossRef]
- Deng, Y.H.; Peng, J.B.; Mu, H.D.; Li, L.; Sun, Z. Ground fissures germination mechanism of deep structure activities in Weihe basin. J. Jilin Univ. 2007, 4, 433–440. [Google Scholar] [CrossRef]
- Deng, Y.H.; Peng, J.B.; Li, L.; Huandong, M.U. Causative relationship between basement stretching and ground fissures formation in Weihe basin. J. Eng. Geol. 2013, 21, 92–96. [Google Scholar] [CrossRef]
- Peng, J.B.; Fan, W.; Li, X.A.; Wang, Q.L.; Feng, X.J.; Zhang, J.; Li, X.S.; Lu, Q.Z.; Hunag, Q.B.; Ma, R.Y.; et al. Some key questions in the formation of ground fissures in the Fen-Wei basin. J. Eng. Geol. 2007, 4, 433–440. [Google Scholar] [CrossRef]
- Peng, J.B.; Li, X.A.; Fan, W.; Chen, Z.X.; Su, S.R.; Song, Y.H.; Lu, Q.Z.; Deng, Y.H.; Chen, L.W.; Sun, P. Classification and development pattern of caves in the loess plateau. Earth Sci. Front. 2007, 14, 234–244. [Google Scholar] [CrossRef]
- Peng, J.B.; Qiao, J.W.; Leng, Y.Q.; Wang, F.; Xue, S. Distribution and mechanism of the ground fissures in Wei river basin, the origin of the silk road. Environ. Earth Sci. 2016, 75, 718. [Google Scholar] [CrossRef]
- Wu, Q.; Jiang, Z.Q.; Li, Y.L. Research on Ground Fissure Disaster in Shanxi Faulted Basin; Geological Publishing House: Beijing, China, 2003. [Google Scholar]
- Song, Y.H.; Peng, J.B.; Lu, Q.Z.; Li, Z. A type of special Shear-crush ground fissures located in Shanxi graben system. J. Eng. Geol. 2007, 4, 448–452. [Google Scholar] [CrossRef]
- Meng, L.C.; Peng, J.B.; Lu, Q.Z.; Li, Z. Genetic and analysis on ground fissures existed in the transformer substation of Wanrong county. Geotech. Investig. Surv. 2010, 38, 1–6. [Google Scholar]
- Xu, J.S.; Zhuang, H.D.; Tang, D.Q.; Li, Z.C. Characteristic and mechanism analysis of ground fissures in Yuncheng basin. J. Geol. Hazards Environ. Preserv. 2010, 21, 97–100. [Google Scholar] [CrossRef]
- Chen, Y.M. Study on the characteristics of ground fissures in Shanxi fault basin. Chin. J. Geol. Hazard Control 2016, 27, 72–80+89. [Google Scholar] [CrossRef]
- Qiao, J.W.; Peng, J.B.; Lu, Q.Z. Basic characteristic and mechanism analysis of Weiguo earth fissure in Yuncheng basin. J. Nat. Disasters 2017, 26, 110–119. [Google Scholar] [CrossRef]
- Zhao, J.Y.; Wang, H.G.; Lu, Q.Z.; Qiao, J. Basic features of ground fissures in Yuncheng basin and emei platform. Chin. J. Geol. Hazard Control. 2018, 29, 58–67. [Google Scholar] [CrossRef]
- He, M.; Zhai, D.L.; Qiao, J.W.; Kang, C. Basic features and mechanism of Dalyu-Baizhang ground fissure in Yuncheng basin, Shanxi province. Chin. J. Geol. Hazard Control 2019, 30, 74–83. [Google Scholar] [CrossRef]
- Liu, C.; Peng, J.B.; Chen, L.W.; Deng, Y.; Wu, M. Finite element analysis of seismic effects on ground fissures in Xi’an. J. Eng. Geol. 2012, 20, 979–985. [Google Scholar] [CrossRef]
- Fan, W.; Nie, Z.Q.; Chen, D.M.; Deng, L.S. Study on seismic effect of ground fissure-A case study on a ground fissure in Xianyang, Shannxi. J. Catastrophology 2014, 29, 82–88. [Google Scholar] [CrossRef]
- Liu, N.N.; Huang, Q.B.; Men, Y.M.; Peng, J.B. Model test on dynamic response of ground with fissures under seismic loading. Chin. J. Rock Mech. Eng. 2014, 33, 1024–1031. [Google Scholar]
- Huang, Q.B.; Gao, H.; Liu, N.N.; Ma, Y.J. Shaking table model test on seismic response of metro tunnel crossing ground fissure site. J. Geomech. 2018, 24, 785–794. [Google Scholar] [CrossRef]
- Xiong, Z.M.; Zhang, C.; Huo, X.P.; Chen, X. Shaking table tests on acceleration response of ground fissure site. Chin. J. Geotech. Eng. 2018, 40, 520–526. [Google Scholar] [CrossRef]
- Mu, H.D.; Deng, Y.H.; Li, R.J.; Xu, G. Dynamic response and influencing factors of ground fissure sites in Xi’an. China Earthq. Eng. J. 2019, 41, 418–427. [Google Scholar] [CrossRef]
- Xiong, Z.M.; Zhang, C.; Chen, X. Model test on ground motion parameters of site with fissures under seismic loading. Rock Soil Mech. 2019, 40, 421–428. [Google Scholar] [CrossRef]
- Shaanxi Provincial Construction Office. Specification for Site Investigation and Engineering Design on Xi’an Ground Fractures (DBJ61-6-2006); Shanxi Provincial Construction Press: Changfeng, China, 2006. [Google Scholar]
- Ministry of Housing and Urban Rural Development of the People’s Republic of China. Code for Seismic Design of Buildings (GB50011-2010); China Architecture & Building Press: Beijing, China, 2010.
- Kanai, K.; Tamaka, T. Measurement of microtremor I. Bull. Earthq. Res. Inst. 1954, 199–209. [Google Scholar]
- Aki, K. Space and time spectra of stationary stochastic eaves, with special reference to microtremors. Bull. Earthq. Res. Inst. 1957, 35, 415–456. [Google Scholar] [CrossRef]
- Ohta, Y.; Kagami, H.; Goto, N.; Kudo, K. Observation of 1-to 5-second microtremors and their application to earthquake engineering. Part I: Comparison with long-period accelerations at the Tokachi-Oki earthquake of 1968. Bull. Seismol. Soc. Am. 1978, 68, 767–779. [Google Scholar] [CrossRef]
- Kagami, H.; Duke, C.M.; Liang, G.C.; Ohta, Y. Observation of 1 to 5-second microtremors and their application to earthquake engineering. Part II. Evaluation of site effect upon seismic wave amplification due to extremely deep soil deposits. Bull. Seismol. Soc. Am. 1982, 72, 987–998. [Google Scholar] [CrossRef]
- Kagami, H.; Okada, S.; Keishi, S.; Oner, M.; Dravinski, M.; Mal, A.K. Observation of 1 to 5 second microtremors and their application to earthquake engineering. Part III. A two-dimensional study of site effects in the San Fernando valley. Bull. Seismol. Soc. Am. 1986, 76, 1801–1812. [Google Scholar] [CrossRef]
- Lacoss, R.T.; Kelly, E.J.; Toksoz, M.N. Estimation of seismic noise structure using Arrays. Geophysics 1969, 34, 21–38. [Google Scholar] [CrossRef]
- Toksoz, M.N.; Richard, T.L. Microseisms: Mode structures and source. Science 1968, 159, 872–873. [Google Scholar] [CrossRef] [PubMed]
- Nakamura, Y. A method for dynamic characteristics estimation of subsurface using microtremors on the ground surface. Q. Rep. Rtri 1989, 30, 25–33. [Google Scholar]
- Bard, P.Y. Microtremors measurements:a tool for site effect estimation? In Proceedings of the Second International Symposium on the Effects of Surface Geology on Seismic Motion, Yokohama, Japan, 1–3 December 1998; pp. 1251–1279. [Google Scholar]
- Konno, K.; Ohmachi, T. Ground-motion characteristics estimated from spectral ratio between horizontal and vertical components of microtremor. Bull. Seismol. Soc. Am. 1998, 88, 228–241. [Google Scholar] [CrossRef]
- Lermo, J.; Chavez-Garcia, F.J. Are microtremors useful in site response evaluation? Bull.-Seismol. Soc. Am. 1994, 84, 1350–1364. [Google Scholar] [CrossRef]
- Guo, M.Z.; Song, Z.Q. On Nakamura method for dynamic analysis of ground characteristics with microtremor. World Inf. Earthq. Eng. 2000, 2, 88–92. [Google Scholar] [CrossRef]
- Guo, M.Z.; Xie, L.L.; Yu, H.Y. Research pm analytic methods for microtremor mechanism. World Earthq. Eng. 2002, 18, 17–23. [Google Scholar] [CrossRef]
- Guo, M.Z.; Ren, F.H. The microtremor methods for dynamics measurement of sites. World Earthq. Eng. 2005, 21, 139–142. [Google Scholar] [CrossRef]
- Zhang, L.G.; Deng, Y.H.; Xue, J.; Wang, H.; Liu, Q.; Yang, Y. Preliminary research on dynamic response characteristics of microtremor at ground fissure sites-illustrated with F6 ground fissure in Xi’an. J. Eng. Geol. 2017, 25, 784–793. [Google Scholar] [CrossRef]
- Chang, J.; Deng, Y.H.; Xuan, Y.; Yan, Z.; Wu, W.; He, J. The dynamic response of sites with earth fissures as revealed by mcrotremor analysis—A case study in the Linfen basin, China. Soil Dyn. Earthq. Eng. 2020, 132, 106076. [Google Scholar] [CrossRef]
Figure 1.
Geographical location of the Yuncheng Basin.
Figure 1.
Geographical location of the Yuncheng Basin.
Figure 2.
Structure and earth fissure distribution map of the Yuncheng Basin.
Figure 2.
Structure and earth fissure distribution map of the Yuncheng Basin.
Figure 3.
The locations of six typical earth fissures and survey lines in the Yuncheng Basin and their profiles. (a) Profile of F1 earth fissure site, (b) profile of F2 earth fissure site, and (c) profile of F5 earth fissure site.
Figure 3.
The locations of six typical earth fissures and survey lines in the Yuncheng Basin and their profiles. (a) Profile of F1 earth fissure site, (b) profile of F2 earth fissure site, and (c) profile of F5 earth fissure site.
Figure 4.
Earth fissure hazards in the Yuncheng Basin. (a–c) earth fissure hazard, (d) surface dislocations caused by earth fissures.
Figure 4.
Earth fissure hazards in the Yuncheng Basin. (a–c) earth fissure hazard, (d) surface dislocations caused by earth fissures.
Figure 5.
Schematic diagram of microtremor testing.(A represents hanging side, B represents heading side, M represents Measurement point, also in the following figures).
Figure 5.
Schematic diagram of microtremor testing.(A represents hanging side, B represents heading side, M represents Measurement point, also in the following figures).
Figure 6.
Fourier spectrum, response spectrum, and Arias intensity analysis results for line S1.
Figure 6.
Fourier spectrum, response spectrum, and Arias intensity analysis results for line S1.
Figure 7.
Fourier spectrum, response spectrum, and Arias intensity analysis results for line S2.
Figure 7.
Fourier spectrum, response spectrum, and Arias intensity analysis results for line S2.
Figure 8.
Fourier spectrum, response spectrum, and Arias intensity analysis results for line S3.
Figure 8.
Fourier spectrum, response spectrum, and Arias intensity analysis results for line S3.
Figure 9.
Fourier spectrum, response spectrum, and Arias intensity analysis results for line S4.
Figure 9.
Fourier spectrum, response spectrum, and Arias intensity analysis results for line S4.
Figure 10.
Fourier spectrum, response spectrum, and Arias intensity analysis results for line S5.
Figure 10.
Fourier spectrum, response spectrum, and Arias intensity analysis results for line S5.
Figure 11.
The amplitude attenuation curves of each site.
Figure 11.
The amplitude attenuation curves of each site.
Figure 12.
Amplification factor diagrams of the different analyses. (a) Fourier amplification factor and fitting curve, (b) response spectrum amplification factor and fitting curve, and (c) Arias intensity amplification factor and fitting curve.
Figure 12.
Amplification factor diagrams of the different analyses. (a) Fourier amplification factor and fitting curve, (b) response spectrum amplification factor and fitting curve, and (c) Arias intensity amplification factor and fitting curve.
Table 1.
The extreme value of the amplification factor of each analysis method.
Table 1.
The extreme value of the amplification factor of each analysis method.
| | Hanging Side | Heading Side |
|---|
| Fourier | 2.1 | 1.8 |
| Response | 1.8 | 1.6 |
| Arias | 3.2 | 2.9 |
Table 2.
The influence range of each analysis method.
Table 2.
The influence range of each analysis method.
| | Hanging Side | Heading Side |
|---|
| Amplification factor | 1.5 | 1 | 1.5 | 1 |
| Fourier | 7.1 m | 21.2 m | 5.9 m | 20.0 m |
| Response | 5.0 m | 18.5 m | 3.8 m | 18.0 m |
| Arias | 13.3 m | 23.9 m | 9.2 m | 17.3 m |
| Disclaimer/Publisher’s Note: The statements, opinions and data contained in all publications are solely those of the individual author(s) and contributor(s) and not of MDPI and/or the editor(s). MDPI and/or the editor(s) disclaim responsibility for any injury to people or property resulting from any ideas, methods, instructions or products referred to in the content. |
© 2023 by the authors. Licensee MDPI, Basel, Switzerland. This article is an open access article distributed under the terms and conditions of the Creative Commons Attribution (CC BY) license (https://creativecommons.org/licenses/by/4.0/).


