Article

Controllable Friction of an Epoxy Composite via Thermal Treatment

1
State Key Laboratory of Tribology in Advanced Equipment, School of Mechanical Engineering, Tsinghua University, Beijing 100084, China
2
State Key Laboratory of Solid Lubrication, Lanzhou Institute of Chemical Physics, Chinese Academy of Sciences, Lanzhou 730000, China
*
Authors to whom correspondence should be addressed.
Appl. Sci. 2023, 13(17), 9899; https://doi.org/10.3390/app13179899
Submission received: 23 July 2023 / Revised: 28 August 2023 / Accepted: 30 August 2023 / Published: 1 September 2023

Abstract

:
Smart surfaces with controllable friction have generated considerable attention lately. However, most composites prepared with traditional fillers cannot achieve “real-time” friction conversion. Herein, a new smart surface was designed to achieve different friction coefficients (0.65 and 0.12). Different coefficients of friction were reversibly and precisely controlled via heating. Via friction and heating, 1H,1H,2H,2H-perfluorohexyl hexadecane (PHHD), a kind of phase-change material—paraffin wax—was released from the microcapsules, and a stable and complete film was formed. It changed the interface from “solid-solid” to “solid-liquid” in a dry friction state. The composite contains microcapsules that prevent phase separation between PHHD and matrix, which enables the composite to have a long service time and switchable friction performance. In addition, this composite can maintain its extraordinary ability even in harsh environments like UV irradiation. By demonstrating switchable friction based on changes in the interactions between contact interfaces, this work provides a new principle for designing smart tribological composites.

1. Introduction

Friction is the force that arises between two surfaces in relative motion and plays a critical role in modern industrial manufacturing. On the one hand, it can result in energy loss and wear, leading to a decline in machine efficiency and service life [1]; on the other hand, as modern devices become more complex and miniaturized, access to moving parts becomes highly limited. Therefore, controlling friction is crucial for maintaining the structural and operational stability of modern devices. In addition, it allows for real-time friction changes in response to actual working conditions, enhancing the accuracy and reliability of machine equipment [2]. Controlled friction has also been used in various fields, such as drug release, motion-manipulated cell culturing, and adhesives [3], and has the potential to help us understand the origin and mechanism of friction and expand friction-related applications.
From the perspective of materials science, friction force is mainly determined by the interactions between interfaces, such as electrostatic interactions, hydrophobic interactions, and adhesion effects [4,5,6]. Therefore, adjusting the interaction states between two contact interfaces is an effective method to achieve smart friction. One potential method is the construction of smart interfaces, which are functional materials that can change their microstructures [7,8] or physical/chemical characteristics in response to environmental stimuli like heat [9], light [2], magnetism [10,11], electric fields [12], etc. This allows for changes in macroscopic properties like wettability, adhesion, and friction. Smart interfaces have already found applications in various fields, such as self-cleaning [13], droplet manipulation [14], and microfluidic technology [15]. Among the above stimuli, heating is a simple, low-cost, and versatile method. Wang et al. [2] prepared a photothermal composite with “real-time” friction conversion ability via four steps. The GO formed a three-dimensional GO on a melamine foam template, and then, a sandwich structure was obtained in three steps (vacuum impregnation, template removal and vacuum impregnation). Under friction and NIR irradiation, this surface realized the real time conversion of friction coefficient (COF, from 0.052 to 0.062). Wu et al. [16] achieved the construction of an MXene-functionalized Poly-N-isopropylacrylamide/chitosan double network hydrogel. This MXene-based hydrogel showed a very low COF of 0.02 at low temperatures, and after illuminating it with NIR light, the COF of this surface increased to 0.15. Those two composites successfully achieved the conversion of COF, however, the fabrication processes for them are complex and ineffective, making them unsuitable for practical applications. Hou et al. [17,18] designed smart surfaces with switchable wettability. With different wettability, the COF of the surfaces could be controlled from 0.1 to 0.6, and 0.13 to 0.4, respectively. However, these surfaces could not achieve “real-time” friction conversion. Therefore, fabricating perfect interfaces with real time conversion of friction remains a challenge.
Microcapsules with core–shell structures have attracted much attention as encapsulation materials for friction due to their high surface area, large inner volume, and tunability [19,20,21,22,23,24,25,26]. Xiong et al. [27] used mesoporous carbon nanospheres as nanoscale containers and prepared an oil-containing composite with excellent tribological performance and self-lubricating properties. Ren et al. [22] reported a microcapsule composite system suitable for high-load friction. In those papers, lubricants were encapsulated in microcapsules, and as long as the microcapsules were ruptured via a certain stimulus at the right time, real-time friction conversion could be realized. Therefore, microcapsules are a good choice to be used to fabricate smart interfaces with “real-time” friction conversion.
Herein, we designed a smart material with “real-time” friction conversion. The COF could be varied between 0.1 and 0.7 by heating and cooling the composite. A kind of phase-change paraffin, 1H,1H,2H,2H-perfluorohexyl hexadecane (PHHD; phase transition temperature (Tg) was approximately 80 °C), was encapsulated in microcapsules using an in situ polymerization method [20]. The composite was obtained by evenly mixing the microcapsules into an epoxy (EP) resin matrix. The factor that enabled “real-time” friction conversion was changing the contact state between the contact interfaces via heating. At room temperature (RT), the contact state between the interfaces presented as “solid‒solid” due to the high viscosity and poor fluidity of PHHD. After heating above the Tg, the microcapsules ruptured, the PHHD transferred to the interface, and the contact interface state changed to “solid-liquid”, achieving “real-time” frictional switching from 0.7 to 0.1. This method is very effective and convenient, and the transition between different states can be repeated at least 5 times. The protective effect of the microcapsules on PHHD ensured that this composite exhibited a long service time and an excellent frictional conversion ability in harsh environments.

2. Materials and Methods

2.1. Preparation of 1H, 1H, 2H, 2H-Perfluorohexyl Hexadecanoate

PHHD was prepared using the following method and the reaction (Scheme 1). 1H,1H,2H,2H-Perfluorohexan-1-ol (5.2818 g) and triethylamine (2.3274 g) were added to dry CH2Cl2 (150 mL) under the protection of nitrogen, and then palmitoyl chloride (5.4974 g) was added. The mixture was stirred at a speed of 500 rpm at room temperature for at least 12 h and washed with deionized water, saturated sodium carbonate solution, and saturated salt water. After filtration and drying, PHHD was obtained. The yield of PHHD was calculated as 90.36%.

2.2. Preparation of Microcapsules

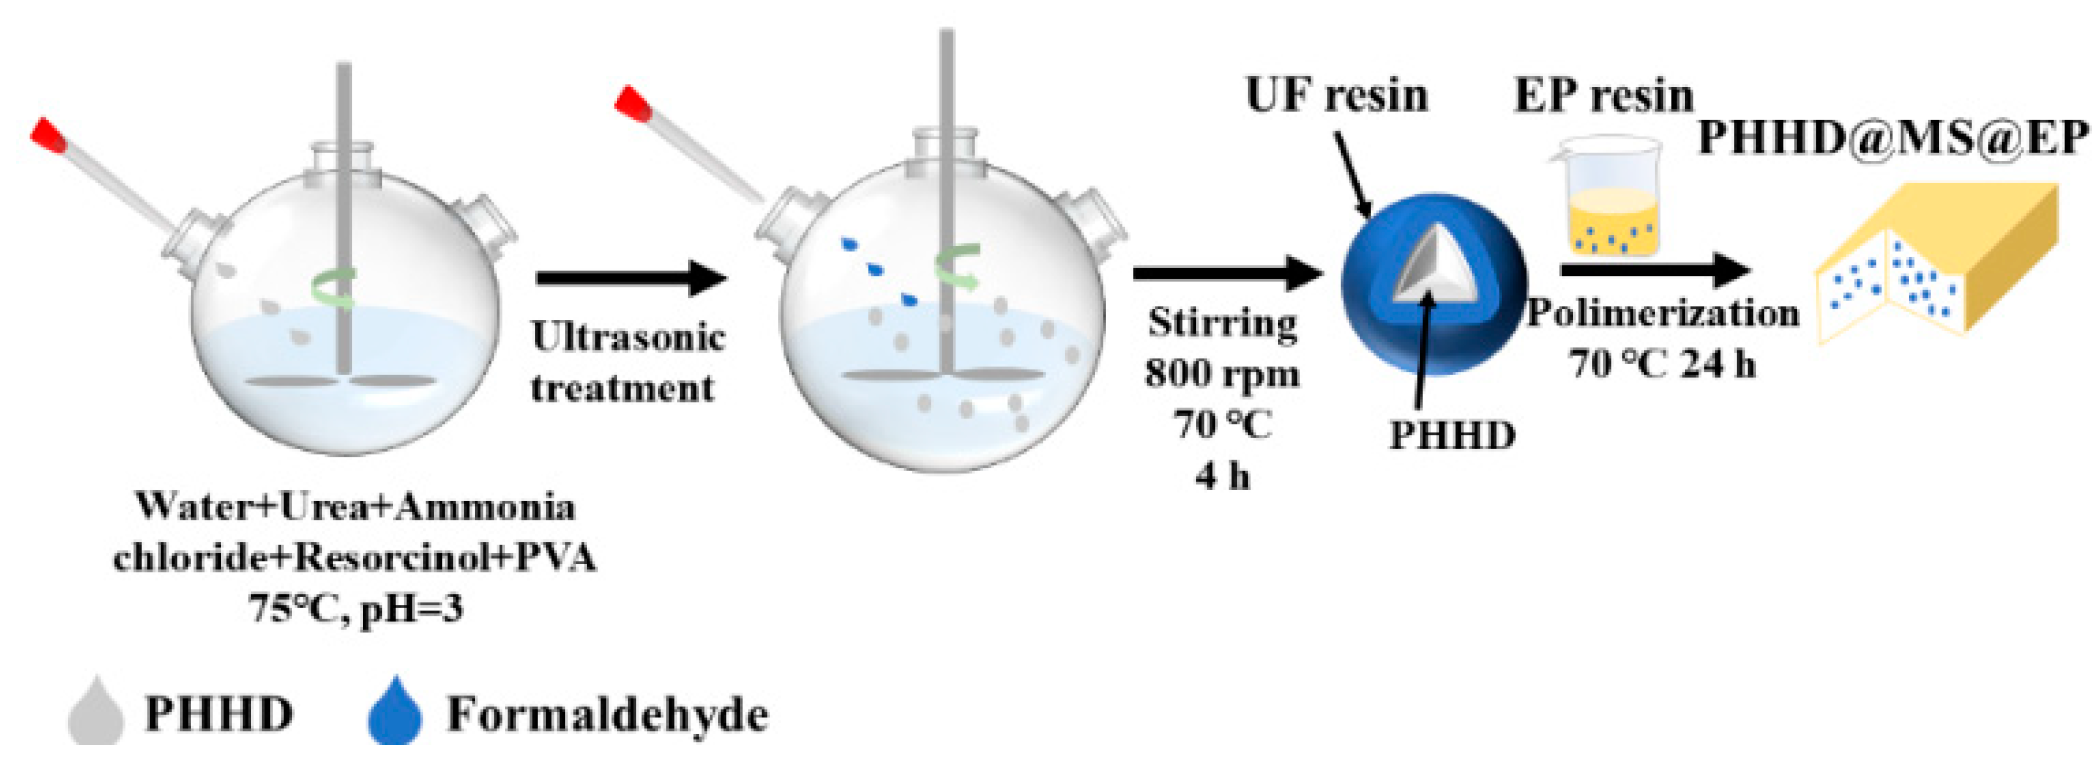
Microcapsules containing PHHD (PHHD@MS) were prepared using the in situ polymerization technique, which was illustrated in Scheme 2. Firstly, 7.0 g of urea, 0.5 g of NH4Cl, 0.5 g of resorcinol, 5 g of PVA, and 250 mL of deionized water were added into a 500 mL round-bottom flask at a stirring speed of 150 rpm. Secondly, a 10 wt% NaOH solution was added to raise the pH of the solution from approximately 2.5 to 3.5. Then, the solution was heated to 75 °C. Thirdly, after melting, the PHHD was slowly injected into the flask. A 300 W ultrasonic homogenizer was utilized to obtain Pickering emulsion. Fourthly, 12.67 g of formalin (37% formaldehyde) was added, the solution temperature was slowly raised to 70 °C and maintained for 2 h at a stirring speed of 800 rpm. After that, an additional 150 mL of deionized water was added to the solution. After reacting for another 2 h, the reaction was ended. Finally, the suspension of microcapsules was cooled down to ambient temperature. Microcapsules were obtained after the suspension was rinsed with water and acetone, filtered, and air-dried for 24 h. In contrast, microcapsules without PHHD (NPHHD@MS) were also synthesized under the same conditions.

2.3. Preparation of Epoxy Composites

To achieve a uniform dispersion, the EP liquid was heated to 60 °C, and PHHD@MS was added with stirring, after that, the dispersion was ultrasonicated for 20 min. Then, the solution was cooled to room temperature, and 2.5 g of diamine as a curing agent was added under agitation. Then, air bubbles were removed via vacuum drying for approximately 30 min. After that, the mixture was carefully poured into molds, and PHHD@MS-decorated epoxy (PHHD@MS@EP) was obtained after all specimens underwent a curing reaction at 70 °C for 24 h. The control experiments included microcapsules without PHHD (Shell@EP) and PHHD without encapsulation (PHHD@EP) under the same conditions.

2.4. Friction Test of EP Composites

The tribological performance of the samples was analyzed using the ball-on-disk mode with a universal microtribometer (UMT-5, CETR, Billerica, MA, USA). In this mode, one component of the friction pair, the EP composite, was fixed in the reciprocating stage, while the other component, the GCr 15 steel ball bearing (diameter: 4 mm; surface roughness: 5 nm; hardness: 193 HB), was fixed on the force sensor. The average coefficient of friction (COF) was obtained from three measurements of each sample. The UMT-5 was used to conduct friction-switching experiments at different temperatures based on the Tg. In Section 3.3, the reciprocating friction stroke was 5 mm, the sliding speed was 5 cm/s, and the test load was 1.5 N.
A noncontact optical profilometer (ZYGO, Nexview, Tokyo, Japan) and FESEM (Hitachi, Tokyo, Japan, 10 kV) were employed to observe the morphology of the wear tracks and calculate the wear volume. Firstly, the worn part was outlined, and then the unworn part as a horizontal line was selected. Secondly, Calculate Volume was selected in the menu bar, and the volume of the worn part below the horizontal line was automatically calculated, which was the worn volume. The wear rates (Ws) of various EP composites are calculated as follows [27]:
Ws = ΔV/(FNd)
where ΔV is the wear volume. FN is the normal load applied on the GCr 15 ball, and d is the wear distance. Every set of experiments was performed three times.

2.5. Durability Test of PHHD@MS@EP

In the long-term stability test, a piece of PDDH@MS@EP was irradiated with UVA for 28 h. Every 2 h, it was washed with ethyl alcohol, and a friction-switching test was performed.

2.6. Characterization

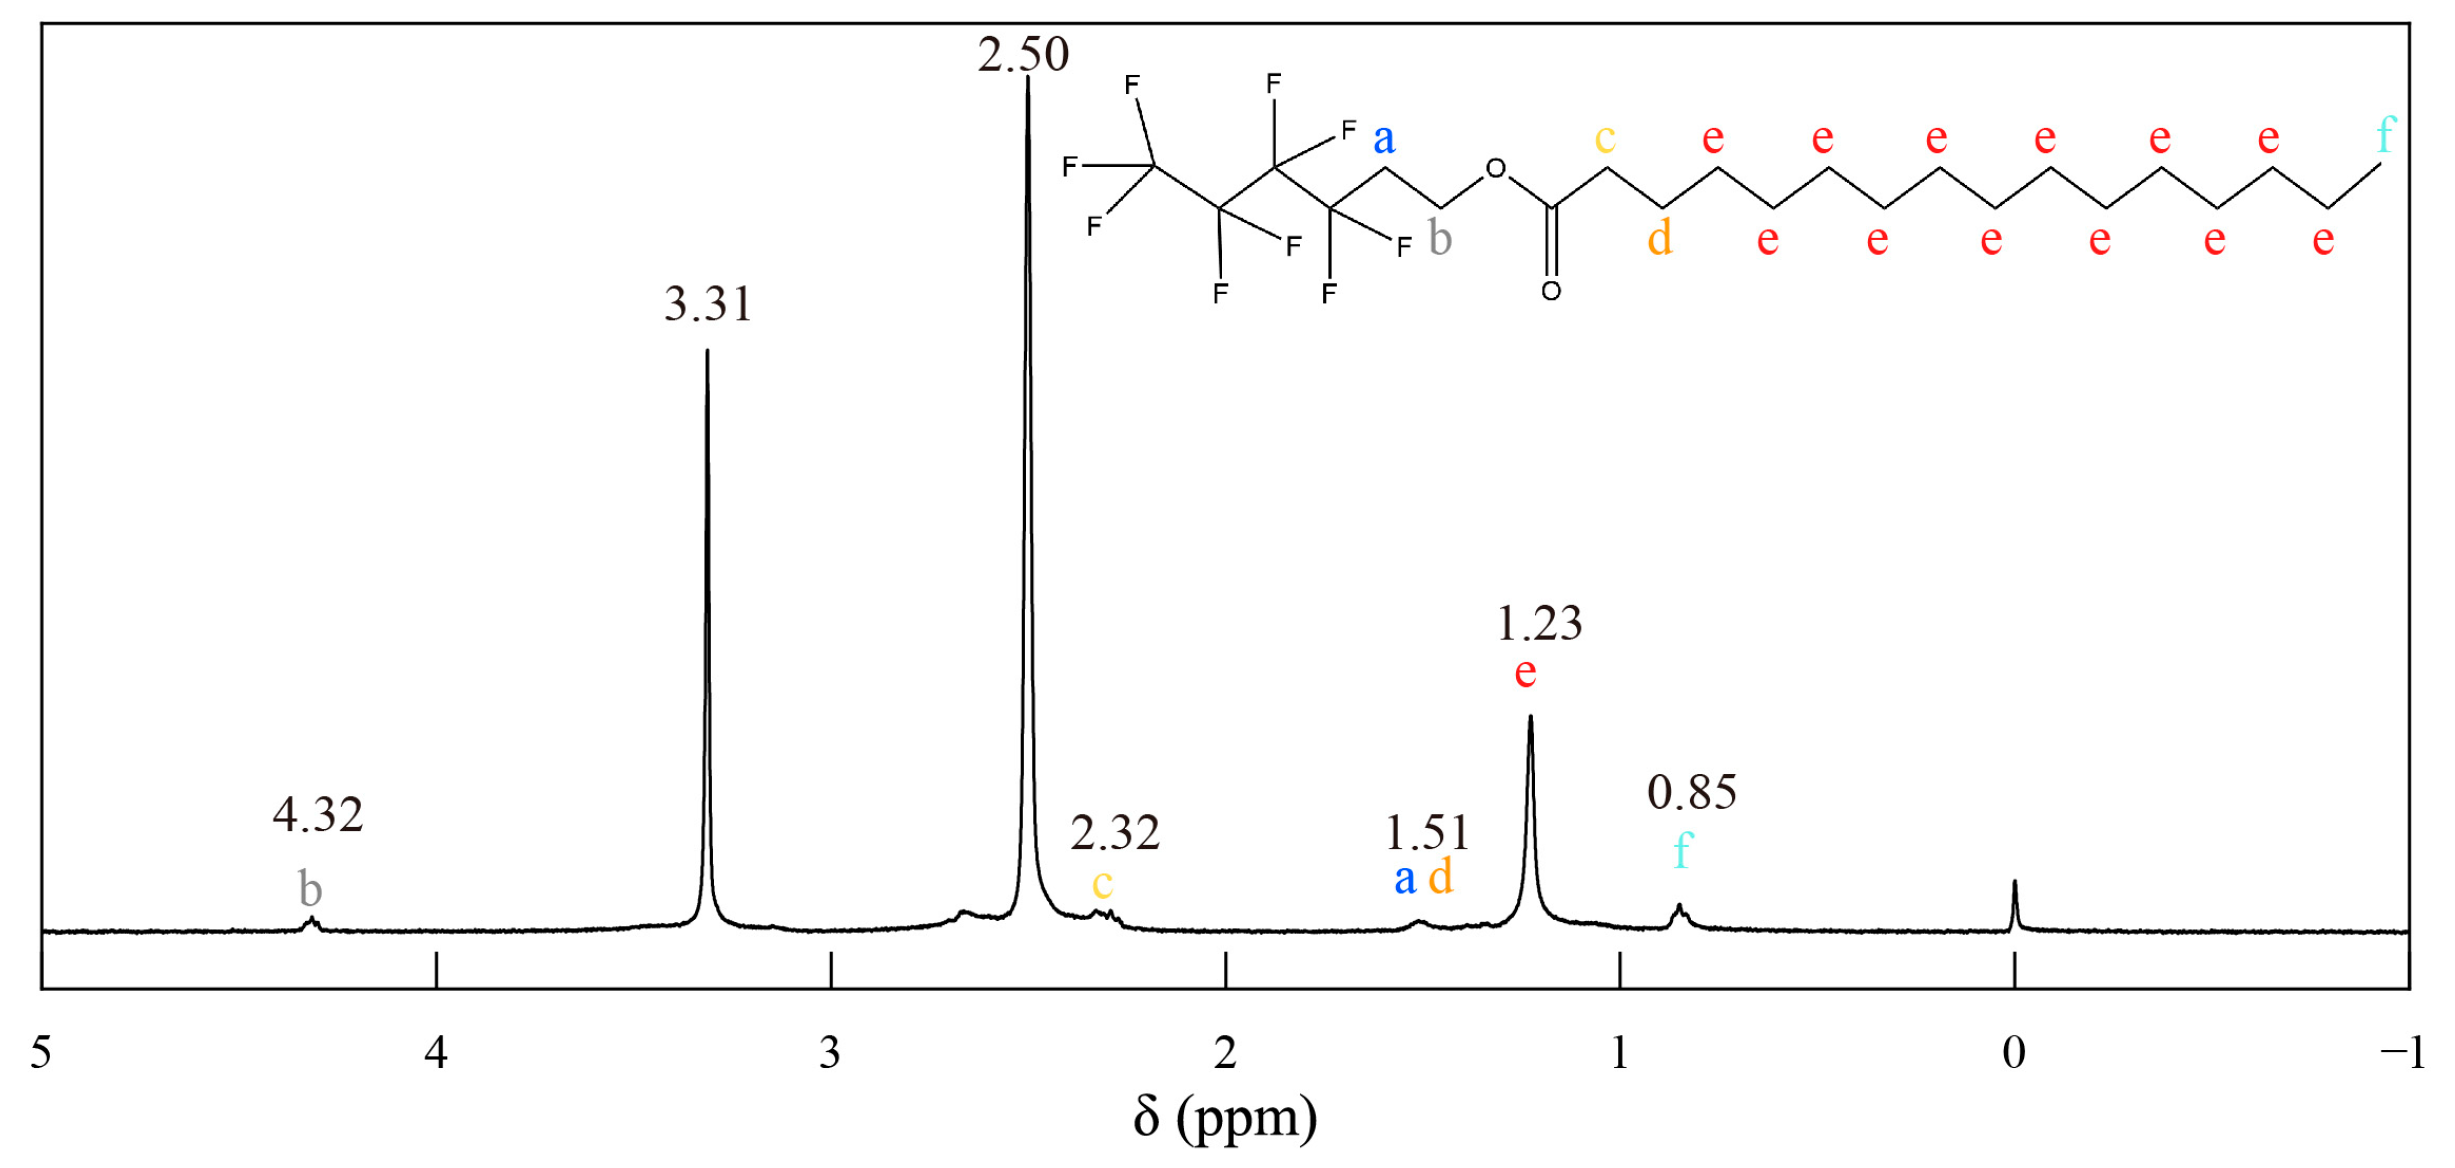
The chemical compositions of the samples were characterized using X-ray photoelectron spectroscopy (XPS, ESCALAB 250xi spectrometer, Thermo Scientific, Waltham, MA, USA). The binding energy of C 1s (284.8 eV) was used as the reference. The thermal stabilization of PHHD and the encapsulation capacity of PHHD@MS were measured with a thermogravimetric analyzer (TGA, NETZSCH STA 449 F5/F3 Jupiter) from 30 to 600 °C in a nitrogen atmosphere. The phase-change feature of PHHD was determined using differential scanning calorimetry (DSC) with temperatures ranging from 20 to 80 °C at a heating rate of 1 °C per minute in a nitrogen atmosphere. Infrared spectroscopic measurements were performed with a Fourier-transform infrared spectrometer (FTIR, Bruker TENSOR27, KBr disks, Billerica, MA, USA). 1H NMR spectrometry was performed at 400 Hz. By dissolving PHHD in d6-DMSO, the molecular structure of PHHD was characterized by the proton nuclear magnetic resonance (1H NMR). As shown in Figure 1, six kinds of protons were found in PHHD, with an atom ratio of a:b:c:d:e:f = 2:2:2:2:24:3. In the 1H NMR spectrum, the atomic ratio of protons in the different chemical environment was 2.18:2:2.19:2.31:24.13:3.17, which was almost the same as the atomic ratio in the molecular formula. The NMR information of the product is as follows. 1H NMR (600 MHz, d6-DMSO, TMS) δ (ppm): 0.85 (s, 3H), 1.23 (s, 12H), 1.51 (s, 2H), 2.32 (s, 2H), 2.68 (s, 2H), and 4.32 (s, 2H). In addition, the strong peaks at 2.5 ppm and 3.3 ppm were attributed to the solvent and residual water, respectively.
The particle size distribution was analyzed using a nanoparticle size and zeta potential analyzer (Zetasizer Nano ZS, Malvern, Malvern, UK). The microcapsule surface morphology and size were observed using field-emission scanning electron microscopy (SEM, QUANTA 200 FEG, FEI, Hillsboro, OR, USA). TEM (JEM-2100F, JEOL, Tokyo, Japan) was utilized to observe the microstructures of the PHHD@MS samples. The compressive and tensile strengths were determined using an electronic universal testing machine (WDW-100/E, Kason Group, Jinan, Shandong, China) with a rate of 2 mm/min at ambient temperature. A shore hardness tester (SLX-D, Aili, Hefei, Anhui, China) was used to determine the surface hardness.

3. Results and Discussion

3.1. Fabrication and Characterization of PHHD

The chemical composition of PHHD was determined using XPS and is shown in Figure 2a. The appearance of the F 1s peak at 688.9 eV indicates the existence of fluorine groups. The IR spectrum is shown in Figure 2b. The strong peak at 1737 cm−1 was assigned to the stretching vibrations of the C=O (new bond). Combined with the results of the 1H NMR of PHHD (Figure 1), the above results indicate the successful synthesis of PHHD.
The Tg of PHHD was determined using DSC, as shown in Figure 2c. The DSC curve shows that the Tg was approximately 80 °C, which suggests that PHHD could melt above this temperature.

3.2. Fabrication and Characterization of Microcapsules and EP Composites

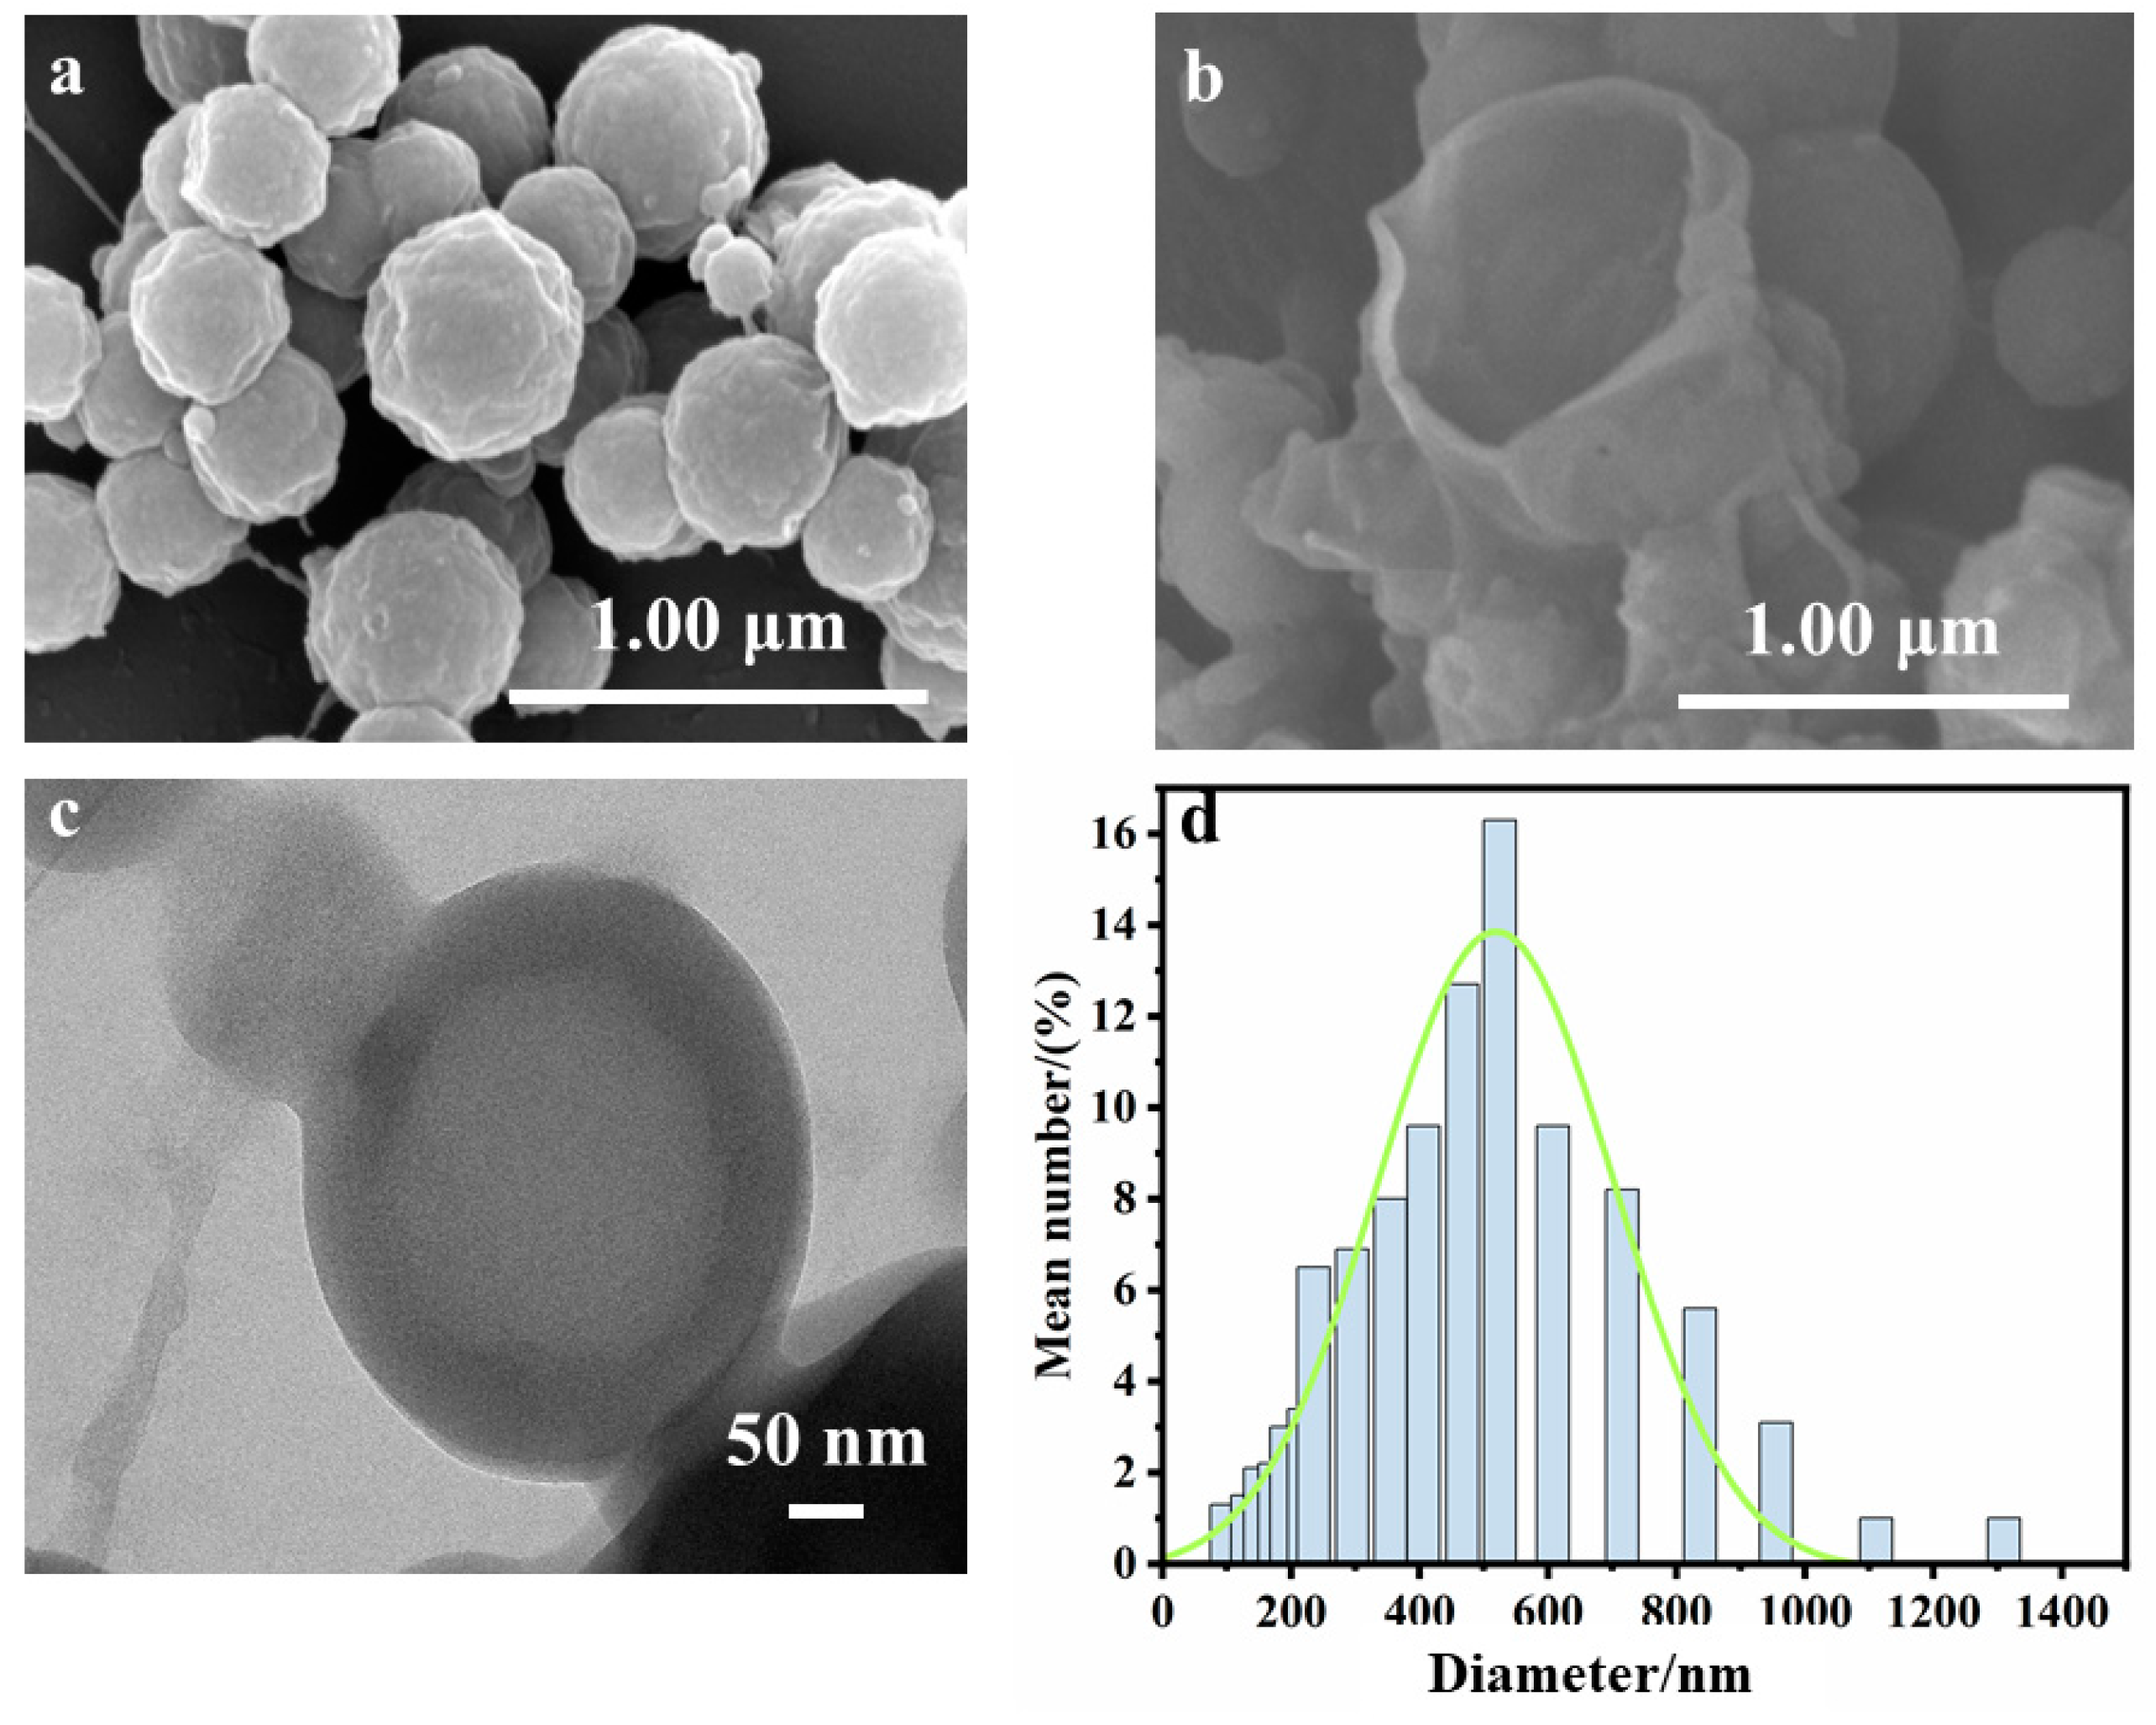
PHHD@MS was produced using the in situ polymerization of urea and formaldehyde in Pickering emulsion (described in Section 2.2 and illustrated in Scheme 2) [23,24,26]. SEM and TEM presented the surface morphologies of PHHD@MS (Figure 3a–c). The SEM images (Figure 2a,b) reveal that the microcapsules were spherical. Their surfaces were rough and uneven with sizes varying from 100 to 1100 nm, which is consistent with the result of the particle size analysis (Figure 3d). As shown in Figure 3c, an obvious core–shell structure was obtained in the microcapsules, which confirmed the successful fabrication of PHHD@MS. Since the thermal decomposition temperature of PHHD overlapped with the shells of the microcapsules, therefore, the conventional method to obtain the encapsulation of microcapsules was not suitable here. The extraction method with tetrahydrofuran, which was a poor solvent for the shells but a good one for PHHD, was carried out to obtain the encapsulation capacity of the cores, which was approximately 32%.
Figure 4a–c shows the mechanical properties of different EP composites. The results show that after adding PHHD and PHHD@MS, the mechanical properties of PHHD@EP and PHHD@MS@EP decreased slightly. The tensile stress values of EP, PHHD@EP, and PHHD@MS@EP were 30 MPa, 21 MPa, and 18 MPa, respectively, and the compressive stress values were 75 MPa, 60 MPa, and 60 MPa, respectively. Under the same compressive stress and tensile stress, the deformation of PHHD@MS@EP and PHHD@EP was larger than that of EP. As shown in Figure 4c, the surface hardness of EP was 82 HS, and after adding PHHD, it decreased to 80 HS, and decreased to 78 HS after adding PHHD@MS. Such results were expected because of the weak interface between PHHD or PHHD@MS and the EP material. It has been reported that low mechanical properties can improve contact area smoothness [24,27].

3.3. Friction and Wear Tests of EP Composites

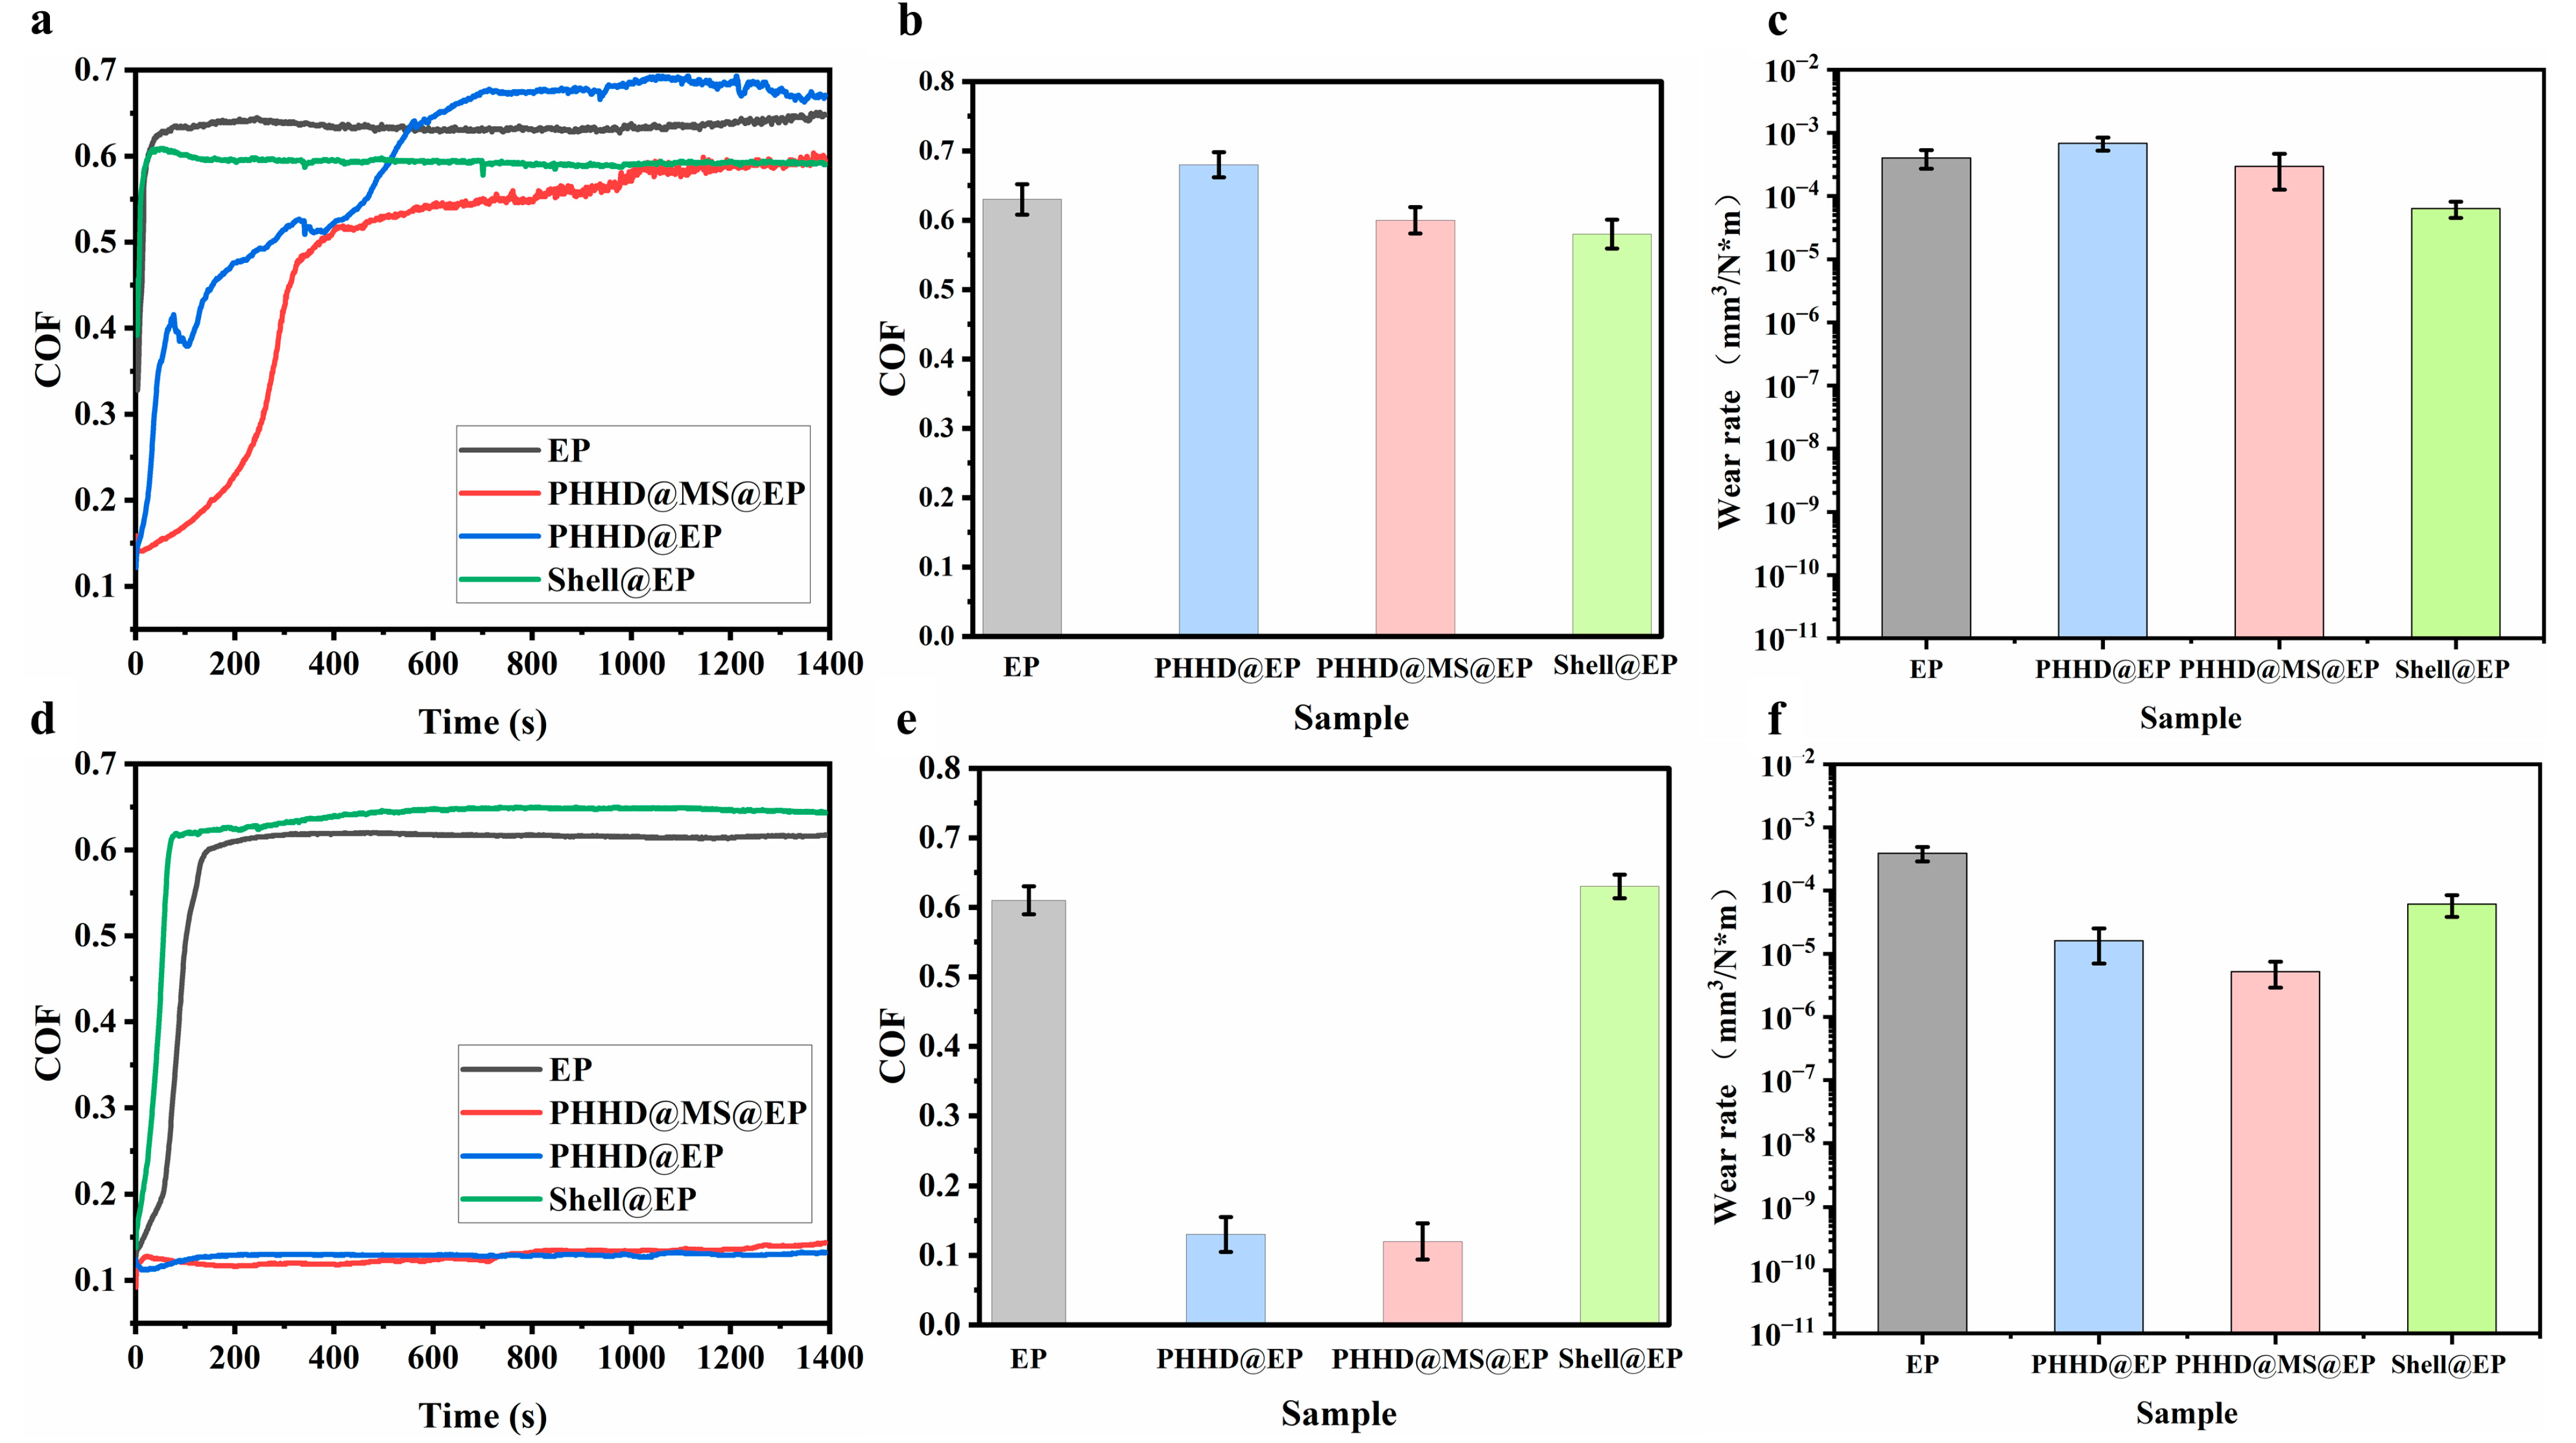
Figure 5a–f present the tribological performances of various EP composites at RT or 80 °C (the mass fraction of microcapsules or PHHD was 10% in every composite). As shown in Figure 5a,b, the COF of EP and Shell@EP at RT increased rapidly to approximately 0.6. This shows that adding NPHHD@MS had no significant reductive effect on the friction. After adding PHHD, at RT, the COF of PHHD@EP and PHHD@MS@EP increased continuously to 0.6 in contrast with the EP resin. This means that adding PHHD could extend the duration of the running time. When the temperature increased to 80 °C, as shown in Figure 5d,e, PHHD@EP and PHHD@MS@EP showed a low and stable COF of approximately 0.13 over time, which means that filling PHHD could produce excellent lubricating properties at 80 °C.
After the above friction tests, the wear scars on different composites at 80 °C were analyzed with a 3D white-light interferometer (Figure S1). The wear scars of EP and Shell@EP were obvious, suggesting that the composites were seriously worn during the friction tests. Conversely, after adding PHHD, the wear scars on PHHD@EP were greatly reduced. The method to calculate the wear rate value was described in Section 2.4 and analyzed as shown in Figure 4c,f. A high wear rate was observed in all EP composites, PHHD@EP (6.80 × 10⁻⁴ mm3/(N·m), RT), PHHD@MS@EP (2.96 × 10⁻⁴ mm3/(N·m), RT), EP (4.23 × 10⁻⁴ mm3/(N·m), RT), and Shell@EP (5.23 × 10⁻⁵ mm3/(N·m), RT). However, the wear resistance of PHHD@MS@EP and PHHD@EP was improved when the temperature increased to 80 °C, with the wear rate decreasing to 1.604 × 10⁻⁵ mm3/(N·m) and 5.204 × 10⁻⁶ mm3/(N·m), respectively. Moreover, the wear rate did not decrease for EP (3.89 × 10⁻⁴ mm3/(N·m)) and Shell@EP (6.11 × 10⁻⁵ mm3/(N·m)) at that temperature. The above results suggest that adding PHHD to the EP composites provided a significantly higher wear resistance at 80 °C.
To further verify the influence of PHHD on COF reduction and wear resistance, the worn surfaces of the EP composites were observed (Figure 6; the experiment was performed at 80 °C). The wear surfaces of EP resin and Shell@EP showed fatigue wear characterized by scale-like damage with cracks [24]. After adding PHHD, two-body abrasion was the main mechanism, and the wear track became smoother with several slight peels. The F element appeared according to the EDS result, indicating that PHHD appeared at the interface between the EP composite and the steel ball (Figure S2b). Furthermore, the wear track of PHHD@MS@EP was less coarse, and the worn surface was rather flat because the PHHD@MS was broken (Figure 6d). Moreover, the EDS result in Figure S2d confirms that PHHD was transferred to the friction interface. PHHD prevented direct contact between the ball and the polymer substrate and showed self-lubricating properties. The wear mode was changed to mild polishing.
The mechanism behind the above phenomenon was also investigated. PHHD was in a solid state, when released to the friction interface at low temperatures. The reduction effect on the COF was not obvious due to the high viscosity and low fluidity of PHHD. As it underwent a phase transformation from solid to liquid at its melting point of 80 °C, PHHD was transferred to the friction film (for PHHD@MS@EP, the microcapsules broke under mechanical forces; a ruptured microcapsule was observed on the worn surface, as shown in Figure 6d), which prevented direct contact between the ball and the EP composites. The obtained low COF meant that the state between the ball and the composites changed from “solid‒solid” to “solid‒liquid”. As a result, a low COF and wear rate were obtained.
To investigate the role of the microcapsules, we tested the lubrication of PHHD@EP and PHHD@MS@EP for a long time at 80 °C, as shown in Figure 7a. PHHD@MS@EP presented a low and stable COF for approximately 5000 s, which was much longer than that of PHHD@EP (approximately 2800 s). It was speculated that the main reason behind this phenomenon was that after heating to 80 °C, as the state of PHHD changed from solid to liquid, phase separation between the EP resin and PHHD occurred in PHHD@EP. As shown in Figure 7b, after a friction test for 5000 s, no peaks corresponding to F appeared in the XPS spectra on the top side of PHHD@EP; however, on the bottom side of PHHD@EP, an obvious peak at 688.9 eV due to F appeared and F was mainly in the form of C-F, which came from the PHHD (Figure 7c). As the PHHD at the friction interface precipitated at the bottom, the lubricity on the other side decreased and even disappeared. On the other hand, as the shells of the microcapsules did not melt at 80 °C [17,25], PHHD@MS was still evenly dispersed in the EP resin. Therefore, phase separation was avoided through the introduction of microcapsules. PHHD@MS@EP had a longer service life than PHHD@EP.

3.4. Friction and Wear Test of PHHD@MS@EP

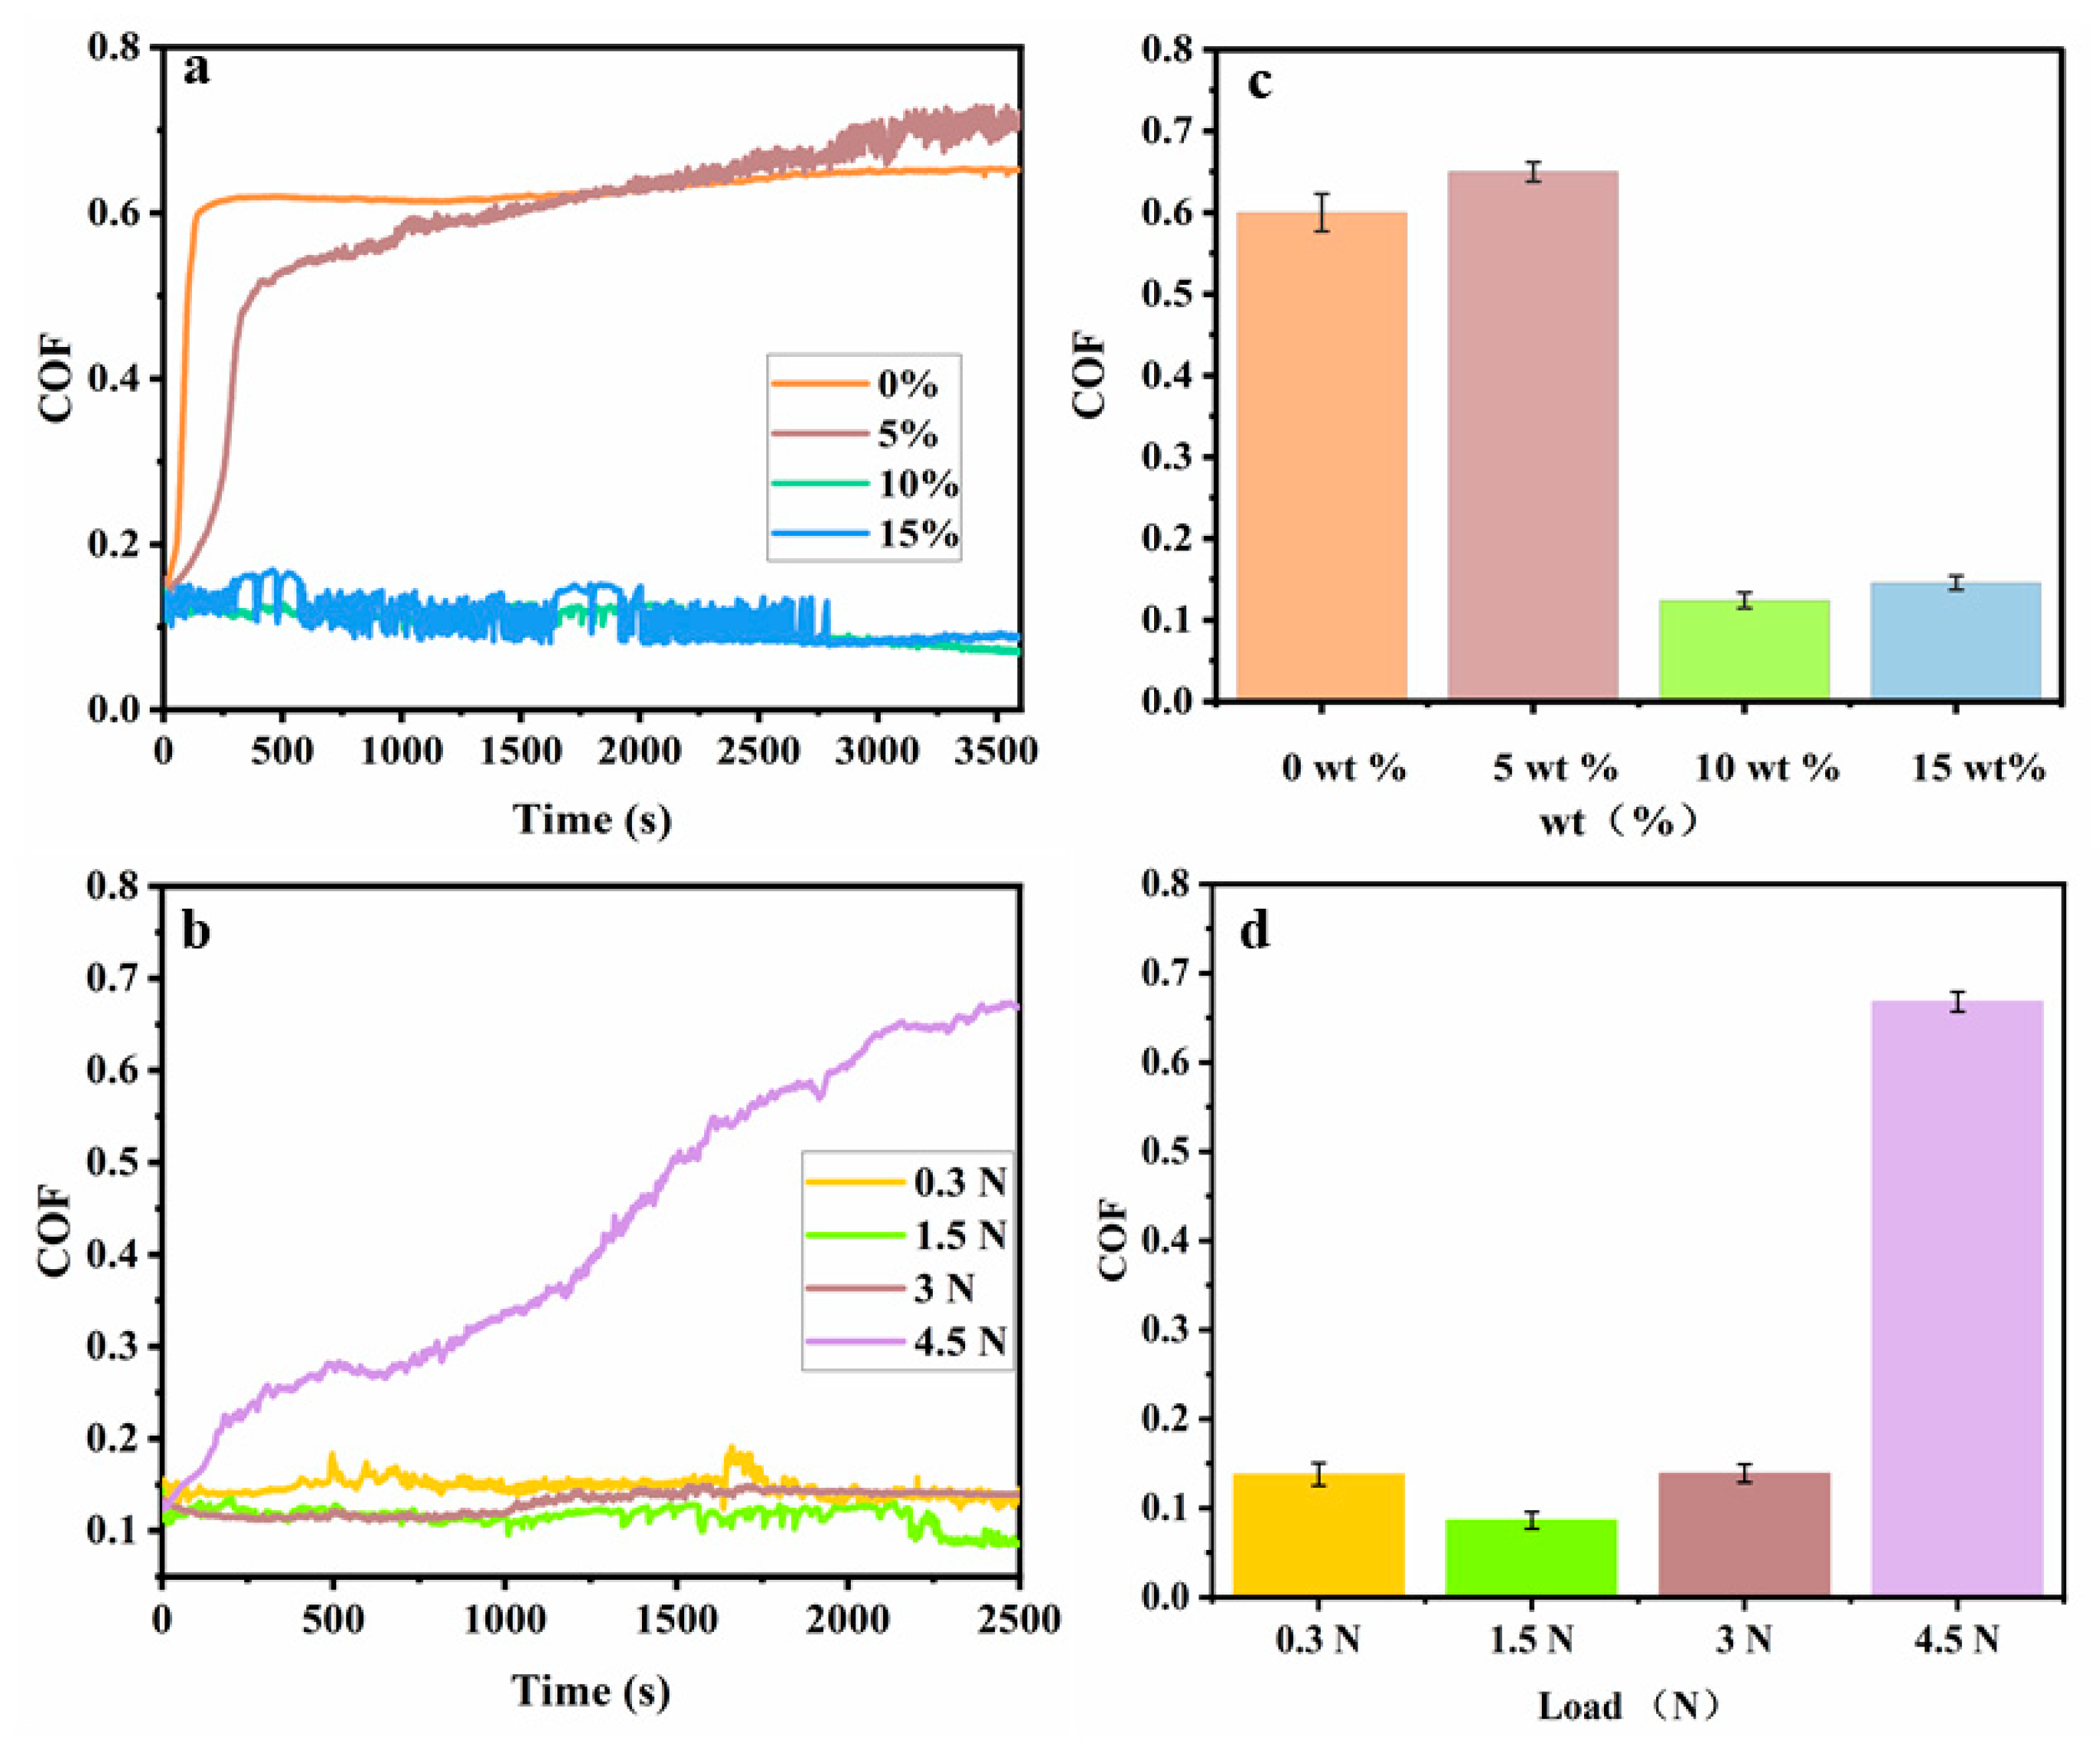
EP composites with different mass fractions of PHHD@MS were investigated to identify a possible optimum microcapsule concentration that would minimize the COF (Figure 8a,b) (the reciprocating friction stroke was 5 mm, sliding speed was 5 cm/s, and the test load was 1.5 N). As shown in Figure 8a, when the mass fraction of microcapsules increased from 0 wt% to 10 wt%, the lubricity of PHHD@MS@EP was enhanced, and the COF was reduced from 0.65 to 0.07. When the microcapsule content increased from 10 wt% to 15 wt%, the lubricity decreased slightly as the COF increased to 0.09. The average COF of the composites with 10 wt% and 15 wt% PHHD@MS showed excellent lubricating properties. However, as shown in Figure 8a, the former exhibited a relatively stable COF curve, which indicated a reliable improvement in the lubricating properties. Furthermore, the mechanical properties of PHHD@MS@EP samples with different mass fractions of PHHD@MS were investigated, as shown in Figure S3. PHHD@MS@EP with 15 wt% microcapsules had poorer mechanical properties than that with 10 wt%. The compressive stress of PHHD@MS@EP decreased from 65 MPa to 55 MPa, and the tensile stress decreased from 28 MPa to 23 MPa. The poor friction and mechanical properties were attributed to excessive microcapsules, leading to agglomeration and uneven dispersion in the composite, as shown in Figure S4, which clearly shows that some microcapsules were agglomerated [24].
PHHD@MS@EP under different loads was also investigated (Figure 8b,d) (reciprocating friction stroke was 5 mm, sliding speed was 5 cm/s, and mass fraction of microcapsules was 10% in every composite). The EP composite exhibited a decrease in the COF (from 0.14 to 0.09), as the load increased from 0.3 N to 1.5 N, then, an increase to 0.67 when load increased from 1.5 N to 4.5 N. This phenomenon was related to the plastic deformation and wear debris of PHHD@MS@EP [28]. In polymers, plastic deformation tended to occur when the load increased to a certain value during friction tests. And as said above, PHHD@MS@EP showed less compressive strength compared with EP, which means that plastic formation was much easier for PHHD@MS@EP. At first, the pressure produced by the load (0.3 N) could not make the microcapsules release enough PHHD, therefore, a relatively large COF was obtained. As the load increased to 1.5 N, according to the Hertz contact theory, the Hertz contact pressure was approximately 80 MPa. Unobvious plastic deformation happened in the wear track. And as the load continued to increase, microcapsules released more PHHD. Therefore, the COF decreased. As the load increased to 3 N and 4.5 N, obvious plastic deformation took place in the EP composite, which aggravated the development of abrasive and adhesive wear [27].
In summary, selecting an appropriate mass fraction of microcapsules and external load could significantly improve the lubricating properties of EP composites. Introducing microcapsules could not only enhance the lubricating properties but also prolong the service time of EP composites.

3.5. Friction-Switching Experiments Based on Thermal Treatment

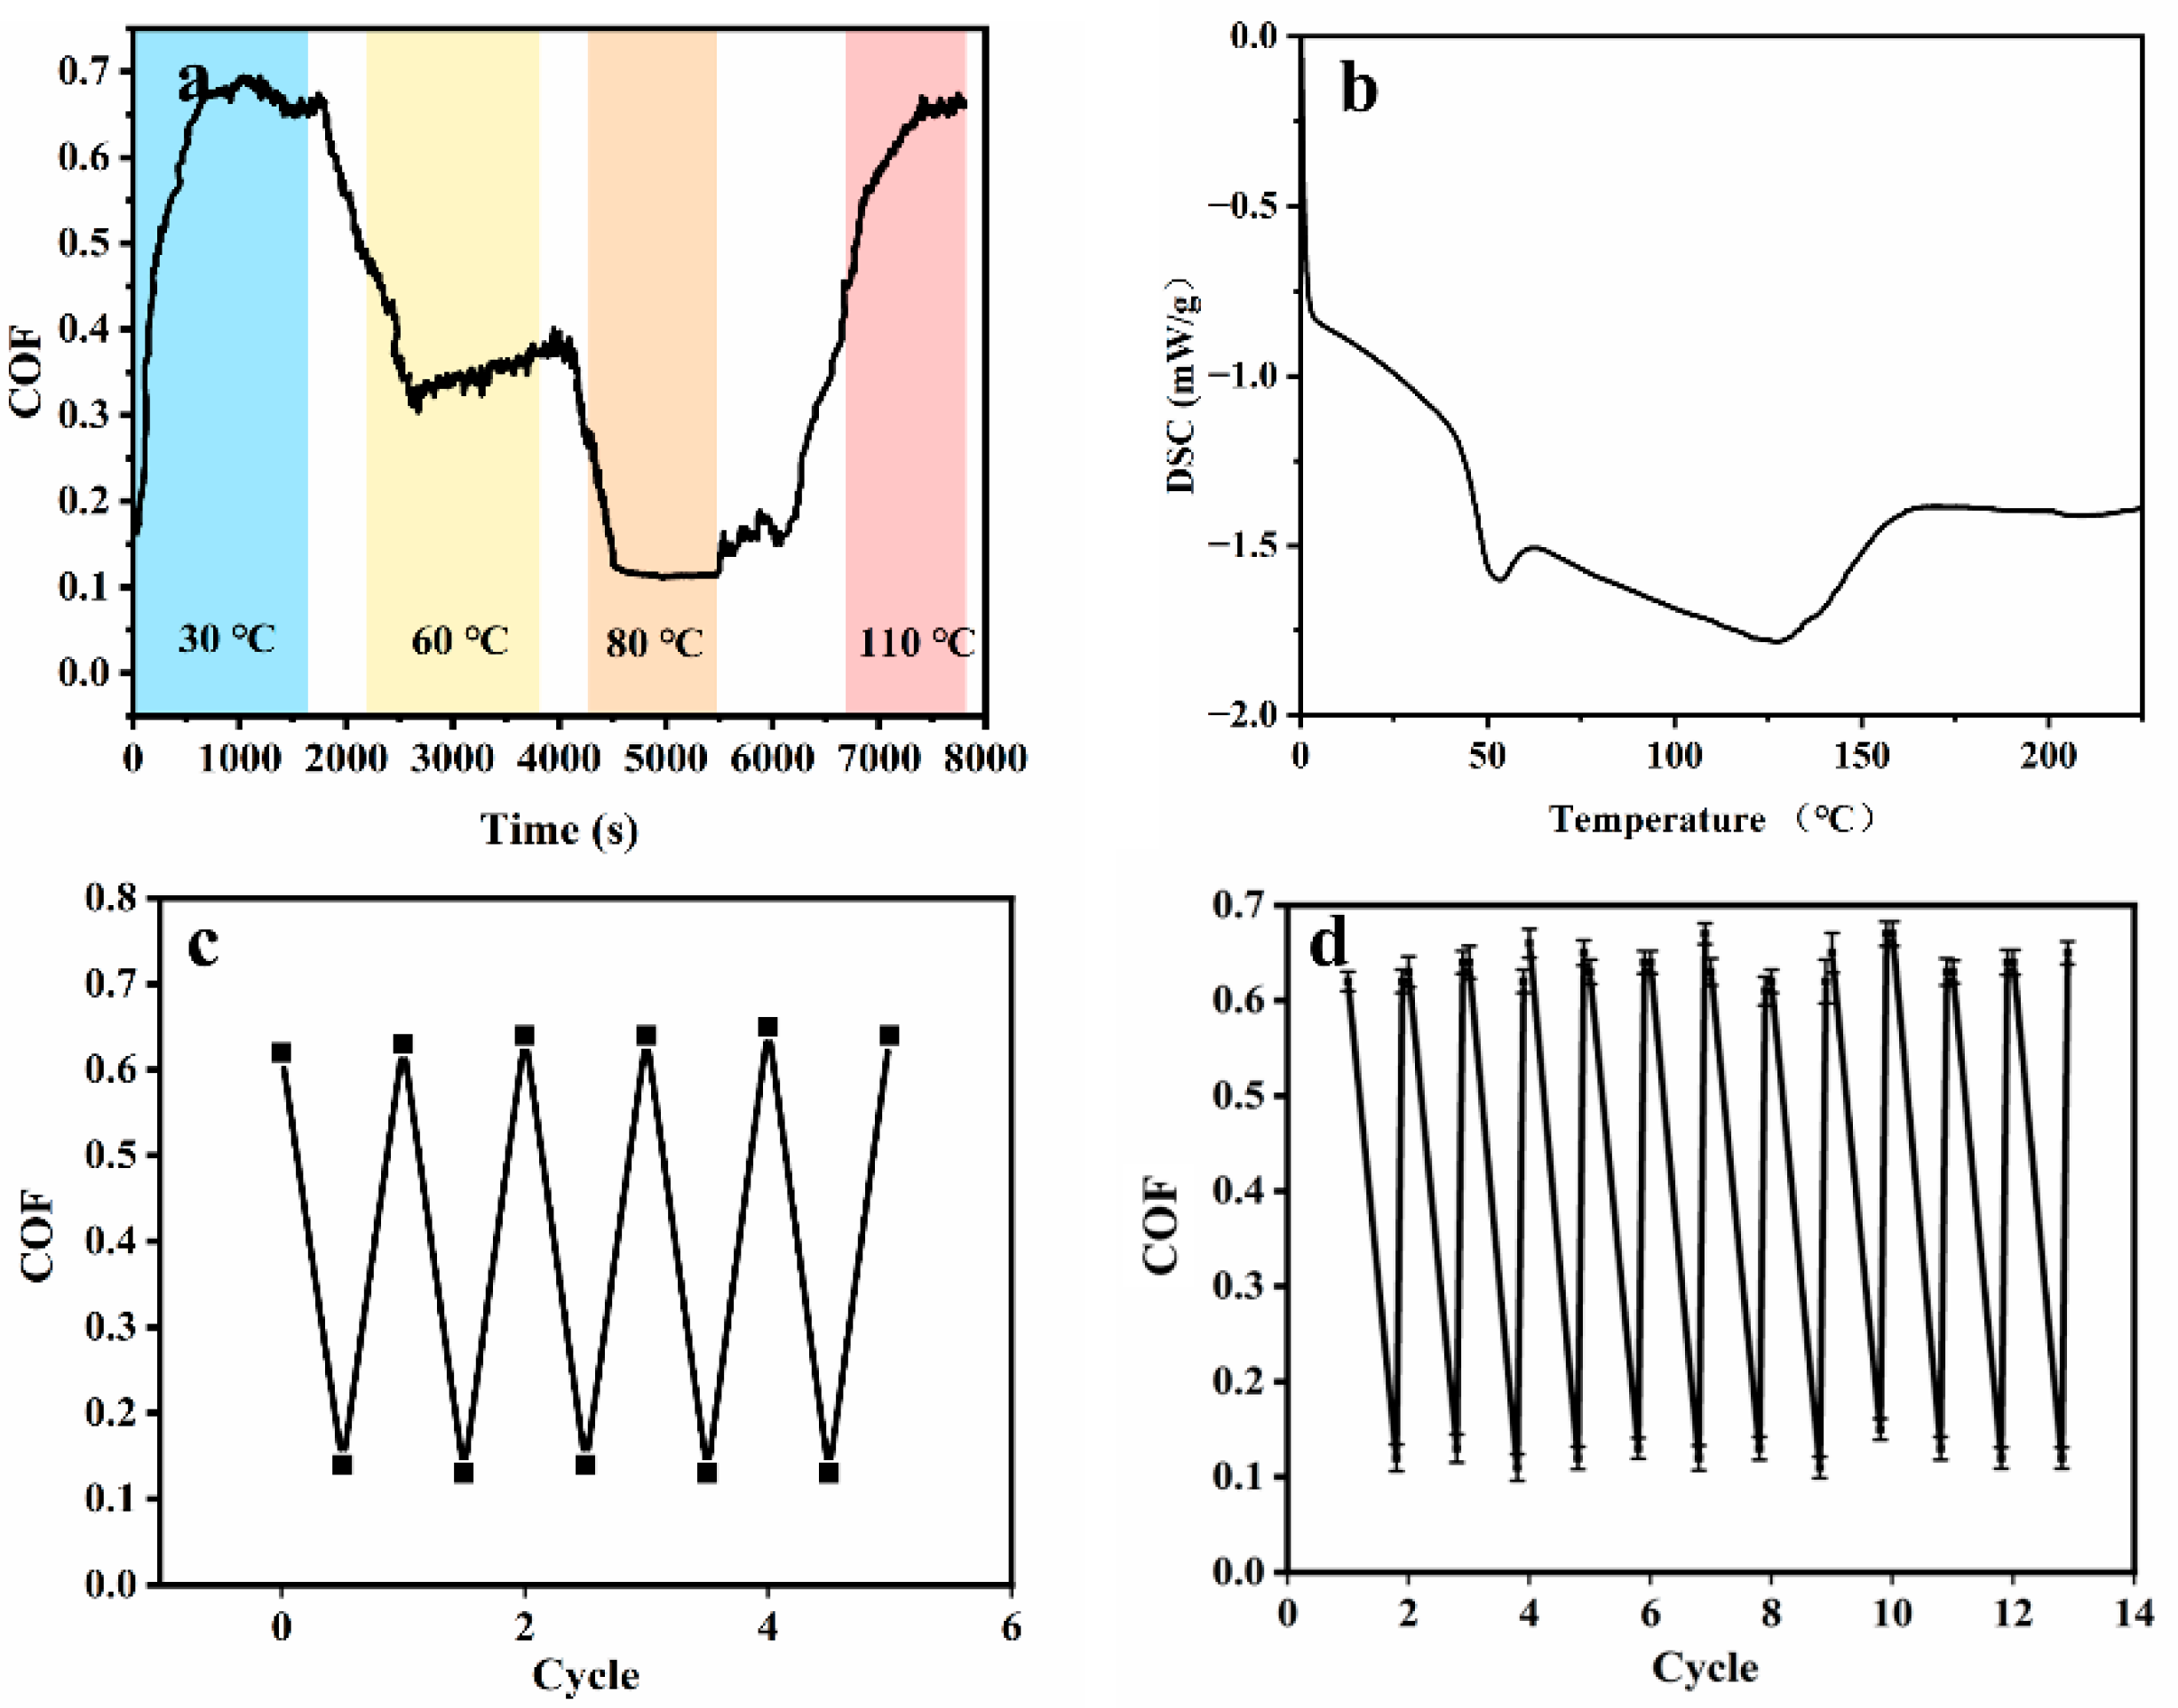
Scheme 3 illustrates the mechanism of the smart friction response to temperature. The key to realize “real-time” COF conversion was to change the contact state between the two interfaces. Below 80 °C, PHHD was released under mechanical forces, but due to the high viscosity and poor fluidity of PHHD, it could not easily flow to the frictional interface to form a stable film. At that point, the contact state was “solid‒solid”. As a result, a high COF was obtained. After heating above 80 °C, PHHD melted into a liquid with low viscosity and great fluidity. Microcapsules in the composite broke, and liquid PHHD transferred to the frictional interface [24,29,30,31]. The contact state between the ball and the sample changed from “solid‒solid” to “solid‒liquid”. Consequently, a low COF was obtained. When the temperature increased to 110 °C (below the melting temperature of the microcapsule shell [25]), the EP became soft (the melting point of EP was 128 °C, according to Figure 9b), which reduced its mechanical properties, making the working conditions unstable. The friction test of pure EP at 110 °C was also performed as shown in Figure S5, the COF of which slowly increased to approximately 0.7. This result confirmed the above conclusion. Therefore, a rest period of approximately 2–3 min before each cycle was necessary.
As shown in Figure 9a, the changes in the COF at different temperatures were recorded. At first, the COF stabilized at approximately 0.65 at RT after the running-in process because the contact state was “solid-solid”. As the temperature gradually rose to 60 °C, the increased fluidity and reduced viscosity of PHHD resulted in a lower COF of approximately 0.35. When the temperature continued to rise to 80 °C, the contact state changed totally from “solid-solid” to “solid-liquid”, and the COF significantly decreased to approximately 0.1. However, when the temperature continued to rise to 110 °C, the EP became soft, and the COF suddenly rose from 0.12 to 0.68. These results suggest that “real-time” friction conversion could be realized via heating.
Moreover, the switching of the frictional states could be repeated at least five times, as shown in Figure 9c. This result shows that PHHD@MS@EP could be used to establish smart friction.
In practical industrial applications, the long-term stability of PHHD@MS@EP is vital for achieving friction control. Conditions imitating a real environment were used to check the stability of PHHD@MS@EP. The methods were described in Section 2.5, and the results are shown in Figure 9d. The results show that PHHD@MS@EP retained the ability to alter friction for at least 24 h in a harsh environment, suggesting that it possessed excellent stability. The stability of PHHD@MS@EP was attributed to the protective effect of the microcapsules for PHHD against the environment. The shells of the microcapsules provided an interface between the encapsulated PHHD and the external environment.

4. Conclusions

In summary, a smart PHHD@MS@EP composite with smart tribological properties was successfully fabricated. The key factor to realize “real-time” COF conversion was to change the contact state between the ball and the sample under different temperatures. PHHD@MS@EP consisted of two components: EP resin and PHHD (encapsulated in microcapsules). PHHD@MS@EP realized the real-time conversion of COF simply via heating and cooling of the surface. Via heating, PHHD was released from the broken microcapsules and transferred to the frictional interface, changing the contact state between the interface from “solid‒solid” to “solid‒liquid” in a dry friction state. Here, microcapsules were first used for smart materials with smart tribological properties. The use of microcapsules protected PHHD against phase separation, which ensured the long service life and repeatability of PHHD@MS@EP. Our method is simple, versatile and could be easily applied to prepare large-scale surfaces. The effective strategy opens up a new way to design and prepare stimulus-responsive materials to achieve smart tribological properties.

Supplementary Materials

The following supporting information can be downloaded at https://www.mdpi.com/article/10.3390/app13179899/s1. Figure S1: Three-dimensional (3D) morphology of wear tracks at 80 °C. (a) pure EP; (b) Shell@EP; (c) PHHD@MS@EP; and (d) PHHD@EP. Figure S2: EDS spectra of (a) EP resin; (b) PHHD@EP; (c) Shell@EP; and (d) PHHD@MS@EP. Figure S3: (a) Compressive stress and (b) tensile stress of PHHD@MS@EP with different mass fractions of PHHD@MS. Figure S4: The SEM of the fracture surface of PHHD@MS@EP with 15 wt% PHHD@MS. Figure S5: The COF of pure EP at 110 °C.

Author Contributions

Conceptualization, J.W., Y.H. and L.C.; methodology, Y.H.; software, Y.L.; validation, Y.L. and Y.W. All authors discussed the results and contributed to the manuscript. All authors have read and agreed to the published version of the manuscript.

Funding

This research received no external funding.

Institutional Review Board Statement

Not applicable.

Informed Consent Statement

Not applicable.

Data Availability Statement

Data sharing is not applicable.

Conflicts of Interest

The authors declare no conflict of interest.

References

  1. Glavatskih, S.; Höglund, E. Tribotronics—Towards active tribology. Tribol. Int. 2008, 41, 934–939. [Google Scholar]
  2. Wang, Q.H.; Zhang, N.; Qu, C.H.; Li, S.; Guo, L.H.; Yang, Z.H.; Zhang, X.R.; Wang, T.M. Photothermal effect of graphene oxide for 3D hybrid composites achieving controllable friction. Tribol. Int. 2022, 167, 107364–107372. [Google Scholar]
  3. Liu, D.Q.; Broer, D.J. Light controlled friction at a liquid crystal polymer coating with switchable patterning. Soft Matter 2014, 10, 7952–7958. [Google Scholar] [PubMed]
  4. Shao, Y.L.; Zhao, J.; Fan, Y.; Wan, Z.P.; Lu, L.S.; Zhang, Z.H.; Ming, W.H.; Ren, L.Q. Shape memory superhydrophobic surface with switchable transition between “Lotus Effect” to “Rose Petal Effect”. Chem. Eng. J. 2020, 382, 122989–122998. [Google Scholar]
  5. Bai, H.; Tian, X.L.; Zheng, Y.M.; Ju, J.; Zhao, Y. Direction controlled driving of tiny water drops on bioinspired artificial spider silks. Adv. Mater. 2010, 22, 5521–5525. [Google Scholar]
  6. Bowden, F.P.; Tabor, D.; Palmer, F. The Friction and Lubrication of Solids. Am. J. Phys. 1951, 19, 428–429. [Google Scholar]
  7. Liu, D.Q.; Liu, L.; Onck, P.R.; Broer, D.J. Reverse switching of surface roughness in a self-organized polydomain liquid crystal coating. Proc. Natl. Acad. Sci. USA 2015, 112, 3880–3885. [Google Scholar]
  8. Li, F.D.; Hou, H.H.; Yin, J.; Jiang, X.S. Near-infrared light-responsive dynamic wrinkle patterns. Sci. Adv. 2018, 4, 5762–5770. [Google Scholar]
  9. Zhang, D.J.; Cheng, Z.J.; Kang, H.J.; Yu, J.Y.; Liu, Y.Y.; Jiang, L. A Smart Superwetting Surface with Responsivity in Both Surface Chemistry and Microstructure. Angew Chem. Int. Ed. Engl. 2018, 57, 3701–3705. [Google Scholar]
  10. Li, C.Z.; Jiao, Y.L.; Zhang, Y.Y.; Jiang, S.J.; Lv, X.D.; Wu, S.Z.; Li, J.W.; Hu, Y.L.; Ye, J.X.; Liu, K.; et al. Noncontact All-In-Situ Reversible Reconfiguration of Femtosecond Laser-Induced Shape Memory Magnetic Microcones for Multifunctional Liquid Droplet Manipulation and Information Encryption. Adv. Funct. 2021, 31, 2100543–2100553. [Google Scholar]
  11. Zhang, Y.N.; Jiang, J.; Ouyang, C.K.; Meng, Y.G.; Jia, W.P.; Ma, L.R.; Tian, Y. Effect of base oil lubrication properties on magnetorheological fluids. Smart Mater. Struct. 2021, 30, 95011–95022. [Google Scholar]
  12. Wang, Y.H.; Ouyang, J.H.; Liu, Z.G.; Wang, Y.M.; Wang, Y.J. Microstructure and high temperature properties of two-step voltage-controlled MAO ceramic coatings formed on Ti2AlNb alloy. Appl. Surf. Sci. 2014, 307, 62–68. [Google Scholar]
  13. Tan, X.; Hu, C.Z.; Li, X.; Liu, H.J.; Qu, J.H. Reversible superwettability switching of a conductive polymer membrane for oil-water separation and self-cleaning. J. Membr. Sci. 2020, 605, 118088–118098. [Google Scholar]
  14. Zhang, H.Y.; Lai, H.; Cheng, Z.J.; Zhang, D.J.; Liu, P.C.; Li, Y.F.; Liu, Y.Y. In-situ switchable superhydrophobic shape memory microstructure patterns with reversible wettability and adhesion. Appl. Surf. Sci. 2020, 525, 525–535. [Google Scholar]
  15. Sun, Q.Q.; Wang, D.H.; Li, Y.N.; Zhang, J.H.; Ye, S.J.; Cui, J.X.; Chen, L.Q.; Wang, Z.K.; Butt, H.J.; Vollmer, D.; et al. Surface charge printing for programmed droplet transport. Nat. Mater. 2019, 18, 936–941. [Google Scholar]
  16. Wu, P.; Zeng, C.; Guo, J.; Liu, G.; Zhou, F.; Liu, W. Achieving near-infrared-light-mediated switchable friction regulation on MXene-based double network hydrogels. Friction 2023. [Google Scholar] [CrossRef]
  17. Hou, Y.; Weng, D.; Zhang, Z.; Yu, Y.; Chen, L.; Wang, J. Near-Infrared Light Responsive Surface with Switchable Wettability in Microstructure and Surface Chemistry. Langmuir 2023, 39, 6276–6286. [Google Scholar] [PubMed]
  18. Wang, H.; Zhang, Z.; Zheng, J.; Zhao, J.; Liang, Y.; Li, X.; Ren, L. Multifunctional superhydrophobic surface with dynamically controllable micro/nanostructures for droplet manipulation and friction control. Chem. Eng. J. 2021, 417, 127944–127952. [Google Scholar]
  19. Patric, C.; Maria, J.B.P.; Francis, P.; Bernard, R.; Elias, F. Multiple emulsion technology for the design of microspheres containing peptides and oligopeptides. Adv. Drug. Deliv. Rev. 1997, 28, 85–96. [Google Scholar]
  20. Brwon, E.N.; Kessler, M.R.; Sottos, N.R.; White, S.R. In situ poly(ureaformaldehyde) microencapsulation of dicyclopentadiene-2. J. Microencapsul. 2003, 20, 719–730. [Google Scholar] [CrossRef]
  21. Blaiszik, B.J.; Caruso, M.M.; McIlroy, D.A.; Moore, J.S.; White, S.R.; Sottos, N.R. Microcapsules filled with reactive solutions for self-healing materials. Polymer 2009, 50, 990–997. [Google Scholar] [CrossRef]
  22. Ren, Y.L.; Gao, K.; Ying, S.J.; Zhao, Y.; Zhang, L.; Guo, D.; Xie, G.X. Significant enhancement of tribological properties of microcapsule/epoxy composites in the presence of high loads by incorporating PTFE. Wear 2023, 15, 204563–204574. [Google Scholar] [CrossRef]
  23. Cheng, Z.Q.; Gong, H.J.; Wang, Z.; Zhu, L.N.; Xie, G.X. Preparation of self-lubricating porous alumina ceramics with PMMA /PAO6 microcapsules and their tribological properties. Ceram. Int. 2022, 48, 8031–8038. [Google Scholar] [CrossRef]
  24. Zhang, W.L.; Qi, X.W.; Yang, X.; Dong, Y.; Fan, B.L.; Liang, L. Fabrication of high-stability Ni-PSF@PAO40 microcapsules and their lubricating properties in polyamide 6. Friction 2022, 10, 1985–1999. [Google Scholar] [CrossRef]
  25. Hou, Y.C.; Weng, D.; Yu, Y.D.; Wang, J.D.; Chen, L. Near infrared light responsive surface with self-healing superhydrophobicity in surface chemistry and microstructure. Appl. Surf. Sci. 2022, 598, 153772–153781. [Google Scholar] [CrossRef]
  26. Ma, Y.J.; Li, Z.K.; Wang, H.Y.; Li, H.Y. Synthesis and optimization of polyurethane microcapsules containing [BMIm]PF6 ionic liquid lubricant. J. Colloid Interface Sci. 2019, 534, 469–479. [Google Scholar] [CrossRef]
  27. Xiong, W.T.; Li, X.L.; Chen, X.C.; Zhang, C.H.; Luo, J.B. Preparation and Tribological Properties of Self-Lubricating Epoxy Resins with Oil-Containing Nanocapsules. ACS Appl. Mater. Interfaces 2022, 14, 18954–18964. [Google Scholar] [CrossRef]
  28. Hao, Y.; Zhou, X.Y.; Shao, J.J.; Zhu, Y.K. The influence of multiple fillers on friction and wear behavior of epoxy composite coatings. Surf. Coat. Technol. 2019, 362, 213–219. [Google Scholar] [CrossRef]
  29. Zhang, L.; Wang, H.Y.; He, F.; Chen, H.; Xie, G.X.; Wei, B.; Luo, J.B.; He, B.; Wu, Z. Wear in-situ self-healing polymer composites incorporated with bifunctional microcapsules. Compos. B Eng. 2022, 232, 109566–109575. [Google Scholar] [CrossRef]
  30. Li, H.Y.; Ma, Y.J.; Li, Z.K.; Cui, Y.X.; Wang, H.Y. Synthesis of novel multilayer composite microcapsules and their application in self-lubricating polymer composites. Compos. Sci. Technol. 2018, 164, 120–128. [Google Scholar] [CrossRef]
  31. Li, H.Y.; Li, S.; Li, Z.K.; Zhu, Y.J.; Wang, H.Y. Polysulfone/SiO2 Hybrid Shell Microcapsules Synthesized by the Combination of Pickering Emulsification and the Solvent Evaporation Technique and Their Application in Self-Lubricating Composites. Langmuir 2017, 33, 14149–14155. [Google Scholar] [CrossRef] [PubMed]
Scheme 1. Synthesis path of PHHD.
Applsci 13 09899 sch001
Scheme 2. Schematic illustration of the preparation of PHHD@MS@EP.
Applsci 13 09899 sch002
Figure 1. Chemical characteristics of PHHD: 1H NMR of PHHD.
Applsci 13 09899 g001
Figure 2. Chemical characteristics of PHHD: (a) XPS spectrum, (b) IR spectrum, and (c) DSC of PHHD.
Applsci 13 09899 g002
Figure 3. Characterization of PHHD@MS. (a,b) SEM images, (c) TEM images, and (d) size distribution of PHHD@MS.
Applsci 13 09899 g003
Figure 4. Mechanical properties of EP composites. (a) Compressive stress of EP composites; (b) tensile stress of EP composites; and (c) surface hardness of EP composites.
Applsci 13 09899 g004
Figure 5. COFs and wear rates of EP composites. (a,b) COFs of EP composites at RT; (d,e) COFs of EP composites at 80 °C; (c) wear rates of EP composites at RT; and (f) wear rates of EP composites at 80 °C. (a,d) was taken from one of three measurements of each sample, respectively. The average COFs in (b,e) were obtained from the three COFs of each sample. And every COF was calculated after the running-in process.)
Applsci 13 09899 g005
Figure 6. SEM images of (a) EP resin; (b) PHHD@EP; (c) Shell@EP; and (d) PHHD@MS@EP.
Applsci 13 09899 g006
Figure 7. (a) COFs of PHHD@EP and PHHD@MS@EP under 1.5 N, 5 Hz, and 80 °C. (b) Optical images and XPS spectra of the two sides of PHHD@EP after test; (c) XPS spectra of F 1s at the bottom of PHHD@EP.
Applsci 13 09899 g007
Figure 8. COF of PHHD@MS@EP with different mass fractions of PHHD@MS under 1.5 N, 5 Hz, and 80 °C (a,c); COF of PHHD@MS@EP with 10 wt% PHHD@MS under different loads, 5 Hz, and 80 °C (b,d).
Applsci 13 09899 g008
Scheme 3. Illustration of the mechanism of controllable friction with the heating turned on and off.
Applsci 13 09899 sch003
Figure 9. (a) The change in the COF of PHHD@MS@EP at different temperatures; (b) DSC curve of EP; (c) variation in COF under repeated temperature rising and dropping; and (d) changes in the COF of PHHD@MS@EP after being subjected to UV irradiation.
Applsci 13 09899 g009
Disclaimer/Publisher’s Note: The statements, opinions and data contained in all publications are solely those of the individual author(s) and contributor(s) and not of MDPI and/or the editor(s). MDPI and/or the editor(s) disclaim responsibility for any injury to people or property resulting from any ideas, methods, instructions or products referred to in the content.